Effects of Extreme Dust Storm in Agricultural Areas (Poland, the Greater Lowland) - MDPI
←
→
Page content transcription
If your browser does not render page correctly, please read the page content below
geosciences
Article
Effects of Extreme Dust Storm in Agricultural Areas
(Poland, the Greater Lowland)
Marcin Hojan * , Mirosław Rurek , Mirosław Wi˛ecław and Adam Krupa
 Institute of Geography, Department of Landscape History Research, Kazimierz Wielki University,
 Kościeleckich Square 8, 85-033 Bydgoszcz, Poland; mirur@ukw.edu.pl (M.R.); wieclaw@ukw.edu.pl (M.W.);
 akrupa.geo@gmail.com (A.K.)
 * Correspondence: homar@ukw.edu.pl; Tel.: +48-52-349-462

 Received: 14 February 2019; Accepted: 24 February 2019; Published: 27 February 2019

 Abstract: The article aims to present extreme aeolian processes observed in April 2011 in the fields of
 the Szamocin municipality in Pojezierze Wielkopolskie (the Great Poland Lakeland). Aeolian erosion
 of cropland was fostered by strong wind with gusts exceeding 15 m·s−1 . The erosion was related
 to the movement of a deep barometric low from the Norwegian Sea over western Russia (Joachim
 barometric low). Geomorphological mapping of accumulated sandy aeolian covers was conducted.
 Morphometric measurements of aeolian covers were made considering their spatial distribution
 and the thickness of sediments that build them. Samples were collected from sediments to analyze
 grain size and the volume of deposited sediments was calculated. According to grain size analysis
 the accumulated fine-grained mineral material was well, moderately well and moderately sorted.
 The thickness of aeolian covers exceeded the thickness of covers presented in Polish literature so
 far. Calculations of the total volume of mineral sediment derived from small areas covered with
 aeolian erosion (a few hectares each) indicate significantly greater volumes than those provided in
 publications from other research areas in Poland. The described dust storms did not cause much
 damage in Poland. At the same time (8 April) in northern Germany, a dust storm led to a severe
 collision on the A19 highway. Eight people died in car accidents and dozens suffered serious injuries.

 Keywords: aeolian processes; accumulation; wind erosion; mineral deposits; extreme processes

1. Introduction
      Aeolian processes are of global significance and their effects can be observed in many places
throughout the world. The term ‘sandstorm’ usually stands for desert areas such as the Sahara or
places where sand is the main mineral component of soils. The term ‘dust storm’ is used when finer
fractions (dusts) are transferred over long distances; they also have a negative impact on urban areas [1].
In connection with the variety of areas susceptible to aeolian erosion, analyses of climatic factors are
conducted both on the northern and southern hemisphere [2]. Dusts blown away from Iceland are
transported over Continental Europe. The number of dust transport incidents depends on climatic
circulation, and Iceland’s geological structure and volcanic activity foster these phenomena [3,4].
The effects of dust storms have been observed in North America for many years; their indirect causes
include anthropogenic activity as well as natural factors such as droughts [5]. It was also manifested
in the relationships between dust storms and climate change [6]. Middle East countries (Tunisia, Iraq,
Turkey, Syria) often experience dust storms [7,8]. Not only are wind and mineral particles transported
away and carried by the wind during dust storms, but also microorganisms posing risk to health [7–10].
Detailed studies of dust storms are also carried out in Iran [11], and in China, where dust storms are
powered by mineral material from dry areas of Central Asia [12]. The transport of dust from the Sahara
to Western Europe and Scandinavia has also been described based on available meteorological data [13].

Geosciences 2019, 9, 106; doi:10.3390/geosciences9030106                   www.mdpi.com/journal/geosciences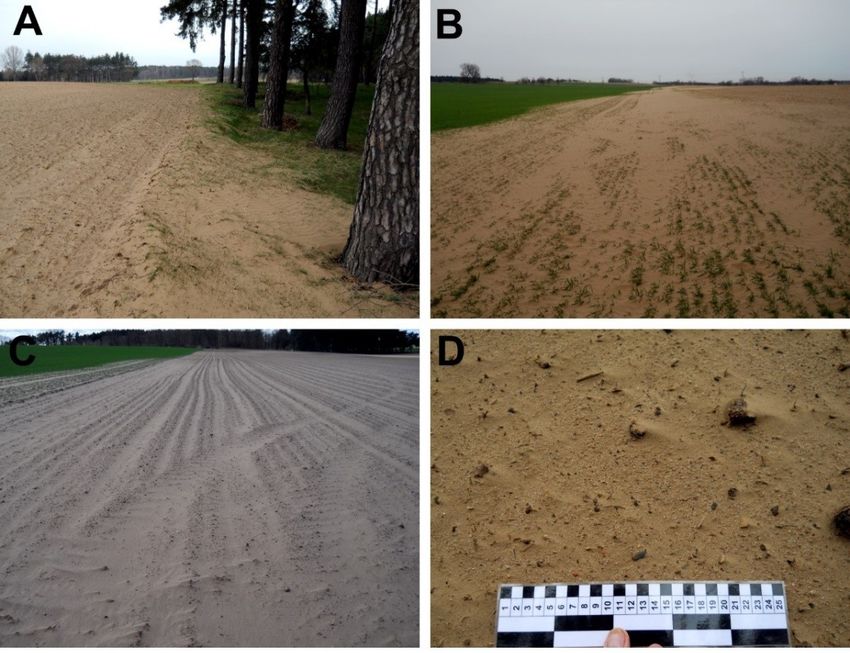
Geosciences 2019, 9, 106                                                                             2 of 21

Areas with frequent occurrences of dust storms also include Ukraine, Russia, and Kazakhstan [14].
The strongest deflation in these countries is mainly visible in steppe areas. These processes are known
as ‘black storms’ [15]. In Germany, dust storms associated with the Joachim barometric low caused a
catastrophe in land-bound traffic. There was a collision on the A19 highway and several dozen people
were injured [16,17]. So far, relatively few papers have discussed extreme aeolian processes in Central
and Eastern Europe, including Poland [15,18,19].
      Across the world, dust storms are proven to have a negative impact mainly in areas used for
agriculture. Sand and dust storms reduce crop yields, bury cuttings and cause the loss of plant
tissue [20]. Extreme aeolian processes also reduce photosynthesis, delay plant development, and bury
drainage ditches, which in turn causes a reduced supply of water and deteriorate the quality of water
in rivers and streams. Erosion of soils by wind leads to changes in texture. It reduces their fertility
and induces difficulties associated with proper fertilization. Blown over mineral and organic matter
can accumulate in the neighboring fields overgrown with winter crops, which hinders the growth of
plants or buries them completely. The result of this process is locally decreased fertility of eroded soils
and losses of crops [18].
      The impact of wind on a surface devoid of vegetation causes extraction of mineral material and
its transport at different distances. Aeolian processes and research methods have been described in the
world literature in terms of erosion of light sandy soils and blowing through mineral material [21–23]
as well as in areas used for agriculture [24]. Due to the availability of meteorological data, analyses of
the course of aeolian processes in the past have also been conducted [25,26]. What is more, researchers
use various types of traps in areas exposed to severe wind erosion [27]. Part of the work was carried
out in experimental conditions [28–30] or using portable laboratories in areas exploited by humans [31].
Research is also being conducted on the transport and accumulation of dust from agricultural areas,
which indicates the importance of tree belts between cities and fields. These tree belts capture dust
extracted from arable fields and plantations. An additional component of dust is pesticides [32].
Humidity of the top soil and its firmness [18] plays an important part in deflation.
      Aeolian processes are often observed in fields in the spring and autumn period of soil cultivation;
they are connected directly with the work of field machines during pre-sowing cultivation [33].
After ploughing and before the rise of vegetation, soil is also subject to stripping. Most commonly,
aeolian erosion of soil occurs locally and on a small scale; however, once every few years or so aeolian
processes take place on an above-average scale [18,19].
      According to the classification of agricultural land susceptible to wind erosion in Poland, the Great
Poland Lakeland (research area) is subject to a strong wind erosion hazard [34]. The largest number
of studies from Poland concern inland dunes or areas of blown sand and describe the structure and
texture as well as genesis of dunes in relation to their morphological location [35–43]. There are no
works describing extreme aeolian processes in central Poland.
      Intense aeolian processes were observed in April 2011 in Szamocin, in the Great Poland Lakeland.
They were associated with a four-day period of strong and gusty winds. This research aimed to:
—      determine spatial distribution, thickness, and volume of accumulated aeolian sediments in
       agricultural fields;
—      determine the extent of transport of blown mineral deposit;
—      present geomorphological characteristics of aeolian accumulative forms.
    The indicated objectives aim to present the results of extreme aeolian processes in Poland that
have not been described by other researchers. Field research was carried out after the processes ceased.

2. Materials and Methods

2.1. Laboratory Methods
     The weight of each collected sample was 0.2 kg. The collected samples were dried at a temperature
of 105 ◦ C for 6 h. This was followed by grain size analysis using a Retsch AS200 shaker with sieves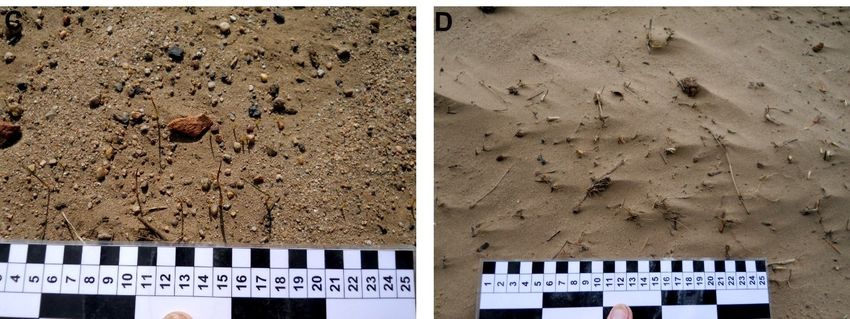
Geosciences 2019, 9, 106                                                                                                    3 of 21
     Geosciences 2019, 8, x FOR PEER REVIEW                                                                       3 of 22

of the 0.25Thephi   interval.
                 weight         Aftercollected
                           of each      sieving,sample
                                                  the sediment
                                                           was 0.2located
                                                                     kg. Theon    the sieves
                                                                                collected      was weighed.
                                                                                            samples   were driedThe   at indices
                                                                                                                          a
     temperature
of [44]              of 105 °C
         were calculated         for 6 Gradistat
                               using   h. This wasBeta
                                                    followed
                                                         5.11. by grain size analysis using a Retsch AS200 shaker
     with   sieves
      In order    toofdetermine
                        the 0.25 phi
                                   theinterval. Afterdensity
                                        volumetric     sieving,of
                                                                the  sedimentthe
                                                                   sediment,     located  on the
                                                                                     material     sieves was weighed.
                                                                                                accumulated      in the aeolian
     The  indices   of  [44] were  calculated  using  Gradistat  Beta  5.11.
covers was taken. It was poured into scaled flasks with volumes of 50, 100 and 500 cm3 and weighed.
           In order to determine the volumetric density of sediment, the material accumulated in the
Measurement was taken three times and results were averaged. This allowed to determine 3that 1 cm3
     aeolian covers was taken. It was poured into scaled flasks with volumes of 50, 100 and 500 cm and
of accumulated mineral material weighed 0.00149 kg. A 1 cm thick aeolian cover with a surface of
     weighed. Measurement was taken three times and results were averaged. This allowed to determine
1 m2that
      weighed
          1 cm3 of 14.90   kg.
                      accumulated     mineral material weighed 0.00149 kg. A 1 cm thick aeolian cover with a
      The study
     surface   of 1 mused    meteorological
                       2 weighed   14.90 kg. data for the Piła station (53.13 N, 16.75 E, 72 m above sea level).
This station
           The is  located
                study    usedapproximately      30 km
                               meteorological data    forfrom  thestation
                                                          the Piła  research    siteN,and
                                                                            (53.13         belongs
                                                                                       16.75  E, 72 mtoabove
                                                                                                        the station    network
                                                                                                               sea level).
of the  Institute
     This  station of    Meteorology
                    is located           and Water
                                approximately    30 kmManagement—National
                                                         from the research site andResearch
                                                                                       belongs toInstitute   (IMWM)
                                                                                                   the station  network(https:
     of the Institute of Meteorology
//danepubliczne.imgw.pl)           [45]. An and    Water
                                              analysis   of Management—National
                                                            the synoptic situation was   Research    Institute
                                                                                             also carried   out(IMWM)
                                                                                                                  in the period
     (https://danepubliczne.imgw.pl)        [45]. An   analysis
of increased activity of aeolian processes in the research site. of the  synoptic   situation  was  also  carried  out in
     the period of increased activity of aeolian processes in the research site.
2.2. Field Work
     2.2. Field Work
      Four areas in the vicinity of Szamocin were chosen for detailed research: Szamocin, Szamoty
          Four areas in the vicinity of Szamocin were chosen for detailed research: Szamocin, Szamoty 1,
1, Szamoty 2, and Swoboda, (Figure 1). These areas contained agricultural fields, which had been
     Szamoty 2, and Swoboda, (Figure 1). These areas contained agricultural fields, which had been
ploughed    at the
     ploughed        end
                at the  endofofMarch
                                March2011.
                                        2011. Strong  andgusty
                                              Strong and    gustywind
                                                                   wind   caused
                                                                       caused      erosion
                                                                               erosion        of fields’
                                                                                         of the   the fields’  surface.
                                                                                                         surface.
Sandy   aeolian  covers   formed   on the  surface of the fields, in the winter  crops   and  in  the
     Sandy aeolian covers formed on the surface of the fields, in the winter crops and in the forest  forest (adjacent
to the Szamocin
     (adjacent      field).
               to the       Measurements
                       Szamocin               were made
                                 field). Measurements      after
                                                        were     theafter
                                                              made   end the
                                                                          of the
                                                                             enddust
                                                                                  of thestorm.
                                                                                          dust storm.

               Figure
            Figure    1. Research
                   1. Research    arealocation
                                area   location against
                                                against the
                                                         thebackground
                                                             backgroundof of
                                                                          thethe
                                                                              map of Poland
                                                                                 map        and Europe.
                                                                                      of Poland and Europe.

    The reach of respective aeolian covers was marked using GPS RTK (Real Time Kinematics).
Aeolian shadows formed at the surface of aeolian covers behind the obstacles. Aeolian shadows were
measured with measuring tape to define the length, width and height of the shadows. The sand drift
Geosciences 2019, 9, 106                                                                                     4 of 21

measured at the Swoboda field was measured in the same manner. Measurement tape was also used to
measure the distance and height of the ripple marks that formed on the surface of the aeolian covers.
     A hand drill was used to identify the volume of accumulated aeolian sediments. In each aeolian
cover in the research area, 10 wells were made in a grid of squares with a side of 2 × 2 m. The distance
between the drilling points was 1 m; a total of 9 wells were drilled. The tenth borehole was made at a
distance of 5 m from the grid of squares. The obtained results concerning the volume of sandy aeolian
covers were averaged.
     During the measurements, sand samples were collected to analyze grain size. The samples were
taken from sandy aeolian covers, aeolian shadows, drifts at the Svoboda field and the eroded surface
of the field. A sample of the aeolian cover from the forest by the Szamocin field was not collected
due to the small volume of the cover. A small spatula with a width of 0.1 m was used for sampling.
Samples were taken from the surface layer of about 0.02–0.03 m. In total, 45 samples of sediments
were collected from mineral storage sites (Szamocin 24 samples; Szamoty 1, 9 samples; Szamoty 2,
2 samples; Swoboda 10 samples).

2.3. Meteorological Background
     From 7 to 10 April 2011, there was an increase in wind speed in the research area. The average
wind speed at the meteorological station in Piła reached 9 m·s−1 , and gusts reached up to 18 m·s−1 .
For 7–10 April in the years 1978–2017, the average wind speed was 2.8–2.9 m·s−1 . Due to the location
of the station in Piła as well as the direction of wind, it can be assumed that wind speeds in the
open area around Szamocin were higher. High wind speeds in the discussed days were conditioned
by movement of a barometric low from the Norwegian Sea to the south-east and an increase in the
horizontal pressure gradient over Poland.
     At the beginning of this four-day period, a large share of west-south-west and western wind
was noted. On 8 April, there was a clear dominance of west-north-west wind with a significant
share of north-west wind. The next day was marked by a high frequency of north-north-west wind.
On 10 April, north-north-west wind dominated, with a large share of wind blowing from the north. In
the discussed period, the wind direction changed from west-south-west to north (Figure 2, Table 1).
      Geosciences 2019, 8, x FOR PEER REVIEW                                                           5 of 22

           Figure
      Figure      2. Wind
              2. Wind      direction
                        direction  in indays
                                         dayswith
                                              withextreme
                                                   extreme aeolian
                                                           aeolianprocesses
                                                                   processesand in in
                                                                              and  thethe
                                                                                       long-term period
                                                                                          long-term     of of
                                                                                                     period
           1978–2017 for IMWM   Piła station.
      1978–2017 for IMWM Piła station.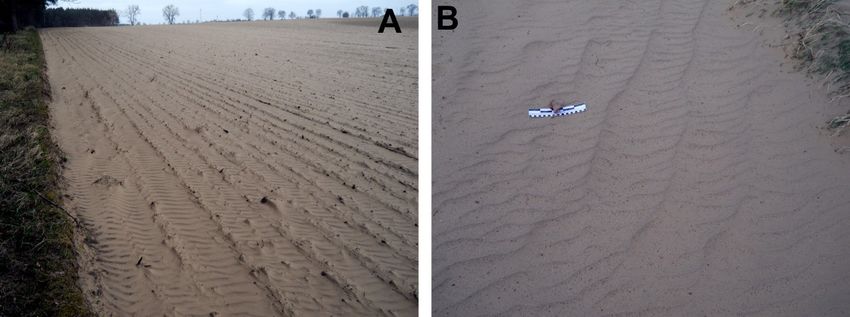
Geosciences 2019, 9, 106                                                                                                                                                                5 of 21

                                Table 1. Meteorological data for days with a dust storm for IMWM Piła station. For precipitation, data is available every 6 h.

                       Temperature [◦ C]               Humidity [%]        Wind Speed [m·s−1 ]       Wind Gust [m·s−1 ]            Wind Direction [◦ ]         Precipitation [mm]
                                                                                             Days of April
      Hours        7        8        9     10      7      8    9      10   7    8     9      10     7        8    9     10     7        8      9     10    7        8     9     10
          0       12.2     7.6     7.5     3      96     67   71      72   3    6     6      1      -     12     11      -    249      294    292    280   0.1      -     -         -
          1       12.7     7.3     7.2    2.7     95     70   70      75   4    6     5      2      9     12      -      -    258      293    299    280    -       -     -         -
          2        13      7.1     6.9    2.3     94     72   69      77   3    6     5      2      -     11      -      -    257      305    299    290    -       -     -         -
          3       13.2       7     6.2    1.4     93     72   71      84   3    7     5      2      -     14      -      -    255      306    293    300    -       -     -         -
          4       13.2     6.9     5.6    0.9     93     74   74      86   3    5     4      2      -      0      -      -    241      302    293    290    -       -     -         -
          5       13.4     6.9     5.7    2.6     92     75   73      78   4    5     5      2      -     12      -      -    246      299    289    290    -       -     -         -
          6       12.9     6.9     6.7    5.1     94     74   69      68   4    6     5      3      -     12      -      -    226      300    311    325    -       -     -         -
          7       13.9     6.9     7.7    6.6     91     75   61      62   4    5     6      5      -      -      -      -    235      290    328    336    -       -     -         -
          8       15.6       7      9     8.5     82     76   52      56   5    5     5      5     10      -     10      -    255      290    341    328    -       -     -         -
          9       17.6     7.4     9.6    10.3    74     79   45      49   6    5     5      6     11      -     10     12    260      280    344    333    -       -     -         -
         10       19.8     7.3     10.5   12.1    51     85   41      46   6    5     7      6      -      -     13     11    277      270    336    329    -       -     -         -
         11       19.2     8.1     10.8   13.5    45     78   38      44   9    5     7      6     15      -     12     11    280      270    330    332    -       -     -         -
         12       14.6     9.1     10.8   13.5    73     69   39      43   7    6     6      8     12     12     11     13    288      260    343    328   0.3      -     -         -
         13       13.3     11.4    10.6   13.4    77     63   38      40   8    8     7      6     15     16      -     12    288      273    338    327    -       -     -         -
         14       12.2      12     11.5   12.9    83     64   36      33   7    6     4      5     12     13      9      -    289      270    342    360    -       -     -         -
         15       11.4     12.7    10.9   11.8    70     63   36      35   5    7     6      5     11     14      -     10    304      290    332    353    -       -     -         -
         16       11.1     11.9    9.8    11.4    60     64   39      43   5    9     6      4      -     18      -      -    301      290    330      8    -       -     -         -
         17       10.5     10.6    9.6    10.8    60     60   41      51   6    9     5      3     13     15      -      -    297      300    333    349    -       -     -         -
         18       9.8      10.2    7.4    9.6     53     65   50      56   7    8     2      2     13     16      -      -    298      299    290     10   0.2      -     -         -
         19       9.4       10     5.2    8.1     57     66   61      60   7    8     2      1     14     16      -      -    296      295    270     10    -       -     -         -
         20       9.1      9.3     4.8    6.1     59     69   63      68   7    6     2      2     12     13      -      -    294      296    270    329    -       -     -         -
         21       8.7      8.7     3.9     5      60     70   67      73   7    7     2      1     12     12      -      -    296      306    270    306    -       -     -         -
         22       8.3      8.5     3.7    4.8     63     68   66      76   7    7     2      1     12     15      -      -    294      299    270    306    -       -     -         -
         23       7.9        8     3.7    5.1     65     70   67      74   7    5     2      1     13     10      -      -    292      300    280    246    -       -     -         -
Geosciences 2019, 9,
Geosciences 2019, 8, 106
x FOR PEER REVIEW 61 of 21
22
The course of aeolian processes is affected not only by the speed and by direction of wind, but
also byThethe
course of aeolian
substrate processes
moisture is affected
content not only
conditioned by by the speed and
precipitation by direction
levels of wind, but also
and air temperature. The
by the substrate moisture content conditioned by precipitation levels and air
first ten days of April 2011 were relatively dry and warm. Daily sums of atmospheric precipitation temperature. The first
ten
were days of April
small; 2011 were
the largest falls relatively
of 2–3 mm dry and warm.
occurred on 3Daily
and 4sums
Aprilof(Figure
atmospheric precipitation
3), a few days before were
the
small; the largest falls of 2–3 mm occurred on 3 and 4 April (Figure 3), a few
period of strong winds. Total precipitation for the first 10 days of April was 6.8 mm and was lower days before the period
of strong
than winds. Totalstandard
the long-period precipitation
(10.8for
mm).the Also,
first 10
indays
March of April wasnatural
the total 6.8 mmprecipitation
and was lower thanmm
of 20.5 the
long-period
was lower than standard (10.8 mm). average
the long-period Also, in March
sum ofthe total natural
precipitation precipitation
from 38.2 mm. of The20.5 mm was
average lower
daily air
than the long-period average sum of precipitation from 38.2 mm. The average
temperature in the first 10 days of April 2011 exceeded 10 °C and was higher than the long-period daily air temperature in
the first 10 ◦ ◦
average (6.4days
°C) of
fromApril 2011 exceeded
1978–2017. 10 C and was
It was particularly warmhigher
fromthan
1 tothe long-period
3 April (10.7–13.8average (6.4onC)
°C), and 6
from 1978–2017. It was particularly warm from 1 to 3 April (10.7–13.8 ◦ C), and on 6 and 7 April (11 and
and 7 April (11 and 12.6 °C). During this period, the weather in Poland was shaped by advances of
12.6 ◦
warmC). During
polar thisIt period,
sea air. the weather
significantly in Poland
cooled after was
8 April, shaped
when by advances
the baric situationofconditioned
warm polarthe seaflow
air.
It
ofsignificantly
cold Arctic air cooled
from after 8 April,
the north when the
to Poland. baric
There wassituation conditioned
a simultaneous dropthe flow
in air of cold Arctic
humidity. From the air
from the north to Poland. There was a simultaneous drop in air humidity.
above review it follows that meteorological conditions favored the occurrence of intense aeolian From the above review it
follows
processes.that meteorological conditions favored the occurrence of intense aeolian processes.
Figure 3.
Figure 3. Meteorological
Meteorological conditions
conditions in days with
in days with extreme
extreme aeolian
aeolian processes
processes and
and over
over aa long
long period
period
(1978–2017) for
(1978–2017) for IMWM
IMWM Piła
Piła station.
station.
Geosciences 2019, 9, 106                                                                                                             7 of 21

2.4. Geographical Settings
      The research area comprised the northern part of the Wielkopolskie voivodeship, in the
municipality of Szamocin (Figure 1). As far as the contemporary terrain and geological structure is
concerned, the most important changes of land took place in the Pleistocene under the influence of the
subsequent glacial. The ice sheet left behind a series of moraine clays masking the older, pre-quaternary
structure. The fluvial activity of the Noteć River in the Pleistocene and Holocene led to the emergence
of a flood terrace system. These levels were identified in detail and described by [46]. Alluvial terraces
were divided into: upper IV (72–77 m above sea level), middle III (60–70 m above sea level), lower II
(55–60 m above sea level) and flooding I (50–55 m lower) [46]. Numerous field observations indicate
that they belong to erosion terraces, which are mainly composed of sand-gravel sediments of varying
thickness [46].
      Inland dunes were formed in this area in the past. These are parabolic dunes, dunes of irregular
shapes, as well as dune banks which are part of the landscape. Dunes occur in clusters (of a dozen or
so) and as individual forms. They are made of sands with a thickness equal to or below 10 m.

3. Results
     The effects of the dust storm that took place in April 2011 on the researched areas caused the
formation of various accumulative and erosive forms. Accumulative and erosive forms were analyzed
in such a way so as to present them morphological characteristic and characteristics structural of
mineral sediments. The results obtained during field tests (e.g., measurements of form surfaces) and
laboratory tests (e.g., calculations of sediment volume, grain size analysis) indicate that a dust storm
caused the blowing of a large quantity of sand on small deflative areas. The results obtained concerning
the volume of material in accumulative forms after one event are higher than those described so far in
the Polish literature.

3.1. Morphological Effects
     Extreme aeolian processes occurred in fields of various sizes (Table 2). All fields where aeolian
processes took place were under preparation for spring sowing. They were ploughed to a depth
of 0.1–0.15 m, which facilitated soil stripping. Accumulation of mineral material occurred in areas
without vegetation, on arable fields with winter crops and in the forest.

        Table 2. Morphometric and volumetric characteristics of accumulative forms in the research area.

                                                     Average      Min          Max       Amount of     Total Amount       Weight of
                        Length    Width   Surface
   Place of Sampling                                Thickness   Thickness    Thickness   Material in   of Material in    Material in
                         [m]       [m]     [m2 ]
                                                       [m]         [m]          [m]      Form [m3 ]       Form [t]      Form [t/km−2 ]
                                                      Szamocin Field (area 8.5 ha)
        tongue             30      17      510        0.025       0.02          0.03        12.75           19.0             372.5
           rut             50      1.2     60         0.085       0.07          0.1          5.1            7.60            1266.5
    hump between
                           50      0.6      30        0.04         0.02         0.06         1.2            1.8             596.0
          ruts
    winter crop strip      50       3      150        0.025        0.02         0.03         3.7            5.6             372.5
                                                      Szamoty 1 Field (area 2.4 ha)
      aeolian cover        100      2      200        0.04        0.02           0.06        8              11.9            596.0
                                                      Szamoty 2 Field (area 3.6 ha)
      aeolian cover        480      8      3840       0.06        0.04           0.08       230.4          343.3            894.0
                                                      Swoboda Field (area 6.6 ha)
        drift 1            0.75    0.5     0.375      0.19       0.14          0.24         0.07             0.1            2831.0
        drift 2            62.5     5      312.5      0.05       0.04          0.06         15.6            23,9            745,0
     cover in ditch        125      2       250        0.1       0.07          0.13         25.0            37,2            1490,0
                                                                 Average                    35.5           50.04            1018.0
                                                       Actual accumulation (sum of
                                                                                           336.12          450.4            9164.0
                                                        sediments from all forms)

     Aeolian transport observed on the research fields was dependent on wind speed. Wind speeds
of up to 8 m·s−1 caused surface creep of material and saltation. Field observations indicate that this
Geosciences 2019, 8, x FOR PEER REVIEW                                                                            3 of 22
Geosciences 2019, 9, 106                                                                                          8 of 21
      Aeolian transport observed on the research fields was dependent on wind speed. Wind speeds
of up to 8 m∙s-1 caused surface creep of material and saltation. Field observations indicate that this
wind
wind speed
       speed caused
              caused transport
                       transport ofof sediment
                                       sediment toto aa height
                                                        height of
                                                                of 0.5
                                                                   0.5 mm (in
                                                                           (in the
                                                                               the Szamoty
                                                                                   Szamoty 11 and
                                                                                                and Szamoty
                                                                                                     Szamoty 22 fields).
                                                                                                                  fields).
At  higher  wind  speeds,  the  finest  particles were   transported    in suspension.
At higher wind speeds, the finest particles were transported in suspension. In Szamoty    In Szamoty   1 and Swoboda
                                                                                                                  1 and
fields, the height  of a dust  cloud    reached   5–8  m  with  dust   carried  a distance   of 50–500
Swoboda fields, the height of a dust cloud reached 5–8 m with dust carried a distance of 50–500 m.      m.   The largest
dust  clouds dust
The largest   wereclouds
                    createdwere
                             in thecreated
                                     Szamocin    field
                                             in the     during gusts
                                                    Szamocin            exceeding
                                                                 field during           m·s−1 . Dust
                                                                                    15 exceeding
                                                                                 gusts             15was
                                                                                                       m∙s-1transported
                                                                                                             . Dust was
even   above  the crowns    of trees  growing    in the  forest adjoining     the field  (Figure
transported even above the crowns of trees growing in the forest adjoining the field (Figure     4). Transport    height
                                                                                                                      4).
was  15–20  m,  with the  range   of transport   estimated   at 2–5  km.   Therefore,   the volume
Transport height was 15–20 m, with the range of transport estimated at 2–5 km. Therefore, the        of dust   produced
was  not of
volume    determined.
             dust produced was not determined.

      Figure 4.
      Figure  4. Examples
                 Examples of
                           ofaeolian
                              aeoliantransport
                                      transportininthe
                                                     theresearch
                                                          research  areas:
                                                                 areas:    A–D—SzamocinField,
                                                                        (A–D)—Szamocin  Field,(E)—Szamoty
                                                                                               E—Szamoty 22
      Field, F—Swoboda    Field (photos  taken on   9 April  2011).
      Field, (F)—Swoboda Field (photos taken on 9 April 2011).

     Traces of aeolian
                  aeolian corrasion were observed on the surface of Szamocin and Swoboda fields
(Figure 5A). Small grooves on the surface of the field indicated the erosive
                                                                          erosive direction
                                                                                   direction of
                                                                                             of the
                                                                                                the wind.
                                                                                                    wind.
        of aeolian
Traces of   aeolian erosion
                    erosion were found on ridges subsequent to ploughing, on their windward
                                                                                          windward side.
                                                                                                     side.
On the other hand, there was a sand accumulation zone on the downwind side (Figure 5B). In many
                   demonstrated deflation
places, all fields demonstrated   deflation surfaces
                                            surfaces with
                                                     with aeolian
                                                          aeolian paving
                                                                  paving (Figure
                                                                          (Figures5C,D).
                                                                                   5C,D).
Geosciences 2019, 9, 106 9 of 21
Geosciences 2019, 8, x FOR PEER REVIEW 4 of 22
Figure5.5. Aeolian
Figure Aeolian erosive
erosive and
and accumulative
accumulative forms
forms in
inthe
theresearch
researchfields. A, B—traces of
fields.(A,B)—traces of aeolian
aeolian
corrasion; C, D—deflation surface
corrasion;(C,D)—deflation surface with
with aeolian
aeolian paving;
paving; (photos
(photos taken
taken on
on 99 April
April 2011).
2011).
Mineral material extracted
Mineral extracted fromfromfields
fieldsaccumulated
accumulatedmainly mainly in in
thethe
form of aeolian
form covers.
of aeolian The
covers.
largest
The cover
largest waswas
cover deposited
depositedin a in
winter cropcrop
a winter nearnearthe Szamoty
the Szamoty 2 field withwith
2 field a surface of nearly
a surface 4000
of nearly
4000 m2 and
m2 and thickness
thicknessof upof to
up0.08 m (Figure
to 0.08 m (Figure6C,6C,Szamoty
Szamoty 2).2).The
Thecover
coverwaswascreated
createdon on a mid-field
mid-field road
road
bythe
by theSzamocin
Szamocin field.
field. It had
It had a smaller
a smaller surface (90 m2 ),(90
surface andmits
2), thickness
and its thickness
ranged from ranged
0.025 from 0.025 m
m (Szamocin)
(Szamocin)
to 0.19 m (drift to 0.19 m (drift 1,
1, Swoboda). TheSwoboda).
cover withThe thecover with
smallest the smallest
surface was createdsurface wasSzamocin
in the created in the
field,
Szamocin
whereas thefield, whereas
thickest coverthewas thickest
locatedcover
by the was locatedfield
Swoboda by the−0.1
Swoboda
m (cover field −0.1 m(Table
in ditch) (cover2).inThis
ditch)is
(Table
due to a2). This lowering
ground is due tobehind
a ground lowering
the edge of thebehind the edge
field, which of thethe
promoted field, which promoted
accumulation the
of material.
accumulation
Aeolian coversof material.
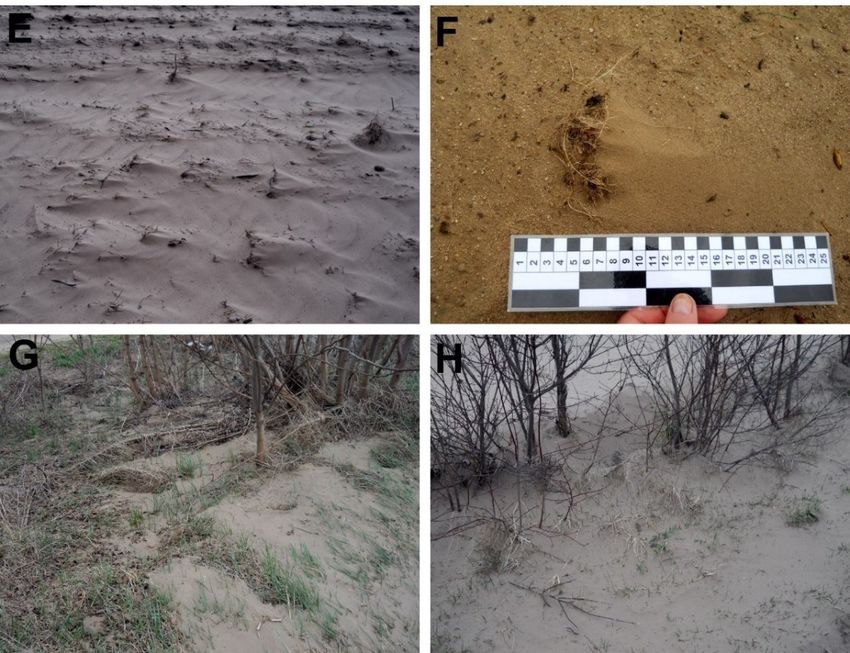
were created among accumulative forms (Figure 7A–C) and smaller ones such
Aeolian
as shadows covers7D,E),
(Figure were created among (Figure
microshadows accumulative7F), andforms (Figures
aeolian tongues7A–C) and 7G,H).
(Figure smallerThey
oneswere
such
as shadows
observed in all(Figures
fields. 7D,E), microshadows
These forms (Figure
were erected 7F), clumps
behind and aeolian tongues
of plants (Figures
remaining 7G,H). They
subsequent to
were observed
ploughed fields.inShadows
all fields.were
These formsmwere
0.2–0.5 longerected behindmclumps
and 0.05–0.2 of plantsheight
wide. Shadow remaining
was upsubsequent
to 0.1 m.
to ploughed
Aeolian fields. Shadows
microshadows were 0.2–0.5
were formed behindm long
the and 0.05–0.2
aeolian paving, andm wide.
their Shadow
length did height was up
not exceed to 0.1
0.02 m.
m. Aeolian microshadows were formed behind the aeolian paving, and their length did not exceed
0.02 m.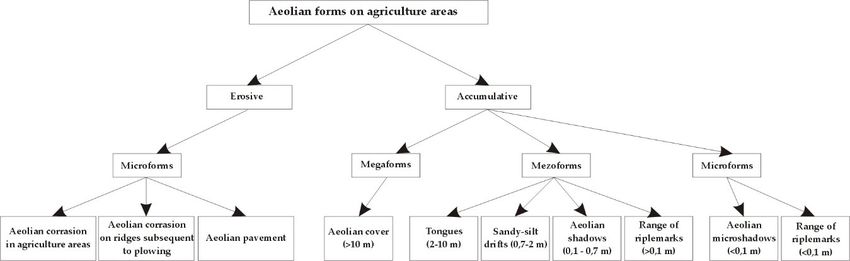
Geosciences2019,
Geosciences  2019,9,8,106
                       x FOR PEER REVIEW                                                            10 5ofof2122

     Figure 6. Covers and accumulative forms in respective research areas: (A)—Szamocin, (B)—Szamoty 1,
      Figure 6. Covers and accumulative forms in respective research areas: A—Szamocin, B—Szamoty 1,
     (C)—Szamoty 2, (D)—Swoboda. Ranges of covers and accumulative forms were determined based on
      C—Szamoty 2, D—Swoboda. Ranges of covers and accumulative forms were determined based on
     GPS RTK (Real Time Kinematics) measurements.
      GPS RTK (Real Time Kinematics) measurements.
     There were ripple marks on the surface of all aeolian covers (Figure 8A,B) with a stretch of up to
0.25 m. The Swoboda field had smaller ripple marks with a stretch of about 0.03–0.05 m. Their ridges
were situated at a 90◦ angle in relation to the ridge of larger ripple marks (Figure 8B). On the one
hand, this indicates a drop in wind speed (Figures 2 and 3), and on the other hand, a change in wind
direction from the western to the northern sector (Figure 2).
Geosciences 2019, 9, 106 11 of 21
Geosciences 2019, 8, x FOR PEER REVIEW 6 of 22
Figure 7. Aeolian accumulative forms in the research fields. A–C—aeolian covers; D,E—aeolian
Figure 7. Aeolian accumulative forms in the research fields. (A–C)—aeolian covers; (D,E)—aeolian
shadows; F—aeolian microshadows; G,H—accumulation near shrubs; (photos taken on 9 April,
shadows; (F)—aeolian microshadows; (G,H)—accumulation near shrubs; (photos taken on
2011).
9 April, 2011).
There were ripple marks on the surface of all aeolian covers (Figures 8A,B) with a stretch of up
to 0.25 m. The Swoboda field had smaller ripple marks with a stretch of about 0.03–0.05 m. TheirGeosciences
Geosciences 2019,
2019, 8,
8, xx FOR
FOR PEER
PEER REVIEW
REVIEW 77 of
of 22
22
ridges
ridges were
were situated
situated at
at aa 90°
90° angle
angle in
in relation
relation to
to the
the ridge
ridge of
of larger
larger ripple
ripple marks
marks (Figure
(Figure 8B).
8B). On
On the
the
one
one hand,
Geosciences
hand, this
this9,indicates
2019, 106
indicates aa drop
drop in
in wind
wind speed
speed (Figures
(Figures 2,3),
2,3), and
and on
on the
the other
other hand,
hand, aa change
change in
in12wind
of 21
wind
direction
direction from
from the
the western
western to
to the
the northern
northern sector
sector (Figure
(Figure 2).
2).
Figure
Figure 8.
8. Aeolian
Figure 8. accumulative
Aeolian accumulative forms
accumulativeforms in
formsin the
inthe research
theresearch fields.
researchfields. A,B—aeolian
A,B—aeolian ripple
fields.(A,B)—aeolian ripple marks
ripple marks (photos
marks (photos taken
taken
on 9 April 2011).
on 9 April 2011).
On
On the the eastern
eastern side
side of
of the
the Swoboda
the Swoboda fieldfield there
there was
there was aaa roadside
was roadside trench
roadside trench covered
trench covered with
covered with grass.
with grass. In
grass. In aa
ditch,
ditch, at the south-eastern corner of the field, there was a sandy-silt drift formed with a thickness of
at the south-eastern corner of the field, there was a sandy-silt drift formed with a thickness of
0.19
0.19 m.
m. ItIt had clear, 0.5-long
had aa clear, 0.5-long ridge
ridge and
and aa scree
scree slope
slope with
with aa length
length of
of 0.75
0.75 m (Figure 9A).
m (Figure 9A). InIn addition
addition
to
to accumulative
accumulative forms forms created
created in in the
the open
open space,
space, anan aeolian
aeolian cover
cover deposited
deposited in in aa pine
pine forest
forest adjacent
adjacent
to
to the Szamocin field was also observed. The thickness of this cover was the largest at the edge
the Szamocin field
field was also observed. The thickness of this cover was the largest at the edge of
of the
the
forest
forest and ranged between 0.03–0.04 m (Figure 7A). Along with the increasing distance fromedge
and
and ranged
ranged between
between 0.03–0.04
0.03–0.04 m m(Figure
(Figure7A). Along
7A). Alongwith the
with increasing
the distance
increasing from
distance the
from the
the
of theof
edge
edge forest,
of the the thickness
the forest,
forest, the of the aeolian
the thickness
thickness of
of the cover gradually
the aeolian
aeolian cover decreased.
cover gradually
gradually The range
decreased.
decreased. Theofrange
The transport
range of of mineral
of transport
transport of
of
material
mineral in the
materialforest
in reached
the forest 200–230
reached m (Figure
200–230 m 6A, Szamocin).
(Figure
mineral material in the forest reached 200–230 m (Figure 6A, Szamocin). 6A, Szamocin).
Figure
Figure 9.
Figure 9. Aeolian
9.Aeolian accumulative
Aeolianaccumulative forms
formsinin
accumulativeforms the
inthe
the research
research
research fields.
fields.
fields. A—drift; B—accumulation
B—accumulation near
A—drift;(B)—accumulation
(A)—drift; trees
near trees
trees
(reduced); C—increased
(reduced); (C)—increased
(reduced); accumulation
C—increased accumulation near
accumulationnear shrubs
nearshrubs (photos
shrubs(photos taken
(photostaken on
takenon 9 April,
on99April, 2011).
April,2011).
2011).
The accumulation of thicker sediments (drifts, aeolian tongues) was influenced by terrain and
vegetation. Fields were gently sloping and flat. Aeolian covers had a small thickness on larger areas,Geosciences 2019, 8, x FOR PEER REVIEW 8 of 22
The 2019,
Geosciences accumulation
9, 106 of thicker sediments (drifts, aeolian tongues) was influenced by terrain and
13 of 21
vegetation. Fields were gently sloping and flat. Aeolian covers had a small thickness on larger areas,
but areas of land depression had forms of greater thickness. The transported material was blown
but areasdepressions
through of land depression had
to ditches and forms
fieldofroads
greater thickness.
(Figure The transported
6D, Swoboda). material
At the edges was blown
of fields there
through depressions to ditches and field roads (Figure 6D, Swoboda). At
was also vegetation in the form of individual trees and clusters of bushes (Figures 9B,C).the edges of fields thereTrees
was
also
causedvegetation
a changeininthetheform of individual
direction of windtrees
and and clusters
reduced of bushes (Figure
accumulation (Figure 9B,C). Trees caused
9C), whereas shrubs a
change in the direction of wind and reduced accumulation (Figure 9C),
decreased wind speed, resulting in the accumulation of thicker deposits (Figures 7G,H). whereas shrubs decreased
windGeomorphological
speed, resulting in the accumulation
mapping of forms of thicker
locateddeposits
on the (Figure
analyzed 7G,H).
fields made it possible to
Geomorphological mapping of forms located on the analyzed
distinguish two groups of aeolian forms on areas used for agricultural purposes. fields made it possible
These to distinguish
are erosive
two
and accumulative forms (Figure 10). Field studies allowed recognizing a greater erosive
groups of aeolian forms on areas used for agricultural purposes. These are numberand of
accumulative forms (Figure 10). Field studies allowed recognizing a greater
accumulative forms than erosive. Accumulative forms occurred in various areas, such as in open number of accumulative
forms
spaces,than erosive.
on the road,Accumulative
in a ditch and forms occurred
behind in various
obstacles. Basedareas, suchsize,
on their as inaccumulative
open spaces, formson the were
road,
in a ditch and behind obstacles. Based on their size, accumulative forms
divided into: megaforms, mesoforms and microforms. On the other hand, erosive forms werewere divided into: megaforms,
mesoforms and microforms.
connected with the remains Onaftertheblowing,
other hand, erosive
causing theforms were of
formation connected
sharp ridgeswith the remains after
on furrows after
blowing, causing the formation of sharp ridges on furrows after ploughing.
ploughing. Due to their dimensions, erosive forms were included in microforms. They are Due to their dimensions,
erosive
ephemeralformsforms;
were included in microforms.
after subsequent They are ephemeral
agrotechnical treatments,forms; after
they aresubsequent
destroyed agrotechnical
and most
treatments,
commonly do not stand a chance of being inscribed into the sediment’s profile. Anotherinto
they are destroyed and most commonly do not stand a chance of being inscribed the
factor
sediment’s profile. Another factor destructive
destructive to microforms is the developing vegetation. to microforms is the developing vegetation.
Figure 10. Diagram
Figure 10. Diagram of
of aeolian
aeolian forms
forms formed on croplands.
formed on croplands.
3.2. Sedimentological Features
3.2. Sedimentological Features
The analysis
The analysis of of grain
grain size
size in in samples
samples collected
collected shows
shows that
that the
the sediments
sediments of of aeolian
aeolian covers
covers in in the
the
Szamocin, Szamoty 1 and Swoboda fields consisted of fine-grained sand. In the nearby winter crops
and
and ruts,
ruts, itit was moderately well
was moderately well sorted,
sorted, while
while in
in aeolian
aeolian shadows
shadows behind
behind obstacles
obstacles it it was
was well
well sorted
sorted
(Table
(Table 3).3). Very fine,
fine, well-sorted
well-sorted sand was found found in the the aeolian
aeolian cover
cover in in the
the Szamocin
Szamocin field.field. In the
case of the Swoboda field, the accumulated accumulated mineral material was well and moderately well sorted
(Table 3). Thicker fractions (deflation
(Table 3). Thicker fractions (deflation paving) were
paving) found
were in sediments
found in sediments taken fromfrom
taken the dispersed field
the dispersed
of Szamocin
field of Szamocinand Szamoty 2. They2.were
and Szamoty They made
were of made
medium-grain sand, poorly
of medium-grain sand,sorted
poorlywithsorted
individual
with
thicker grains. Such values indicate higher wind speeds and a shorter
individual thicker grains. Such values indicate higher wind speeds and a shorter transport route. transport route. The average
grain diametergrain
The average (D50) diameter
and sorting(D50)(Mz) were summarized
and sorting (Mz)(Figure
were 11). Samples presented
summarized (Figure 11).on the graph
Samples
show
presentedcertainon discrepancies,
the graph showbut focusdiscrepancies,
certain in three groups. butThe
focusfirst
in (33
threesamples)
groups.fits Theinfirst
the interval D50
(33 samples)
from 2.0 to 3.2, and M from
fits in the interval D50Z from 2.0 0.3 to 0.9 phi. The second group (six samples) falls
3.2, and MZ from 0.3 to 0.9 phi. The second group (six samples)in the interval D50
from
falls in1.1the
to interval
2.0 phi, and
D50 Mz
from from 0.62.0
1.1 to to phi,
1.0 phi.
andTheMz third
from group (sixphi.
0.6 to 1.0 samples)
The thirdfallsgroup
in the(six
interval D50
samples)
from 2.3 to 3.0 phi, and Mz
falls in the interval D50 from 2.3 from 1.2 to 1.6 phi. Analyzing the obtained results, it may
3.0 phi, and Mz from 1.2 to 1.6 phi. Analyzing the obtained be concluded that
the wind conditions for most samples were similar. The differences in size
results, it may be concluded that the wind conditions for most samples were similar. The differences of the accumulated grains
are minor.
in size Only
of the forms suchgrains
accumulated as aeolian covers were
are minor. Only formed
forms such fromasfiner material,
aeolian covers which
werecame
formed a longer
from
way (Szamoty 1 field, samples no. 14, 16 and 19). Samples from the aeolian
finer material, which came a longer way (Szamoty 1 field, samples no. 14, 16 and 19). Samples from cover in the Szamoty 2
field included
the aeolian poorly
cover sorted
in the mineral
Szamoty (it came
2 field a shorter
included way,sorted
poorly samples no. 48(it
mineral and 49). aDispersions
came shorter way, in
the graphno.
samples point
48 towards
and 49).differences
Dispersions in wind
in thespeed
graphand transport
point towards path. Changes in
differences in wind
windspeedspeedandanda
longer or shorter transport route were visible in field studies.
transport path. Changes in wind speed and a longer or shorter transport route were visible in field
studies.Geosciences 2019, 9, 106 14 of 21
Table 3. Parameters of granulation of collected samples.
Research Field Sample Number Mean Grain Diameter (phi) Sorting (phi) Sorting (phi)
8 2.57 1.344 poorly
9 2.54 0.403 well
10 2.48 0.858 moderately
11 2.44 0.832 moderately
24 0.92 1.366 poorly
41 1.91 1.57 poorly
43 0.95 1.35 poorly
44 2.61 0.697 moderately well
45 2.33 1.431 poorly
46 2.66 0.492 well
47 2.59 0.554 moderately well
1 2.24 1.165 poorly
Szamocin Field
2 1.85 0.998 moderately
3 2.32 0.903 moderately
4 2.40 0.896 moderately
5 2.57 0.658 moderately well
6 2.80 0.435 well
7 2.64 0.384 well
30 3.17 0.708 moderately
31 3.06 0.409 well
32 3.04 0.394 well
33 2.74 0.861 moderately
34 2.91 0.793 moderately
35 2.85 0.685 moderately well
12 2.17 0.704 moderately
13 2.51 0.599 moderately well
14 1.75 0.625 moderately well
15 2.39 0.602 moderately well
Szamoty Field 1 16 1.84 0.858 moderately
17 2.30 0.892 moderately
18 2.67 0.644 moderately well
19 2.09 0.734 moderately
20 2.24 0.594 moderately well
48 2.57 0.84 moderately
Szamoty Field 2
49 2.52 1.463 poorly
21 2.88 0.427 well
22 2.86 0.569 moderately well
23 1.38 0.976 moderately
24 2.25 1.471 poorly
25 2.61 0.887 moderately
Swoboda Field
26 2.87 0.427 well
27 2.99 0.441 well
28 2.93 0.434 well
50 1.52 0.889 moderately
51 2.77 0.456 wellGeosciences 2019, 9, 106 15 of 21
Geosciences 2019, 8, x FOR PEER REVIEW 10 of 22
Figure 11.Summary
Figure 11. Summaryofofthe
theaverage grain
average sizesize
grain (D50) andand
(D50) sorting (Mz)(Mz)
sorting for samples collected
for samples from fields
collected from
near
fieldsSzamocin.
near Szamocin.
4. Discussion
4. Discussion
Literature describes examples of catastrophic dust phenomena that occurred in the USA in
Literature describes examples of catastrophic dust phenomena that occurred in the USA in the
the twentieth century. Dust storms caused deflation in areas used for agriculture, and sediments
twentieth century. Dust storms caused deflation in areas used for agriculture, and sediments
transported by wind formed sand covers and small barchan dunes [5]. In turn, [47] indicated that
transported by wind formed sand covers and small barchan dunes [5]. In turn, [47] indicated that
during transportation, locally transferred material is accumulated within dry and water-filled drainage
during transportation, locally transferred material is accumulated within dry and water-filled
ditches. Moreover, accumulation also affects the blocking of local roads that need to be cleaned [47].
drainage ditches. Moreover, accumulation also affects the blocking of local roads that need to be
Accumulation zones identified in this study were similar. Aeolian covers were found on the Szamoty
cleaned [47]. Accumulation zones identified in this study were similar. Aeolian covers were found
1, Szamoty 2 and Swoboda fields. A drift and aeolian cover filling the drainage ditch were also
on the Szamoty 1, Szamoty 2 and Swoboda fields. A drift and aeolian cover filling the drainage ditch
documented in the last field. The Szamocin field revealed forms that did not occur elsewhere.
were also documented in the last field. The Szamocin field revealed forms that did not occur
These included sandy tongues and a large amount of material accumulated on the humps between ruts.
elsewhere. These included sandy tongues and a large amount of material accumulated on the humps
It should be noted that the conditions for the accumulation of aeolian sediments had a major impact on
between ruts. It should be noted that the conditions for the accumulation of aeolian sediments had a
vegetation (winter crops, shrubs, and roadside trees), which was also pointed out by [47]. The growth
major impact on vegetation (winter crops, shrubs, and roadside trees), which was also pointed out
of vegetation covered with mineral sediment was hindered in the initial phase of vegetation. This may
by [47]. The growth of vegetation covered with mineral sediment was hindered in the initial phase
lead to decreased crops.
of vegetation. This may lead to decreased crops.
The influence of climatic changes on agricultural crops is currently observed, as the agricultural
The influence of climatic changes on agricultural crops is currently observed, as the agricultural
sector is very susceptible to changes of air temperature and precipitation. Increased air temperature
sector is very susceptible to changes of air temperature and precipitation. Increased air temperature
causes changes in the length of the vegetation period. A higher temperature fosters earlier crop
causes changes in the length of the vegetation period. A higher temperature fosters earlier crop
planting, faster maturation of crops and delayed sowing of winter crops [48,49]. Climatic changes
planting, faster maturation of crops and delayed sowing of winter crops [48,49]. Climatic changes
cause faster development of thermophilic weeds [50,51]. New species of pests may also appear [51,52].
cause faster development of thermophilic weeds [50,51]. New species of pests may also appear
In a warming climate, extreme weather events (drought, heat, heavy precipitation) will be more likely
[51,52]. In a warming climate, extreme weather events (drought, heat, heavy precipitation) will be
to destroy crops [53,54]. Climatic changes will cause increased yield in the countries of Northern
more likely to destroy crops [53,54]. Climatic changes will cause increased yield in the countries of
Europe, whereas the countries of southern Europe will see a drop in agricultural efficiency [55].
Northern Europe, whereas the countries of southern Europe will see a drop in agricultural efficiency
There will also be a shift of species from the south of Europe to the north [56]. An increase in the
[55]. There will also be a shift of species from the south of Europe to the north [56]. An increase in the
frequency of strong winds causing erosion of topsoil can also be expected. Aeolian erosion is also most
frequency of strong winds causing erosion of topsoil can also be expected. Aeolian erosion is also
frequent during or shortly after ploughing of cultivated fields.
most frequent during or shortly after ploughing of cultivated fields.
Natural extreme phenomena, which include dust storms and sand storms, cause changes in
Natural extreme phenomena, which include dust storms and sand storms, cause changes in the
the landscape in different climate zones. They shape the terrain by building it up and/or filling
landscape in different climate zones. They shape the terrain by building it up and/or filling land with
land with sediments. They cause changes in air quality and negatively affect the human economy.
sediments. They cause changes in air quality and negatively affect the human economy. This is
This is related to the granulation of soils. Soils developed on post-glacial sediments contain a lot
related to the granulation of soils. Soils developed on post-glacial sediments contain a lot of the
of the finest fractions, i.e., dusts and sands, which have been classified as very susceptible to wind
finest fractions, i.e., dusts and sands, which have been classified as very susceptible to wind erosion
erosion [49]. The soil erodibility coefficient amounts up to 68% for Poland [57]. This is related to the
[49]. The soil erodibility coefficient amounts up to 68% for Poland [57]. This is related to the
occurrence of post-glacial sediments, rich in the smallest fractions [57]. Significant susceptibility of
occurrence of post-glacial sediments, rich in the smallest fractions [57]. Significant susceptibility of
soils to aeolian erosion in Poland is also indicated by [58]. It is claimed that 28% of arable land isGeosciences 2019, 9, 106 16 of 21
soils to aeolian erosion in Poland is also indicated by [58]. It is claimed that 28% of arable land is
exposed to wind erosion, and in particular arable land on light, sandy soils. Analysis of granulation in
samples taken in the fields showed that fine grain sands were subject to accumulation. In the Szamocin
field, the presence of very fine-grained sand was found in only three samples. This indicates that the
wind speed was so large that it carried the smallest particles outside areas subject to deflation.
Strong and gusty wind in the research area elevated the mineral material to 15–20 m. Grains of
sand and dust begin to move when the wind speed exceeds 4 m s−1 [8]. Research on aeolian processes
taking place in Iceland indicates that volcanic dust rises at very low wind speeds and remains even
when the wind decreases [59]. In the analyzed areas, intense deflation occurred when the wind reached
a speed above 8 m·s−1 . Suspension and saltation predominate in transport, and larger particles
are dragged [60–62]. The sandy material was eroded and accumulated, as was the case with other
authors [62]. Samples collected from Szamocin, Szamoty 1, Szamoty 2 and Swoboda fields did not
contain a dusty fraction due to wind transport outside the research area. This was fostered by wind
gusts exceeding 15 m·s−1 .
The type of transport dependent on wind and land cover as well as the size of transferred
sediment was worked on in experimental conditions on research plots [28] and in wind tunnels set up
in agricultural areas [30], and spaced between olive trees [29]. Using artificial conditions, the authors
attempted to identify the main factors affecting changes in the soil profile considering the type and
volume of material blown. Depending on the type of substrate, the main type of transport is saltation,
followed by surface creep of material. Erosive wind speeds determined during the research were
8.8 m·s−1 [28], 8 m·s−1 [30] and 7.6 m·s−1 [29]. These values are close to the wind velocity responsible
for deflation (8 m·s−1 ) in the analyzed fields.
It is difficult to completely determine deflation in areas used for agriculture in Germany [24]. It is
estimated that it can amount to 16–20 t·km−2 and that it is close to the global constant. On April 8,
2011, a dust storm also occurred in Germany, but there are no works available on this topic. As far
as the analyzed areas near Szamocin are concerned, the eroded material was accumulated locally.
This applies in general to the coarse fraction. Based on field observations, it was estimated that the
total transport of blown material may have exceeded 5 km.
The size of aeolian accumulation during four days of extreme aeolian processes exceeded the
results obtained by [63]. Fields around Szamocin demonstrated an accumulation from 372.5 to
2831 t·km−2 while the yearly average that we have calculated was 178.7 t·km−2 . The average annual
mineral precipitation value for Równina Wrzesińska (Wrzesińska Plain) was at a level of 280 t·km−2
annually [64]. On the other hand, catastrophic values for this area have been set at 6400 t·km−2 per
year with a maximum of 15,000 t·km−2 annually [65]. These are lower values in relation to results
obtained in the fields near Szamocin, which ranged from 33,990 to 258,328 t·km−2 annually. In the
study of [24], data regarding deposition averaged at 0.14 g/m/d, with a maximum drop of 0.30 g/m/d.
The actual value of accumulated material in the analyzed site was much higher due to a large amount
of silty material discharged outside the research areas. In the case of fields near Szamocin, the amount
of material blown outside the research site is impossible to estimate. Small areas covered with deflation
(a few hectares for each research field) provided a great number of dusts to the atmosphere (Table 1).
This was caused by the occurrence of postglacial sediments, which are mainly represented by clays
and sands rich in silted fractions.
In Szamocin, Szamoty 2 and Swoboda field, winter crops grew, which caused slowing down
of transport and accumulation of material. Such a situation was described by [66]. Their models
concerning soil both resistant and non-resistant to erosion showed microforms such as ridges, furrows,
and clods. Aeolian microforms were distributed in an uneven way (microshadows). They occurred
behind clods of soil, stones, and clumps of vegetation. Only sandy ripple marks were formed on the
surface of aeolian covers. There were many more lumps on the resistant soil and it formed a kind of
crust. The extraction of mineral material in these cultivated fields caused depletion of soils from the
smallest fractions. This process affects the humidity changes in the soil profile and reveals the level ofGeosciences 2019, 9, 106 17 of 21
humus. Hard, dry soil and clods were not conducive to erosion, but were perfect places for sediment
accumulation during saltation and surface creep.
5. Conclusions
This article presents the results of environmental changes after the occurrence of a dust storm.
The dust storm that took place in the period of 7–10 April 2011 caused the formation of various
accumulative forms resulting from the sediment deposited. A thorough analysis of the morphological
characteristics of the accumulative forms was conducted and the average quantity of blown mineral
material was calculated.
Aeolian processes presented in the article were of an extreme nature. The wind speeds recorded
at the weather station in Piła on the days of extreme aeolian processes in the vicinity of Szamocin
were much higher than the average for the long-term period. The speeds were probably higher in the
research area due to extensive open spaces of arable fields. An additional, very important element
conditioning such strong deflation, transport and accumulation processes was a heavily dry soil,
as a result of precipitation that was much lower than the average long-period sum in March and the
beginning of April 2011. On the other hand, average daily air temperatures were higher than those
for the average long-term period. A long period of drought in the spring season, strong, gusty wind
on 7–10 April 2011 and freshly ploughed fields were the main cause of extreme aeolian processes.
Soil particles were transported in the process of traction and saltation. The finest fractions formed
suspended matter that was blown away beyond the area of each of the analyzed fields. The volume of
mineral material accumulated in the fields exceeded the values recorded in Poland so far. On 8 April
2011, catastrophic aeolian processes also took place in Germany.
The amount of erosion and aeolian accumulation considerably exceeds the results presented in
Polish literature so far. This is probably related to the duration of a strong, gusty wind that lasted
for four days. Sandy accumulative forms were created in the immediate vicinity of deflation areas.
The finest material was blown away.
Crop rotation used by farmers means that aeolian erosion may occur in a given year on a given
field surface, and in the following year, mineral material blown from the neighboring field can be
accumulated in the winter crop. This affects the even course of aeolian erosion over a larger area.
Aeolian transport which took place in the analyzed areas caused the accumulation of aeolian covers
with the largest surfaces and thickness. Aeolian covers negatively affected the growth of vegetation in
the spring season, which could have deteriorated crop yields. Small areas of fields subject to deflation
constituted the source of transport of a large amount of mineral material.
The results of research from agricultural land obtained directly after sediment accumulation
indicate that the soils in agricultural fields near Szamocin are very susceptible to being blown away.
Deflation took place even at the wind speed of 4 m·s−1 (IMWM Piła station). Areas built of sandy
sediments, not only used for agricultural purposes, form an ideal place for the occurrence of deflation.
Climatic changes which have been intensifying in the recent decade include the change in temperature
and humidity. In countries with farming-base economies, climatic changes will lead to the loss of crops.
The intensifying phenomena connected to aeolian processes should undergo in-depth examination,
during and after the occurrence of aeolian processes, to increase knowledge on this subject.
Author Contributions: Conceptualization, M.H. and M.R.; Methodology, M.H.; Formal Analysis, M.H.;
Data Curation, M.W.; Writing—Original Draft Preparation, M.H. and M.R.; Writing—Review and Editing, M.H.
and M.R.; Visualization, M.R. and A.K.
Funding: The APC was funded by the Polish Ministry of Science (Project Supporting Maintenance of Research
Potential of the Department of Physical Education. Health and Tourism at Kazimierz Wielki University
No. BS/2016/N1).
Acknowledgments: Hydrometeorological data was obtained from the Institute of Meteorology and Water
Management, National Research Institute in Warsaw. We would like thank anonymous reviewers. Their comments
were very important and helped to improve the manuscript.You can also read


