Airfoil Development for the Trek Speed Concept Triathlon Bicycle - By: Paul Harder Doug Cusack Carl Matson Mike Lavery
←
→
Page content transcription
If your browser does not render page correctly, please read the page content below
Airfoil Development for
    the Trek Speed Concept
    Triathlon Bicycle

    By:
    Paul Harder
    Doug Cusack
    Carl Matson
    Mike Lavery
    April 24, 2010

1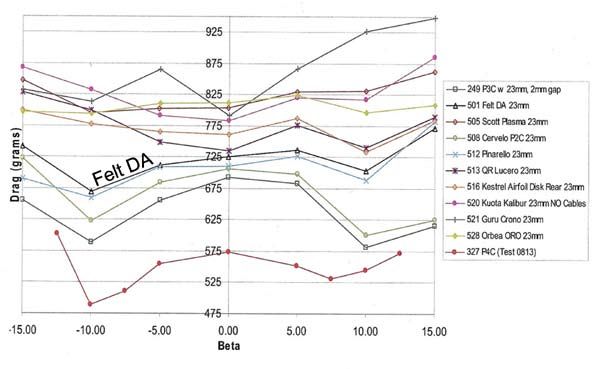
Table of Contents
       3   Executive Summary
      4    Introduction
      4    1 Bicycle-Specific Airfoil Development
      4     1.1 Why Airfoils?
       5    1.2 Initial Literature Search
       5    1.3 Airfoil Development: February – October 2008
       6     1.3.1 Phase 1
       7     1.3.2 Phase 2
       7     1.3.3 Phase 3
       9    1.4 KVF Stiffness Benefits
       9    1.5 Kamm-Style Airfoils in the Auto Industry
      10   2 Bicycle Aerodynamic Development & Testing
      10    2.1 Prototypes: November 2008 – February 2009
      11    2.2 Pro Team Bike: March – June 2009
      12    2.3 Production Bike: July 2009 – March 2010
      14     2.3.1 Mannequin Testing
      15   3 KVF Theory
      16    3.1 Validation of KVF Flow Behavior
      16     3.1.1 High Speed Camera Visualization
      18     3.1.2 Agreement with CFD Predictions
      18     3.1.3 Side-View Images
      19   4 Yaw
      20   Appendix
      20   1 Aerodynamic Drag in Cycling
      20    1.1 Flow Separation and Boundary Layers
      21    1.2 Implementation of Turbulence-Inducing Features (i.e. Dimples)
      21   2 The KVF’s Negative Drag (Thrust!)
      22   3 Misaligned Airfoils
      23   4 Trek’s Wind Tunnel Test Standards
      24   5 Other Common Tri-Bike Airfoils
      25   6 Cervélo Wind Tunnel Data
      26   7 Specialized Wind Tunnel Data
      27   Glossary
      28   References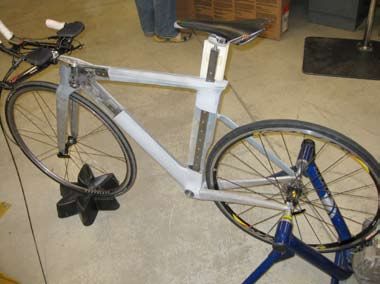
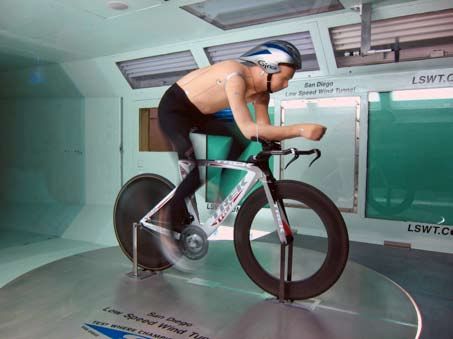
Executive Summary
After years of research, development, and testing, Trek is confident to introduce the Speed Concept as the fastest production bicycle
in the world. This claim is not made lightly – the Speed Concept is the final result of over 250 CFD simulations and 2,100 wind tunnel
runs. At the core of its low-drag performance is the Kammtail Virtual Foil (KVF) tube shape, which itself is the result of a nine month
project dedicated to low-speed airfoil development. The KVF is an unconventional aerodynamic shape proven to have incredibly low
drag, with a light, stiff profile. In fact, the Speed Concept’s KVF tubes themselves are proven to have negative drag (thrust) in a wide
range of common wind conditions. Trek has gone to great lengths to accurately measure the aerodynamic drag of the Speed Concept
against that of the competition, and the results speak for themselves.

                Figure 1: Drag of several popular triathlon bikes.
                Notes: San Diego Low Speed Wind Tunnel. Without rider. Tares removed.

3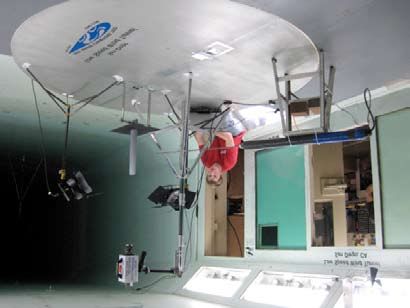
Introduction
Trek is dedicated to better products through genuine scientific research and innovation. True to this philosophy, the Speed Concept’s
aerodynamics was developed from the ground up, using a fundamental scientific approach. This paper tells the story of the Speed
Concept’s aerodynamic development, focusing on the patent-pending breakthrough airfoil technology – the Kammtail Virtual Foil (KVF).
To support this story, the Appendix includes additional studies, data, and discussions on general topics in bicycle aerodynamic theory.

1 Bicycle-Specific Airfoil Development

1.1 Why Airfoils?
Simply stated, as the bicycle moves forward, air resists the motion of the frame tubes, resulting in aerodynamic drag. The amount of
aerodynamic drag on a given tube is primarily determined by the tube’s cross-section. Therefore, triathlon bicycle tube cross sections
are designed using low-drag 2D airfoil shapes. Because they are the building blocks which determine the bicycle’s overall aerodynamic
potential, these cross-sectional airfoil shapes were the sole focus of the first nine months of Speed Concept research & development.

           Figure 2: The Speed Concept with the 2D airfoil cross-sections of several tubesidentified in red.
           Note that the airfoil is defined in the horizontal direction of the wind (waterline plane).

4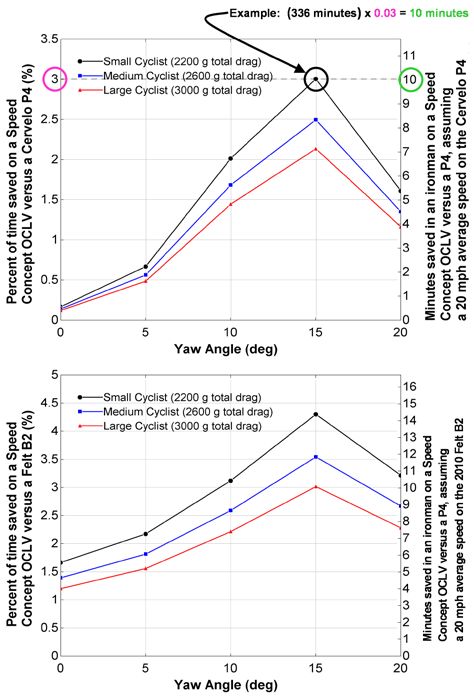
1.2 Initial Literature Search
As in any scientific research project, the first step was to review any scientific literature available on the topic. After an exhaustive
search, very little relevant literature was found. While general airfoils have been studied heavily throughout recent history, almost all
such research has been directed towards high airspeed (75 mph to supersonic) aeronautical applications. For reasons discussed in the
next section, these high-speed airfoils are neither practical nor effective on bicycles.

A much smaller, though significant, amount of aerodynamic research has been conducted for automobiles. This research is again
mostly irrelevant to bicycles due to the much higher speeds and thus very small yaw angles (yaw is described in Section 4). In addition,
the parts of an automobile which are true airfoils are often asymmetric and designed to provide down-force. However, the overall
automobile body itself experiences the same flow separation issues which are known to plague the low aspect ratio airfoils on current
bicycles.

Bicycles inhabit a small niche in aerodynamic science. There has been very little historical demand for such research because
aerodynamic drag is of importance to very few devices which travel through air at 30 mph or less. Fluid dynamic behavior at such low
speeds (low Reynolds Numbers) is notoriously difficult to study and predict [1, 2]. Furthermore, the stiffness and weight requirements
of a bicycle create additional constraints. Finally, bicycles see much higher yaw angles than practically any other aerodynamic device
because they travel at speeds similar to common wind speeds.

To cyclists looking to get an edge on the competition, the lack of fundamental research in this subfield of aerodynamics is actually
good news, as there is still room for major advances in bicycle aerodynamics. Trek is at the forefront of this field, dedicating immense
engineering resources towards true scientific research, not towards marketing hype.

1.3 Airfoil Development: February – October 2008
The lack of fundamental research of symmetric low-speed airfoils has left the bicycle industry grasping at straws. At worst, bicycle airfoil
shapes are chosen because they simply look unique or can be marketed as highly-engineered, though they actually perform poorly. At
best, bicycle airfoil shapes are designed after the airfoils used in the aeronautical industry, such as the library of NACA airfoils. However,
many of these aeronautical airfoils do not work well for bicycles for several reasons. First, generally high aspect ratio (slender) airfoils
would make very heavy and/or flexible bicycle tubes. While it is possible to manipulate the NACA system to obtain a
symmetric low aspect ratio airfoil, the system was primarily designed for high aspect ratio, asymmetric flying wings. Second, it is well
known that the effectiveness of an airfoil highly depends on the Reynolds Number at which it operates [2], and bicycles operate at
much lower Reynolds Numbers than aircraft. Third, the aerodynamics governing aircraft differ significantly to ground vehicles, which are
limited to motion in one direction, as discussed in Appendix 2.

In early 2008, Trek engineers decided that the status quo had to change if bicycle aerodynamics were going to take any true scientific
leap forward. This leap would require the first fundamental study of low-speed airfoils specifically designed for bicycles, and Trek
was in the unique situation of having both the engineering resources and expertise to take on this historically neglected subset of
aerodynamics. This project would fly completely under the radar within Trek. There would be no timelines, deadlines, or ties to other
projects – this research would end only if and when true scientific discovery was made and would compose of three phases:

          Phase 1: Develop a method for classifying and accurately testing airfoils using computational fluid dynamics (CFD). Create
                    a proprietary library of traditional airfoil geometries and drag data.

          Phase 2: Expand the CFD library to include non-traditional airfoil geometries. Consider no idea too wild to test and no
                    traditional theory too deeply-rooted to challenge.

          Phase 3: If Phases 1 or 2 resulted in true scientific breakthroughs, the most promising airfoil concepts would be refined and
                    validated in the wind tunnel.

5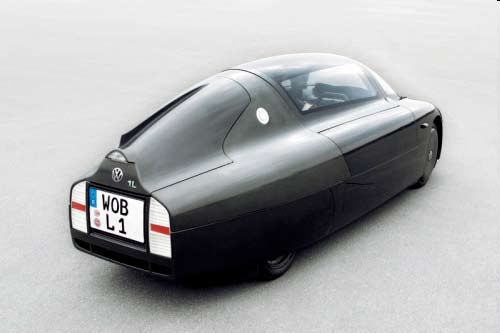
1.3.1 Phase 1
At the onset of the project, Trek engineers knew that most airfoil theories and conventions that had been developed for the auto and
aeronautical industries would not translate to bicycles. So, a new system for constructing and classifying airfoils was created. The
defining parameters would be varied and tested in CFD, building a library of proprietary airfoil geometries and performance data. As
a first step, a variety of CFD softwares and settings were tested in a wind tunnel validation study. In the end, Trek’s standard CFD
method proved to be extremely accurate. This was not surprising since this method has been developed and refined over Trek’s 7
years of in- house CFD testing.

                                                                                Figure 3: Validation of CFD results in the San Diego
                                                                                Low Speed Wind Tunnel.
                                                                                Left: One of several airfoil sections being tested.
                                                                                Right: Tare model being tested.

As the library of proprietary airfoils was built, clear relationships were discovered relating key airfoil dimensions to aerodynamic drag.
A portion of the data library is shown in the figure below. In this figure, the line colors represent one dimension, and the line styles
represent a second dimension. Trends in drag are obvious across both dimensions, but the line-color dimension clearly has the more
significant impact.

                                                                                                              Figure 4: The effects of two
                                                                                                              airfoil geometry parameters
                                                                                                              on drag. CFD data.

6
Trek’s library of airfoil designs and aerodynamic performance data would eventually grow to include over 80 airfoil designs and 250
individual CFD simulations. Following trends, such as those shown in the previous figure, this immense library pointed towards the
optimum bicycle airfoil designs. In addition, the analysis of the flow patterns within each CFD simulation revealed exactly why these
airfoils performed so well.

1.3.2 Phase 2
The airfoils developed in phase 1 could have been leveraged to make a bicycle faster than the Trek TTX, the fastest bike Trek had ever
tested in the wind tunnel. Despite this prospect of success, the study was expanded beyond traditional airfoil shapes. Using Trek’s
highly-efficient CFD test method, there was very little time penalty for exploring wild airfoil ideas. Anything was fair game, and after
three months of exploration, one such wild idea gave a strange result – negative drag! While negative drag is theoretically possible
(Appendix 2), it was such an extreme result that the engineers didn’t know whether to celebrate or start looking for a mistake in the
analysis. Of course, there was no mistake, and the Kammtail Virtual Foil (KVF) was born.

As was done for the traditional airfoil library, the key geometric parameters of the KVF were identified, and their effects on
aerodynamic drag were studied in CFD. Over the next several months, a new library of over 50 KVF geometries and data was built.
During this process, it was observed that the aerodynamic performance of KVF airfoils was significantly improved by even slight
changes in geometry. Furthermore, the pitch orientation of the tube heavily dictates the relative performance of different KVF designs.
As a result, Trek engineers have taken painstaking steps to fine-tune the geometries for optimum performance of each individual
bicycle frame and fork tube. By nature, the KVF design must be highly-engineered, and casual knowledge of Kamm-style airfoil
construction and theory is not enough to design a high-performing KVF.

1.3.3 Phase 3
Although no mistakes were identified in the ongoing CFD analyses, the KVF airfoil results still seemed too good to be true. Before
designing a bike around the KVF airfoil concept, a wind tunnel validation was warranted. In October 2008, Trek engineers took the
opportunity to test at the A2 Wind Tunnel for the first time.

For these tests, Trek’s in-house Prototype Development Lab CNC-machined the top four KVF shapes and the TTX down tube shape
into solid aluminum tube sections. Each section was capped at both ends with an identical taper designed to reduce end-effects to a
much smaller and more consistent contribution to the overall drag. These sections were tested across a wide range of pitch and yaw
angles . The figure below shows the data for a vertical pitch angle.

                                                                                                   Figure 5: A2 Wind Tunnel data for airfoil
                                                                                                   sections tested at a vertical pitch angle.
                                                                                                   Notes: A2 Wind Tunnel. Tares not removed.

7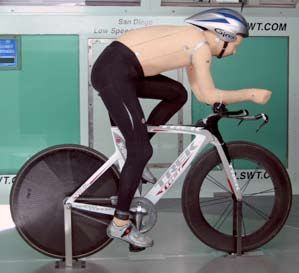
As the data shows, the remarkable drag savings predicted in CFD were absolutely correct. In particular, KVF airfoils #3 and #5 had
massive drag savings over the industry-leading TTX airfoil shape. These same airfoils were subsequently tested at the San Diego Low
Speed Wind Tunnel on two occasions. The relative results varied slightly from those measured at the A2 Wind Tunnel, though the
overall story remained the same – incredible drag savings.

After tare removal of the San Diego data, it was discovered that the KVF truly does have negative drag (thrust) at 10-17° yaw. This
rare phenomenon is hard for the non-aerodynamicist to envision, but it is indeed possible as discussed in Appendix 2. In effect, the
airflow over a KVF tube actually propels the bicycle forward! These results are unprecedented for airfoils designed for high stiffness
and low weight. Plus, the vertical pitch angle is aerodynamically the worst-case scenario, and the data includes the drag of the airfoil
section end caps. Trek immediately applied for a patent covering the use of KVF technology on bicycle frames, components, and
accessories.

                                                        Figure 6: Top: Wind tunnel data showing the negative drag performance of
                                                        two KVF designs at a vertical pitch angle. Bottom: Test images of an airfoil
                                                        being tested at two different pitch angles. Notes: San Diego Low Speed Wind
                                                        Tunnel. Tares removed (only the vertical struts and horizontal rod).

8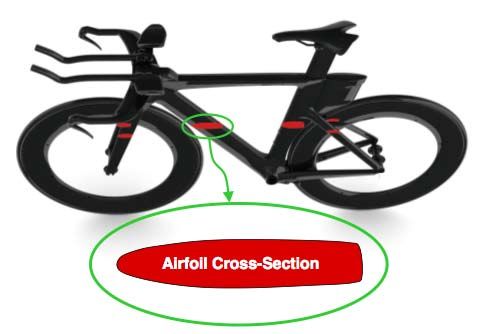
1.4 KVF Stiffness Benefits
In addition to its excellent aerodynamics, the KVF shape is very laterally and torsionally stiff. The chart below compares the stiffness
of the airfoils which were tested in the windtunnel, as compared to the TTX traditional airfoil. Since stiffness trades off with wall
thickness (i.e. weight) the KVF airfoil can be designed to be stiffer and/or lighter than a traditional airfoil.

          Table 1: Comparison of the moments of inertia (stiffness) of KVFs versus the TTX airfoil.

                                                                                        Figure 7: Overlaid images of a traditional airfoil and
                                                                                        a KVF, illustrating the added stiffness of the KVF.

1.5 Kamm-Style Airfoils in the Auto Industry
Though Trek’s research of low-speed, large-yaw, symmetric airfoils was perhaps the first of its kind, the Speed Concept would not be
the first ground vehicle to apply the concept of a truncated tail airfoil. In fact, the concept has been used by auto industry since the
1930s [3]. Today, many car body designs take advantage of the phenomenon to achieve high performance, such as the Mercedes
Benz SLR, and efficiency, such as the Volkswagen L1. The L1 is claimed to be “the most efficient car in the world” [4] largely due to its
0.195 drag coefficient [5].

          Figure 8: Left: Mercedes Benz SLR [6]. Right: Volkswagen L1.

9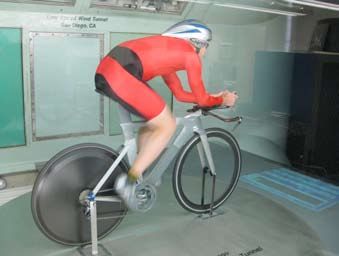
2 Bicycle Aerodynamic Development & Testing

2.1 Prototypes: November 2008 – February 2009
After almost a year of airfoil development, it was time to use these building blocks to make the fastest bike in the world. Trek’s
engineering and industrial design teams began work on a frame which incorporated the KVF, along with the other aerodynamic
integration concepts which had been under development. KVF variations were carefully selected for each tube based on stiffness
requirements and pitch angle-specific drag performance. Of course, it was still unknown how the KVF would perform in a full bicycle
system, and several additional questions remained, such as the ideal tube placements, orientations, transitions, relationships to the
wheels, etc.

To answer these questions, the aerodynamics of many prototype variations would need to be tested. Wind tunnel testing was chosen
over CFD testing due to the many complex flow interactions and moving parts of a complete bicycle. An adjustable frame skeleton
was developed for testing physical prototypes of each of design variation in the wind tunnel. This framework of adjustable steel beams
was created by Trek’s in-house machinists. Trek’s in-house Prototype Lab then created rapid-prototyped shells of the bicycle tubes
using an Objet Connex 500. These shells could snap on and off of the framework, allowing quick modification of the prototype bike’s
shape. While the use of adjustable prototypes well-established in the wind tunnel community, this system was made to be not only
fully adjustable but also fully rideable by a pedaling cyclist.

         Figure 9: Left: The adjustable prototype partially assembled with plastic shells.
         Right: Adjustable prototype being ridden in the San Diego Low Speed Wind Tunnel.

10
2.2 Pro Team Bike: March – June 2009
During hundreds of wind tunnel runs studying various rapid-prototyped designs, the best design choices were discovered. Trek’s
design teams went back to work, incorporating these findings into one final bicycle concept. With a great deal of work from Trek’s
manufacturing engineering team, OCLV molding lab, and test lab (all in Waterloo, WI), full-carbon team bikes were made for Chris
Lieto to race at Ironman 70.3 Boise and then for team Astana to race in the Tour de France. Of course, one carbon team bike would
go back to the wind tunnel for a head-to-head test against the best the market had to offer.
Figure 10: Head-to-head wind tunnel data for several popular triathlon bikes.
Notes: Trek’s wind tunnel test standards are described in Appendix 4. The P4 was tested with
its integrated aero bottle because this is its most aero configuration [21]. San Diego Low Speed
Wind tunnel. Without rider. Disc rear wheel and Hed 3 front wheel. Tares removed.
The newly-named Speed Concept was in a class of its own. At 0˚ yaw, the P4 had a slight advantage (with integrated aero bottle),
but the team Speed Concept was by far the fastest overall bike. Also note that over a large range of yaw angles common in cycling,
the Trek TTX was second fastest (only to the team Speed Concept).
112.3 Production Bike: July 2009 – March 2010
Trek engineers would spend the next year refining the team Speed Concept design into the production Speed Concept found at
Trek Dealers today. In fact, since the June 2009 wind tunnel tests, Trek has dedicated an additional 1,200 wind tunnel runs directly
towards Speed Concept development and testing, bringing the total up to 2,100 runs. This ongoing development culminated in a
final head-to-head showdown at the San Diego Low Speed Wind Tunnel in March 2010. This final data is shown in the figure below.
Figure 11: Drag of several popular triathlon bikes.
Notes: Trek’s wind tunnel test standards are described in Appendix 4. The P4 was tested with its integrated aero
bottle because this is its most aero configuration [21]. The 2010 Felt B2 has the same frame and fork shape as the
Felt DA, so the drag is almost certainly the same [7]. The Speed Concept has replaced the TTX as Trek’s baseline
test bike. San Diego Low Speed Wind tunnel. Without rider. Disc rear wheel and Bontrager Aeolus 9.0 front wheel.
Tares removed.
As can be seen, the Speed Concept OCLV had the least drag by a huge margin, with the Speed Concept TCT coming in second
overall. Over the entire yaw range, Speed Concept OCLV has an average of 91 grams less drag than the Cervélo P4, the closest
overall competitor. With an average of 22 grams less drag than the closest overall competitor, the Speed Concept TCT was the
second fastest bike tested. At 15˚ of yaw (a fairly common condition – see Section 4), the Speed Concept OCLV and Speed
Concept TCT have 169 and 83 grams less drag than any other bike tested. Considering that in this configuration the Speed
Concept’s drag at 15˚ yaw is only 405 grams total, these drag savings are immense.
12Relating drag savings to universally meaningful real-world values can be tricky. Conversions to seconds or watts savings require
assumptions, speed, distance, and/or other sources of power loss like rolling resistance. However, these assumed values are different
for every individual cyclist. Trek engineers have discovered that the percentage of overall time saved due to a given drag savings is
essentially independent of any other factors. So, anybody can simply multiply their total ride time by this percentage to determine
their time savings (remember that 1% is actually 0.01). The percentage time savings of the Speed Concept OCLV over the best and
worst-performing competitors in the test group are shown in the left axis of the figures below. The right axis shows the time savings
for an example case: 112 miles at an average of 20 mph (336 minute total ride time). Note that position will have the same effect as
cyclist size. For a better idea of what yaw angles are typical in cycling, see Section 4.
Figure 12: Time saved by the Speed
Concept OCLV over the Cervélo P4 and
Felt B2 (same frame/fork shape as the Felt
DA [7]). Of course, these comparisons
assume that the frame and fork are the
only things that change.
132.3.1 Mannequin Testing
Historically, nearly every time Trek engineers tested bikes alone, they additionally tested with one or more trained test rider. Including
a pedaling rider ensures that the test accounts for the air flow’s dynamic interaction, redirection, and blockage between the rider
and bicycle. However, even when great care is taken to maximize repeatability, a human rider can potentially add significant amount
of data uncertainty. Furthermore, the test procedure with a live rider takes four times longer than with a bike alone, and even the
best rider cannot consistently ride in the tunnel all day long. So, Trek engineers reviewed photos of triathletes at the 2009 Ironman
World Championship and then laser scanned an average-sized cyclist in what was determined to be a typical triathlon position. This
scan was used to design and fabricate a fully-articulated, position-adjustable cycling mannequin, “Manny.” Manny proved to pedal
smoothly and lifelike, providing data with an average uncertainty of only ±8 grams between duplicated tests.
!
Figure 13: Left: Manny on a Speed Concept during a wind tunnel test.
Right: Manny on a Speed Concept before a wind tunnel test (not yet pedaling).
The data with Manny turned out to be very enlightening and supported several theories about the aerodynamic interaction between
the cyclist and bicycle. Because the full-body pedaling mannequin and resulting data are proprietary to Trek’s tri bike testing and
development, only the upper and lower limits of this data are being released. This data envelope illustrates that the benefits of the
Speed Concept remain when a pedaling cyclist is added to the system, without divulging all of the test findings. Note that although
the Felt fell at the upper range of bikes that were tested, this test group obviously did not test all triathlon bikes.
Figure 14: Drag of the highest and lowest drag
bikes with Manny the mannequin.
Notes: Trek’s wind tunnel test standards are
described in Appendix 4. San Diego Low Speed
Wind Tunnel. Disc rear wheel and Bontrager
Aeolus 9.0 front wheel. Tares removed.
143 KVF Theory
It is widely known that, within limits, high aspect ratio airfoils have lower drag than low aspect ratio airfoils [8]. For bicycles, the UCI
sets a 3:1 aspect ratio maximum, so most major manufacturers generally adhere to this rule. However, even without the UCI rule, low
aspect ratios are required to obtain sufficient weight and stiffness for use in bicycle tubes. If the airfoil width is decreased, it loses
lateral stiffness, and if the airfoil length is increased, it gains weight without much gain in lateral stiffness (and the gain in vertical
stiffness results in a harsher ride).
So, the goal of bicycle airfoil design is to achieve the aerodynamic performance of a high aspect ratio airfoil within a compact light/
stiff profile. In the end, the solution is simple: use the portion of a high aspect ratio airfoil which works the hardest and throw away
the rest.
After hundreds of CFD simulations and wind tunnel runs, Trek engineers discovered that the performance benefits of a high aspect
ratio airfoil are almost entirely due to the front portion of the airfoil. This part of the airfoil dictates flow separation behavior – the
most significant cause of aerodynamic drag on a traditional bicycle airfoil. Flow separation is when the bulk airflow detaches from
airfoil wall; the result is a low pressure wake which pulls the tube backwards. Furthermore, drag is induced by turbulent energy
dissipation in the separated wake region. Aerodynamic drag in cycling is further discussed in Appendix 1.
To minimize flow separation, the KVF incorporates the front portion of a high aspect ratio airfoil. To retain a stiff, light tube section,
the tail of this high aspect ratio airfoil is truncated at a very specific location. The rear of the KVF was carefully designed such that
it reconnects the airflow just as if a physical tail existed. Trek has named this phenomenon the “virtual tail,” as illustrated below.
Interestingly, the virtual tail is different than a traditional wake because it causes very little turbulent energy dissipation.
Figure 15: CFD velocity vectors predicting the KVF’s late flow separation, virtual tail, and lack of wake turbulence.
Comparatively, even one of the best traditional bicycle airfoils, such as that on the TTX, will have fairly early flow separation.
Notes: 30 mph air velocity at 10˚ yaw.
15With careful design, the KVF with a virtual tail realizes almost all of the drag savings of an ideal (higher) aspect ratio airfoil with a
physical tail. The virtual tail combines with the KVF to create a single effective airfoil of ideal aspect ratio, as shown in the figure
below. Note that this figure is for 0˚ yaw, but flow separation (pressure drag) dramatically increases with yaw angle.
Figure 16: Drag coefficient versus aspect ratio
for traditional airfoils. Modified from [8].
3.1 Validation of KVF Flow Behavior
3.1.1 High Speed Camera Visualization
While Trek’s CFD airfoil analysis techniques had been wind tunnel-validated to provide accurate comparative drag predictions, it was
not yet certain that CFD fully-captured the qualitative flow characteristics. Particularly, the virtual tail phenomenon was yet to be
proven in the real world. Furthermore, the all-important flow separation behavior is known to be difficult to accurately model in CFD,
particularly for low Reynolds Number airfoils at large yaw angles [9]. So, an experiment was developed to validate these behaviors in
the real world.
The goal of this ambitious experiment was to create images of the real-world flow around the KVF, which could be directly compared
to the CFD predictions previously shown in Figure 15. In the end, the experiment would utilize Trek’s Photron SA-3 high speed camera,
a smoke wand, and four airfoil sections custom-designed for this visualization. This visualization method would prove to be both
highly complicated and successful, so the details will not be described here. The basic setup is shown in the figure below.
Figure 17: Smoke visualization test setup.
Notes: For illustration purposes only – some details
have been intentionally changed and hidden. San
16 Diego Low Speed Wind Tunnel.The results of this experiment were dramatic. Filmed at 7,500 frames per second, the airflow around four fundamental tube shapes at
10˚ yaw was revealed in full detail. A still image from each of these four videos is shown side-by-side in the figure below.
Figure 18: Snapshot of the airflow around
several airfoil shapes with the flow paths
identified. Notes: 30 mph airflow in the
vertical direction. Airfoils yawed 10˚ to the
right. Taken from a video filmed at 7,500
frame per second. San Diego Low Speed
Wind Tunnel.
In the previous figure, the wind direction is vertical from top to bottom, and each airfoil is yawed to 10˚ to the right, and the airspeed
is 30 mph. The cross-sections were scaled such that each had the same lateral moment of inertia (lateral stiffness). The dashed lines
indicate the air path across the trailing sidewall of the airfoil (the side on which flow separation occurs).
As can be seen, the round cross-section (shape 1) has extremely early flow separation. In the video, the classic Kármán Vortex Street
[10] of alternating eddies is clearly seen. The large turbulent wake results in extremely high drag.
The traditional bicycle airfoil (shape 2) is a significant improvement over the cylinder. However, it still generates a significant wake
because the flow separates from the trailing (right) wall. One indicator of this lack of flow attachment is that the wake does not turn
in the direction of the airfoil. Instead, the air hits airfoil and spreads out, continuing in its original vertical direction.
The KVF (shape 3) has much better separation characteristics, as the flow can be seen to stay attached along the entire length of
the sidewall. Beyond the end of the KVF, the flow continues in a direction tangent to each sidewall and reconnects just as if a pointed
physical tail existed, as illustrated in the figure below. This is the virtual tail! In the high speed video, the air inside the virtual tail is
eerily slow-moving as the bulk flow streamlines around it.
Figure 19: Zoomed in region from Figure 18, with an
identical outline around the virtual tail of shape 3 and
the physical tail of shape 4.
173.1.2 Agreement with CFD Predictions
These real-world flow patterns agree with CFD predictions. These CFD results are overlaid onto the smoke visualization results
in the figure below.
Figure 20: Overlay of CFD-predicted velocity
vectors (from Figure 15) and real-world flow
results (from Figure 18).
3.1.3 Side-View Images
In addition to the high speed video, standard video was taken from the side of each airfoil. This side-view further illustrates the
dramatic difference in the amount of flow disruption (i.e. flow separation and turbulence, thus drag) generated by each airfoil.
The figure below compares the round (shape #1) and KVF (shape #3) cross-sections.
Figure 21: Side view images of the round
(top, #1) and KVF (bottom, #3), illustrating
the dramatic difference in wake size.
184 Yaw
Yaw is angle between the total airspeed vector (apparent wind) and the direction of bicycle motion. In cycling, some amount of yaw
almost always exists, since the wind speed is very rarely zero, and the cycling direction very rarely aligns perfectly with the wind
direction. As is shown in the following figure, the yaw angle is determined by the cyclist’s speed, wind speed, and wind direction.
Figure 22: Vector diagram of the yaw angle.
Bicycles see much higher yaw angles than practically any other aerodynamic device because they travel at speeds similar to common
wind speeds. For example, for a cyclist riding at 20 mph, it takes a side wind of only 5.4 mph to generate a yaw angle of 15°. The
yaw angles for a range of common side wind conditions are tabulated the figure below. A cyclist can use this figure to look up his/
her riding speed (horizontal axis) and find the corresponding yaw angle (vertical axis) for a wide range of side wind speeds (multiple
curves). Note that the average wind speeds along the Ironman World Championship course in Hawaii typically exceed 20 mph,
particularly on the north side of the island [11]. As was seen in the wind tunnel data, the KVF and Speed Concept were designed to
perform particularly well at yaw.
Figure 23: Yaw angles for a wide range
of rider velocity (horizontal axis) and side
wind speeds (curves).
19APPENDIX
1 Aerodynamic Drag in Cycling
Aerodynamic drag generally has two components: pressure drag and skin friction drag. In cycling, pressure drag is caused by flow
separation and the resulting low pressure wake behind the airfoil. The pressure differential from the front to the rear of the airfoil
creates a force in the opposite direction to the airfoil’s motion (think of a vacuum sucking the rear of the airfoil backwards.) Flow
separation also generates vortices and/or turbulence, both additional sources of energy dissipation. Skin friction drag is a force caused
by the air traveling (shearing) across the skin of the airfoil.
1.1 Flow Separation and Boundary Layers
Traditional bicycle airfoils are extremely susceptible to flow separation, resulting in very high pressure drag [12, 13], as was illustrated
in Figures 15 and 18. One way to delay flow separation (make the separation point occur farther towards the tail of the airfoil) is to
turn the boundary layer from laminar to turbulent. A turbulent boundary layer has more momentum and thus resists separating from
the airfoil wall [8], as shown in the figure below. A laminar boundary layer can be turned turbulent using various turbulence-inducing
features, such as dimples.
Figure 24: Laminar and turbulent
boundary layer profiles [8].
However, flow separation is a symptom of an inherently high-drag airfoil. While a turbulent boundary layer might reduce pressure
drag, it will increase skin friction drag [14]. In cases where the flow separation (pressure drag) is severe enough, the tradeoff results
in a net reduction of drag. Obviously, an airfoil which can avoid this tradeoff altogether is ideal. The KVF was designed to behave like
a large aspect ratio airfoil with very little or no flow separation. So, the KVF minimizes pressure drag without the aid of a turbulent
boundary layer (high shear drag), resulting in the lowest possible total drag.
201.2 Implementation of Turbulence-Inducing Features (i.e. Dimples)
Logically, in order to delay flow separation, the boundary layer must be turned turbulent upstream from the laminar boundary layer
separation point, as shown in the figure below. So, any turbulence-inducing feature located downstream from the separation point
performs no practical function, and only has the potential to create unnecessary skin friction drag or turbulence. A golf ball is only
dimpled across its entire surface to account for every possible ball orientation. Since the relative-wind orientation of bicycle tubes and
components (even those rotating) is fairly limited, the functionality of turbulence-inducing features is limited to a single specific area.
As previously mentioned, the lowest possible drag is achieved when flow separation is avoided without the aid of any turbulence-
inducing features.
Figure 25: Flow around a smooth sphere (top) and around the
same sphere with a turbulence-inducing feature upstream
from the laminar boundary layer separation point [16]. This
is why golf balls are dimpled [15].
2 The KVF’s Negative Drag (Thrust!)
Because flying devices are not restricted to travel in a predetermined direction, airfoil aerodynamic forces are traditionally measured
in the axes parallel (drag) and perpendicular (lift) to the wind. In contrast, bicycles are on wheels which limit their motion to a single
direction. While this distinction is seemingly trivial, it results in a whole different set of aerodynamic rules.
In cycling the aerodynamic forces are measured in the bike-axes, not the wind-axes. The reason is simple: it is the aerodynamic force
component in the direction of bicycle motion (drag) which consumes energy. The rest of the aerodynamic force – the component in
the direction perpendicular to bicycle motion – consumes no energy because the wheels restrict all motion in this direction. Stated
mathematically, the distance traveled in this direction is zero, and work (energy) is the product of force and distance.
21As a result, the aerodynamic rules governing cycling are most similar to those governing sailing. In sailing it is possible to obtain
forward thrust, even when traveling nearly directly into the wind. Like the centerboard of a sailboat, the wheels of a bicycle redirect
the lift force in the wind-axes into a thrust force in the direction of bicycle (or boat) motion. However, the drag force in the wind-axes
still contributes to a drag force in the bicycle direction. For traditional bicycle airfoils, the wind-axes lift force is much smaller than
the wind-axes drag force, resulting in a net drag force in the bicycle direction. In contrast, the KVF has an extremely high lift to drag
ratio in the wind-axes, allowing it to achieve a net thrust in the bicycle direction, just like a sailboat. This result is somewhat counter-
intuitive and unprecedented for bicycle airfoils, so an illustration is provided in the figure below.
Figure 26: Diagram illustrating a case where
negative drag occurs (in the bicycle-axes).
It is also possible to obtain wind-axis lift by simply creating more side (sail-like) surface on the bicycle system. However, this added
surface comes at the penalty of weight. Due to cross-wind stability concerns, side surfaces must be carefully designed into a bicycle
system. The most stable location for such surface is low and rearward, making the rear disc wheel a popular choice.
3 Misaligned Airfoils
Trek has received questions about the effect of misaligning an airfoil from the bike-axis, such as a handlebar which is not perfectly
horizontal, whether intentionally or not. A well-designed airfoil will have very low force (drag) in the major chord direction and, as a
natural result, very high force (lift) in the minor chord direction. For maximum efficiency, the direction of bicycle motion should align
with the direction of minimum force (and therefore with the airfoil).
Although the wind tunnel measures the lift and drag forces in the airfoil-axes, these forces are easily transformed into the wind-axis,
which now becomes the bike-axis. This transformation, along with an adjustment to ensure equivalent wind speed for each data
point, allows a study of airfoil yaw angles to be converted into a study of airfoil misalignment angles. In other words, think of the
direction of bicycle motion as always facing straight into the wind in the wind tunnel. Then, as the airfoil is rotated, this rotation can
be thought of as misalignment from the bicycle-axis instead of yaw.
22The effect of misalignment of the #3 KVF trial from Figure 6 is shown in the figure below. This data proves that any misalignment will
increase drag, but beyond 12.5˚ the drag penalty is particularly severe. For these reasons, the Speed Concept handlebar is designed to
eliminate the possibility of misalignment.
Figure 27: Percentage
drag increase due to airfoil
misalignment to the bike-axis.
4 Trek’s Wind Tunnel Test Standards
To make the most precise and objective wind tunnel measurements possible, Trek engineers strictly adhere to a set of best practices
developed over Trek’s 11 years of wind tunnel testing. Primarily, in each head to head test, every possible aspect of each bike is kept
the same. This includes all non-proprietary components (wheels, tires, handlebar, shift/brake levers, stem, saddle, brakes, derailleurs,
crank, cassette, etc.) and all adjustments (saddle height, saddle setback, saddle angle, handlebar location, handlebar angle, cable
routing, etc.). Bicycles are tested with manufacturer’s proprietary components (integrated cranks, brakes, handlebars, waterbottles,
stems, seatposts, etc.) where standard components can not be installed without modification. In addition, Trek will only put head-
to-head bike data on the same plot if it was collected in the same test session. Due to increased uncertainty, data is not necessarily
comparable from one test session to the next. Instead of using old data, Trek spends the extra time and money to repeat tests and
ensure comparable data. Finally, there are safeguards built into Trek’s test procedure to ensure reliable, consistent results. Below is
an example image of the standard bike setup from the June 2009 head-to-head wind tunnel tests including the team Speed Concept.
Figure 28: General setup from the June 2009 head-to-head
wind tunnel tests. Notes: Team Speed Concept shown. Wheels
would be spinning during the actual test. Bicycle yaw rotation is
counterclockwise, such that the wind hits the drive side of the
bicycle. San Diego Low Speed Wind Tunnel.
23For the March 2010 head-to-head tests at the San Diego Low Speed Wind Tunnel, the competitor frameset sizes were chosen based on a
nearest match to the Medium size Speed Concept in terms of frame stack and reach. Saddle height and setback were held constant. On
every bike except the Felt B2, the mannequin’s armrest stack and reach were replicated to within a few millimeters with a combination of
Bontrager Race X Lite stems and the minimum required amount of steer tube spacers. The Felt’s stock proprietary stem system was able
to replicate the position without modification. Bontrager’s Race X Lite Bullhorn and Race X Lite clip-on hardware were used with Race XXX
Lite ski extensions and Team-only armrests (without pads) on all bikes other than the Speed Concept OCLV as a best approximation of the
cockpit adjustment range offered by the new SC RXL Aerobar system.
Table 2: Frame size, stem, and spacer
configurations for comparable armrest
position. Notes: SC RXL stem dimensions
are [reach]x[stack], both in mm, and
spacers for the SC RXL aerobar system are
! located between the base bar and armrests.
Common components installed on all bikes included: Shimano BB, crankset, cassette and shift levers, chain tensioner in place of the front
derailleur, Bontrager Race X Lite Pro saddle, Bontrager RXL aero brake levers, Bontrager 5mm brake housing and 4mm shift housing, Zipp
dimpled rear disk wheel, and Bontrager Aeolus 9.0 front wheel. A Cane Creek headset topcap was also common except on the Speed
Concept OCLV and Felt B2.
5 Other Common Tri-Bike Airfoils
The tri-bicycle marketplace is flooded with a variety of cross-sectional tube shapes which are marketed as highly-aerodynamic airfoils.
Trek engineers recently toured several tri-shops and were astonished to find that almost all of these airfoils, while likely interpreted as highly
streamlined to the non-engineer, are in reality non-aerodynamic. The average triathlete relies on what each brand claims, either directly
through marketing or indirectly through a salesperson. Of course, every brand will claim to have the most aero tube shapes, yet only one can
be correct. So, Trek engineers decided to objectively calculate the drag of a variety of popular airfoil styles with their validated CFD analysis
method, as shown in Figure 29.
As was found in the wind tunnel (Figure 6), the KVF was predicted to have slightly negative drag at 10˚ yaw. All of the other shapes exhibit
some amount of flow separation, resulting in much higher drag. Figure 30 depicts the velocity contours around each airfoil. The separation
points and resulting wakes are clearly visible as the blue, low velocity regions. Clearly, many “airfoils” are chosen without regard for true
aerodynamic science. While these are perhaps not all exact replicas of the airfoils found on any given bike, this study demonstrates the
general ineffectiveness of these families of airfoils.
Figure 29: CFD-predicted drag of various tube cross-
sections at 10˚ yaw and 30 mph. Notes: To ensure a level
playing field, each of these airfoils was scaled such that
it has exactly the same lateral stiffness. 450 mm is about
the length of a down tube or seat tube.
Traditional Airfoil (TTX)
Concave Radius Nose
Convex Radius Nose
Blunter Diamond
Diamond
Trek KVF
Round
24Figure 30: Velocity contours,
showing the wakes and flow
separation points. Note
that the round shape has an
unsteady solution, including
Kármán Vortex Street [10].
6 Cervélo Wind Tunnel Data
Cervélo has released head-to-head wind tunnel test data for a wide variety of bikes [17]. Since each manufacturer may test with different
protocols, frame sizes, wheels, and components, it is not scientifically valid to combine this data with Trek’s data. However, in light of Trek’s
recent data, three interesting observations can be made. First, the Felt DA’s drag fell in the middle of the group of the bikes Cervélo tested
but was the slowest bike that Trek tested in Figure 11 (same frame/fork shape as the 2010 Felt B2 [7]). Trek generally focuses on testing
against only the fastest bikes available, so the Cervélo data reflects a broader cross-section of bike aerodynamic performance available
to the triathlon market. Second, Trek’s tests found the P4 to cross above the P3 at yaw angles of about 13˚ and greater (Figure 11). It is not
certain if this agrees with Cervélo’s data because they did not publish P4 data above 12.5˚ yaw. Third, Cervélo’s graph does not provide
data for the Trek TTX, though it was at the time known to be one of the lowest drag bikes, according to historical Trek data [18], historical
Cervélo data [19], and Trek’s June 2009 data in Figure 10.
Figure 31: Head-to-head wind
tunnel test data released by
Cervélo in 2009 [17].
257 Specialized Wind Tunnel Data
While Trek has not yet tested Speed Concept directly against the Specialized Shiv or Giant Trinity Advanced, Specialized has released
head-to-head wind tunnel data for these two competing bikes along with the Cervélo P4 [22].
Figure 32: Head-to-head wind tunnel test data released by Specialized in 2010 [22].
26Glossary
** Note: terms are terms defined as they are used in this paper. **
Airfoil: The 2D cross-section of a bicycle tube. Typically, this is a streamlined aerodynamic shape defined in the
waterline plane.
Aspect Ratio: The ratio of the major chord (length) to the minor chord (width) of a 2D airfoil. This is a departure from the
aeronautical industry, which defines aspect ratio using the wingspan.
Boundary Layer: The layer of slower-moving fluid immediately next to the airfoil wall.
CFD: Computer software which simulates fluid flows and can be used to predict aerodynamics. Stands for
Computational Fluid Dynamics.
Major & Minor Chord:
End-Effects: The flow across the end of a finite-length airfoil section which generally increases drag and reduces lift [8].
KVF: Trek’s trade name for its breakthrough airfoil design which, at a low aspect ratio, achieves nearly all of the
immense aerodynamic and stiffness benefits of an otherwise impractical high aspect ratio airfoil. Stands for
Kammtail Virtual Foil.
NACA Airfoils: An aircraft wing airfoil designation system first established in the 1930s by the National Advisory Committee
for Aeronautics [20].
Pitch: The vertical angle of tilt of a component. For example, a down tube has a nearly 45˚ pitch.
Reynolds Number: A dimensionless number often used to determine the similarity between different flow scenarios. Since the
Reynolds Number increases with both flow speed and object size, it is much higher for aircraft than bicycles.
Stack and Reach: A measurement system proposed and popularized by Dan Empfield of Slowtwitch.com which focuses on the
vertical height (stack) and horizontal distance (reach) from the bottom bracket of a reference point at the front
end of a bicycle. The most common reference point for frames is the top of the headtube.
Tare Removal: The wind tunnel measures the drag of both the bike and the structures which hold the bike in place. To obtain the
drag of the bike only, the drag of the test structures alone are measured in a separate test and subtracted out. This
method is standard in wind tunnel testing; however, it is not perfectly accurate because it does not account for any
interactions or blockages between the test structure and bicycle. Since removing the tare does not change the drag
difference between of any two bikes, it is an optional step. However, tared data provides a better measurement of
the percentage difference.
Traditional Airfoil: A teardrop-like shape with a pointed or generally tapered tail.
27Glossary
** Note: terms are terms defined as they are used in this paper. **
Waterline: A plane parallel with the ground which slices through a bicycle tube (envision the surface of water if the tube were
partially submerged.) This is the direction of air travel, and thus determines the effective airfoil that the air sees. A
waterline cross section is shown in Figure 2.
Windtunnel Run: The measurement of the aerodynamic forces at a given yaw angle (averaged over fifteen seconds to one minute,
depending on the situation). A typical bicycle test consists of about six runs over a range of yaw angles. A wind tunnel
session consists of many bicycle tests both with and without a rider (pedaling mannequin).
Yaw: The angle between the total airspeed vector and the direction of bicycle motion.
References
[1] Hepperle, Martin. Aerodynamics for Model Aircraft.
http://www.mh-aerotools.de/airfoils/methods.htm (2007).
[2] Lissaman, P. B. S. Low-Reynolds-Number Airfoils. Annual Review of Fluid Mechanics, 15:223-239 (1983).
[3] Ziemnowicz, Christoper. The Origin of the Kammback Design. (2004)
http://academics.concord.edu/chrisz/hobby/80-AMXitems/Information/production/KammbackStory.html
[4] Williams, Stephen. VW Says L1 Hybrid Is ‘Most Efficient’ Car in the World. New York Times Online (2009) http://wheels.
blogs.nytimes.com/2009/09/15/vw-says-l1-hybrid-is-most-efficient-car-in-the-world/
[5] Pulman, Ben. VW L1 Diesel-Hybrid Concept at 2009 Frankfurt Motor Show. Car Magazine (2009) http://www.
carmagazine.co.uk/News/Search-Results/First-Official-Pictures/VW-L1-diesel-hybrid-concept-at-2009-Frankfurt-motor-show/
[6] Deppe, Philipp. The “large wind tunnel” in Untertürkheim.
(2010) http://eblog.mercedes-benz-passion.com/2010/01/the-large-wind-tunnel-in-unterturkheim/
[7] Empfield, Dan. Felt’s Tri Bikes for 2008. Slowtwitch Product Reviews (2008) http://www.slowtwitch.com/Products/Felt_s_
tri_bikes_for_2008_280.html
[8] Shames, Irving, H. Mechanics of Fluids, 4th ed. McGraw Hill (2003).
[9] Eisenbach, Sven and Friedrich, Rainer. Large-eddy simulation of flow separation on an airfoil at a high angle of attack and
Re = 105 using Cartesian grids. Theoretical and Computational Fluid Dynamics 22(3-4):213-225 (2008).
[10] Panton, Ronald L. Incompressible Flow, 3rd ed. John Wiley & Sons, Inc. (2005).
[11] Wind Energy Resource Data. Hawaii Department of Business, Economic Development and Tourism. http://hawaii.gov/dbedt/ert/
winddata/ (Accessed April 2010).
[12] efluids Bicycle Aerodynamics – Lift and Stall. http://www.efluids.com/efluids/bicycle/bicycle_pages/lift_stall.jsp
28[13] efluids Bicycle Aerodynamics – Drag of Blunt and Streamlined Bodies. http://www.efluids.com/efluids/bicycle/bicycle_pages/
blunt.jsp
[14] Celli, Vittorio. Boundary Layer Separation and Pressure Drag. University of Virginia (1997) http://galileo.phys.virginia.edu/
classes/311/notes/fluids2/node11.html
[15] efluids Bicycle Aerodynamics – Golf Balls, Cricket Balls, and Tennis Balls. http://www.efluids.com/efluids/bicycle/bicycle_pages/
sportsballs.jsp
[16] Whitt, Frank R. and Wilson, David G. Bicycling Science, 2nd ed. The MIT Press (1982).
[17] Wind Tunnel Data Released at the Cervélo Brain Bike Dealer Event, which has been archived at http://forum.slowtwitch.com/
gforum.cgi?do=post_view_flat;post=2009701
[18] Trek Bicycles Wind Tunnel Investigation. (2007) http://www.slowtwitch.com/images/Trekwhitepaper1.pdf
[19] Wind Tunnel Data Released by Cervélo, which has been archived at http://i33.tinypic.com/25jjszm.jpg (Accessed April 2010).
[20] Scott, Jeff. NACA Airfoil Series. Aerospaceweb.org (2001). http://www.aerospaceweb.org/question/airfoils/q0041.shtml
[21] Leijonberg, Jonathan. Speed Demon: The Cervélo P4 is the Fastest Bike Ever Built. SAS Airlines (2009) Linked from Cervélo’s
website: http://www.Cervélo.com/reviews/Artikel-SAS.jpg
[22] Wind Tunnel Data Released by Specialized, which has been archived at http://forum.slowtwitch.com/gforum.
cgi?post=2792589;sb=post_latest_reply;so=ASC;forum_view=forum_view_collapsed;;page=unread#unread and at http://i39.
tinypic.com/j786ew.jpg (Accessed April 2010).
29You can also read


