Forest Reference Level 2021-2025: Iceland - National forestry accounting plan - Skógraektin
←
→
Page content transcription
If your browser does not render page correctly, please read the page content below
Forest Reference Level 2021-2025:
             Iceland
       National forestry accounting plan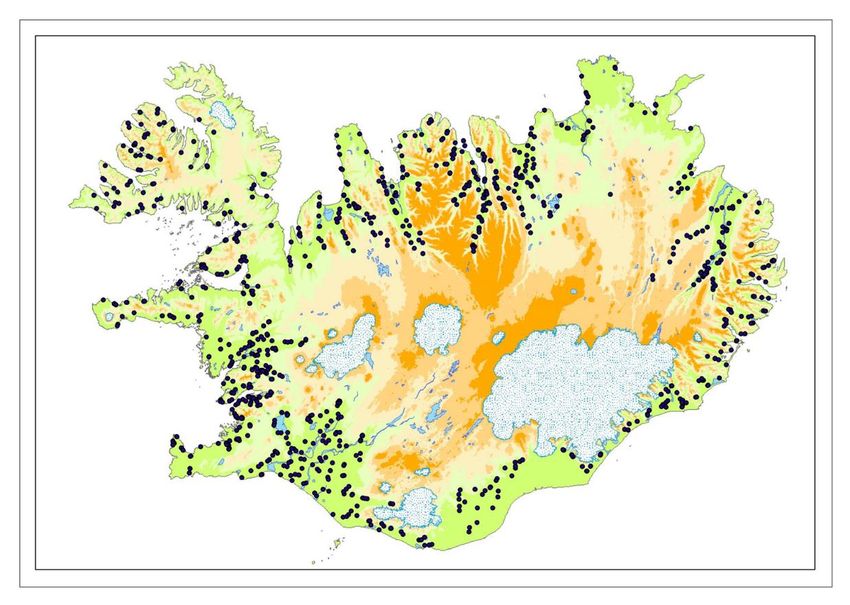
Submitted in accordance with Decision of the EEA Joint Committee No 269/2019 of 25
October 2019

October 2020

Authors: Arnór Snorrason*, Bjarki Þór Kjartansson & Björn Traustason

*Corresponding author

e-mail: arnor@skogur.is

Icelandic Forest Research

Mógilsá

162 Reykjavík

Iceland

ISBN 978-9935-9410-8-4

Picture on cover page: Pétur Halldórsson (petur@skogur.is)

                                             1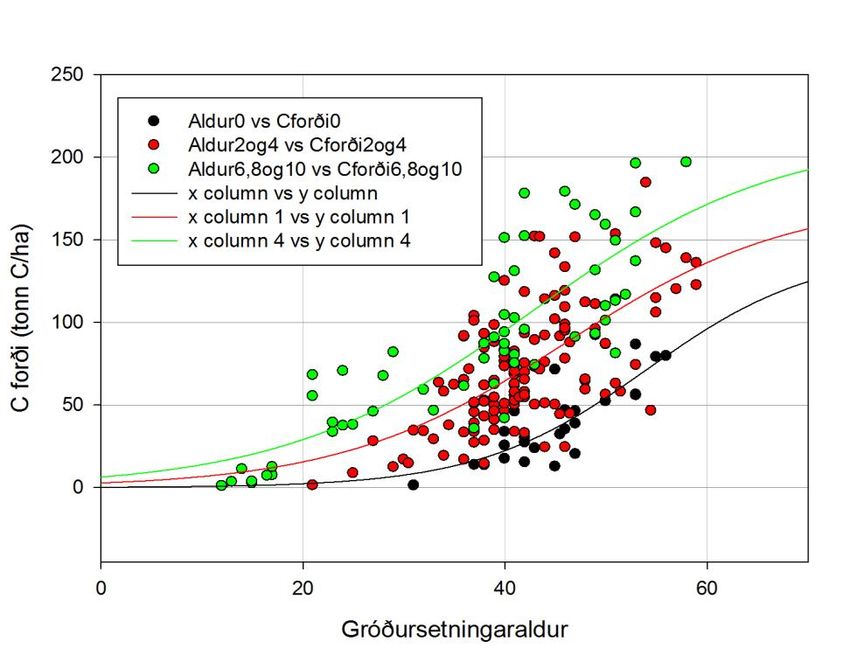
Table of Contents

Contents
Table of Contents ...................................................................................................................... 2
Acronyms and abbreviations ..................................................................................................... 4
Acknowledgement..................................................................................................................... 5
1 General Introduction .............................................................................................................. 6
   1.1        Description of Forest Reference Level....................................................................... 6
       1.1.1 Forest definition ....................................................................................................... 6
       1.1.2 Icelandic National Forest Inventory ......................................................................... 7
       1.1.3 Forest area ................................................................................................................ 7
       1.1.4 Deforestation............................................................................................................ 9
   1.2 Adherence to the criteria set in Annex IV of the LULUCF Regulation ........................... 10
2 Preamble for the forest reference level ............................................................................... 11
   2.1 Carbon pools and greenhouse gases included or excluded in the forest reference level
   ............................................................................................................................................. 11
       2.1.1 Common reporting in subcategories of FrF ............................................................ 11
       2.1.2 Difference in reporting in subcategories of FrF...................................................... 12
       2.1.3 Common reporting of FrF with category LcF .......................................................... 12
       2.1.4 Reporting of Harvested Wood Products (HWP) ..................................................... 14
       2.1.5 Reporting of deforestation ..................................................................................... 14
   2.2 Demonstration of consistency between C pools in the FRL .......................................... 15
   2.3 Description of the long-term forest strategy ................................................................ 15
       2.3.1 Overall description of the forests and forest management and the adopted
       national policies............................................................................................................... 15
       2.3.2 Description of future harvesting rates under different policy Scenarios ............... 16
3 Description of the modelling approach ................................................................................ 18
   3.1 Description of the general approach as applied for estimating the forest reference
   level ..................................................................................................................................... 18
   3.2 Documentation of data sources applied for estimating the forest reference level ...... 18
       3.2.1 Forest area .............................................................................................................. 18
       3.2.2 C-stock in biomass of trees in CF ............................................................................ 20
       3.2.3 Forest management practices ................................................................................ 23
       3.2.4 Harvest data ........................................................................................................... 26
       3.2.5 Documentation of stratification of managed forest land ...................................... 27
       3.2.6 Documentation of sustainable FMP as applied in the estimation of FRL............... 28

                                                                        2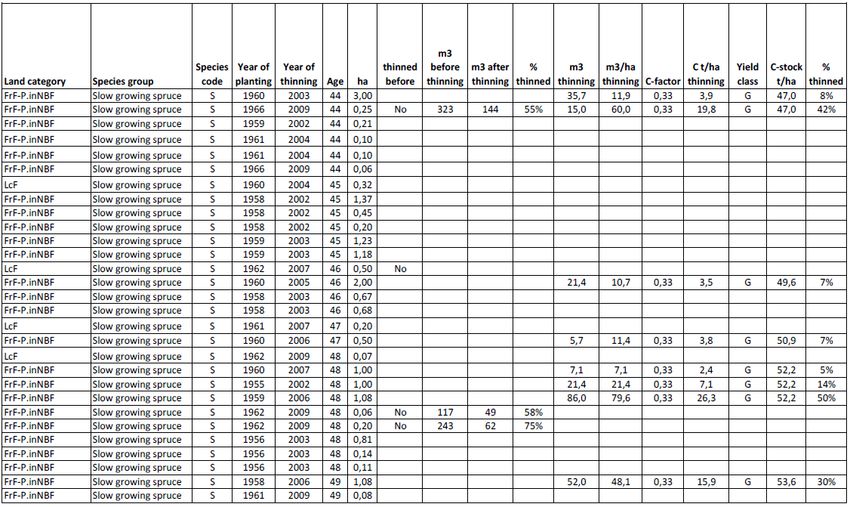
3.3 Detailed description of the modelling framework as applied in the............................. 29
   estimation of the forest reference level.............................................................................. 29
       3.3.1 Natural Birch Forest................................................................................................ 29
       3.3.2 Cultivated forest ..................................................................................................... 30
       3.3.3 Harvested wood products ...................................................................................... 32
4 Forest reference level ........................................................................................................... 33
   4.1 Forest reference level and detailed description of the development of the carbon
   pools .................................................................................................................................... 33
       4.1.1 Area ........................................................................................................................ 33
       4.1.2 GHG emission from drained organic soils .............................................................. 34
       4.1.3 C-stock in biomass .................................................................................................. 34
       4.1.4 C-stock in wood production ................................................................................... 35
       4.1.5 CsC in deadwood .................................................................................................... 36
       4.1.6 C-stock in harvested wood products ...................................................................... 37
   4.2 Consistency between the FRL and the latest national inventory report....................... 38
       4.2.1 C-stock in biomass in stratum CF............................................................................ 38
       4.2.2 CsC and GHG fluxes in other pools and sources than in biomass in stratum CF .... 41
   4.3 Historical and projected harvest rates in FrF ................................................................ 41
   4.4 Calculated CsC and GHG emission for the forest reference level ................................. 43
References ............................................................................................................................... 44
Annex 1: Stands from the cultivated forest of Icelandic Forest Service with cutting activity in
the period 2002-2009 ........................................................................................................... 49

                                                                      3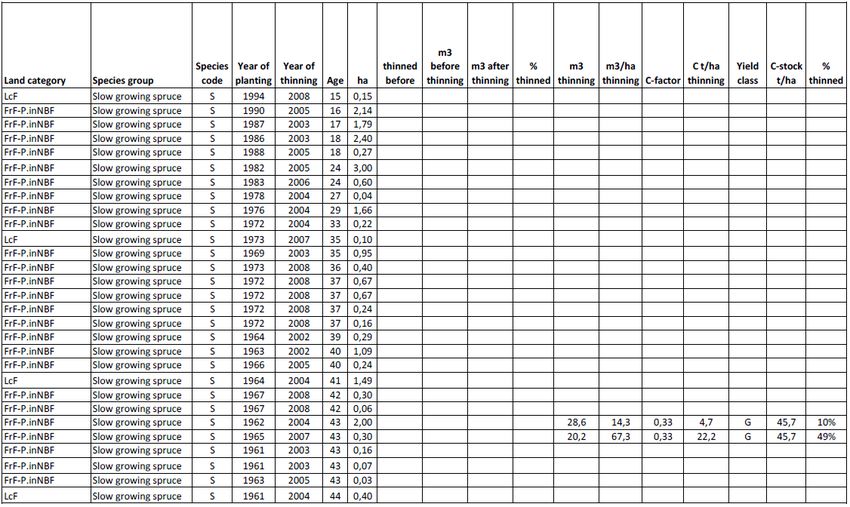
Acronyms and abbreviations

50YCP         50 years conversion period

C             Carbon

CAD           Cutting Activity Database

CF            Cultivated Forest

CP            Compliance Period

CRF           Common Reporting Format

CsC           Carbon stock Change

DW            Deadwood

FAO           Food and Agriculture Organization of the United Nations

FAWS          Forest Available for Wood Supply

FMP           Forest Management Practices

FNAWS         Forest Not Available for Wood Supply

FrF           Forest remaining Forest

FRL           Forest Reference Level

G-FRL         Guidance on developing and reporting Forest Reference Levels

GHG           Greenhouse Gas

GHGR          Greenhouse Gas Reporting

HWP           Harvested Wood Products

IC-GHGR       Icelandic Greenhouse Gas Reporting

IC-GHGR-2016 Icelandic Greenhouse Gas Report submitted 2018 with 2016 as latest
             reporting year

IFR           Icelandic Forest Research

IFS           Icelandic Forest Service

IPCC          Intergovernmental Panel on Climate Change

LcF           Land converted to Forest land

MANR          Mean Annual Net Removal

NBF           Natural Birch Forest

NBW           Natural Birch Woodland

NFI           National Forest Inventory

                                              4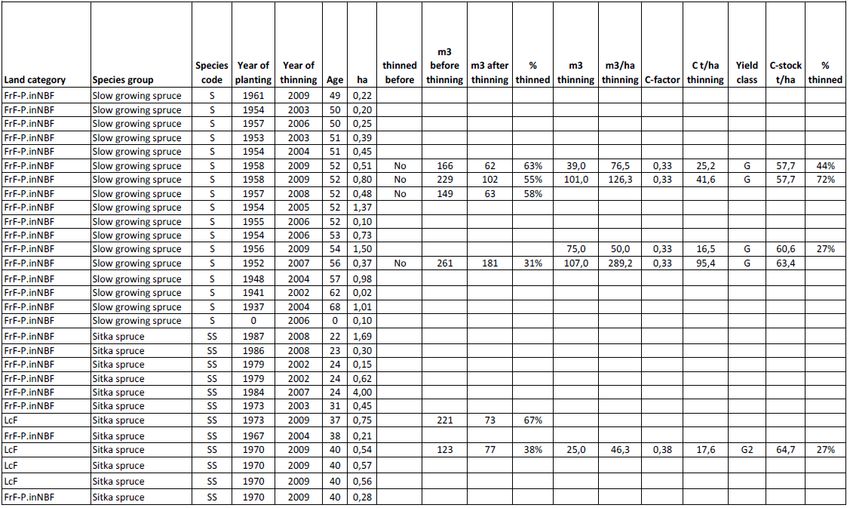
NFS             National Forest Strategy

NFAP            National Forest Accounting Plan

NIR             National Inventory Report

RP              Reference Period (for Iceland 2002-2009)

UNFCCC          United Nations Framework Convention of Climate Change

Acknowledgement
The Forest rangers of the Icelandic Forest Service, Rúnar Ísleifsson, Trausti Jóhannsson,
Valdimar Reynisson and Þór Þorfinnsson provided data about cutting practices in the National
Forests. Forest specialist Lárus Heiðarsson provided data on cutting intensity and advice about
cutting schemes for different tree species. The director of the Icelandic Forest Service, Þröstur
Eysteinsson PhD, reviewed the manuscript of this paper and corrected the language and
numerous other errors. They all get special thanks for their effort.

                                               5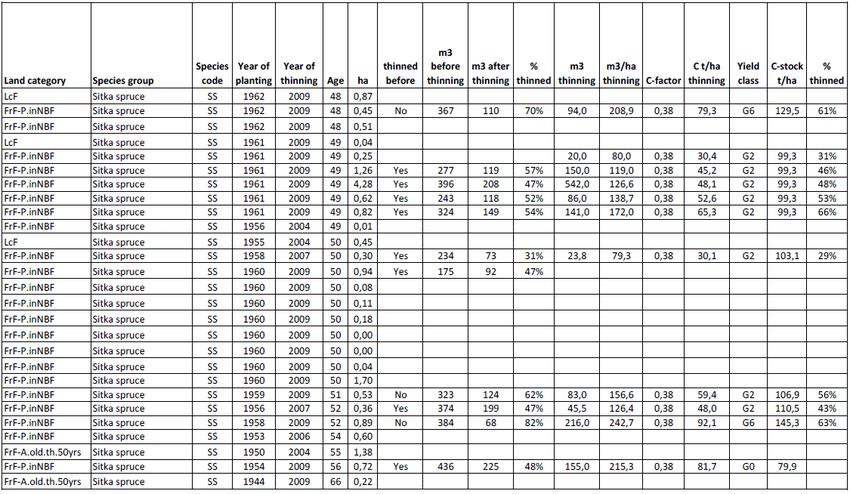
1 General Introduction
In this report, Icelandic Forest Research has by appointment of the Ministry for the
Environment and Natural Resources, made a national forest accounting plan (NFAP) and
proposed a forest reference level (FRL) for managed forest land for the period 2021-2025 as
requested in the EU-Regulation 2018/841 and in accordance to the decision of the EEA Joint
Committee No 269/2019 of 25 October 2019.

A FRL for 50 years conversion period (50YCP) is described as the default FRL suited to fit to the
Icelandic Greenhouse Gas Report where a 50 years conversion period has been used for land
converted to forest (LcF) from the start of LULUCF-reporting instead of a default 20 years
conversion period. The argument for using 50YCP is that in-country research showed a
significant increase in the C stock of mineral soil and litter pool up to 50 years after
afforestation (Bjarnadóttir 2009, Hellsing et al. 2018). In addition, the development of forest
in Iceland on afforested land is a slow process, mainly taking place in exposed environments
under a harsh climate near the polar/mountain forest limit. Use of the 50YCP has been noted
by the Expert Review Team of the UNFCCC without any comment or criticism.

The use of 50YCP in this report is done in line with Article 1 in the Decision of the EEA Joint
Committee No 269/2019 of 25 October 2019.

The proposed Forest Reference Level for the period 2021-2025 is in this report estimated to
-30.345 kt CO2 eq., considering instant oxidation of all harvest and -30.405 kt CO2 eq.
including Harvested Wood Products carbon stock change.

1.1 Description of Forest Reference Level
1.1.1 Forest definition
All woodland defined as forest in the initial report from Iceland (Ministry for the Environment
2006) and reported in the annual greenhouse gas reporting (IC-GHGR) in the National
Inventory Report (NIR) and the Common Reporting Format (CRF) to the United Nations
Framework Convention of Climate Change (UNFCCC) as Forest remaining Forest (FrF) are
subject to the Forest Reference Level (FRL).

In the initial report all woodlands that fulfil these requirements at maturity are defined as
forest; minimum tree crown cover: 10 %, minimum land area: 0.5 ha, minimum tree height: 2
m and minimum area width: 20 m. Tree covered areas are excluded if the ground vegetation
is modified by crop cultivation (cropland) or cultivation of ornamental plants or grass (parks
in settlements etc.). Treeless areas inside forest are defined as forest if they are less than 0.5
ha in area or 20 m in width. This definition is also used in the National Forest Inventory (NFI)
with three subclasses of mature height:

    1. High forest: 5 m or more height at maturity
    2. Regular woodland: 2 – 4.99 m height at maturity
    3. Shrubland: under 2 m height at maturity

All forests, both naturally regenerated and planted, are defined as managed as they are all
affected by human activity.

The natural birch woodland (NBW) is the native woodland of Iceland. It has been under
continuous usage for many centuries. Until the middle of the last century, it was the main
source for fuel wood for house heating and cooking in Iceland (Umhverfisráðuneytið 2007).
Most of the NBW has been used for grazing and still is, although some areas have been

                                                6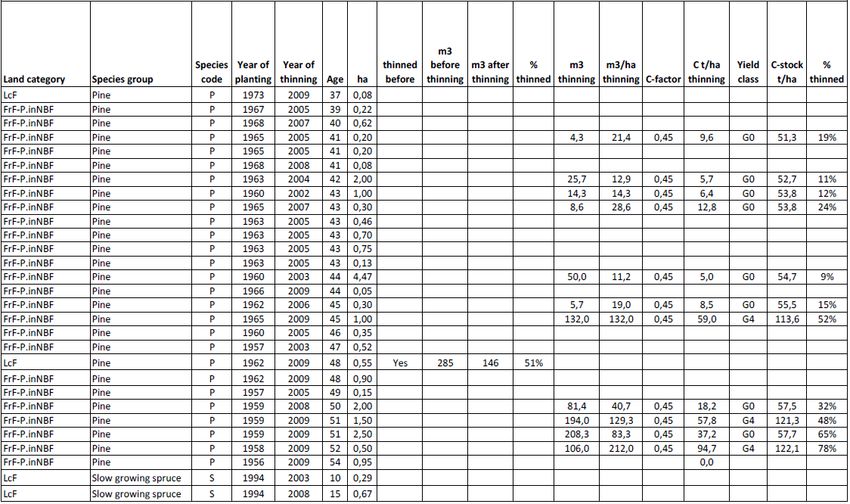
protected from grazing. Cultivated forest (CF) consists of tree plantations and areas cultivated
using direct seeding or from natural regeneration of cultivated forest.

1.1.2 Icelandic National Forest Inventory
Icelandic Forest Research (IFR), the research division of the Icelandic Forest Service (IFS) is
responsible for the Icelandic NFI. In the NFI the NBW is defined as one of the two predefined
strata to be sampled. The other stratum is the CF. The sampling fraction in the NBW is lower
than in the CF. Each 200 m2 inventory plot in NBW is placed on the intersection of a 1.5 x 3.0
km grid, but in the CF the grid is 0.5 x 1.0 km (Snorrason 2010). All plots in the NFI are
permanent. CF-NFI plots are visited on a 5-year interval and every year one fifth of the plots
are visited. NBW-NFI plots are visited on a 10-year interval. The NBW-NFI round takes 5 years
as for the CF with one fifth of the plots visited every year when the inventory is ongoing. The
sample population for NBW is the area of NBW mapped in the field in 2010-2014 (Snorrason
et al. 2016). The sample population of CF is an aggregation of maps of forest management
reports from actors in forestry in Iceland. In some cases, the NFI staff does mapping in the
field of private CF. To ensure that forest areas are not outside the population area, the
populations for both strata are increased with a buffer of mapped border. The current buffer
is 16 m. The third inventory cycle of CF was finished in 2019. The second one of the NBW
(2015-2020) was finished in 2020. The part of NBW defined as forest (reaching 2 m or greater
in height at maturity in situ) is estimated based on the NBW 2010 – 2014 map and is defined
as Natural Birch Forest (NBF).

1.1.3 Forest area
The category of FrF in the IC-GHGR has three subcategories:

1. NBF older than 50 years (87.633 kha in 2016): By analysing the age structure in the NBW
   that does not merge geographically with the old map from a survey in 1987-1991, it was
   possible to re-estimate the area of NBW in 1987-1991 and in 2010-2014. Results of these
   estimates where that the area was 137.69 kha at the time of the initial survey in 1987-1991
   (Snorrason, et al. 2016). Earlier analyses of the 1987-1991 survey resulted in 115.40 kha
   (Traustason and Snorrason 2008). The difference is the area that was missed in the earlier
   survey. The estimated area of NBW was 150.65 kha in the 2010-2014 survey. The
   difference of 12.95 kha is an estimate of a natural expansion over the period of 1989 to
   2012 (23 years) where the midyears of the two surveys are chosen as reference years. In
   the new map of 2010-2014, the ratio of NBW that can reach 2 m height at maturity and is
   defined as forest (NBF) was 64% of the total area. NBF is accordingly estimated to have
   been 87.72 kha in 1989 and 95.97 kha in 2012, the former figure categorizing NBF classified
   as FrF in GHGR and the differences between the two figures (8.25 kha) as NBF classified as
   Land converted to Forest land (LcF) with mean annual increase of 0.36 kha.
   Even though this subcategory is named NBF older than 50 years it consists of woods in
   different dominant age classes. It can be difficult to assess the age of the NBW as they are
   often without clear age structure and with more than one tree layer in the same area.
   Despite that, the age of the dominant tree layer was assessed in the mapping survey of
   2010-2014 (Snorrason, et al. 2016). To test the accuracy of this assessment, core and disk
   samples were taken from subsamples of mapped woodland units. Estimated age classes of
   NBF older than 50 years is shown in Figure 1.

                                               7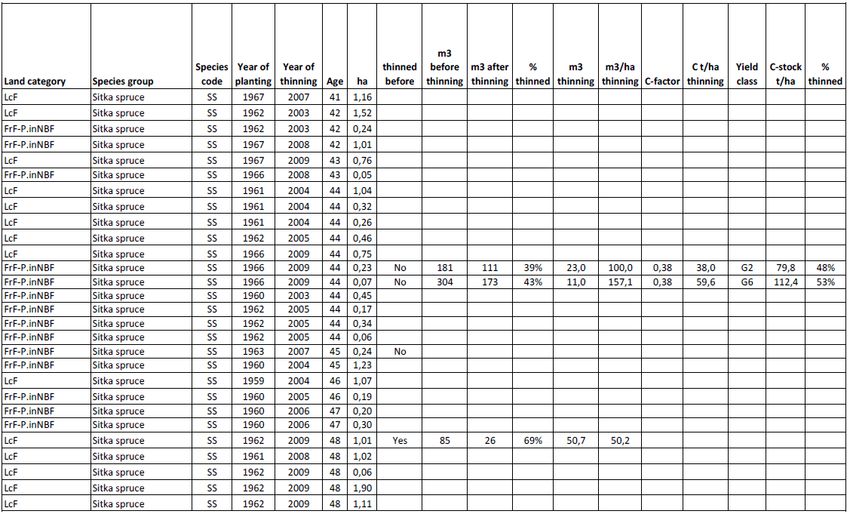
60

             50

             40
       kha

             30

             20

             10

             0
                     ≤15           16-30          31-60          61-100          >100
                               Age class of dominant tree layer (in years)

Figure 1. Age classification of the NBF by age classes of dominant tree layer.

2. Plantations in NBF (1.18 kha in 2016): These are forests that have been converted from
   NBF to CF by plantation, mostly of introduced conifer species. They are covered by the CF-
   NFI and the area is estimated based on the sample plot inventory of the CF. Plantation in
   NBF was practised in the early years of forestry but NBFs are now generally protected
   under both the Nature Conservation and Forestry Acts. The youngest new plantation
   reported in sample plots is from 2004. Conversion timing is the year of plantation that was
   often done after light thinning of the NBF but leaving the birch canopy largely intact. Later
   if the plantation was successful the natural birch was removed. CF takes precedence over
   NBF which means that if canopy cover of the plantation will reach 10% at maturity the
   forest will be defined as CF despite higher current natural birch cover.
3. Afforestation older than 50 years (0.97 kha in 2016): These are forests that where
   cultivated on other land than forest more than 50 years ago. They are covered by the CF-
   NFI and the area is estimated based on the sample plot inventory of the CF. Forests under
   LcF are moved into this category when they reach the age of 51 years. Age is defined as
   year since plantation plus one year as the majority of planting is done in spring before the
   growing season.

                                                    8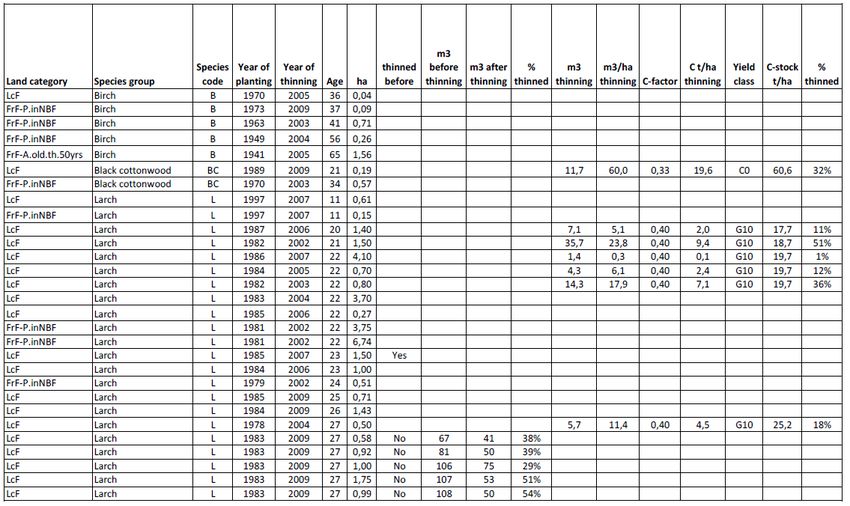
Table 1. shows the development of the forest area (in kha) in Iceland divided into Forest remaining
forest and Land converted to forest and its subclasses from 2000 to 2016. A>50: Afforestation older
than 50 years; P NBF: Plantations in Natural Birch Forest; NBF>50: Natural Birch Forest older than 50
years; A≤50: Afforestation 50 years or younger; NBF≤50: Natural Birch Forest 50 years or younger.

                    Forest remaining forest               Land converted to forest          Total
            A>50     P NBF    NBF>50        Sum           A≤50    NBF≤50      Sum          Forest
  2000      0.18      1.16      87.72       89.06         18.92     3.95      22.87        111.93
  2001      0.18      1.16      87.72       89.06         20.01     4.31      24.32        113.38
  2002      0.18      1.16      87.72       89.06         22.23     4.66      26.89        115.95
  2003      0.18      1.16      87.72       89.06         24.69     5.02      29.71        118.77
  2004      0.18      1.18      87.72       89.08         25.95     5.38      31.33        120.41
  2005      0.26      1.18      87.72       89.16         28.24     5.74      33.98        123.15
  2006      0.26      1.18      87.72       89.16         29.63     6.10      35.73        124.89
  2007      0.26      1.18      87.72       89.16         30.93     6.45      37.38        126.54
  2008      0.37      1.18      87.72       89.27         32.38     6.81      39.19        128.46
  2009      0.37      1.18      87.72       89.27         34.19     7.18      41.37        130.64
  2010      0.66      1.18      87.72       89.56         35.11     7.54      42.65        132.21
  2011      0.69      1.18      87.72       89.59         36.09     7.90      43.99        133.58
  2012      0.74      1.18      87.72       89.64         36.81     8.25      45.06        134.70
  2013      0.80      1.18      87.72       89.70         37.62     8.61      46.23        135.93
  2014      0.80      1.18      87.72       89.70         38.41     8.97      47.38        137.08
  2015      0.97      1.18      87.71       89.81         39.13     9.33      48.46        138.32
  2016      0.97      1.18      87.71       89.86         39.58     9.69      49.27        139.13

1.1.4 Deforestation
In accordance with article 19 of the Icelandic Forestry Act (Alþingi 2019), the IFS and the
National Planning Agency hold a register on planned activity that can lead to deforestation
(Skógræktin and Skipulagsstofnun 2017). Planned activities that lead to deforestation must be
reported by the municipalities to the IFS before giving formal permission to conduct
deforestation. IFR samples activity data of the affected areas and data about the forest that
has been removed. This data is used to estimate emissions from lost biomass and C- stock in
litter and soils. Deforested area from FrF is then excluded from the FRL.

                                                 9
1.2 Adherence to the criteria set in Annex IV of the LULUCF Regulation
The criteria and guidance for establishment of FRL are set out in section A of Annex IV of the
EU-Regulation 2018/841. Table 2 below cross-references sections in this document which
address adherence to the criteria as set out in Annex IV with specific reference to paragraphs
under section A.
Table 2: Summary and cross-reference to text addressing specific criteria as set out in section A of Annex
IV of the EU-Regulation 2018/841.
Paragraph Description Reference in Comment
in section the report
A
a Balance between Ch. 2.3.2. Projected afforestation up to
emissions and removals Fig. 2 2130 shows substantial
and enhancement of increase in net CsC in the
forest sinks in the second period 2050 - 2100
half of this century
b Mere presence of C Table 12 By following the methodology
excluded from given in the Guidance on
accounting developing and reporting
Forest Reference Levels, this
criterion is met for FrF
c Robust accounting See comment for paragraph b
system
d Inclusion/exclusion of Table 12 Final FRL is presented both
Harvested Wood with and without applying first-
Products order decay function and half-
life values
e Assumed constant ratio Mean ratio of 3.1% of C-stock
between solid and Ch. 4.1.6 in HWP of the C-stock total
energy use of forest wood production in RP used
biomass constantly in estimating CsC in
HWP C-pool in the modelling
period
f Conservation of Ch. 2.3.1 Clear sustainability with
biodiversity and Ch. 2.3.2 planned substantial increase in
sustainability Fig. 2 forest area and C-seq.
Fig. 3 99% of NBF under conservation
and erosion protection
management. Afforestation
plans take into account nature
protection etc.
g Consistency with national Ch. 2.3.2.
projection reporting
under EU Regulation
523/2013
h Consistency with national Ch. 4.2 This is met by passing tests of
inventory validation.
102 Preamble for the forest reference level
2.1 Carbon pools and greenhouse gases included or excluded in the forest
reference level
When predicting greenhouse gas fluxes and constructing the FRL, the main rule followed was
to use the same Carbon pools and greenhouse gases as reported in the submission of GHGR
from Iceland to the UNFCCC, published in 2018 with 2016 as the last reporting year (Hellsing,
et al. 2018). In this paper it will be referred to as IC-GHGR-2016. This was done to make
comparison of projected GHG emission/removals to reported figures possible.
Table 3 gives an overview of Carbon pools and gasses included and excluded in the IC-CGCR-
2016 for FrF and in the FRL estimation. Further information and explanations are given in
subchapters below.
Table 3: Carbon pools and greenhouse gasses included and excluded in the IC-GHGR-2016 for FrF and
in the FRL estimation. I = included, E= excluded, IE: Included elsewhere.
Natural birch forest Cultivated forest
GHGR FRL GHGR FRL
Biomass
Trees I I I I
Gain I I I I
Loss IE* IE* I I
Other veg. E E E E
Litter E E E E
Dead wood I I I I
Soil
Mineral E E E E
Organic I I I I
CO2 I I I I
N2O I I I I
CH4 I I I I
HWP I I I I
*See explanation in Chapter 2.1.2.1 below.
In general, the methods used to estimate Carbon stock changes (CsC) in different sources are
more simple than those used in many other more forested countries in Europe where the FrF
category plays a much bigger role in the LULUCF bookkeeping than in Iceland. In IC-GHGR-
2016 the FrF was not defined as a Key source category, neither in size nor trend.
2.1.1 Common reporting in subcategories of FrF
2.1.1.1 Litter and mineral soil
In the IC-GHGR-2016, CsC of the litter and mineral soil pools was reported as not estimated
(NE). For LcF country specific removal factors were used, built on in-country research. No
evidence from research literature exists for FrF in Iceland, but models and model
modifications used in other Nordic countries show increase in litter and mineral soil pools in
the long run (Dalsgaard et al. 2016). In the newest GHGR, CsC for litter and mineral soil pools
in FrF was reported as not occurring (NO), at least until in-country research shows otherwise.
11Accordingly, C-pools of litter and mineral soil were excluded from the FRL. Emissions of other
gases than CO2 were also reported as not occurring (NO) for litter and mineral soil and
excluded from the FRL.
2.1.1.2 Organic Soil
Emissions from organic soil were calculated by default factors for drained organic soil from
the IPCC 2013 Wetlands supplement (for CO2 and CH4) (IPCC 2013) and by a country specific
factor for N2O (Guðmundsson 2009). It was reported in IC-GRGR-2016 and was accordingly
included in the FRL.
2.1.2 Difference in reporting in subcategories of FrF
Reporting of gains and losses of biomass is different between subcategory NBF and the two
other CF subcategories.
2.1.2.1 NBF older than 50 years
CsC of biomass are estimated by the stock difference method of the 2006 IPCC guidelines (IPCC
2006). Total biomass in two different periods is compared and the difference between the two
periods is an estimate of the net CsC including both gains and losses. That is the reason why
biomass losses are registered as IE (Included elsewhere) in Table 3 above. The two years
compared are 1987 and 2007. Estimated mean annual removal of the C-stock pool of biomass
was -13.13 kt CO2 eq. (IC-GRGR-2016). Direct extrapolation of the mean annual removal is
used for years beyond 2007.
2.1.2.2 Plantations in NBF and Afforestation older than 50 years
These two subcategories were handled together and the CsC accounted with the more
commonly used method of separate estimate of gain and loss. Biomass stock in other
vegetation than trees is supposed to be not changing in the long run. Research results show
that fluctuation in the stock of other vegetation with changing forest age evens out over the
rotation (Sigurdsson et al. 2005). CsC in other vegetation than trees is therefore excluded.
2.1.2.2.1 Estimation of biomass gain
Aboveground biomass of living trees measured in a sample plot in the NFI is compared to the
aboveground biomass of the same trees measured 5 years ago. Change in the size of single
trees between NFI measurements is defined as the CsC gain. Country specific single tree/stem
equations are used, most of them species specific (Snorrason and Einarsson 2006, Bjarnadottir
et al. 2007, Jónsson 2007, Hunziker 2011). Different equations for different size of trees are
used, but when changes are calculated the same equation has to be used. Biomass below
ground is either estimated by root/shoot ratio described in country specific literature (20/80)
(Snorrason et al. 2002) or by country and species specific equations (Hunziker 2011).
2.1.3 Common reporting of FrF with category LcF
Both biomass loss and the deadwood pool of the two CF subcategories in FrF are, in IC-GHGR-
2016, reported as included elsewhere (IE) and only reported under subcategory Grassland
converted to Forest – Afforestation 1-50 years old on LcF, together with reporting of dead
wood and biomass losses. In a similar manner the estimation of harvested wood products was
not divided between FrF and LcF in IC-GHGR-2016.
2.1.3.1 Deadwood
CsC to the deadwood (DW) pool is reported when DW meeting the definition of lying DW
(diameter ≥ 10 cm and length ≥ 1.3 m) is found on sample plots in the NFI. Its initiation year is
also assessed up to 5 years back. At the initiation year (year of dying) the C-stock of DW is
12reported as loss of C from the biomass pool. Loss of C from the DW pool is calculated only if
the DW is totally decomposed and not registered again. DW occurrence in plots is very rare
and CsC to the DW pool is not reported for every year in the IC-GHGR-2016. Deadwood was
first registered for the year 2002 in the CF-NFI. Deadwood has never been reported in NBF
plots. Future improvement is needed to include deadwood in stumps, root stock and standing
dead trees and to include continuous decomposition of all deadwood. Hence, technical
correction of FRL is to be expected regarding DW.
2.1.3.2 Biomass loss from harvest
In the IC-GHGR-2016, loss of biomass from harvest is estimated from annual reporting of
production of wood sold on the commercial wood market in Iceland as reported in the Journal
of the Icelandic Forest Association (Gunnarsson and Brynleifsdóttir 2017). Only the C-stock of
annual roundwood production and DW is reported as loss. Improvement of the biomass loss
calculation that will include other parts of cut trees and natural mortality figures is planned.
These improvements will lead to future technical correction of the FRL.
132.1.4 Reporting of Harvested Wood Products (HWP)
The only HWP category reported in IC-GHGR-2016 is sawnwood. Production of the two other
product classes from domestic wood does not exist. FAO statistics from the Icelandic statistics
agency (Statistics Iceland) are incomplete and not usable as data feedstock into the domestic
HWP pool. Instead the annual report of production of wood, sold on the commercial wood
market in Iceland as reported in the Journal of the Icelandic Forest Association is used as a
source. There, sold sawnwood classified by tree species or species groups is reported. No
records are found on export of domestic sawnwood and the statistic of the Icelandic Forest
Association does only cover production of domestic sawnwood excluding totally imported
sawnwood or sawnwood originating from imported roundwood. Table 4 shows annual
amount of sawnwood compared to total amount of wood produced. Table 4 is identical to
Table 6.8 in the IC-GHGR-2016 National inventory report (Hellsing et. al 2018).
Table 4: Amount of sawnwood compared to total amount of wood produced for the period 1996 - 2016.
Year Wood total Sawnwood
o.b. m3 m3 % of total
1996 403 9 2.1%
1997 314 18 5.7%
1998 308 5 1.7%
1999 309 9 2.8%
2000 326 6 1.7%
2001 286 7 2.3%
2002 458 11 2.3%
2003 620 9 1.4%
2004 537 10 1.8%
2005 961 6 0.6%
2006 884 6 0.7%
2007 642 27 4.2%
2008 1.444 21 1.5%
2009 1.528 46 3.0%
2010 4.185 50 1.2%
2011 3.845 112 2.9%
2012 3.459 93 2.7%
2013 5.511 93 1.7%
2014 5.923 165 2.8%
2015 4.744 64 1.3%
2016 4.182 133 3.2%
It should be noted that part of the total harvest is from thinnings in forest younger than 50
years which do not belong to FrF category. On the other hand, all sawnwood originates from
FrF category. The first order decay model as described by IPCC was used to estimate CsC in
the HWP pool (IPCC 2014). The same methods were used in the FRL prediction of HWP. All
other domestic harvest was defined as for energy use, using instant oxidation in calculations.
2.1.5 Reporting of deforestation
As already mentioned, every deforestation event is reported. In general deforestation is rare
and, in the IC-GHGR-2016, a new deforestation event is not reported every year. Deforestation
events can easily be classified into forest land categories as used in IC-GHGR. Emissions from
biomass loss are estimated on the basis of information sampled in or near the forest removed.
Emissions from litter and soil follow the default Tier 1 method described in the IPCC GPG 2006.
An in-depth description of methodology and calculations of country wise litter and SOC-stock
14estimations is found in Chapter 6.5.2.2 and 6.8.2.2 in IC-GHGR-2016. The mean annual area
moved from FrF to Deforested area was assumed to be the same as was reported in the IC-
GHGR-2016 for the period 2002-2016 as described in Alternative 2 in Box 19 in the Guidance
on developing and reporting Forest Reference Levels (G-FRL) (Forsell et al. 2018).
2.2 Demonstration of consistency between C pools in the FRL
Transfer of C-stock between C-pools is described in detail in Chapter 3. The IC-GHGR-2016 was
not totally consistent and all gaps and incompleteness are described in Chapter 3. To maintain
as much consistency and comparability as possible between IC-GHGR-2016 and estimation of
FRL, the same data sources and estimation methods were used wherever possible. New
sources of data, such as cutting activity data and C-stock growth curves, were carefully
examined to understand how their relationship and fit was to already used data sources in IC-
GHGR-2016.
2.3 Description of the long-term forest strategy
2.3.1 Overall description of the forests and forest management and the adopted
national policies
New forest legislation passed the Icelandic Parliament in 2019, replacing the old legislation
from 1955 and the specific legislation on the regional afforestation programs from 2006.
Among the lead policy instruments the new forest act creates and sets legal basis for a
comprehensive National Forest Strategy (NFS). A working group nominated by the Minister
for the Environment and Natural Resources is working on the first NFS which is planned to be
published in the year 2021. The new NFS will further pave the way forward and sharpen the
vision for the future of forestry in Iceland.
The new Icelandic forest law prohibits clearcutting without formal permission from IFS.
Deforestation without permission is also prohibited. Unavoidable deforestation shall be
compensated by afforestation. As already mentioned in Chapter 1.1.4 all planned
deforestation is notifiable and must be approved by the IFS. The new forestry act implements
an official cutting licence system to regulate cutting activity in accordance with the main goal
of sustainable use of wood resources in the forest. Requirements for reforestation after felling
are strengthened as well.
One of the main goals of the new forestry act is to protect and restore biodiversity. To prevent
negative effect of afforestation on biodiversity, all planned forest plantations must consider
nature protection, antiquities preservation and landscape influences, to be in accordance with
NFS as described in article 4 of the forestry act.
The afforested area in Iceland is increasing every year as can be seen in the IC-GHGR-2016.
The government of Iceland has launched an action plan and put more resources into measures
to mitigate climate change (Verkefnisstjórn aðgerðaáætlunar í loftslagsmálum 2018). One of
these measures is accelerated afforestation. In July 2019 the Ministry for the Environment and
Natural Resources issued a more detailed plan which includes the highlights for LULUCF
operations 2019-2022 (Umhverfis- og auðlindaráðuneytið 2019). This includes increasing
annual afforestation from 1.100 ha in 2018 to 2.300 ha in 2022. The main emphasis is on
increasing support for the farm afforestation grants scheme.
152.3.2 Description of future harvesting rates under different policy Scenarios
Future rates of harvest are derived using a silvicultural forecast as used for the FRL. A new
prediction of the net CO2 sequestration of two scenarios of afforestation since 1990 was
published early 2018 (Snorrason and Brynleifsdóttir 2018). The scenarios where business as
usual and quadrupled afforestation from the year 2023 (Figure 2). Same projections were used
in the first voluntary report from Iceland on national projections of anthropogenic greenhouse
gas emissions provided to the European Environmental Agency submitted in 15th of March
2019 (Helgadóttir et al. 2019). In the report, the business as usual projection was defined as
“Projection with existing measures” (WEM) and the quadrupled projection as “Projection with
additional measures” (WAM). These two scenarios were interpreted as results of two different
forestry policies although a final decision on long-term afforestation had not been taken by
the government in Iceland when these projections were done. Later the government decided
to a double annual afforestation rate from BAU until 2023 as already described in chapter
2.3.1 above. That strategy was restated in a new Climate Action Plan published in June 2020
(Verkefnisstjórn aðgerðaáætlunar í loftslagsmálum 2020).
Figure 2. Net annual CO2-eq. sequestration of two scenarios of afforestation since 1990. Removals are
shown as positive figures as in the referred article (Snorrason and Brynleifsdóttir 2018). Stippled lines
show projected annual harvesting rates of roundwood as CO2-eqvivalents.
Figure 2 shows that steady afforestation will result in significant and stable net annual CO2
sequestration.
The projected development of annual increment of the growing stock and the harvest for the
two scenarios are shown in figure 3.
16Figure 3. Projected annual increment of growing stock of the two scenarios of afforestation since
1990. Stippled lines show projected annual harvesting rates.
Even though the ratio between growing stock and possible harvest vary from one year to
another, a rather good balance will be achieved after 2050. The prediction follows the
sustainable goal of the new forestry act, that the annual harvest in Icelandic forests shall not
exceed their annual increment.
173 Description of the modelling approach
3.1 Description of the general approach as applied for estimating the forest
reference level
Iceland followed these main guidelines when making the FRL:
1. Use the same calculation methods as in the Framework estimates (IC-GHGR-2016)
2. For the NBF:
a. Use extrapolation of NFI based stock change results
b. Use data from the IFS Forest rangers to estimate cuttings in RP from NBF
3. For CF:
a. Use NFI plot data directly and neglect statistical sampling error
b. Predict the change in biomass C-stock of each plot or plot segment separately
c. Use data from annual report of production of wood, sold on the commercial
wood marked in Iceland as reported in the Journal of the Icelandic Forest
Association to estimate total harvest in the RP
d. Use data from the IFS Forest rangers to estimate stratified share of cuttings
between FrF and LcF, cutting type and the cutting system of CF in RP
IFR started its systematic sample plot inventory in 2005. Because of the continuous 5 years
inventory rounds of the CF inventory a midyear approach is used to estimate annual C-stock
gain of biomass in the GHGR. As 5 previous year’s growth was estimated in the first inventory
of 2005-2009 it is possible to estimate the C-stock five years back from the first 5 inventory
years and calculate a midyear estimate down to 2002. Estimates beyond that in the GHGR (for
2001 and earlier) were made by rather weak modelling and not suited to build FRL estimates
on. For that reason, the RP for Iceland was shortened to cover the period of 2002-2009 (8
years instead of 10 years).
3.2 Documentation of data sources applied for estimating the forest
reference level
3.2.1 Forest area
3.2.1.1 Natural birch forest older than 50 years
The area of NBF defined older than 50 years was previously documented in Chapter 1.1. As its
expansion was assumed to start at year 1989 the area will not increase before 2039. On the
other hand, the area is predicted to decrease because of deforestation, as deforestation has
been reported in 2002-2016.
3.2.1.2 Subcategories of Cultivated forest (CF)
Subcategories of cultivated forest under FrF are handled together. Area estimation is built on
the representation of systematic sampling plots of the NFI where each whole plot represents
50 ha. If the plot is partly inside forest its representation of area is assumed to be the ratio
between plot area and the area of the plot inside forest. Hence, a plot 50% inside forest
represent 0.5 x 50 ha = 25 ha. Plots can contain not just area with trees but also area inside
forest that are temporarily or permanently without trees. Different land-type classes are given
in Table 5. Land-type classes prescribed by the letters S and O are defined as forest. Land-
types with the letter U are outside forest. Plots that are split between land-type classes or
different forest cohorts are mapped into segments in the field. Area representation of land-
type segments is calculated as area representation of plots partly inside forest as described
above. The first five classes (100-400) are currently stocked forest area and the first eight
18classes are supposed to be stocked most of the time (100-700). Other classes are supposed to
be unstocked at least in the nearest future. The area of land-type classes 100-700 is defined
here as the net area of forest and the area of classes 100-2500 as the gross area of forest. The
ratio between gross and net forest area of CF-NFI data used in IC-GHG-2016 was 1.26 where
treeless area was 21% and tree-covered area was 79%.
Table 5: Land-types used to describe plots or plot-segments in the NFI of CF.
ID Land-type class ID Land-type class
0 Undefined 1700 O-Garden 500-5000m2
100 S-Tree cover < 1.3 m in height 1800 O-Buildings 500-5000m2
200 S-Tree cover 1.3 -2 m 1900 O-Lake 5 m 2200 O-Road 4-20m
500 S-Clearcut area 2300 O-E.line3.2.2 C-stock in biomass of trees in CF
C-stock is estimated at the same time as C-stock change in biomass as described above in
chapter 2.1. C-stock as estimated from the NFI data in the inventory 2005-2009 was used as
an initial C-stock in the process of predicting the historical (from initiation year down to 2002)
and future (from initiation year up to 2025) C-stock for all plot segments with tree cover.
Predictions were made by using curves that show changes in biomass C-stock, above and
below ground, of trees by age. These curves were derived from data sampled by forest
mensuration on sites evenly spread around the country in the years 1999-2001 (Snorrason
and Einarsson 2001, Snorrason et al. 2001, Snorrason et al. 2001, Snorrason and Einarsson
2002, Snorrason et al. 2002). Figure 4 shows the dispersion of measuring sites around Iceland.
Figure 4. Black spots show dispersion of measuring sites in the tree growth survey of 1999-2001. A
total of 1940 plots were measured.
20Sites of eleven tree species where measured:
1. Downy birch (Betula pubescens Ehrh.)
2. Black cottonwood (Populus trichocarpa Torr. & Gray)
3. Rowan (Sorbus aucuparia L.)
4. Feltleaf willow (Salix alaxensis Cov.);
5. Darkleaved willow (Salix myrsinifolia Salisb.).
6. Sitka spruce /Lutz spruce (Picea sitchensis (Bong.) Carr.) / (Picea × lutzii Little)
7. Engelmann spruce (P. engelmanni Parry)
8. White spruce (P. glauca (Moench) Voss.)
9. Norway spruce (P. abies (L.) Karst.)
10. Lodgepole pine (Pinus contorta Dougl.)
11. Siberian larch (Larix sibirica Ledeb.)
Of the 1940 measurements, 1340 were useable to study the relationship between age and C-
stock and make growth curves for different species. Country specific yield studies for birch,
lodgepole pine and larch together with yield curves from the United Kingdom were used as a
proxy for making growth curves for five species/species groups (Ragnarsson and Steindórsson
1963, Hamilton and Christie 1971, Heiðarsson 1998, Juntunen 2010).
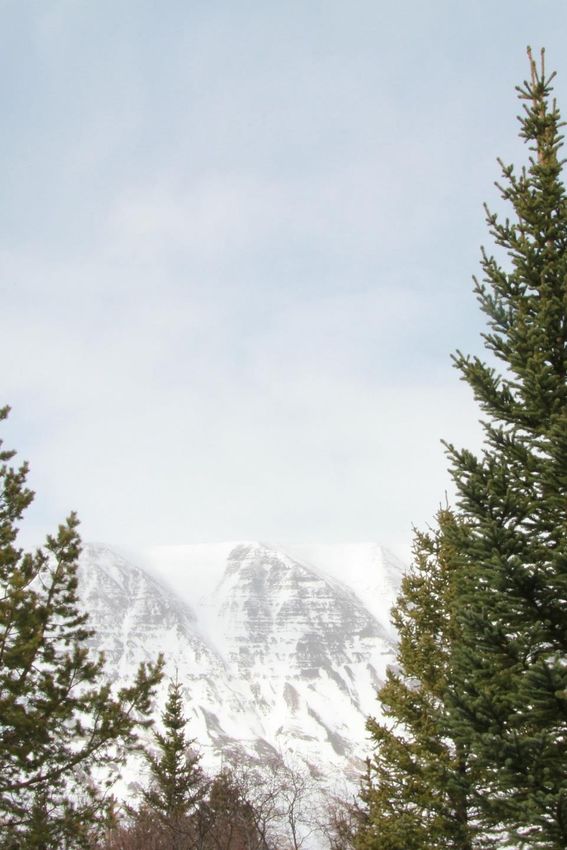
Figure 5 shows how measurement sites where classified into yield classes by the relationship
between top height and year from planting (age). The example shown is for Sitka spruce. After
classification, age of sites was plotted against C-stock in trees (above and belowground) and
sigmoidal curves made by iteration, as shown in Figure 6. In that way it was possible to make
three different growth curves for Sitka spruce. One for yield classes 6, 8 and 10; one for classes
2 and 4 and one for sites with yield less than class 2. Below, species/species classes and
numbers of growth curves made for each class are shown:
1. Downy birch: 2 curves
2. Black cottonwood: 3 curves
3. Sitka spruce: 3 curves
4. Slow growing spruces (P. abies, P, engelmanni, P. glauca): One curve
5. Lodgepole pine: 2 curves
6. Siberian larch: 2 curves
7. Fast growing willows: 1 curve
21Figure 5. Measurement sites of Sitka spruce from the 1999-2001 survey classified into yield classes by
the relationship between top height and year from planting (planting age).
C-stock t/ha
Year from planting
Figure 6: Measurement sites of Sitka spruce from the 1999-2001 survey classified into 3 yield classes
where age of sites is plotted against C-stock in trees (above- and belowground) and sigmoidal curves
fitted by iteration.
223.2.3 Forest management practices
Modern silviculture is at a starting phase in Iceland. Literature about forest management
practices is very limited. General information in English about forestry in Iceland is available
at the website of IFS (https://www.skogur.is/en/forestry/forestry-in-a-treeless-land).
It was a challenge to gather information about forest management practice (FMP) activities in
the RP. Wood cutting activities in the National Forests of the IFS was used as a proxy of FMP
in Iceland. The IFS operate four Forest Ranger regions, in West, North, East and South Iceland.
Two of the Forest Rangers of IFS, in the North and East, hold rather good registers over cutting
activities published in their annual reports (https://www.skogur.is/is/um-
skograektina/utgefid-efni/arsskyrslur-skogarvarda). Data for the South and West regions are
not as good, but the forest rangers have sampled information of cutting activities in these
regions as well.
There is a long tradition of wood usage from the NBW but in modern times only the IFS
practice small-scale wood extraction from the NBF with a selective cutting system where there
is removal of larger trees on a cycle of ca. 60-100 years. This is only practised in North and East
Iceland where high stature birch forest grows. From 1990 to 2016 around 170 ha were cut
yielding 3465 m3 of birch logs. The average annual cut was 120 m3. In the RP the wood removal
was 957 m3 with an average annual cut of 122 m3. As shown in Figure 7 there is an interannual
variation that can be explained by the other source of birch wood originating from plantations
in NBF where the birch is felled in shelterwood felling (canopy felling) to give way for planted
conifers. When looking at total annual birch wood removals from the North and East region
the interannual variation is small (Figure 8).
350
300
250
200
m3
150
100
50
0
2003
2012
1990
1991
1992
1993
1994
1995
1996
1997
1998
1999
2000
2001
2002
2004
2005
2006
2007
2008
2009
2010
2011
2013
2014
2015
2016
Figure 7. Birch wood harvested from NBF.
23450
400
350
300
250
m3
200
150
100
50
0 2000
2009
1990
1991
1992
1993
1994
1995
1996
1997
1998
1999
2001
2002
2003
2004
2005
2006
2007
2008
2010
2011
2012
2013
2014
2015
2016
Figure 8. Birch wood harvested from NBF and CF plantations in NBF.
To explore cuttings in CF a list of thinnings and clear cuttings in the RP (2002-2009) was
constructed from data from all four regions of IFS (See Annex 1 in this report). Thinned stands
were 263 and only two were clearcut. The total area of thinned stands was 213.6 ha, thereof
were 148.9 ha thinned in FrF. Most of thinned stands were in plantations in NBF and in some
cases the native birch was felled in shelterwood felling. The clearcut was 4.5 ha, all in FrF
category and only in the years 2008 and 2009 (See Figure 9).
70
60
50
40
ha
30
20
10
0
2002 2003 2004 2005 2006 2007 2008 2009
Thinning LcF Thinning FrF Clearcut FrF
Figure 9. Cutting activity at IFS in the RP.
Larch was the most commonly thinned species group, with 31% of thinned area in category
FrF in the RP. Next came slow growing spruces with 30%, Sitka spruce with 19%, Pine with
17%, Birch with 1.8 % and Black Cottonwood with only 0.4%. The only clearcut species was
larch.
24Although information on thinned volume and thinning strength is not complete for all thinned
stands in the table of Annex 1 the data was analysed as shown in Table 6.
Table 6: To the left the table shows hectares thinned in each age class defined. Favourable thinning
periods for species groups are marked with colours where green is first thinning, and light brown is
second thinning. Thinning strength (%) weighted by area is shown to the right. Figures marked with
yellow consist of only one measurement, but figures marked with brown consist of many
measurements. Figures not marked with colour consist of few measurements. For three species groups
extended age classes (41-60 years) fit better and are shown in the bottom line. Abbreviations for species
groups: BC = Black Cottonwood, L = Larch, P = Pine, SS = Sitka spruce, S = other spruces.
Ha thinned Thinning strength
Age class Birch BC L P SS S BC L P SS S
1-10 0.47 0.00 0.29
11-20 2.16 0.00 0.00 7.42 11%
21-30 0.19 47.16 3.33 6.76 5.30 36% 29%
31-40 0.13 0.57 11.77 7.06 3.36 5.03 38% 66% 55%
41-50 0.71 14.38 16.11 30.13 24.13 52% 20% 51% 17%
51-60 0.26 9.62 5.45 4.48 7.68 66% 60% 63% 42%
61-70 1.56 0.00 0.22 1.03
71-80 1.19 25%
41-60 21.56 34.61 31.81 31% 54% 24%
Based on the information in Table 6, a thinning system was constructed for the species groups
described (Table 7). As clearcut (100% cut in Table 7) was rare in the RP an expert judgement
was used to define the age of clearcut considering the growth rotation length, when current
increment crosses the mean annual increment as appropriate clearcut age.
Table 7: Thinning time, strength, and rotation length at clearcut (100% cut).
Species Age % cut
Black cottonwood 25 35%
Black cottonwood 50 100%
Pine 50 30%
Pine 70 100%
Sitka spruce 50 55%
Sitka spruce 75 100%
Slow growing spruce 50 25%
Slow growing spruce 90 100%
Larch 25 30%
Larch 50 50%
Larch 65 100%
Birch 50 50%
Birch 70 100%
It should be noted that only part of the CF is available for wood supply. The first attempt to
estimate the area of Forest Available for Wood Supply (FAWS) resulted in 65% of the stocked
area (net forest area) of CF being classified as FAWS (Snorrason 2016). In a harmonized
25European project 35.2% of the forest area was defined as Forest Not Available for Wood
Supply (FNAWS) and 37.2% of the above ground biomass (Snorrason et al. 2017). Since 2014
plot segments in the NFI have been classified into FAWS and FNAWS. These variables were
used in the harmonized European project described above. The same information was used
in this paper to classify plot segments into FAWS or FNAWS forest management practices for
defined species groups.
3.2.4 Harvest data
As already mentioned in Chapter 2.1 the harvest data are from annual reports of production
of wood, sold on the commercial wood marked in Iceland as reported in the Journal of the
Icelandic Forest Association. The last reference is from 2017 (Gunnarsson and Brynleifsdóttir
2017), but the reports have been published with information of wood production annually
since 1996. Total wood production is shown in Figure 10 measured in roundwood volume on
bark. It increased dramatically in 2010 as economic markets for domestic wood opened,
caused by the economic crash in late 2008.
7
6
5
1000 m3
4
3
2
1
0
1996
1997
1998
1999
2000
2001
2002
2003
2004
2005
2006
2007
2008
2009
2010
2011
2012
2013
2014
2015
2016
Figure 10. Total wood production sold on the marked in Iceland.
The wood production in the RP (2002-2009) mostly originates from the Forest Ranger regions
at the Icelandic Forest Service (IFS) as shown in Figure 11. In some years the IFS was the only
producer but more recently the share of other producers, such as forest farmers and forest
societies, has increased. A slow increase in annual production from 2002 to 2008 with a sharp
increase in 2009 is evident. The share of IFS was 85% during the RP. Total production in the
RP was 7798 m3 with mean annual production of 975 m3. The total production of IFS during
the RP was 6617 m3 with mean annual production of 827 m3.
262.5
2.0
1.5
1000 m3
1.0
0.5
0.0
2002 2003 2004 2005 2006 2007 2008 2009
Total IFS Total
Figure 11. Comparison of wood production of the IFS and total production in the Reference Period.
It is possible to estimate the wood production from CF by subtracting the birch wood
production from NBF. Of the birch wood removals in the RP 52% were from CF. Total
production during the RP from CF was 6688 m3 with mean annual production of 836 m3. Total
production of the IFS during the RP from CF was 5507 m3 with mean annual production of 688
m3.
It is not as easy to split the CF wood production between FrF and LcF categories. The area of
each category can however be estimated based on the harvested area of the IFS were total
area of thinned stands was 213,6 ha thereof were 148,9 ha thinned in FrF (69.7%). The stock
fraction will be different as most of the cuttings before 50 years of age are with lower stock
removals than cuttings after 50 years. Comparison of the first and second thinning in larch at
age and strength given in Table 7 resulted in 18% lower stock removals in the first thinning
compared to the second thinning. Larch stands represented 57% of the cutting area in the LcF
category. Considering both area ratio and stock ratio of first thinning the partitioning of
thinning in LcF is estimated to be around 21% of the total wood production.
To convert m3 to dry biomass, default conversion factors given in table 3.A.1.9-1 in IPCC GPG
(IPCC 2003) were used.
3.2.5 Documentation of stratification of managed forest land
The number of NFI sample plots used to characterise the FMP and for model projection is very
small. Therefore, careful consideration of the stratification approach was required and, in the
end, only two strata were defined:
1. Natural birch forest (NBF). The NBF is characterised by uneven aged forest and can
be classified into non-wood utilisation and wood utilisation functions. The non-wood
utilisation NBF class has more of a conservation and erosion management function
representing most of the NBF area (86.997 kha in the RP). The remaining 0.64 kha of
NBF are subject to selective cuttings where there is removal of larger trees on a cycle
of ca. 60-100 years. There is no existing modelling framework for the NBF and the
available data on the growth of the NBF wood utilisation strata would be too small to
derive a robust estimation of biomass increment. Therefore, only one stratum will be
27defined for the NBF, which will include both woody and non-woody utilisation
functions. The IFS database on harvest was used to describe FMP for this stratum.
2. Cultivated Forest (CF). Because of a very limited number of sample-plots, an attempt
to classify species groups into independent strata failed. Instead it was decided to
define CF as one stratum despite its heterogeneity. This decision will not affect the
quality of the process and the result as every plot-segment will be opted a suitable
growth curve and forest management practices.
Cultivated forests are for the most part even aged plantations with known planting
year. Further description will be given in the next chapter.
The first stratum is identical to subclass NBF of the IC-GHGR. The second stratum originates
from the two CF subclasses of FrF in the IC-GHGR.
3.2.6 Documentation of sustainable FMP as applied in the estimation of FRL
Classification into FMP classes was carried out using two dimensions:
a. The tree species measured with highest ratio of biomass at the initial state in the RP
(measured in the first NFI 2005 -2009) in each plot segment.
b. Registration of plot segments into FAWS or FNAWS.
Description of FMP’s:
1. Black cottonwood (BC). (Populus trichocarpa). Fast growing poplar with relative short
rotation and high total yield on fertile soils. It was represented by 4 plot segments
from the NFI and 2 stands in the IFS cutting activity database (CAD). Three of the plots
were defined as FAWS.
2. Pine (P). Most of the pine forest was of lodgepole pine (Pinus contorta), rather fast
growing with medium yield and rotation. Other pine species are slow growing: One
stemmed Mountain pine (Pinus mugo ssp. uncinata), shrubby Mountain pine (Pinus
mugo ssp. mugo) and Scots pine (P. silvestris). Pine was represented by 16 plot
segments from the NFI and 44 stands in the IFS CAD. Nine of the NFI plots were
defined as FAWS.
3. Sitka spruce (SS). Either Sitka spruce (Picea sitchensins) or Lutz spruce (Picea x lutzii).
Slow growth in the beginning but high total yield on a rather long rotation. This species
class was represented by 20 plot segments from the NFI and 67 stands in the IFS CAD.
Eighteen of the plots were defined as FAWS.
4. Slow growing spruces (S). Norway spruce (Picea abies) is most prevalent. Other
spruces are White spruce (Picea glauca) and Engelmann spruce (Picea engelmannii).
Hemlocks are also included in this group. Slow growth with relative low yield on long
rotations. This class was represented by 21 plot segments from the NFI and 77 stands
in the IFS CAD. Seventeen of the plots were defined as FAWS.
5. Larch (L). Mostly Siberian or Russian larch (Larix sibirica or Larix sukaczewii). Fast
juvenile growth with medium yield and rotation. It was represented by 8 plot
segments from the NFI and 63 stands in the IFS CAD. All plots were defined as FAWS.
6. Birch (B). Native downy birch (Betula pubescens) predominates. Other slow growing
deciduous tree species are included as well. Slow growth with relative low yield on
medium rotation due to small stature. This class was represented by 13 plot segments
from the NFI and 5 stands in the IFS CAD. Six of the plots were defined as FAWS.
28The number of FMP’s total 12 classes as in all cases both FMP with no cutting activity for forest
defined as FNAWS and FMP with cutting activity defined as FAWS did occur. These
assessments were done on the NFI plots as already described above. Table 8 shows estimated
area of each FMP in CF during the RP.
Table 8: The area (in ha) of forest management practices for cultivated forest in the reference period.
BC: Black cottonwood, P: Pine, S: Slow growing spruces, B: Birch, L: Larch, SS: Sitka spruce, FAWS: Forest
available for wood supply, FNAWS: Forest not available for wood supply.
Species 2002 2003 2004 2005 2006 2007 2008 2009
BC FAWS 0 0 0 0 0 0 54 54
BC FNAWS 17 17 18 18 18 18 18 18
P FAWS 119 119 121 124 124 124 124 124
P FNAWS 68 68 69 70 70 70 70 70
S FAWS 451 451 459 522 522 522 578 578
S FNAWS 59 59 60 62 62 62 62 62
B FAWS 139 139 142 145 145 145 145 145
B FNAWS 221 221 224 229 229 229 230 230
L FAWS 87 87 88 90 90 90 91 91
L FNAWS 0 0 0 0 0 0 0 0
SS FAWS 129 129 131 134 134 134 134 134
SS FNAWS 0 0 0 0 0 0 0 0
Sum FAWS 925 925 940 1014 1014 1014 1125 1125
Sum FNAWS 365 365 371 379 379 379 380 380
Total Sum 1290 1290 1311 1393 1393 1393 1505 1505
The NBF stratum had two FMP classes, similar to the CF. One with no cutting activity covering
about 99.3% of the area and a small part with selective cutting practiced in the North and the
East Forest Ranger regions of IFS. Both FMP’s do not change in area in the RP.
3.3 Detailed description of the modelling framework as applied in the
estimation of the forest reference level
3.3.1 Natural Birch Forest
As NBF are without defined age classes and estimated by the stock difference method they
are processed separately from CF. Mean annual net removal (MANR) to the C-stock pool of
biomass was in IC-GRGR-2016 was estimated to be -13.13 kt CO2. Direct extrapolation of the
mean annual removal was used for the years beyond 2007 until 2025 with proportional
subtraction of forecasted annual loss of area caused by deforestation. The same modelling
framework was used to predict net CsC of the biomass in the CP. A new inventory of NBF that
will be finished in autumn 2020 will make comparison of the biomass between 2007 and 2017
possible, shortening the extrapolation period by ten years. This new information will without
doubt lead to improvement of the IC-GHGR and consequently technical correction the FRL.
Harvest, like other biomass losses, is included in the MANR. Nevertheless, any change in
relative harvest rate will affect the MANR, so unchanged relative harvest rate from the
biomass stock comparing period was a precondition of using this approach. Although wood
removal from NBF from 1990 to 2009 showed interannual fluctuation (Figure 7), no decreasing
29You can also read