Swimming Pool Efficiency Program Evaluation - Prepared for: Independent Electricity System Operator - IESO
←
→
Page content transcription
If your browser does not render page correctly, please read the page content below
Swimming Pool Efficiency
Program Evaluation
November 15, 2018

 Prepared for:
 Independent Electricity System Operator
 120 Adelaide Street West
 Toronto, ON M5H 1T1

Prepared by:
Allie Marshall
Cynthia Kan, PhD
Jane Colby
Cadmus

Normand Michaud
Jillian Mallory
Julie-Anne Belzile
Jean-François Bergeron
Econoler
Table of Contents
Executive Summary............................................................................................................................ 1
 Program Description............................................................................................................................... 1
 Methodology .......................................................................................................................................... 2
 Key Observations and Recommendations.............................................................................................. 2
Introduction ...................................................................................................................................... 4
 Program Description............................................................................................................................... 4
 Program Participation Summary ............................................................................................................ 6
Impact Evaluation .............................................................................................................................. 7
 Methodology .......................................................................................................................................... 7
 Gross Savings Methodology ............................................................................................................. 7
 Net Savings Methodology .............................................................................................................. 11
 Findings................................................................................................................................................. 13
 Gross Savings ................................................................................................................................. 13
 Net Savings..................................................................................................................................... 14
Process Evaluation ........................................................................................................................... 16
 Methodology ........................................................................................................................................ 16
 Stakeholder In-Depth Interviews ................................................................................................... 16
 Market Actor In-Depth Interviews ................................................................................................. 16
 Participant Surveys ........................................................................................................................ 16
 Findings................................................................................................................................................. 16
 Program Design and Delivery......................................................................................................... 17
 Participant, Local Distribution Company and Market Actor Experience ....................................... 18
 Success, Challenges and Future Planning ...................................................................................... 31
Cost-Effectiveness and Greenhouse Gas Impacts............................................................................... 34
 Methodology ........................................................................................................................................ 34
 Total Resource Cost Test................................................................................................................ 34
 Program Administrator Cost Test .................................................................................................. 35
 Levelized Unit Electricity Cost ........................................................................................................ 35
 Inputs and Assumptions ....................................................................................................................... 35
 Findings................................................................................................................................................. 36

 i
Key Observations and Recommendations ......................................................................................... 39
Appendix A. Participant Demographics ......................................................................................... A-42
Appendix B. Impact and Process Evaluation Documents ................................................................. B-45

 ii
Acronyms and Abbreviations
 Acronym Definition
CDM Conservation and Demand Management
EUL Effective useful life
FTP File Transfer Protocol
HP Horsepower
IESO Independent Electricity System Operator
LDC Local Distribution Company
LUEC Levelized Unit Electricity Costs
NTGR Net-to-Gross Ratio
PAC Program Administrator Cost Test
PY Program Year
TRC Total Resource Cost Test
VAI Vendor Adjustment Influence

 iii
Executive Summary As part of the 2017 residential portfolio evaluation, the Cadmus team (Cadmus and Econoler) evaluated the Swimming Pool Efficiency Program, which was offered by three groups of local distribution companies (LDCs), namely: Toronto Hydro Electric System and Oakville Hydro Electricity Distribution Inc. ; Hydro Ottawa Ltd and Renfrew Hydro; and Burlington Hydro Inc., Milton Hydro and Halton Hills Hydro. For this evaluation, the Cadmus team sought to address several research objectives: Determine net and gross verified energy and summer peak demand savings Compare evaluated performance against reported participation and energy savings Assess delivery channel and marketing methods Assess stakeholder and participant experiences including satisfaction and motivation Document areas of success, challenge and changes to the program Determine cost-effectiveness and greenhouse gas reductions Program Description Through the Swimming Pool Efficiency Program, the LDCs aim to replace constant-speed swimming pool pumps with variable-speed pumps. Constant-speed pumps are sized to provide a continuous flow rate regardless of usage, whereas variable-speed pumps adjust flow rates by use (filtering and sanitation, heating and cleaning), resulting in energy savings. The program design was based on a pilot previously conducted by London Hydro. Because Southern Ontario has many residential pools, the LDCs identified the area as a good target market for the program. Toronto Hydro developed a program business case, which was used as a model for the business cases developed by Hydro Ottawa and Burlington Hydro. The three lead LDCs held shared training sessions for vendors during Pool and Hot Tub Council of Canada1 meetings to inform interested vendors about the program and participation process. Lead LDCs were also responsible for marketing and processing program applications for their region. All single-family residential customers of participating LDCs who own an in-ground pool with a constant- speed pump with or without existing controls are eligible for the program. New pool installations are not eligible for the program. The participating LDCs provided an instant $400 discount at the point of sale toward ENERGY STAR® variable-speed pool pumps. To be eligible, the pool pump must be installed by a participating pool pump vendor or a participating vendor’s contracted installer. The program design uses 1 The Pool and Hot Tub Council of Canada is a non-profit association of companies, organizations, and individuals involved in the aquatic leisure industry. 1
a midstream approach where vendors are responsible for recruiting participants, providing the
discounted equipment to customers and claiming incentives from the LDCs.

Methodology
To address the research objectives (listed above), the Cadmus team conducted both impact and process
evaluation tasks. To produce gross verified energy and demand savings, the team reviewed program
data records and conducted an engineering analysis of input assumptions, examining the inputs and
algorithms used by the LDC.

To produce net verified energy and demand savings, the team estimated net-to-gross ratios (NTGR)
using results from the market actor interviews and participant surveys.

The Cadmus team gathered insights on the program’s effectiveness and assessed the overall program
operation and performance through a process evaluation. This evaluation included a comprehensive
review of program documents and phone interviews with eight LDC staff from the three lead LDCs, one
Independent Electricity System Operator (IESO) staff member, 39 participating vendors and one staff
member from the Eastern Ontario branch of the Pool and Hot Tub Council of Canada. Additionally, the
Cadmus team conducted an online survey of 285 participants to assess their experience with the
program and with the pool pump measure.

Key Observations and Recommendations
As shown in Table ES-1, the Swimming Pool Efficiency Program achieved gross verified savings of
5,957 MWh and 1.140 MW and distributed 1,959 pool pumps in PY2017. The program achieved an
NTGR of 1.00. The Cadmus team estimated a gross realization rate of 99.7% for energy and 83.4 % for
demand. A small adjustment was applied to energy savings because of some discrepancies found in the
amount of new pump energy consumption reported for 4% of projects. A bigger adjustment was needed
for demand savings to consider the IESO summer peak demand summer period.

 Table ES-1. Swimming Pool Efficiency Program Summary
 Item Units Evaluated
 Incentive Spending $ $783,600
 Participation Products 1,959
 MWh 5,957
 Gross Verified Savings
 MW 1.140
 % (MWh) 99.7%
 Gross Realization Rate
 % (MW) 83.4%
 MWh 5,969
 Net Verified Annual Savings (First Year)
 MW 1.142
 MWh 5,969
 Net Verified Annual Savings (2020)
 MW 1.142
 Net-to-Gross Ratio % 1.00

 2
The following statements present the team’s evaluation key observations and recommendations: Key Observation 1: The program effectively leveraged vendors and provided a cost-effective and satisfying customer experience. Key Observation 2: While the methodology used by the LDCs to calculate savings on customer submission forms is sound, there were some inconsistencies in the project list. Recommendation 2: Add an inconsistency test to the submission form as well as a saving calculation tool to alert vendors of an inconsistency (such as unreasonable power draw) so they may correct the item prior to submitting the form. Key Observation 3: Pump programming could be used to maximize summer peak demand savings. Recommendation 3: Educate and encourage vendors to program pumps for the greatest demand savings and to provide time settings for each pump speed on the submission form to enable the calculation of resulting summer peak demand savings. Key Observation 4: Oversizing of pumps by vendors is a noted concern, and proper sizing of pool pumps could result in additional energy savings. Recommendation 4: Train vendors on the proper sizing of variable-speed pool pumps to maximize efficiency. Key Observation 5: Vendors are critical to program success, driving program participation through the recommendations they make to their customers. Key Observation 6: Diversifying LDC marketing materials would improve vendor marketing. Recommendation 6: Provide marketing materials to vendors in digital format so it can be used on vendor websites and in social media and emails. Key Observation 7: While the LDCs are sharing resources, there are further opportunities to enhance collaboration and reduce costs. Recommendation 7: Continue to share training resources and provide marketing materials and vendor support (such as the hotline) that can be jointly leveraged across LDCs. Key Observation 8: The program effectively leveraged vendors and could be scaled to expand its reach. Recommendation 8: Consider including above-ground pools, as the program cost-effectiveness is likely robust enough to support measures with slightly lower savings. Key Observation 9: The Swimming Pool Efficiency Program is cost-effective. 3
Introduction As part of the PY2017 residential portfolio evaluation for the IESO, the Cadmus team (Cadmus and Econoler) evaluated the Swimming Pool Efficiency Program, which was offered by three groups of LDCs: Toronto Hydro Electric System and Oakville Hydro Electricity Distribution Inc.; Hydro Ottawa Ltd and Renfrew Hydro; and Burlington Hydro Inc., Milton Hydro and Halton Hills Hydro. The Cadmus team conducted an impact and process evaluation to address several research objectives: Determine net and gross verified energy and summer peak demand savings Compare evaluated performance against reported participation and energy savings Assess delivery channel and marketing methods Assess participant and market actor experiences Document areas of success, challenge and changes to the program Assess market acceptance and interest in efficient pool pumps Determine cost-effectiveness and greenhouse gas (GHG) reduction using the IESO’s custom Conservation and Demand Management Energy Efficiency Cost Effectiveness Tool (CDM Cost Effectiveness Tool) The impact evaluation, process evaluation and cost-effectiveness methods and results are provided in separate chapters after this introduction. The evaluation included these primary tasks: Participant surveys In-depth interviews with LDC program staff and market actors Desk review and engineering analysis of savings Program Description Through the Swimming Pool Efficiency Program, the LDCs aims to replace constant-speed swimming pool pumps with variable-speed pumps for existing in-ground pools. Constant-speed pumps are sized to provide a continuous flow rate regardless of usage, whereas variable-speed pumps adjust flow rates by use (filtering and sanitation, heating and cleaning), resulting in energy savings. The program design was based on a pilot previously conducted by London Hydro. Because Southern Ontario has many residential pools, the LDCs identified the area as a good target market for a program. Toronto Hydro developed a program business case, which was used as a model for the business cases developed by Hydro Ottawa and Burlington Hydro. The three lead LDCs held shared training sessions for vendors during Pool and Hot Tub Council of Canada meetings to inform interested vendors about the program and process. Lead LDCs were also responsible for marketing and for processing program applications for their region. The delivery of the program was very similar across the three LDC groups, 4
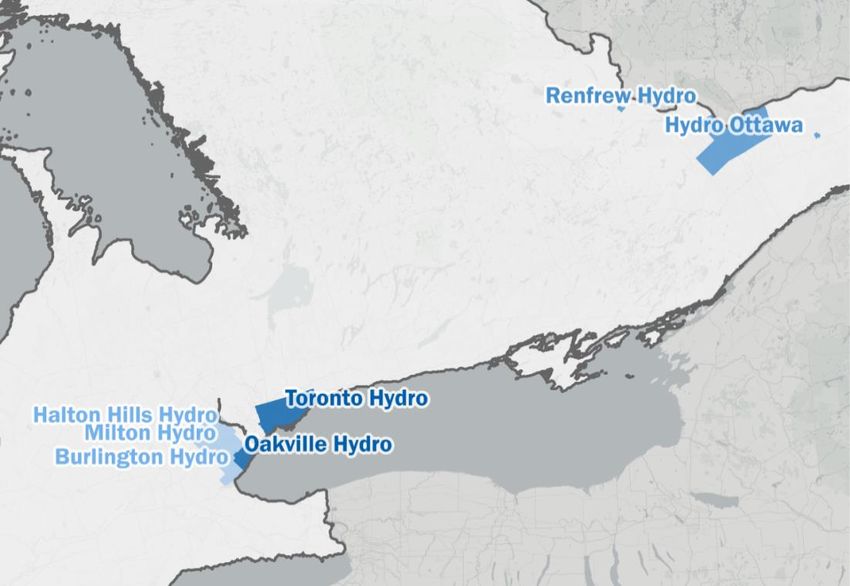
however the application submittal process varied by LDC. 2 Table 1 below details the launch dates for each group of LDCs participating in the program. Table 1. LDC Program Launch Dates LDC Launch Date Toronto and Oakville Hydro February 2017 Burlington, April 2017 Halton Hills and Milton Hydro Hydro Ottawa and Renfrew Hydro May 2017 Figure 1 shows the territories of the LDCs participating in the program. Figure 1. Service Areas of Participating Local Distribution Companies The program design uses a midstream approach where pool pump vendors are responsible for several actions: Promoting ENERGY STAR variable-speed pool pumps to interested customers Providing and installing the discounted equipment to participants Collecting the $400 incentive from LDCs 2 The three lead LDCs are Toronto Hydro, Hydro Ottawa and Burlington Hydro. 5
Program Participation Summary
The program has been in market since PY2017 and will be offered until PY2020. The LDCs reported
rebating 1,960 pool pump measures, with total costs of $1,004,990 in PY2017. Table 2 shows the
number of pool pump measures installed by LDC territory.

 Table 2. Reported and Verified Measure Volume
 a b
 Lead LDC Reported Measures Verified Measures
 Burlington Hydro 308 308
 Halton Hills Hydro 47 47

 Hydro Ottawa 664 664
 Milton Hydro 85 85
 c
 Oakville Hydro 417 416
 Renfrew Hydro 1 1

 Toronto Hydro 438 438
 d
 Total 1,960 1,959
 a
 Source: Swimming Pool Efficiency Program Project List.
 b
 Source: Swimming Pool Efficiency Program Project List.
 c
 One reported project was a duplicate and removed.
 d.
 One project was confirmed to have installed two pumps, therefore there are 1,958 projects.

 6
Impact Evaluation
The Cadmus team conducted desk reviews, engineering analysis and literature review to determine the
gross and net verified energy and demand savings from the Swimming Pool Efficiency Program.

Methodology
For the impact evaluation, the team reviewed the savings input assumptions and algorithms used by the
LDCs and updated those inputs to reflect program data and information from market actor interviews
and participant surveys. The following sections present the gross per-unit savings and net savings
calculation methodologies.

Gross Savings Methodology
This section presents the LDC-reported savings, followed by the evaluation results.

Reported Energy and Demand Savings
The LDCs calculated the energy consumption of participants’ existing pumps based on Equation 1.

 Equation 1. Existing Pump Daily Energy Consumption
 ℎ
 [ ]

 ℎ
 [ ∗ [ ] ∗ 60
 ] ℎ
 =

 [ ] ∗ 1,000
 ℎ

Vendors reported the nameplate horsepower, pool pipe diameter and reported daily operating hours
for each participant’s existing pump in a form they submitted for each new pump installation. Using
these inputs, the form automatically calculated the energy factor and flowrate using a table from the
“Savings Calculator for ENERGY STAR Certified Inground Pool Pumps.”3

For the new variable-speed pump, the vendor input the power draw and operating hours for up to three
different speeds into the submission form. The form incorporated a tool that used two calculation
approaches to determine the energy consumption of the new pump depending on the data collected.
 1. If the power draw was provided, the submission form automatically calculated the daily energy
 consumption using Equation 2, summed for each speed.

3
 ENERGY STAR. “Savings Calculator for ENERGY STAR Certified Inground Pool Pumps.” Spreadsheet. 2013.
 Available online: https://www.energystar.gov/products/other/pool_pumps?qt-consumers_product_tab=4#qt-
 consumers_product_tab

 7
Equation 2. New Pump Daily Energy Consumption
 ℎ
 [ ]

 ℎ
 [ ∗ [ ]
 ]
 =∑

 1,000

 2. If the power draw was not available, the form used the equation for existing pumps (Equation 1)
 to calculate the energy consumption at the various pump speeds, and then summed these
 results to obtain the total new pump daily energy consumption.

The submission form’s tool then calculates the annual energy consumption of both the existing and new
pumps by multiplying the daily energy consumption by the number of days the pool is open (assumed to
be 122 days if not provided, for the four summer months). Equation 3 shows the reported annual per-
unit energy savings calculation.

 Equation 3. Reported Annual Per-Unit Energy Savings
 ℎ
 = (
 − )
 ∗ (30.5 ∗ ℎ ℎ )

The LDCs used two different approaches to estimate demand savings:
 1. Hydro Ottawa assumed that demand savings equated to the maximum power drawn by the new
 pump. For example, if the reported power draw values were 300 W and 900 W for the low and
 high speed respectively, the Hydro Ottawa submission form tracked the demand savings to be
 0.9 kW.
 2. Burlington Hydro calculated gross demand savings as the difference between the existing and
 new pump average demand.

 3. Toronto Hydro used the method applied by Hydro Ottawa at the inception of their program, but
 subsequently adopted Burlington Hydro’s approach.

Engineering Review
To conduct the engineering review, the Cadmus team (1) reviewed the savings algorithms and inputs
used by the participating LDCs, (2) validated the program assumptions and 3) updated savings based on
the results of the two first tasks.

The Cadmus team reviewed all projects provided in the submission forms provided by LDCs, as
described above, to ensure that the inputs were consistently entered and that the savings algorithms
provided the expected outcomes. These submission forms contained information on the pool, existing
pump and new pump, which allowed the team to validate how those data were used to obtain energy
savings. The lead LDCs (Toronto Hydro, Ottawa Hydro, and Burlington) provided submission for data for

 8
each of the respective groups from the LDC interview process. However, data for Halton Hills Hydro and
Milton Hydro was not provided, so the team used the average realization rate of other LDCs (99.7%) to
calculate the verified values for these LDCs.

Following the review of submission forms, the team compared the program assumptions to technical
reference manuals from other jurisdictions and to studies and reports on pool pump energy
consumption, adjusting for climate as required. Several technical reference manuals consulted used
deemed values and therefore did not allow a thorough comparison of the assumptions. The team
therefore considered data from Massachusetts, Vermont, Illinois and Minnesota, which used input
values obtained with the “Savings Calculator for ENERGY STAR Certified Inground Pool Pumps” or a
methodology like that of the calculator. The ENERGY STAR Calculator estimates the amount of water
that needs to be filtered and the amount of time it will take to filter, which together provide the average
flowrate required from the pump. Based on this average flowrate, the team then identified the pump’s
energy factor from a table for the existing pump and from a formula for the new pump.4 The calculator
assumes that the new pump runs at high speed during two hours per day for cleaning and runs at low
speed for any remaining time required to filter the volume of pool water.

The team’s ENERGY STAR Calculator methodology is slightly different than that used by LDCs in the
Swimming Pool Efficiency Program. The LDCs used values reported in the submission form, instead of
assumed values, for the power draw of each programmed speed as well as for the operating hours.
However, the LDCs also used a table from the ENERGY STAR Calculator, but not the tool itself. The team
found one jurisdiction, Pennsylvania, which used a similar approach to that used by the LDCs to calculate
energy savings.

While the ENERGY STAR Calculator is used widely, the team determined that the Swimming Pool
Efficiency Program approach is more accurate since the old and new operating hours as well as the
power drawn by the new pump are tracked on the submission form, thereby reducing the number of
assumptions. In addition, when available, the vendors took the new pump power draw values directly
from the variable-speed pump display screen, therefore accounting for the effects of the piping system
on the energy consumption.5

To further test the validity of the LDC methodology, the Cadmus team also compared the energy savings
obtained from the ENERGY STAR Calculator against those reported by the LDCs for a sample of projects.
Since some inputs required in the ENERGY STAR Calculator were not mandatory on the LDC submission
forms, the team selected projects with a pipe size available in the Calculator and only two speeds for the
new pump, to ensure methodologies could be compared. The savings reported by the LDCs were similar

4
 Most parameters of the “Savings Calculator for ENERGY STAR Certified Inground Pool Pumps” have a default
 value that can be manually changed if the real value is known.
5
 If the power draw values were unavailable, the vendors estimated them based on manufacturer specification
 sheets.

 9
to those obtained with the ENERGY STAR Calculator, with a variance of under 10%. Thus, the Cadmus
team made no adjustment to the energy savings calculation methodology.

While the team adopted the same methodology as the LDCs, there were some discrepancies between
the IESO-reported savings in the program data and the Cadmus team savings obtained when applying
the calculation methodology to the LDC-provided submission form data. The source of discrepancies
was not identifiable as the majority of submission forms contained hard-coded values without showing
the savings calculations. For the 78 affected projects (4% of total projects), the team adjusted the net
verified savings based on what was calculated with the LDC data instead of what was reported to the
IESO. On average, these discrepancies resulted in slightly lower savings (-0.3%) than reported (Key
Finding 2a).

In addition, 21 projects did not have operating hours or power draws identified for the new pump: these
submission forms calculated no energy consumption for the new pump installed due to missing a
necessary variable to complete the calculation. In these cases, the energy savings calculation attributed
the total energy consumption of the old pump as energy savings for these projects, which is incorrect.
To calculate savings for those projects, the team used the average energy consumption of the new
pump from all other projects.6

Gross Verified Demand
To determine gross verified summer peak demand savings, the team used Equation 4.

 Equation 4. Gross Verified Kilowatt Savings
 = ℎ ∗

 Where:
 kWfactor = Summer peak conversion factor from kilowatt-hour to kilowatt (the
 team used the IESO Prescriptive Measure and Assumptions List)

Variable-speed pool pumps can be programmed to perform energy intensive activities (such as
cleaning cycles) during non-peak hours which may increase the summer peak demand savings of the
pump, which may increase the summer peak demand savings of this program. However, vendors did
not provide information on the submission form on the daily schedule of programmed speeds.
Therefore, the team applied the summer peak demand ratio of 0.000193 for Residential Swimming
Pool Pumps load profile from the IESO Prescriptive Measure and Assumptions List to all participants to
obtain their gross verified summer peak demand savings (Key Finding 3a). The team did not use the
summer peak demand savings established by the LDC methodology since it was based on the average
demand savings and not on the power draw during the summer peak period (which could be higher or
lower than the average). The team deemed the uncertainty associated with the summer peak demand

6
 To refine the adjustment made to those projects, the team analysed the average energy consumption based
 on the motor size (nameplate horsepower), but the results were inconclusive.

 10
ratio as less significant than using the average power draw since it was developed specifically for
residential pool pumps.

LDCs used a value of 10 years for the measure effective useful life (EUL), and the Cadmus team
determined this value as reasonable: as presented in the Table 3. Cadmus conducted a literature review
which revealed that 10 years is the most commonly value used, concluding that a 10 year EUL is
appropriate to calculate the program cost-effectiveness.

 Table 3. Literature Review Sources
 Effective
 Jurisdiction Reference
 Useful Life
 Energy & Resource Solutions. Savings Estimation Technical Reference Manual for
California 10
 the California Municipal Utilities Association. June 2016.
 Illinois Energy Efficiency Stakeholder Advisory Group. Illinois Statewide Technical
Illinois 10
 Reference Manual for Energy Efficiency Version 6.0. February 2017.
 Massachusetts Electric and Gas Energy Efficiency Program Administrators.
Massachusetts 10 Massachusetts Technical Reference Manual for Estimating Savings from Energy
 Efficiency Measures, 2016-2018 Program Years – Plan Version. October 2015.
Mid-Atlantic: Northeast
 Northeast Energy Efficiency Partnerships. Mid-Atlantic Technical Reference
Energy Efficiency 10
 Manual Version 7.0. May 2017.
Partnerships
 Minnesota Department of Commerce Division of Energy Resources. State of
Minnesota 10 Minnesota Technical Reference Manual for Energy Conservation Improvement
 Programs Version 2.1 Final. December 2016.
Northwest: Regional Regional Technical Forum. “EfficientPoolPumps_v2_1.” Accessed May 15, 2018.
 7.3
Technical Forum https://rtf.nwcouncil.org/measure/efficient-pool-pumps.
 Pennsylvania Public Utility Commission. Technical Reference Manual – State of
Pennsylvania 10
 Pennsylvania. June 2016, Errata Update February 2017.
 National Grid. Rhode Island Technical Reference Manual for Estimating Savings
Rhode Island 10
 from Energy Efficiency Measures – 2016 Program Year. October 2015.
 a The Cadmus Group. Wisconsin Focus on Energy 2017 Technical Reference Manual.
Wisconsin 5-15
 2015.
a
 Pool measures, unspecified.

Net Savings Methodology
The team derived net verified energy and demand savings (Equation 5 and Equation 6, respectively) by
adjusting the gross energy savings by the NTGR (Equation 7).

 Equation 5. Net Verified Energy Savings for Pool Pumps
 ℎ = ∗ ℎ

 Equation 6. Net Verified Demand Savings for Pool Pumps
 = ∗

 Equation 7. Net-to-Gross Ratio for Pool Pumps
 = 1 − ℎ +

 11
The Cadmus team used self-reported participant survey data to assess free ridership and spillover for the program. Free ridership refers to participation by those who would have acquired the energy efficiency measure in the absence of the program’s influence. The effect of free riders reduces the net savings attributable to the program. Spillover represents the additional energy savings that occur when customers—as a result of the program’s influence—install other energy efficiency measures without getting a rebate or change their energy use behaviour. Free Ridership The Cadmus team used participant survey responses to calculate free ridership, based on questions that collected data on each participant’s intention and factors that might have influenced the participant. The intention score captures what the participant would most likely have done if not receiving program assistance. In addition, the intention score incorporates the influence of vendor recommendations, that is when a respondent would have followed the vendor recommendations. The team established the intention score using a vendor adjustment influence, derived from the level of program influence vendors reported on their recommendations during interviews. The team asked participating vendors to rate how strongly the program affected the types of pool pumps they recommended to customers on a scale from 0 to 10, where 0 means not at all influential and 10 means strongly influential. The team calculated the average vendor rating, then multiplied by 10 to create a vendor adjustment influence factor, expressed as a percentage. The Cadmus team also assessed the program’s influence on respondents’ decisions to implement energy-efficient measures by asking respondents to identify the extent to which several program elements influenced their decision regarding the energy-efficient measures implemented: $400 rebate Information or recommendation from vendor or contractor Marketing or advertising about the program Influence and free ridership have an inverse relationship: the greater the program influence, the lower the free ridership. The team then calculated free ridership at the program level, as no significant differences were observed between LDCs or LDC groups. Spillover The Cadmus team used Equation 8 to calculate the percentage of spillover, at the measure level, in which the spillover savings reported by respondents is divided by the total gross verified savings achieved by all survey respondents for the pool pump measure. Equation 8. Spillover ∑( ∗ ) S % = ∑ 12
The Cadmus team calculated spillover savings for survey respondents who indicated that they installed
additional energy-efficiency measures after participating in the Swimming Pool Efficiency Program, that
they did not receive a rebate for those measures, and that the program was influential in their decision
to install the additional measures.

The team calculated measure savings values for each individual qualifying spillover measure using the
best information available from the PY2016 Consumer Programs Evaluation, the IESO Prescriptive
Measure and Assumptions List and results from the PY2017 Coupons Program evaluation.

Findings
This section describes the gross verified and net verified savings results.

Gross Savings
The Swimming Pool Efficiency Program produced a total gross verified savings of 5,957 MWh and
1.140 MW in PY2017, as shown in Table 4. This resulted in gross realization rates of 99.7% for energy
(Key Finding 1a). The near unity realization rate for energy savings is because the team only adjusted a
few projects with discrepancies or incorrect new pump energy consumption. The team determined a
gross realization rate of 83.4% for summer peak demand savings. The summer peak demand savings
realization rate is lower because the team applied a summer peak demand ratio which provides demand
savings occurring during the IESO peak period rather than the average demand used by the LDCs.

 Table 4. PY2017 Gross Verified Savings
 Annual Gross Peak Demand Savings
 Annual Gross Energy Savings (MWh)
 LDC (MW)
 a b b
 Reported Verified Realization Rate Reported Verified Realization Rate
Burlington Hydro 1,070 1,064 99.4% 0.176 0.204 115.7%
Halton Hills Hydro 171 170 99.7% 0.017 0.033 186.5%
Hydro Ottawa 1,778 1,762 99.1% 0.461 0.337 73.2%
Milton Hydro 288 288 99.7% 0.032 0.055 172.5%
Oakville Hydro 1,260 1,272 100.9% 0.331 0.243 73.6%
Renfrew Hydro 2.4 2.4 100.0% 0.001 0.000 80.4%
Toronto Hydro 1,402 1,399 99.8% 0.349 0.268 76.8%
 c
Total 5,973 5,957 99.7% 1.366 1.140 83.4%
a
 Due to rounding, the realization rates do not equal to the division of the adjusted values by the reported values presented in
this table.
b
 Numbers may not add due to rounding.

The team calculated savings for each pool pump installed and considering the wide variation in pool
pump variables (such as size and hours of use). Table 5 shows the average savings per unit by LDC.
Variations across LDCs are due to small differences in pool sizes and pump schedules across regions. On
average, the installation of a variable-speed pool pump generated 3,041 kWh per year of energy savings
and 0.582 kW per year of summer peak demand savings.

 13
Table 5. PY2017 Average Gross Verified Savings per Variable-Speed Pump
 LDC Energy Savings (kWh) Peak Demand Savings (kW)
Burlington Hydro 3,456 0.661
Halton Hills Hydro 3,627 0.694
Hydro Ottawa 2,653 0.508
Milton Hydro 3,383 0.647
Oakville Hydro 3,057 0.585
Renfrew Hydro 2,355 0.450
Toronto Hydro 3,194 0.611
Total 3,041 0.582

Net Savings
As shown in Table 6, the program resulted in 5,969 MWh and 1.142 MW in net verified first year and
2020 savings. The team used responses from participant surveys and vendor interviews to derive a
program-level NTGR of 1.002. The program had a low free ridership rate, indicating an untapped
market for variable-speed pool pumps (Key Finding 1b).

 Table 6. Net Verified Savings

 Annual Energy Savings Annual Peak Demand
 (MWh) Savings (MW)
 Free
 Measure n Spillover NTGR
 Ridership Net Net Net
 Net Verified
 Verified Verified Verified
 First Year
 2020 First Year 2020

Variable-Speed Pool Pump 1,959 0.066 0.068 1.00 5,969 5,969 1.142 1.142

Free Ridership
The participant survey revealed that 82% of respondents had no intention of installing a variable-speed
pool pump if the program had not been offered and that 90% of respondents were highly influenced by
the program on their decision to purchase an efficient pool pump. In addition, 7% of respondents relied
on the vendor recommendation alone to decide to buy a variable-speed pump. Most interviewed
vendors (69%) reported that they were significantly influenced by the program. All these elements
contributed to a low free-ridership level of 6.6%, indicating an untapped market for variable-speed
pool pumps (Key Finding 1b).

Spillover
The participant surveys revealed that 34% of respondents reported installing at least one other energy
efficiency measure that was influenced by their participation in the program. These respondents did not
receive an incentive and said that the program was important in their decision to install additional
measures. The team calculated savings for spillover measures and divided the total survey sample
spillover savings by the gross program savings to obtain a spillover estimate of 6.8%.

 14
Respondents reported installing the following measures or adopting the following behaviours: LED bulbs (44 respondents) Switched to washing laundry with cold water (40) Window film (4) Reduced use of lights (107) Weather-stripping (23) Turned down thermostat setting in winter (49) Lighting controls (47) ENERGY STAR clothes washers (26) Smart power bars (8) ENERGY STAR clothes dryers (26) Programmable thermostats (48) High-efficiency heating or cooling systems (24) Insulation blankets (2) Unplugged devices usually plugged into outlets (31) Low-flow showerheads (19) The gross and net verified savings for each LDC, as well as the NTGR, is shown in Table 7. The team assumed that the LDC-level NTGR was the same as the program-level NTGR, and these values, when established at the regional level (by LDC group), were not found to vary significantly by LDC. Table 7. Swimming Pool Efficiency Program NTGR, Gross Verified and Net Verified Savings by Region Gross Verified First Year Net Verified First Year Savings Net Verified 2020 Savings Savings LDC NTGR Coincident Coincident Coincident MWh MWh MWh Peak (MW) Peak (MW) Peak (MW) Burlington Hydro 1,064 0.204 1.00 1,067 0.204 1,067 0.204 Halton Hills Hydro 170 0.033 1.00 171 0.033 171 0.033 Hydro Ottawa 1,762 0.337 1.00 1,765 0.338 1,765 0.338 Milton Hydro 288 0.055 1.00 288 0.055 288 0.055 Oakville Hydro 1,272 0.243 1.00 1,274 0.244 1,274 0.244 Renfrew Hydro 2 0.000 1.00 2 0.000 2 0.000 Toronto Hydro 1,399 0.268 1.00 1,402 0.268 1,402 0.268 c Total 5,957 1.140 1.00 5,969 1.142 5,969 1.142 c Due to rounding, numbers may not add up. 15
Process Evaluation
In addition to addressing the research objectives listed in the Introduction, the team used the process
evaluation to better understand measure characteristics and pump replacement processes by
determining, when pool pumps break, what fraction of customers replace the entire pump versus just
the motor.

Methodology
The Cadmus team began with a comprehensive review of program documentation (listed in Appendix B)
then conducted phone interviews with eight staff members from the three lead LDCs, one IESO staff
member, 39 participating vendors and one staff member from the Eastern Ontario branch of the Pool
and Hot Tub Council of Canada. Through these interviews, the team learned about stakeholder and
market actor experiences, motivations and satisfaction with the program. For insight into the customer
experience, the Cadmus team conducted online participant surveys. The team conducted the interviews
and surveys in spring PY2018.

Stakeholder In-Depth Interviews
The Cadmus team conducted telephone interviews with eight staff members from the three lead LDCs
and with one IESO staff member. These interviews provided insight into how the program was delivered,
marketing methods, participant and market actor experiences and information on successes and
challenges.

Market Actor In-Depth Interviews
The Cadmus team also conducted telephone interviews with 39 participating vendors, asking about
program delivery, recruiting, training, marketing methods, data collection, satisfaction, scalability and
areas of success, challenges and lessons learned. In addition, the team interviewed a representative of
the Pool and Hot Tub Council of Canada to further understand the impact of the program on the market
and on the Council’s participating members.

Participant Surveys
The team defined a participant as any LDC residential customer who purchased a variable-speed pool
pump through this program. The team completed online surveys with participating customers, asking
about their motivations, awareness of and experience with the program (including experience with the
installation process) and questions to inform the NTGR. In total, 285 participants responded, with 108
from Toronto Hydro, 108 from Hydro Ottawa and 69 from Burlington Hydro (as the lead LDC).

Findings
This section discusses the program design and delivery and the experiences, successes, challenges and
lessons learned for future planning from the perspective of LDC staff, pool pump vendors, the Pool and
Hot Tub Council of Canada and participants.

 16
Program Design and Delivery As described in the business cases, the primary program goal was to transform the residential swimming pool market by encouraging customers with existing swimming pools to retrofit single-speed inefficient pumps with energy-efficient variable-speed pumps. The program design was based on a pilot previously conducted by London Hydro. Because Southern Ontario has many residential pools, the LDCs identified it as a good target market for a program. Referencing a report from the Consortium for Energy Efficiency,7 the LDCs identified two barriers preventing the adoption of the variable-speed pool pump in the pool design and servicing community that needed to be addressed through the program: Vendors have difficulty sizing motors to achieve maximum efficiency Vendors often recommend single-speed pumps to avoid complications and follow-up service calls Through design, program customers receive a $400 rebate on a variable-speed pump at the point of sale. The program required participating vendors to be a member of the Pool and Hot Tub Council of Canada and to conduct the pump installation and confirm the participant’s eligibility for the rebate. The program required participating customers to have a single-speed pool pump for an existing in-ground pool. The LDCs favored this delivery model to limit administrative costs by avoiding a potentially lengthy application and approval process with customers. Furthermore, by requiring vendors to conduct installations, the LDCs could more easily collect information on the existing pump to improve the accuracy of energy savings calculations and to ensure the new pump’s proper installation. Additionally, the LDCs designed the program to encourage pool pump vendors to recruit participants among their existing customer base and to conduct the bulk of the marketing activities. Toronto Hydro developed a program business case, which was used as a model for the business cases developed by Hydro Ottawa and Burlington Hydro. The three lead LDCs held shared vendor training sessions, reducing the administrative burden and sharing costs across LDCs (Key Finding 7a). The training was held during Pool and Hot Tub Council of Canada meetings to inform interested vendors about the program and process. The sessions also included a presentation from a variable-speed pump manufacturer on the technology, its energy saving benefits and how to properly install and program the pump. While the program design (through the incentive and vendor training) addressed the barrier of vendor’s not recommending variable-speed pumps, there is not any evidence of vendor training on proper pool pump sizing to achieve maximum efficiency (Key Finding 4a). Vendors provided participants with the $400 incentive as an instant discount. To obtain reimbursement, vendors would submit an application form to the LDC, which included a customer application form, a photo of the old pump and a receipt that showed they provided the incentive. While the delivery of the 7 Consortium for Energy Efficiency. CEE High Efficiency Residential Swimming Pool Initiative. 2013. Available online: https://library.cee1.org/system/files/library/9986/ CEE_Res_SwimmingPoolInitiative_01Jan2013_Corrected.pdf 17
program was very similar across the three LDC groups, the application submittal process varied. Hydro
Ottawa and Toronto Hydro used an FTP site for vendor applications, whereas Burlington Hydro
developed an online vendor portal. The other LDCs plan to adopt Burlington Hydro’s vendor portal,
aligning the vendor submission process across all participating LDCs (Key Finding 7b).

Participant, Local Distribution Company and Market Actor Experience
This section discusses participant, LDC and market actor program experiences.

Participant Experience
The Cadmus team conducted an online survey with 285 participants. The following subsections describe
survey findings of participant demographics, awareness, motivation, pool installation and satisfaction.

Demographics
The survey respondents reported higher levels of education and household income compared to the
Ontario general population. Approximately 72% of program respondents have a university degree,
compared to 21% of the Ontario general population. Program respondents are also more likely to be
from middle or higher income households, with 96% reporting income above $50,000, and 58%
reporting income above $150,000 (compared to 17% in the Ontario general population; see Appendix A
for more demographic details and figures).

Awareness
The LDCs designed the program to encourage pool pump vendors to recruit participants among their
existing customer base. As expected, most survey respondents reported hearing about the program
from either a pool pump vendor (52%) or their pool maintenance service company (35%) (Key Finding
5a). As illustrated in Figure 2, survey respondents described becoming aware of the program primarily
through discussions with a pool pump vendor (68%), a sign located in a store (22%) and via email (8%).

 18
Figure 2. Awareness of the Swimming Pool Efficiency Program

 Source: Participant Survey Question C4. “How did they inform you of the Swimming Pool Efficiency
 Program?” and C5. “Which of the following best describes how you first learned about the Swimming Pool
 Efficiency Program?” (multiple response)

Among participants who reported not learning about the program through a vendor or service company
(12%), 30% became aware of the program through word of mouth, 30% from their LDC’s website and
12% from an LDC bill insert.

Motivation
The team asked participants about the condition of their existing pool pump to better understand their
motivations for purchasing a variable-speed pool pump. Most respondents reported having an existing
pool pump that was six to 16 years old, with 43% that were six to 10 years old and 22% that were 11 to
16 years old. In addition, 56% of respondents reported having a pool heater linked to their pumping
system and 31% claimed to have a pool cleaner linked to their system. Importantly, 82% of respondents
said they had a functioning pump that did not require immediate replacement (Key Finding 5b). It
appears that program marketing about energy and cost savings were the driver for replacement. As
shown in Figure 3, respondents cited saving energy (70%), saving money (69%) and following their
vendor’s recommendation (38%) as initial motivations to upgrade their constant-speed pool pump to a
variable-speed pool pump.

 19
Figure 3. Participant Motivations to Upgrade Pool Pump

 Source: Participant Survey Question C6. “What motivated you to upgrade your constant-speed pool pump
 to a high-efficiency variable-speed pump?” (multiple response)

Furthermore, the team asked participants why they chose their specific model of pool pump after
having decided to purchase a variable-speed pool pump. As illustrated in Figure 4, the vendor’s
recommendation was the most mentioned driver for purchasing a variable-speed pool pump,
following the program incentive and energy savings (Key Finding 5c).

 Figure 4. Reasons for Choosing Specific Model of Variable-Speed Pump

 Source: Participant Survey Question D5. “Why did you select the specific model and brand of pool pump
 that you purchased through the Swimming Pool Efficiency Program?” (multiple response)

 20
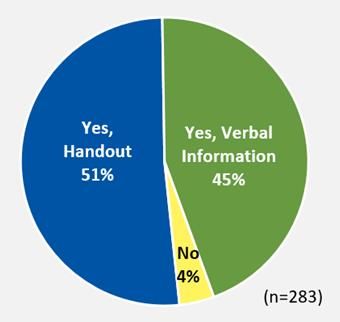
Installation
To be eligible to receive the $400 rebate, the new pool pump had to be installed by the vendor. As
shown in Figure 5, 96% of respondents received information about their pool pump at the time of
installation, either verbally (45%) or on a handout (51%).

 Figure 5. Information Provided by the Pool Pump Installer

 Source: Participant Survey Question C7. “Did your pool pump installer provide you with information about
 your pool pump?”

In a follow up question, 84% of respondents reported not needing more information from their pool
pump installer at the time of installation. Ten percent of respondents would have liked to receive
additional information, primarily on how to program the pool pump.

Satisfaction
As shown in Figure 6, respondents reported being highly satisfied with their program experience.
Specifically, most respondents reported being very satisfied with their interactions with the pool
pump vendor (82%), with the performance of their pool pump (84%) and with the program overall
(83%) (Key Finding 1c).

 21
Figure 6. Participant Satisfaction with Swimming Pool Efficiency Program Source: Participant Survey Question F1. “In terms of the Swimming Pool Efficiency Program, how satisfied were you with…” A few respondents reported being not at all satisfied or only a little satisfied with their interactions with the pool pump vendor (5%), the performance of their pool pump (3%) and the program overall (4%). When prompted, respondents gave the following details about being dissatisfied with their interactions with the vendor: Poor installation. Five respondents (2%) noted that the quality of the installation was poor. Lack of timeliness. Two respondents (1%) remarked that the installer did not show up at the scheduled date and time. As for the variable-speed pool pump itself, a few respondents stated the two issues: Poor suction. Two respondents (1%) mentioned that the pump generated poor suction. Unit incompatibility. Two respondents (1%) reported compatibility issues with their heater. When asked for recommendations to improve the program, respondents had several suggestions: Advertising. Eight respondents (9%) suggested more program advertising. Additional rebates. Eight respondents (9%) suggested offering incentives for additional energy- efficient products, such as heaters, filters and solar power pool pumps Education on pump. Seven respondents (8%) suggested that the vendors provide more information about the variable-speed pump. Self-installation. Four respondents (4%) suggested allowing participants to install the new pump themselves to save money on installation costs. LDC Experience The lead LDC staff reported being satisfied with the program, citing the effective delivery model and the productive relationships with the vendors and with the Pool and Hot Tub Council of Canada. 22
However, all three LDC staff mentioned having difficulties with meeting their participation targets. Two
LDCs mentioned during the interviews that awareness and vendor recruitment were more time
consuming than they anticipated and that the participation targets in the business cases did not
consider enough time for program ramp up. The third LDC explained the lower-than-expected
participation by noting the difficulty with capturing the complete market for variable-speed pumps,
especially online pool pump sales (which are not eligible for the program). In their analysis, some
individuals are retrofitting their pumps with variable-speed pumps purchased online that are therefore
not eligible for the program. Furthermore, one LDC reported that they expect participant recruitment to
be easier in PY2018 since vendors are already familiar with the program. This was supported by another
LDC who reported already having a backlog of customers ready to participate in PY2018.

All three lead LDC staff identified the importance of having a line of communication and support for the
participating vendors. They highlighted the need to answer vendor questions as quickly as possible to
ensure a smooth application process. To this end, two lead LDCs set up a hotline for vendors to contact
any time to ask questions and receive application support. Several interviewed vendors reported using
the hotline and appreciating the availability of this support.

Additional areas exist for sharing resources across LDCs to reduce costs, improve consistency and
improve vendor support. For example, Ottawa Hydro and Toronto Hydro used a hotline to provide
vendor and customer support, which proved useful and represents the type of activity that could be
shared across the other LDCs to benefit vendors in other regions (Key Finding 7c).

Market Actor Experience
The Cadmus team interviewed 39 pool pump vendors. This section describes their experiences regarding
awareness, motivation, barriers, training, outreach, the pool pump market and overall program
satisfaction.

Among the vendors interviewed, 80% represented small businesses with fewer than 15 employees.
These vendors described their business activities as selling equipment and offering maintenance services
(72%). Almost all vendors (95%) reported doing at least some variable-speed pool pump installations
themselves, while 5% exclusively subcontract the installations.

Awareness and Motivation
The LDCs held training and information sessions at the Pool and Hot Tub Council of Canada meetings to
inform pool pump vendors about the program. As shown in Figure 7, interviewed vendors reported
becoming aware of the program primarily through the Pool and Hot Tub Council of Canada (67%), with
variable-speed pump manufacturers (21%) having the second greatest influence on program awareness.

 23
Figure 7. Vendor Program Awareness

 Source: Vendor Interview Question C1. “How did you first hear about the Swimming Pool Efficiency Program?”

As illustrated in Figure 8, vendors cited the opportunity to increase their sales (56%) and to offer their
customers a rebate (49%) as primary motives for participating in the program. In addition, 15% said they
participated to stay competitive.

 Figure 8. Vendor Motivations to Participate

 Source: Vendor Interview Question C2. “What motivated your company to participate in the program?”
 (multiple response)

Barriers
To understand barriers to program participation, the Cadmus team also interviewed three vendors who
had completed the training with the LDC but did not register variable-speed pool pumps program sales
in PY2017. These vendors said they did not participate in the program due to the lack of their customers’
eligibility, either because they were not a customer of one of the participating LDCs or because they
were installing a new pool. One vendor mentioned that even with the rebate, the high price of variable-
speed pumps makes them more difficult to sell.

 24
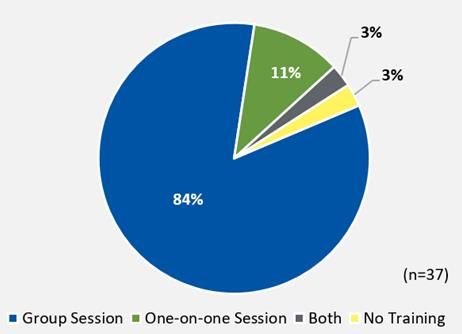
Training Eight-four percent of vendors participated in a group training session at a Pool and Hot Tub Council of Canada meeting. One-on-one sessions were given to the 11% of vendors who missed the group training sessions (Figure 9). Another 3% of vendors benefited from both the group and one-on-one sessions. Figure 9. Vendor Training Participation Source: Vendor Interview Question D2. “Your LDC offered training sessions about the Swimming Pool Efficiency Program. Did you participate in a group training session or in a one-on-one session?” Note: One vendor, who reported having participated in leading the training given to other vendors, was excluded from results reported in Figure 9. The interviewed vendors reported that the content of the training was clear and that program information was well communicated. When asked, vendors cited several items as the most important aspect of the training: Understanding how the program worked in general (34%) Understanding how to fill out all the necessary paperwork to submit a rebate claim (24%) Understanding equipment and customer eligibility requirements (10%) Four vendors suggested specific areas to provide more detailed information during trainings: Program processes. Two vendors suggested a more detailed walk-through of the entire program participation process, from filling out the paperwork to outlining what information to collect when on the site with a customer. Customer educational information. One vendor suggested providing additional materials to help explain the energy savings benefits to customers. Marketing rules. One vendor suggested providing more information on marketing rules, such as guidelines for the vendor use of LDC logos. 25
You can also read