The Agriculture-Nutrition-Income Nexus in Tonga: Is Postharvest Loss Undermining Horticulture Market Efficiency in Tonga? - MDPI
←
→
Page content transcription
If your browser does not render page correctly, please read the page content below
horticulturae

Article
The Agriculture–Nutrition–Income Nexus in Tonga:
Is Postharvest Loss Undermining Horticulture Market
Efficiency in Tonga?
Steven J. R. Underhill 1,2, * , Soane Patolo 3 , Yuchan Zhou 1 and Sarah Burkhart 1
 1    Australian Centre for Pacific Islands Research, University of the Sunshine Coast, Sippy Downs Queensland
      4556, Australia; yzhou1@usc.edu.au (Y.Z.); sburkhar@usc.edu.au (S.B.)
 2    Department of Crop Production, College of Agriculture, Fisheries and Forestry, Fiji National University,
      Nausori, Suva, Fiji
 3    MORDI Tonga Trust, Vaha’akolo Road, Haveluloto, Nuku’alofa P.O Box 996, Tonga; soanejr@morditonga.to
 *    Correspondence: Sunderhi@usc.edu.au; Tel.: +61-7-412140032

 Received: 24 June 2020; Accepted: 15 September 2020; Published: 1 October 2020

 Abstract: The Kingdom of Tonga has one of the highest rates of diet-related non-communicable
 diseases (NCDs) in the world. Initiatives to promote pro-health dietary behaviour are possibly
 being compromised by poor or inconsistent consumer accessibility to affordable and safe fresh fruits
 and vegetables, referred to as the agriculture–nutrition–income nexus. While donors increasingly
 focus on nutrition-sensitive agriculture across the Pacific, there is little contemporary information
 concerning Tonga’s domestic horticultural distribution and market system, particularly in regards to
 food loss. This study surveyed 292 municipal and road-side vendors on Tongatapu and ‘Utu Vava’u
 Islands, with the aim of mapping and analyzing horticultural markets and farm supply, transport
 logistics, and quantifying postharvest practice and market loss. Tonga’s domestic horticultural
 market structure consists of a central municipal market and on Tongatapu Island, a supplementary
 network of urban and rural based road-side vendors. There is limited inter-island trade, with most
 farms located within 25 km of the central municipal market. Mean postharvest horticultural loss
 was very low, at 1.4% to 5.3%, with road-side vendors more vulnerable to loss. This level of loss was
 thought to reflect short intra-island transport distance, the type of crops being traded, and rapid
 market throughput, rather than a level of value chain efficiency. Vendors regulated market supply
 volume and price discounting and were the principal strategies to mitigate postharvest loss. While
 low levels of postharvest loss, short transport logistics, and fast market throughput are consistent
 with a relatively efficient horticulture market system, vendor practice may be impeding fresh fruit
 and vegetable accessibility.

 Keywords: pacific; agriculture; food security; non-communicable diseases

1. Introduction
     The Kingdom of Tonga has one of the highest rates of diet-related non-communicable diseases
(NCDs) in the world, with poor food choices and dietary behaviour as key contributors [1–3].
The incidence of type-two diabetes amongst the adult-age Tongan population has increased from
5.2% in 1973 to 19.0% in 2012, and is anticipated to currently be approximately 22% [4], relative to a
global diabetes prevalence rate of 8.8% [5]. Life expectancy in Tonga is in decline, primarily due to
NCD-related mortalities [6]. In response, Tonga has introduced a plethora of initiatives and policies
aimed at promoting healthy eating and lifestyle [7]. While such interventions have helped raise
local community awareness, there has been limited and inconsistent formative dietary transition.
One resistor to adopting pro-health dietary behaviour is that consumer accessibility to affordable and

Horticulturae 2020, 6, 61; doi:10.3390/horticulturae6040061                  www.mdpi.com/journal/horticulturae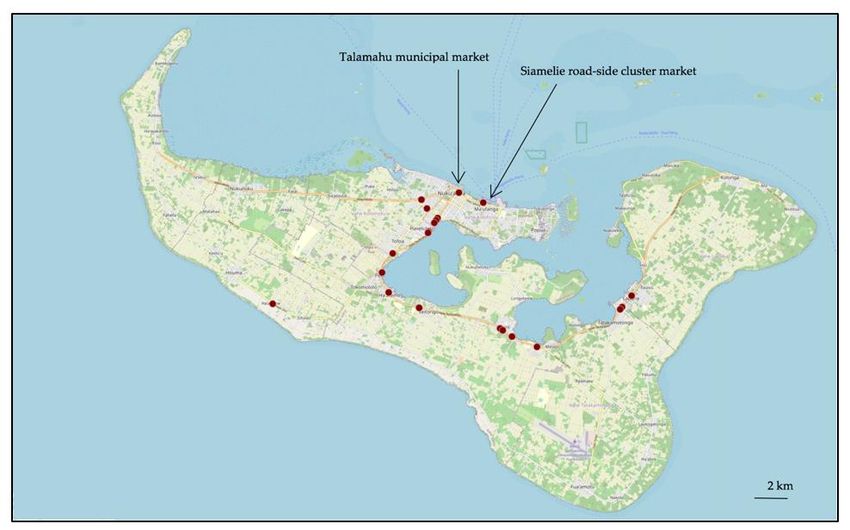
Horticulturae 2020, 6, 61                                                                              2 of 17

safe fresh fruits and vegetables in Tonga is often challenging. Tonga’s domestic horticultural fresh food
system has long been constrained by low horticultural productivity, limited access to arable land, little
crop diversity and a high seasonality of product supply. While imported fresh fruits and vegetables
can help offset inconsistencies in the local supply, imported products remain comparatively expensive,
creating additional price-based disincentives to increased consumption [8,9].
      Evans [1,2] was one of the first to highlight NCD-related community health implications associated
with deficiencies in Tonga’s horticultural food system. Recent reference to Tonga’s agriculture–
nutrition–income nexus [3], nutrition-sensitive agriculture [10], and the inclusion of the horticulture
enterprise development within Tonga’s NCD strategy [7] reflects an increased appreciation of the close
interconnectivity between horticultural-based food systems and NCD remediation. While donors
have progressively focused on supporting nutrition-sensitive agriculture across the Pacific, there is
surprisingly little contemporary information concerning Tonga’s horticultural fresh food system. This is
further complicated by the fact that Tonga’s horticultural fresh food system is highly heterogeneous,
being a composite of subsistence farming, communal sharing and commercial value chains that
collectively exhibit a high degree of spatial and temporal variance [8,11,12].
      Household expenditure census data provides some insight, with consumers in Tonga becoming
more reliant on commercial value chains to source their fresh fruits and vegetables [11,12]. A rapid
proliferation in the level of private vehicle ownership in Tonga [12,13] is also likely to be transforming
how and where local consumers commercially access fresh food. Tonga’s central fruit and vegetable
markets, which have long dominated the horticultural fresh food system [14], are being progressively
supplemented by an expanding network of road-side vendors [8,9]. In the context of a local horticultural
fresh food system in apparent transition, the horticultural value chains supporting these market
have received little or no attention. Potential key risk factors within these value chains, such as
postharvest handling practice, transport logistics, market storage conditions, and knowledge and
capacity, are unclear. The level of horticultural postharvest loss, a possible indicator of market efficiency,
has never been reported for Tonga. This lack of basic information on the structure and function of
the horticultural market and distribution system in Tonga, potentially impedes the development of
targeted interventions seeking to improve the enabling horticultural fresh food environment.
      This study was undertaken to provide baseline information on Tonga’s local horticultural fresh
food system and the level of horticultural food loss to support future donor interventions aimed
at enhancing consumer accessibility of locally grown fresh fruits and vegetables. The fruit and
vegetable municipal markets and road-side vendors were spatially mapped, with transport logistics
and postharvest handling practice documented. The level of postharvest loss per market type,
possible loss contributors, and market vendor strategies to mitigate against postharvest food loss are
further discussed.

2. Materials and Methods

2.1. Location
      The Kingdom of Tonga is a Polynesian sovereign state located in the South Pacific consisting of
169 islands, of which 39 are inhabited, and has a total population of 100,650. This study was undertaken
on two islands in the Tongan archipelago, the main island of Tongatapu and the northern Vava’u island
group (Figure 1A). Tongatapu island has a land area of 260 km2 with 70% of Tonga’s total population
(Figure 1B). The island group of Vava’u, which is located 313 km north of Tongatapu, includes the
main island of ‘Utu Vava’u, with a land area of 97 km2 , and 40 close proximity smaller islands, and has
approximately 15% of Tonga’s total population [15] (Figure 1C).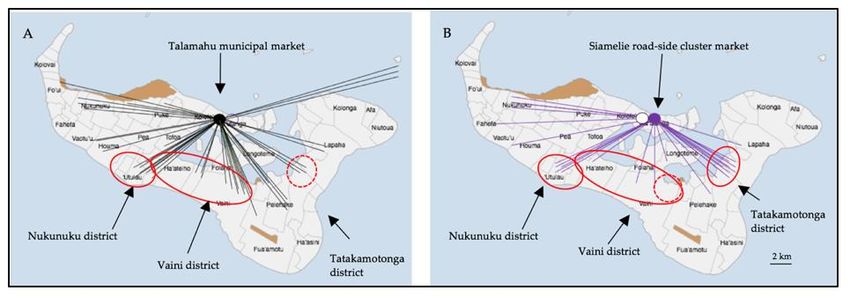
through the municipal markets and road-side vendor stalls [8,14]. In the few retail shops and
 supermarkets where fresh fruits and vegetables are sold, trade was restricted to small quantities and
 a limited range of primarily imported horticultural products (such as temperate fruits and potato),
 or the re-selling of product sourced from the municipal market [8]. This study did not seek to quantify
 consumer2020,
Horticulturae accessibility
                 6, 61      to fresh fruits and vegetables or the price or volume of horticultural product
                                                                                                    3 of 17
 traded through Tonga’s domestic markets.

     Figure 1. (A) Map of Tonga and the wider South Pacific region. (B) Map of Vava’u Island, Tonga. (C)
      Figure
     Map      1. (A) MapIsland,
          of Tongatapu   of Tonga  and the
                                Tonga. Mapwider South
                                           sources: (A)Pacific region.
                                                        CartoGIS       (B) Map
                                                                   Services,    of Vava’u
                                                                             College      Island,
                                                                                     of Asia      Tonga.
                                                                                             and the      (C)
                                                                                                     Pacific,
      Map  of Tongatapu   Island, Tonga. Map sources: (A) CartoGIS
     The Australian National University 2019. (B,C) Opentopmap©.    Services, College of Asia and the Pacific,
      The Australian National University 2019. (B,C) Opentopmap© .
2.2. Markets Outlets Assessed
        On Tongatapu Island, market surveys were undertaken at the Talamahu municipal market in
       This study focused on three types of fresh fruit and vegetable retail outlets: the municipal markets;
  Nuku’alofa, the Siamelie road-side cluster market in Ma’ufanga (Ma’ufanga village is only 2.1 km
road-side cluster markets (defined as being ten or more road-side vendors co-located within the same
  from Nuku’alofa), and the road-side vendor stalls located throughout the island.
structure or building); and individual road-side market vendor stalls (including semi-permanent
        On ‘Utu Vava’u Island, market surveys were limited to the Utukalongalu municipal market, in
road-side structures, and temporary or mobile street stalls). Retail shops and supermarkets were
  the main town of Neiafu. An initial plan to include road-side vendors on ‘Utu Vava’u Island was
excluded from this study. In Tonga, fruits and vegetables are primarily sold through the municipal
  discontinued early in the study due to an insufficient number of vendors present.
markets and road-side vendor stalls [8,14]. In the few retail shops and supermarkets where fresh
fruits and vegetables are sold, trade was restricted to small quantities and a limited range of primarily
  2.3. Survey Design and Ethics Approval
imported horticultural products (such as temperate fruits and potato), or the re-selling of product
sourced Fruit
           fromandthevegetable
                      municipal  vendor
                                   marketsurveys
                                           [8]. Thiswere   undertaken
                                                       study             throughout
                                                              did not seek   to quantify 2019   to account
                                                                                            consumer        for possible
                                                                                                        accessibility to
  seasonality
fresh           differences.
        fruits and   vegetablesOnorTongatapu
                                     the price Island,   surveys
                                                 or volume          were conducted
                                                               of horticultural         in February
                                                                                  product             to March,
                                                                                             traded through       May to
                                                                                                                Tonga’s
  June, September,
domestic    markets. and November to December. A total of 238 vendors were surveyed on Tongatapu
  Island,
       On consisting
           TongatapuofIsland,
                           86 vendors   at the
                                   market       Talamahu
                                           surveys           municipal market,
                                                      were undertaken               41 vendorsmunicipal
                                                                           at the Talamahu        at the Siamelie
                                                                                                             marketroad-
                                                                                                                      in
  side clusterthe
Nuku’alofa,       market,
                    Siamelieand   111 road-side
                               road-side           vendors.
                                         cluster market        Variable sampling
                                                            in Ma’ufanga   (Ma’ufanga  between
                                                                                           villagemarkets   was
                                                                                                   is only 2.1 kmdue
                                                                                                                   fromto
  differences in
Nuku’alofa),       thethe
                 and    number    of vendors
                           road-side  vendorpresent      withinthroughout
                                                stalls located    each market thecohort.
                                                                                   island.
        On‘Utu
       On    ‘UtuVava’u
                   Vava’uIsland,
                             Island,market
                                     vendorsurveys
                                               surveys were
                                                         were limited
                                                                limited to
                                                                         to the
                                                                             Utukalongalu
                                                                                 Utukalongalu  municipal   market,
                                                                                                    municipal        and
                                                                                                                market,
inundertaken
    the main townin February,
                       of Neiafu.June
                                   Anand   September.
                                       initial            In total,road-side
                                               plan to include      54 municipal
                                                                              vendorsmarket   vendors
                                                                                          on ‘Utu       were
                                                                                                    Vava’u     surveyed.
                                                                                                            Island  was
  The Utukalongalu
discontinued             municipal
                  early in the studymarket
                                       due towas    a comparatively
                                               an insufficient   numbersmall  regional present.
                                                                          of vendors      market, with approximately
  15 to 30 vendors and vendor market attendance temporally concentrated to the key trading days of
2.3.  Survey
  Friday   andDesign   and Ethics Approval
                Saturday.
     Fruit and vegetable vendor surveys were undertaken throughout 2019 to account for possible
seasonality differences. On Tongatapu Island, surveys were conducted in February to March, May to
June, September, and November to December. A total of 238 vendors were surveyed on Tongatapu
Island, consisting of 86 vendors at the Talamahu municipal market, 41 vendors at the Siamelie road-side
cluster market, and 111 road-side vendors. Variable sampling between markets was due to differences
in the number of vendors present within each market cohort.
     On ‘Utu Vava’u Island, vendor surveys were limited to Utukalongalu municipal market,
and undertaken in February, June and September. In total, 54 municipal market vendors were surveyed.
The Utukalongalu municipal market was a comparatively small regional market, with approximately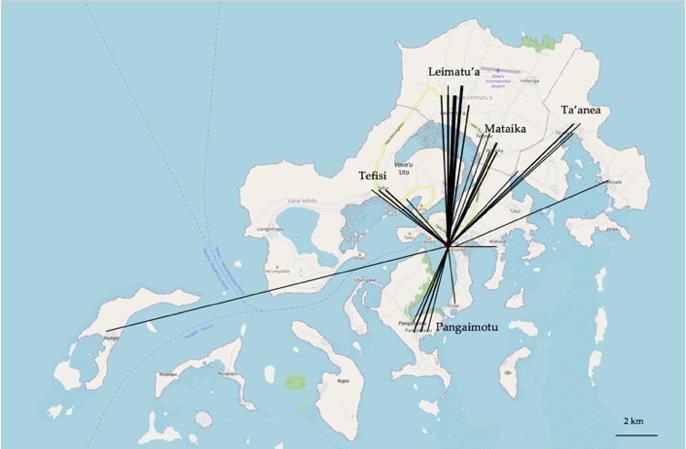
Horticulturae 2020, 6, 61 4 of 17
15 to 30 vendors and vendor market attendance temporally concentrated to the key trading days of
Friday and Saturday.
The market surveys involved a short semi-structured interview undertaken in the local language,
with each interview lasting 5 to 10 min. The survey included 27 questions covering vendor stall
location, farm location (village or farm location where product was sourced), crop type, harvesting
practice, packaging, transport logistics, potential vendor strategies to reduce loss, and crops or villages
anticipated to incur elevated postharvest loss. Survey data was recorded using tablets with GIS location
capacity incorporating KokoToolBox software™ (Harvard Humanitarian Initiative, Cambridge, MA,
USA), with vendor responses recorded in English. To reduce error and ensure a standard approach
when interviewing participants, all enumerators received prior training as well as refresher training.
All interviews were completed in full compliance with approval from the University of the Sunshine
Coast, Australia, Human Research Ethics Committee (A16814).
2.4. Postharvest Loss
Postharvest loss was determined based on vendor recall, consistent with other Pacific market
studies [16–18]. Loss was calculated on the basis of weight, volume or amount of product removed for
commercial sale by the vendor, proportional to the total consignment sourced by the vendor. Calculated
postharvest loss does not account for potential re-use (i.e., unsold product being re-directed for home
use or animal feed) or on-farm loss (i.e., pre-transport grading). Postharvest loss presented in this
paper represents the level of loss incurred on the day of survey. Given some product was traded over
several days, the level of postharvest loss per consignment is a multiple of the market storage duration
and percent of daily loss. Given horticultural value chains in Tonga rarely involve middle actors
(between farmers and market vendors) [16–18], and that there was limited on-farm grading observed
during pre-trial farm visits, postharvest loss was only quantified at the market end of the chain.
2.5. Data Analysis
Significant differences in mean time of transport from farm to market, between harvesting and
product arrival at market and the mean time since product was harvested, were tested using analysis
of variance (ANOVA) followed by Tukey’s multiple comparison test at p < 0.05. Significant differences
in horticultural loss among vendors from different market were analyzed by the Kruskal–Wallis H test
(IBM SPSS Statistics version 24).
3. Results
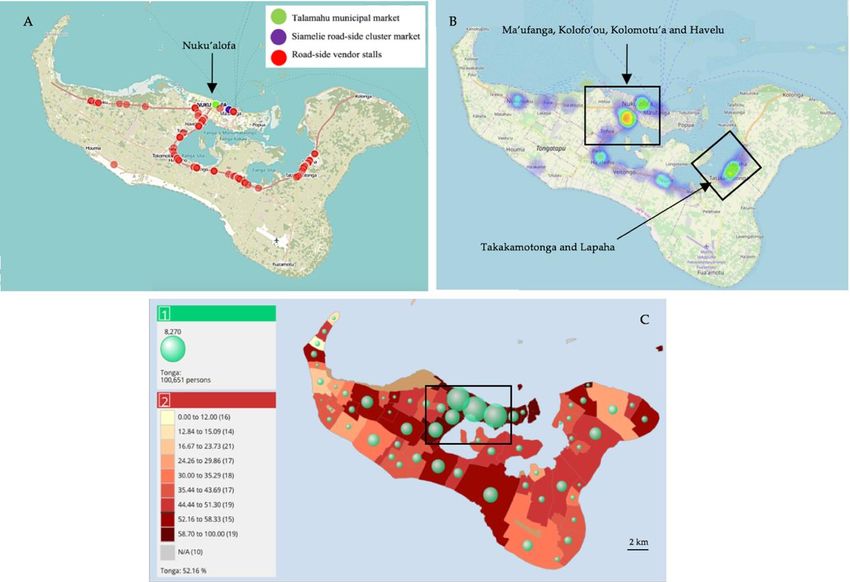
The location of the fruit and vegetable markets and road-side vendor stalls on Tongatapu Island
are shown in Figure 2A. Road-side vendor stalls were concentrated along the main access roads into
the capital of Nuku’alofa, with the Talamahu municipal market and the Siamelie road-side cluster
market located in the central business districts of Nuku’alofa and Ma’ufanga, respectively. There were
very few road-side vendors and no municipal markets present on the southern or northeastern parts of
Tongatapu. A heat map of vendor trading, based on number of road-side market vendors per location,
is shown in Figure 2B. The greatest concentration of road-side vendors was in the urban-based villages
of Ma’ufanga, Kolofo’ou, Kolomotu’a, and Havelu (i.e., a village is a geographic division within the
Tongan census), all of which were within a 4 km radius of the central business district of Nuku’alofa
(Figure 2B). These villages were charaterised as having a relatively high population density and a large
number (>58%) of households not producing crops for sale or home use (Figure 2C). Most of these
households are likely to be reliant on the commercial food system or communal sharing to source their
fruits and vegetables. Elevated road-side vendor participation in the township of Mu’a in eastern
Tongatapu, between the villages of Lapaha and Takakamotonga (Figure 2B), is interesting given its
relatively small population, rural location and moderate number of households not producing crops
for sale or home use.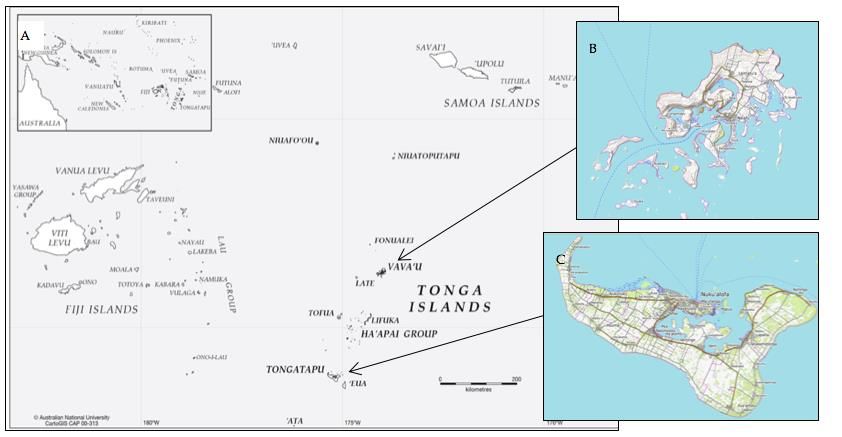
On the northern Island of ‘Utu Vava’u, commercially sourced fresh horticultural product was
restricted to the Utukalongalu municipal market, located in the main urban population centre of
Neiafu (Figure 3A,B). While road-side vendors were present, vendor participation was very limited
and typically involved single-day trading. Using Google Earth Pro™ to calculated non-linear path
distance using
Horticulturae 2020, 6,on
61 the existing road network, most households on Utu Vava’u Island were located
5 of 17
within 15 km of the Utukalongalu municipal market.
Figure
Figure 2. location of
2. (A) The location of commercial
commercial fresh
fresh fruit
fruit and
and vegetable
vegetable vendors
vendors on
on Tongatapu
Tongatapu Island,
Island,
Tonga.
Tonga. (B)
(B) Heat
Heat map
map ofof road-side
road-side markets on Tongatapu Island (colour
(colour intensity
intensity is
is proportional
proportional to
to
the number of vendor
the number of vendor stalls in a given location). (C) Households on Tongatapu Island not producing
(C) Households on Tongatapu Island not producing
crops
crops for
for sale
sale or
or home
home use,
use, with
with population
population density overlay. Map source: (A,B)
(A,B) Openstreet
Openstreet map
map and
and
KoBoToolBox™
KoBoToolBox™ with with survey
survey datadata overlays. PopGIS Tonga 2016 Population
overlays. (C) PopGIS and housing
Population and housing census
census
data.
data. Tonga
Tonga Department
Department of of Statistics.
Statistics.
The
The road-side
location of vendors
farms throughout
supplying the Tongatapu
Talamahu Island were observed
municipal market andto frequently co-locate
the Siamelie with
road-side
other commercial enterprises (i.e., petrol stations and retail outlets), or were
cluster market on Tongatapu Island are shown in Figure 4. Whilst the Talamahu and Siamelie positioned adjacent to key
public amenities (i.e., hospitals and schools), possibly enhancing their level of
markets are in close proximity to each other, the network of farms supporting these markets was consumer accessibility.
The presence
slightly of several
different. Vendorspublicatamenities in Mu’a
the Talamahu townshipmarket
municipal might explain
sourcedthe concentration
from of vendors
farms in Vaini and
in Lapaha and Takakamotonga. Using Google Earth Pro™ to calculate
Nukunuku districts and, to a lesser extent, Kolofo’ou district (western Tongatapu) and linear distance and the GIS
location of vendors,
Tatakamotonga most(eastern
district households on Tongatapu
Tongatapu) (FigureIsland were1).located
4A, Table within
There was 10limited
also km of asupply
commercial
from
outlet selling(Table
‘Eua Island fresh 1).
fruitIn or vegetables,the
comparison, with road-side
Siamelie vendors
road-side the market
cluster most accessible
primarilywith respect
sourced fromto
travel distance.
farms in the Tatakamotonga, Nukunuku and the western portion of Vaini district (Figure 4B). The
mainOn the of
point northern
differenceIsland of ‘Utu
between Vava’u,
these two commercially
markets was asourced
greater fresh horticultural
prevalence product
of supply from was
the
restricted to the Utukalongalu municipal market, located in the main urban
Tatakamotonga district into the Siamelie market, and a greater supply from Vaini district into thepopulation centre of
Neiafu (Figure 3A,B). While road-side vendors were present, vendor participation was very limited
and typically involved single-day trading. Using Google Earth Pro™ to calculated non-linear path
distance using on the existing road network, most households on Utu Vava’u Island were located
within 15 km of the Utukalongalu municipal market.
The location of farms supplying the Talamahu municipal market and the Siamelie road-side
cluster market on Tongatapu Island are shown in Figure 4. Whilst the Talamahu and Siamelie
markets are in close proximity to each other, the network of farms supporting these markets was
slightly different. Vendors at the Talamahu municipal market sourced from farms in Vaini and
Nukunuku districts and, to a lesser extent, Kolofo’ou district (western Tongatapu) and Tatakamotonga
district (eastern Tongatapu) (Figure 4A, Table 1). There was also limited supply from ‘Eua Island
(Table 1). In comparison, the Siamelie road-side cluster market primarily sourced from farms in the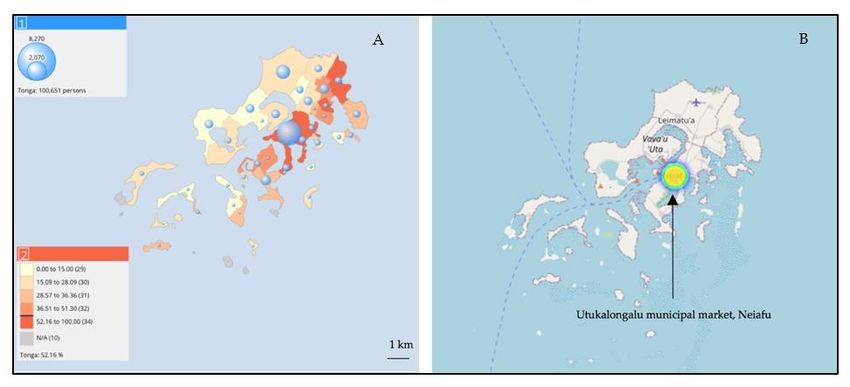
Horticulturae 2020, 6, 61 6 of 17
Horticulturae 2020, 10, x FOR PEER REVIEW 6 of 17
Tatakamotonga, Nukunuku and the western portion of Vaini district (Figure 4B). The main point of
Horticulturae 2020, 10, x FOR PEER REVIEW
Talamahu between
difference municipal market.
these two The reason
markets was fora greater
this disparity is notof
prevalence clear. Although
supply Siamelie 6road-
theTatakamotonga
from the
of 17
side cluster
district market
intomunicipal
the wasmarket,
Siamelie located nexta greater
to the inter-islandfrompassenger ferry
intoterminal, no inter-island-
Talamahu market. Theand reason for this supply
disparity Vaini
is notdistrict the Talamahu
clear. Although municipal
the Siamelie road-
sourced
market. product
The was
reason mentioned
for this in
disparity theis vendor
not survey
clear. responses.
Although the The location
Siamelie of
road-side farms supplying
cluster market
side cluster market was located next to the inter-island passenger ferry terminal, no inter-island-
road-side
was located vendorsto on
next was the Tongatapu
inter-island Island
passengercould notterminal,
be determined, as road-side vendors were
sourced product mentioned in the vendorferry
survey responses. no inter-island-sourced
The location of farms product was
supplying
unwilling to
mentionedvendors identify.
in the vendor Farms supplying
survey responses. the Utukalongalu
The location municipal market,
of farms supplying Utu Vava’u
road-side Island,
vendors are
on
road-side on Tongatapu Island could not be determined, as road-side vendors were
shown
Tongatapu in Figure
Island 5. Utukalongalu
could not be vendors
determined, primarily
as road-side sourced
vendors produce
were from
unwillingone of
to five villages—
identify. Farms
unwilling to identify. Farms supplying the Utukalongalu municipal market, Utu Vava’u Island, are
Leimatu’a,the
supplying Mataika, Tefisi, municipal
Utukalongalu Ta’anea and Panagaimotu
market, Utu Vava’u (Figure
Island,5).
areOfshown
the 43invillages onUtukalongalu
Vava’u [12],
shown in Figure 5. Utukalongalu vendors primarily sourced produce from Figure
one of5.five villages—
54.6%
vendors of the product
primarily supplying
sourced the
produce Utukalongalu
from one of market
five was sourced
villages—Leimatu’a, from farms
Mataika, associated
Tefisi, with
Ta’anea
Leimatu’a, Mataika, Tefisi, Ta’anea and Panagaimotu (Figure 5). Of the 43 villages on Vava’u [12],
just three villages—Leimatu’a,
and Panagaimotu (Figure Mataika
5). Ofthe and
theUtukalongalu Tefisi (Table
43 villages on market 1).
Vava’u was[12],sourced
54.6% offromthe product supplyingwiththe
54.6% of the product supplying farms associated
Utukalongalu
just market was sourced
three villages—Leimatu’a, from and
Mataika farms associated
Tefisi (Table with
1). just three villages—Leimatu’a, Mataika
and Tefisi (Table 1).
Figure 3. (A) Number of households on ‘Utu Vava’u Island not producing crops for sale or home use,
Figure 3. (A) Number
with population densityof households
overlay. (B)on ‘Utu
Heat Vava’u
map Island
of ‘Utu not producing
Vava’u crops for the
Island, illustrating saleconcentration
or home use,
Figure
with 3. (A) Number
population of overlay.
density households
(B) on ‘Utu
Heat Vava’u
map of Island
‘Utu notIsland,
Vava’u producing crops for
illustrating thesale or home use,
concentration of
of market vendors at the Utukalongalu municipal market. Map source: (A) PopGIS Tonga 2016
with population
market vendors density
at the overlay. (B)municipal
Utukalongalu Heat map of ‘UtuMap
market. Vava’u Island,
source: (A) illustrating
PopGIS Tonga the concentration
2016 Population
Population and housing census data. Tonga Department of Statistics. (B) Openstreet map and
of
andmarket
housingvendors
census at the Tonga
Utukalongalu municipal market. Map source: (A) PopGIS Tonga 2016
KoBoToolBox™ withdata.
survey dataDepartment
overlays. of Statistics. (B) Openstreet map and KoBoToolBox™
Population and housing
with survey data overlays. census data. Tonga Department of Statistics. (B) Openstreet map and
KoBoToolBox™ with survey data overlays.
Figure 4. The location of farms supplying the main fruit and vegetable markets on Tongatapu Island.
Figure 4. The location of farms supplying the main fruit and vegetable markets on Tongatapu Island.
(A) Talamahu municipal market in central Nuku’alofa, Tongatapu Island. (B) Siamelie road-side cluster
(A) Talamahu municipal market in central Nuku’alofa, Tongatapu Island. (B) Siamelie road-side
market4.Ma’ufanga,
Figure Tongatapu
The location Island. Map
of farms supplying thesource: Open
main fruit street
and map 2019
vegetable and on
markets KoBoToolBox™ with
Tongatapu Island.
cluster market Ma’ufanga, Tongatapu Island. Map source: Open street map 2019 and KoBoToolBox™
survey overlays.
(A) Talamahu municipal market in central Nuku’alofa, Tongatapu Island. (B) Siamelie road-side
with survey overlays.
cluster market Ma’ufanga, Tongatapu Island. Map source: Open street map 2019 and KoBoToolBox™
with survey overlays.Horticulturae 2020, 6, 61 7 of 17
Table 1. The horticultural production centres supplying Tonga’s fruit fresh and vegetable markets,
associated transport logistics, and market vendor throughput.
‘Utu Vava‘u Island Tongatapu Island
Utukalongalu Talamahu Siamelie
Road-Side
Market Vendor Practice Municipal Municipal Road-Side Cluster
STALLS ****
Market * Market ** Market ***
Product origin
Intra-island-located farms (%) 100 93 100 95.5
Inter-island-located farms (%) 0 7 0 4.5
Main production sites (% vendors
sourcing from defined villages
and districts)
‘Utu Vava’u Island
Leimatu’a district 49.6 - - -
Leimatu’a village 34.0 - - -
Mataika village 11.2 - - -
Hihifo district 15.1 - - -
Tefisi village 9.4 - - -
Neiafu district 11.3 - - -
Tongatapu Island
Tatakamotonga district - 7.7 24.4 n/a
Nukunuku district - 17.8 19.5 n/a
Vaini district - 22.2 12.2 n/a
Kolovai district - 3.3 12.2 n/a
Mode of product transport from
farm to market (% of vendors)
Private car 21.6 25.6 29.3 27.9
Minivan or local bus 58.8 11.6 9.8 2.7
Truck 17.6 52.3 61.0 61.3
Taxi 0 1.2 0 0
Boat or ferry 2.0 7.0 0 4.5
Walk 0 0 0 2.7
Packaging type used
(% of vendors)
Nil packaging 20.3 44.8 47.6 50.0
Tray 1.6 5.2 4.8 2.6
Plastic bucket 20.3 17.7 14.3 12.3
Plastic crate 18.8 16.7 14.3 7.9
Traditional woven basket 26.6 7.3 7.1 12.3
Small bag (approx. 10 kg) 10.9 6.3 9.5 9.7
Medium bag (approx. 11 to 20 kg) 1.6 2.1 0 3.5
Large bag (>21 kg) 0 0 0 1.8Horticulturae 2020, 6, 61 8 of 17
Table 1. Cont.
‘Utu Vava‘u Island Tongatapu Island
Utukalongalu Talamahu Siamelie
Road-Side
Market Vendor Practice Municipal Municipal Road-Side Cluster
STALLS ****
Market * Market ** Market ***
Mean time to transport product 114.7 bc 39.8 a
20.0 a 57.0 ab
from farm to market (mins) (48.5 a) (35.4 a)
Mean time between harvesting
16.4 ab 13.1 b 15.3 b 24.8 a
and product arrival at market (h) #
Mean time since product was
harvested (including market
storage) (h)V
Fruits 28.0 a 33.6 b 35.7 a 46.3 c
Vegetables 9.6 a 8.9 a 25.3 a 23.6 a
Root crops 25.7 a 34.4 bc 23.9 a 37.7 ab
All crops ˆ 23.9 a 28.2 a 29.5 a 38.9 a
Data presented is based on sampling throughout 2019 to account for possible seasonality effects. * N = 54 vendors
surveyed. ** N = 86 vendors surveyed. *** N = 41 vendors surveyed. **** N = 111 vendors surveyed. n/a. Data
not available. # Mean time between harvesting and product arrival was calculated based on vendor response
but excludes crops harvested >2 days ago to avoid inclusion of possible in-market storage. V Values followed by
different letters on the same column are significantly different (ANOVA, p < 0.05). ˆ Values followed by different
letters on the same segment are significantly different (ANOVA, p < 0.05). Values in parenthesis exclude inter-island
Horticulturae 2020, 10, x FOR PEER REVIEW
value chains. 7 of 17
Figure
Figure 5. The location
5. The location of
of farms
farms supplying
supplying fruits
fruits and
and vegetables
vegetables into
into the
the Utukalongalu
Utukalongalu municipal
municipal
market, Neiafu, Utu Vava’u Island. Map source: Open street map 2019 and KoBoToolBox™
market, Neiafu, Utu Vava‘u Island. Map source: Open street map 2019 and KoBoToolBox™ with survey
with
result overlays.
survey result overlays.
Intra-island horticultural transport logistics into the Talamahu municipal market, the Siamelie
Table 1. The horticultural production centres supplying Tonga’s fruit fresh and vegetable markets,
road-side cluster market or the road-side market was predominantly by truck (Table 1). Less commercial
associated transport logistics, and market vendor throughput.
modes of product transport (private car, minivan, taxi and walking) collectively accounted for
‘Utu Vava‘u Island Tongatapu Island
Siamelie
Utukalongal Talamahu
Road-Side Road-Side
Market Vendor Practice u Municipal Municipal
Cluster STALLS ****
Market * Market **
Market ***Horticulturae 2020, 6, 61 9 of 17
approximately 40% of the market supply, possibly reflecting the proportion of semi-subsistence farmers
supplying these markets. In contrast, intra-island transport logistics into Utukalongalu municipal
market, Utu Vava’u Island was primarily by minivan, consistent with the reduced volume of product
supplying this market, shorter transport distance and possibly reduced access to commercial transport
options (Table 1).
With most intra-island farms on Tongatapu Island located less than 25 km from the municipal
market, product transport time was very short (35 to 57 min) (Table 1). In spite of the obvious benefits
of their close proximity to the market, there was often a delay of up to 25 h between harvest and
transport, with product commonly stored overnight prior to transport to the market the following
day (Table 1). A similar transport lag occurred in chains supplying the Utukalongalu municipal
market. This delay may be due to challenges in accessing labour or commercial transport, or might
simply reflect on-farm practices such as sorting, washing, grading, or packing undertaken prior to
transport. A further possible explanation for this delay might involve the time required to consolidate
multi-product consignments for co-transport (i.e., a common practice).
At the time of individual vendor surveys, most product presented for sale had been harvested
24 to 39 h prior (Table 1). This period represents delayed market transport and some market storage.
With 39% to 50% of product traded through markets in Tongatapu sold on the day of arrival (Table 2),
the time between harvesting and consumer purchase for most crops is anticipated to be up to 48 h.
Vegetable supply chains into the Talamahu municipal market and road-side vendors were significantly
quicker. There was little difference between vegetable, root crop or fruit chains into the Siamelie and
Utukalongalu markets (Table 1). When prolonged market storage (>2 days) was reported by vendors,
it was usually associated with watermelon, tomato, taro, sweet potato, and banana.
Table 2. Frequency of vendor market participation and relative rate of product trading in fruit and
vegetable markets on ‘Utu Vava’u and Tongatapu Islands, Tonga.
‘Utu Vava‘u
Tongatapu Island
Island
Talamahu Siamelie
Utukalongalu
Municipal Road-Side Cluster Road-Side
Municipal
Market Market Stalls ****
Market *
** ***
Frequency of vendor
participation at the market (%)
Daily (6 days a week) 39.6 58.1 70.7 73.9
Often (3 to 4 times a week) 18.9 20.9 22.0 10.8
1 to 2 times a week 22.6 15.1 7.3 4.5
Once a week 18.9 3.5 0 10.8
Percent of vendors selling
product within the
defined period
Product will be sold within 4 h 13.0 4.7 2.4 6.3
Product will be sold within 6 h 9.3 14.0 9.8 6.3
Product will be sold within 8 h 46.3 (68.6) 23.3 (42.0) 26.8 (39.0) 37.8 (50.4)
Product likely sold within 48 h 24.1 9.3 12.2 2.7
Product will take > 2 days to sell 7.4 20.9 24.4 36.0
Vendor not sure when product
0 25.6 26.8 9.9
will be sold
Data presented is based on sampling throughout 2019 to account for possible seasonal variability. * N = 54 vendors
surveyed. ** N = 86 vendors surveyed. *** N = 41 vendors surveyed. **** N = 111 vendors surveyed. Values in
parenthesis represent the percent of vendors who will sell all product within the same trading day.
Horticultural packaging in Tonga was consistent with the typical wide range of options seen
in South Pacific smallholder farmer value chains [17,18] (Table 1). A significant proportion of
product (45% to 50%) supplying the markets in Tongatapu was transported loose (i.e., nil packaging).Horticulturae 2020, 6, 61 10 of 17
This practice principally involved heavy produce such as giant swamp taro, watermelon, taro, yam and
squash. Plastic re-usable crates were used in 12% to 20% of value chains. This represents a relatively
high adoption rate for this type of packaging, relative to smallholder value chains elsewhere in the
South Pacific [17,18]. Utukalongalu municipal market had the highest percent for adoption of plastic
crates and lowest use of nil packaging, compared to all other markets in Tonga (Table 1).
The frequency of vendor participation at the various markets provides some insight into the
operation of these markets (Table 2). Most road-side vendors traded six days a week. In comparison,
vendor participation in Talamahu and Utukalongalu municipal markets was slightly less frequent,
especially in the Utukalongalu municipal market. This is likely to imply a larger proportion of casual
vendors within the municipal markets resulting in a level of concentrated trading (commonly Friday
and Saturday). Further, road-side vendors may be more actively sourcing product from multiple farms
or municipal market sources, creating a greater continuity of product supply. Vendor interviews also
highlighted the practice whereby vendors at the Talamahu provided temporary caretaker custodianship
to adjacent vendor stalls, lessening the need for regular market attendance. This was made possible
by vendors from the same community or village often being located within clusters within the
municipal market. It is possible that road-side vendors had less access to labour-sharing opportunities,
necessitating prolonged market attendance. One road-side vendor trading watermelon indicated that
it could take up to 2 weeks of continuous vendor trading to sell a consignment.
Postharvest loss in Tonga’s fruit and vegetable markets was very low, at 1.4% to 5.3% (Table 3).
Most vendors did not report any loss, with postharvest loss limited to approximately 9% of all vendors,
increasing to 25% in the road-side vendors on Tongatapu. For those vendors that did incur postharvest
loss, mean loss was between 19% and 27%.
Table 3. Mean postharvest horticultural loss and the proportion of vendors reporting postharvest loss
in the fruit and vegetable markets on ‘Utu Vava’u and Tongatapu Islands, Tonga.
Tongatapu Island ‘Utu Vava’u Island
Utukalongalu Talamahu Siamelie
Road-Side
Municipal Municipal Road-Side Cluster
Stalls ****
Market * Market ** Market ***
Mean daily postharvest
2.1 a 2.2 a 1.4 a 5.3 a
loss—all vendors (%) #
Percent of vendors reporting
postharvest loss
Yes 9.3 9.3 9.8 25.2
No 90.7 90.7 90.2 74.8
Mean postharvest loss (%)
22.7 a 26.9 a 19.1 ˆ 21.2 a
(only vendors reporting loss)
Data presented is based on sampling throughout 2019 to account for possible seasonal variability. * N = 54
vendors surveyed. ** N = 86 vendors surveyed. *** N = 41 vendors surveyed. **** N = 111 vendors surveyed.
# Postharvest loss does not account for potential re-use due to product being re-directed for home use or animal
feed, or on-farm loss associated with pre-harvest pest, diseases or pre-transport grading. ˆInsufficient number of
vendors reporting loss for statistical analysis. Values followed by different letters on the same row are significantly
different (Kruskal–Wallis H test, p < 0.05).
The spatial distribution of market vendors on Tongatapu Island reporting postharvest loss is
shown in Figure 6. Vendors with postharvest loss were evenly distributed along the roads into
Nuku’alofa, often adjacent to vendors with no loss. There was no discernable clustering of adversely
impacted road-side vendors, implying that the location of the vendor stall was unlikely to be a
postharvest risk factor.There was little difference between fruit, vegetable and root crop value chains in terms of their
vulnerability to postharvest loss (Table 4). However, tomato, taro, watermelon, banana and plantain
were perceived by vendors to have an elevated risk of incurring postharvest loss. Potentially high-
perishable crops, such as leafy vegetable, were infrequently associated with loss, possibly reflecting
Horticulturae 2020, 6, 61 11 of 17
the low intensity of trading of leafy vegetables within Tonga’s horticulture food system.
Figure 6. The
Figure 6. The spatial
spatial distribution
distribution of
of market
market vendors
vendors on
on Tongatapu
Tongatapu Island
Island who
who reported
reported postharvest
postharvest
loss. Map source: Open street map 2019 and KoBoToolBox™ with survey result overlays.
loss. Map source: Open street map 2019 and KoBoToolBox™ with survey result overlays.
There was little difference between fruit, vegetable and root crop value chains in terms of
Postharvest loss was due to pest, diseases, physical damage, stage of ripeness and, to a lesser
their vulnerability to postharvest loss (Table 4). However, tomato, taro, watermelon, banana and
extent, product size, consistent with pre-harvest, transport and market storage risk factors (Table 4).
plantain were perceived by vendors to have an elevated risk of incurring postharvest loss. Potentially
Vendors reported that the incidence of postharvest loss increased following rain or during the
high-perishable crops, such as leafy vegetable, were infrequently associated with loss, possibly
summer months (Table 4). While it is logical to assume elevated postharvest loss during the warmer
reflecting the low intensity of trading of leafy vegetables within Tonga’s horticulture food system.
summer months, the incidence of postharvest loss associated with vendor surveys undertaken during
Postharvest loss was due to pest, diseases, physical damage, stage of ripeness and, to a lesser
summer (i.e., November to December) period did not support this conclusion.
extent, product size, consistent with pre-harvest, transport and market storage risk factors (Table 4).
Vendors used a range of strategies in an attempt to reduce the incidence or severity of
Vendors reported that the incidence of postharvest loss increased following rain or during the
postharvest loss. Most vendors sought to limit the volume of product being sourced from farms to
summer months (Table 4). While it is logical to assume elevated postharvest loss during the warmer
match anticipated daily consumer demand (Table 4). Vendors also actively used price discounting
summer months, the incidence of postharvest loss associated with vendor surveys undertaken during
and competitive pricing, whereby vendors were prepared to incur a partial economic loss
summer (i.e., November to December) period did not support this conclusion.
presumably to avoid prolonged product storage and associated loss. More direct postharvest
Vendors used a range of strategies in an attempt to reduce the incidence or severity of postharvest
interventions included on-farm grading, covering the product overnight and, to a lesser extent,
loss. Most vendors sought to limit the volume of product being sourced from farms to match anticipated
packing and the application of water were reported (Table 4). The infrequent use of simple low-cost
daily consumer demand (Table 4). Vendors also actively used price discounting and competitive pricing,
strategies such as shade, might indicate limited postharvest handling practice awareness amongst
whereby vendors were prepared to incur a partial economic loss presumably to avoid prolonged
vendors.
product storage and associated loss. More direct postharvest interventions included on-farm grading,
The potential effectiveness of postharvest loss-mitigation strategies can be explored if the cohort
covering the product overnight and, to a lesser extent, packing and the application of water were
of vendors incurring loss and their mitigations strategies are separately considered (Table 4). Vendors
reported (Table 4). The infrequent use of simple low-cost strategies such as shade, might indicate
reporting postharvest loss were less likely to regulate farm supply (37%) or cover product overnight
limited postharvest handling practice awareness amongst vendors.
(28%), but more likely to use price discounting at the end of the day (54%). Although this infers that
The potential effectiveness of postharvest loss-mitigation strategies can be explored if the cohort
market-regulated supply was an effective postharvest loss-mitigation strategy, this disparity may
of vendors incurring loss and their mitigations strategies are separately considered (Table 4). Vendors
simply reflect the type of crops being traded by vendors incurring postharvest loss. Crops likely to
reporting postharvest loss were less likely to regulate farm supply (37%) or cover product overnight
incur elevated loss are more likely to necessitate prolonged market storage due to in-market ripening
(28%), but more likely to use price discounting at the end of the day (54%). Although this infers that
market-regulated supply was an effective postharvest loss-mitigation strategy, this disparity may
simply reflect the type of crops being traded by vendors incurring postharvest loss. Crops likely to
incur elevated loss are more likely to necessitate prolonged market storage due to in-market ripeningHorticulturae 2020, 6, 61 12 of 17
(i.e., tomato and banana) or possible slow market throughput (i.e., taro and watermelon), and, as a
result, there was less vendor capacity or need to regulate supply.
Table 4. Crop type, product quality defects, and external factors attributed to postharvest loss, based
on percent of market vendor response.
Percent Market Vendors
Vendor Perception
(All Markets and Locations) *
Crop type most likely to incur loss
Fruits ** 31.7
Vegetable 35.6
Root crops 32.7
Market storage
Product stored in market for >2 days 25.7 (38.9) ***
Horticultural product most likely to incur loss ***
Tomato 15.1
Taro (multiple types) 8.6
Banana and Plantain 7.2
Watermelon 6.5
Taro leaf 3.4
Product quality (physical) defects attributed to loss
Postharvest rots 92.7
Product over-ripe 78.0
Pest damage 75.6
Bruising or physical damage 75.6
Product size 22.0
External contributors likely to elevate vendor loss
Harvesting after rain 48.3
Trading during summer 44.9
Trading after cyclones or high wind events 4.3
Late season harvesting 1.1
Vendor strategies to reduce product loss
Limited quantity of product sourced from farms to
67.1 (37.0) ***
match consumer demand
Price discounting at the end of the day 47.9 (54.0)
Cover product (if stored over-night) 36.0 (28.0)
Grade product on-farm 35.3 (28.5)
Store product in plastic bag prior to sale 10.6 (11.4)
Sell at a lower price to other vendors 8.6 (5.7)
Spray water on product while being displayed 2.3 (0)
Ensure vendor stall has adequate shade 1.0 (0)
Data presented is based on sampling throughout 2019 to account for possible seasonality effects. * N = 292. ** Crop
type is based on botanical definitions. *** Values in parenthesis represent only vendors incurring postharvest loss.Horticulturae 2020, 6, 61 13 of 17
4. Discussion
Fresh fruits and vegetables in Tongatapu Island were commercially traded through a centrally
located municipal market and a network of road-side vendors. These markets were concentrated
in urban centres that had a large portion of households potentially reliant on commercially sourced
fresh food. On Utu Vava’u Island, commercial trade of fresh fruit and vegetables was more spatially
restricted, with product sourced from the Utukalongalu municipal market supported by a small
network of farms. While this horticultural market and distribution system is consistent with other
small-island developing states across the South Pacific Island, there are some differences. In Fiji,
the horticultural distribution system is dominated by a large network of municipal markets, numerous
road-side cluster markets, and, to a lesser extent, single road-side vendor stalls [16]. The presence of up
to thirteen municipal markets throughout Fiji [19], several in small rural population centres, is in direct
contrast to the single central municipal market on Tongatapu and Utu Vava’u Islands. In the Solomon
Islands, road-side vendors are more likely to be incorporated into relatively large cluster markets
concentrated in peri-urban communities within the greater Honiara district [18,20,21]. In Samoa,
the horticultural market system is in an apparent rapid transition, with the progressive closure of
regional markets and the emergence of numerous supermarkets, road-side cluster markets, and food
and lifestyle night markets [18,22]. Differences in the horticultural market and distribution system
across the region are likely to reflect local socio-economic and population demographics, infrastructure
and transport networks, the spatial distribution of horticultural production, and consumer purchasing
behaviour. However, with few published studies of South Pacific horticultural markets to draw on,
the underlying drivers shaping horticultural markets in the region remains somewhat subjective.
Product supplying the fruit and vegetable markets on Tongatapu and Utu Vava’u Islands was
primarily sourced from close proximity intra-island farms, with few inter-island value chains evident.
Small spatial differences in the distribution of farms supporting the Talamahu or Siamelie market
reflected a variance in the intensity of supply rather than differential source locations. Farms in Lapaha
and Tatakamotonga are more likely to supply the Siamelie road-side cluster market, whereas farms in
Vaini tended to supply the Talamahu municipal market. Although the farm supply network into the
Utukalongalu municipal market on Utu Vava’u Island was similarly spatially diverse, much of the
overall volume of trade was linked to three villages, highlighting a possible underlying food security
vulnerability. It is unclear whether this semi-concentrated market supply simply reflects a distribution
of commercially active farms on Utu Vava’u Island, or vendor demographics and selectively sourcing
from their own farm or farms within their local community.
Road-side vendors on Tongatapu Island were reticent to disclose their farm supply networks.
Ika [8] similarly mentions a lack of information regarding road-side vendor supply. Based on road-side
vendor practice in other Pacific fruit and vegetable markets [18,21,23], a significant portion of road-side
vendor trade in Tonga is likely to be sourced from the municipal market. Hau’ofa [14], in an older
study of Tongan fruit and vegetable markets, indicated that vendors rarely self-identified as middle
men or traders due to perceived lower social status. Georgeou et al. [23] reported a similar situation
amongst road-side vendors in the Solomon Islands, further suggesting that road-side vendors might
misreport their level of sourcing from the municipal market. While socio-cultural resistors may be
shaping road-side vendor behaviour, a possible more contemporary explanation is increased regulation
and enforcement of trading permits of road-side vendors in Tonga.
Farm value chains that sustain South Pacific horticultural food systems are poorly understood.
There is a common assumption that Pacific horticultural market supply is simply a composite of the
spatial distribution of commercially active farms and transient market trading by semi-subsidence
farming households [20,21]. While production-driven supply is an obvious dominant factor,
the potential additional role vendors have in shaping market supply is rarely considered. It is
logical to assume that semi-subsidence and small-scale farm value chains exhibit a high degree
of coordination over market supply, creating an integrated and possibly closed loop chain. More
commercial farm enterprise supply is likely to be far less vertically integrated. In an effort to mitigateHorticulturae 2020, 6, 61 14 of 17
against elevated postharvest loss, most market vendors in Tonga report regulating market supply to
match anticipate daily consumer demand. The implication is that the majority of vendors in Tonga
have a level of control over the volume of product entering the market. What is unclear is whether this
influence further extends to the type of product being sourced and the level of farmer participation
in the market. While complex family and social networks are known to exist within Pacific market
value chains [14,24–27], power structures within Tonga’s horticultural value chains and the underlying
drivers and determinants are not clear and clearly warrant further investigation.
While consumer access to fresh fruit and vegetables was not implicitly assessed in this study,
given a relatively decentralised market system, particularly on Tongatapu Island, high levels of private
vehicle ownership [13], short intra-island transport, and supplement supply through subsistence
farming and communal sharing, it would be reasonable to assume a relatively high level of physical
access. What remains unclear are the potential economic resistors to accessibility, associated with
product pricing, volume and the diversity of crops available. Moreover, is there any spatial or temporal
disparity between urban and rural-based fruit and vegetable vendors in terms of product price, volume
and diversity?
Horticultural postharvest loss in the municipal and road-side market network in Tonga
was very low (1.4% to 5.3%). In other South Pacific municipal and road-side markets, loss is
commonly 10% to 12% [16–18], with much higher levels of postharvest loss regularly reported in
Sub-Saharan African [28,29], the Indian subcontinent [30,31] and southeast Asia [32,33]. With the
postharvest-enabling environment in Tonga encompassing smallholder and semi-subsistence farms,
no cool chain, vendors operating with limited access to postharvest infrastructure, this low level of
postharvest loss would seem to be at odds with the apparent likely risk factors. However, when the
Tonga horticultural food system is considered in light of Tonga’s very short transport distances (often
less than 25 km), limited inter-island trade, comparatively small traded volume (approximately 25%
of produce is transported to market by private car), rapid market throughput (1 to 2 days), and
the dominance of semi-perishable root crops, this apparent disparity is more easily reconciled. It is
important to highlight that the amount of loss reported in this study excludes pre-harvest loss, on-farm
postharvest loss due to sorting and grading, and potential loss at the consumer end of the chain,
such that the whole-of-chain horticultural loss in Tonga is likely to be higher.
While levels of postharvest loss within Tonga’s horticulture market and distribution system were
low, there were sporadic incidences of high loss, with the road-side market vendor network particularly
vulnerable. Individual vendor susceptibility to loss in Tonga is thought to reflect the type of crop being
traded and chain-specific practice. Access to postharvest infrastructure, an obvious point of difference
between municipal and road-side vendors, is not thought to play a major role. Road-side vendors
incurring high levels of loss were often located adjacent to vendors with comparable infrastructure
but little or no loss. There was also little difference in the incidence loss between fruit, vegetable and
root crops value chains. Vendor vulnerability to elevate postharvest loss was more likely to reflect
the type of crop being traded, specifically crops requiring prolonged market storage due to in-market
ripening (i.e., tomato and banana) or possible slow market throughput (i.e., taro and watermelon).
Vendor vulnerability to loss was further influenced by their capacity to regulate their market supply,
and the level of on-farm grading undertaken within the chain.
Counterintuitively, low levels of postharvest loss within Tonga’s horticultural market and
distribution system maybe grounds for concern, especially in the context of the agriculture–nutrition
nexus. Vendor upregulating and restricting market supply, while apparent effective mitigate strategies
against loss, have the potential to impact on the volume of product entering the market. In an
environment where donors are focused on increasing domestic production to improve accessibility
of fresh fruit and vegetables in Tonga in support of pro-health benefits, vendor-regulated market
supply may be an overlooked resistor within the horticulture fresh food systems. The other concern
relates to a possible lack of resilience within the horticultural market system. While short intra-island
transport distances, limited trade of highly-perishable leafy vegetables and fast market throughputHorticulturae 2020, 6, 61 15 of 17
provide a relatively low-risk postharvest environment, this may have also inadvertently created a level
of complacency within the horticultural food system. Evidence of this can be seen in the apparent
prevalence of prolonged on-farm storage, limited packaging, and an over reliance by vendors on supply
regulation and discount-pricing interventions as opposed to more formative postharvest handling
practice. This may, in part, explain why sporadic incidences of postharvest loss in Tonga were often
associated with atypically high levels of loss. Rather than view low levels of postharvest horticultural
loss in Tonga as indicative of value chain efficiency, a possibly more appropriate appraisal is that of a
relatively low-risk postharvest environment. The implication is that if Tonga’s horticultural markets
are placed under stress for any reason, due to restricted supply or consumer access, this may result in
disproportionally high levels of resultant postharvest loss.
5. Conclusions
Tonga has a relatively decentralised horticultural market network due to a network of road-side
vendors, which afford few structural resistors in terms of consumer accessibility to fresh fruits and
vegetables. While Tonga’s horticultural markets experience little postharvest loss, this is thought
to reflect a comparatively low postharvest risk environment, rather than a level of value chain
operational efficiency. Short transport distance, limited horticultural supply, a prevalence of root
crop value chains and corresponding little trade of perishable leafy vegetables, and rapid market
throughput collectively reduce a vendor’s likelihood of incurring loss and possibly compensate for
poor postharvest practice and limited infrastructure. This low postharvest loss-enabling environment
may have wide implications. With the majority of vendors regulating market supply in an attempt to
mitigate against postharvest loss, this could be adversely limiting market supply volumes. If this is
the case, vendor-regulated market supply might be partially undermining wider efforts to improve
consumer access to affordable fresh fruits and vegetables. With few intrinsic postharvest risk factors
within the chain, existing vendor practice and operations may be more vulnerable to external shocks.
Potential changes in the market system in Tonga, necessitating prolonged transport or market storage
(i.e., adverse weather, or increased inter-island trade, or export), the inclusion of more perishable crops
(i.e., increased domestic production or importation of leafy vegetables), or a re-centralisation of the
market structure (i.e., potential closure of road-side markets) may result in disproportionally higher
levels of postharvest loss.
In the context of Tonga’s agriculture–nutrition nexus, road-side market vendors provide an
important contribution in terms of enhanced consumer accessibility to fresh fruits and vegetables.
Strategies to better support road-side vendors, particularly in regards to reducing the risk of sporadic
atypical high loss, warrant further investigation. Counterintuitively, low levels of vendor postharvest
loss in Tonga may actually be of concern, highlighting the need to also understand the enabling
environment and contributory chain practices.
Author Contributions: Conceptualization, S.J.R.U. and S.P.; methodology, S.J.R.U. and S.P.; investigation, S.J.R.U.
and enumerators associated with MORDI; statistical analysis, Y.Z.; writing—original draft preparation, S.J.R.U.,
S.B., Y.Z., and S.P.; writing—review and editing, S.J.R.U., Y.Z., S.P. and S.B. All authors have read and agreed to
the published version of the manuscript.
Funding: This research was funded by the Food and Agriculture Organisation of the United Nations, and
Australian Centre for Pacific Island Studies, University of the Sunshine Coast, Australia.
Acknowledgments: We would like to express our sincere appreciation for the invaluable assistance and support
provided by enumerators from MORDI, Rhiannon Underhill for a preliminary manuscript review, and the
numerous Tongan smallholder farmers and vendors who provided their time and input in support of this study.
Conflicts of Interest: The authors declare no conflict of interest. The funders had no role in the design of the
study; in the collection, analyses, or interpretation of data; in the writing of the manuscript, or in the decision to
publish the results.You can also read