2021 LIMITED LOCAL CAPACITY TECHNICAL STUDY - Special Report for the State Water Resources Control Board to Determine Alamitos OTC Permit ...
←
→
Page content transcription
If your browser does not render page correctly, please read the page content below
July 11, 2019

   2021 LIMITED LOCAL CAPACITY TECHNICAL
                   STUDY
 Special Report for the State Water Resources
Control Board to Determine Alamitos OTC Permit
                   Extension

                      Version 1.1
                      July 11, 2019

California ISO/M&ID
July 11, 2019
Intentionally left blank
California ISO/M&IDJuly 11, 2019
Executive Summary
This report documents the results and recommendations of the 2021 Limited Local Capacity
Study prepared specifically to assess the need for requesting an extension of the Once-Through
Cooling (OTC) compliance date for the Alamitos Generating Station beyond the December 31,
2020 date established by the State Water Resources Control Board in the Policy on the Use of
Coastal and Estuarine Waters for Power Plant Cooling (OTC Policy). This study report follows
the study processes and criteria that were discussed and recommended for the 2020 Local
Capacity Technical Study Criteria, Methodology and Assumptions Stakeholder Meeting held on
October 31, 2018. The study assumptions, processes, and criteria used for the 2021 Limited Local
Capacity Study for the Alamitos OTC generation implementation schedule extension mirror those
used in the 2007-2020 Local Capacity Technical (LCT) Studies, which were previously discussed
and recommended through the LCT Study Advisory Group (“LSAG”)1, an advisory group formed
by the CAISO to assist the CAISO in its preparation for performing prior LCT Studies.
The load forecast used in this study is based on the final adopted California Energy Demand
Updated Forecast, 2018-2030 developed by the CEC; namely the load-serving entity (LSE) and
balancing authority (BA) mid baseline demand with low additional achievable energy efficiency
and photo voltaic (AAEE-AAPV), posted on February 5, 2019:
https://efiling.energy.ca.gov/GetDocument.aspx?tn=226462&DocumentContentId=57239.
The following summary includes major findings related to the need for Alamitos OTC
implementation schedule extension from this 2021 local capacity study:
1. Study results based on the most recent CEC-adopted 2018-2030 California Energy
Demand Update (CEDU) Forecast from the 2018 Integrated Energy Policy Report (IEPR)
process do not trigger the need for Alamitos OTC implementation schedule extension. The
lower demand forecast in the 2018 IEPR compared to the 2017 IEPR, coupled with partial
completion of the Mesa Loop-in Project (i.e., completion of the 230-kV loop-in portion of
the project), as well as completion of the the Lugo-Mohave and Lugo-Eldorado 500 kV line
series capacitor upgrades and returning them to service2 help reduce the local capacity
requirements in the LA Basin from previous study results.
2. The ISO has also conducted a sensitivity study to assess the risk associated with forecast
uncertainty, given that these studies will ultimately be updated with the latest forecast
information in the normal course of the 2021 Local Capacity Technical Study efforts in the
spring of 2020. There were two scenarios evaluated for this sensitivity study:
1
The LSAG consists of a representative cross-section of stakeholders, technically qualified to assess the issues related to the study
assumptions, process and criteria of the existing LCT Study methodology and to recommend changes, where needed.
2
The Lugo-Mohave and Lugo-Eldorado 500 kV line series capacitors are bypassed while they are being upgraded in 2020 timeframe.
1July 11, 2019
a. A scenario based on approximately 800 MW higher load across the SCE service
territory3. This demonstrated a need for Alamitos OTC generation of 476 MW;
b. A second incorporating the higher demand forecast in the first scenario, but
evaluated without the use of 360 MW of potential non-OTC “at-risk-of-retirement”
generation.4 For this scenario, the need for Alamitos OTC generation increased
to 816 MW.
Note that Alamitos Units 1, 2 and 6 are scheduled to be retired by the end of 2019 to allow for
transfer of emission credits to the new repowering 640 MW Alamitos combined cycle generating
facility. This will leave only three remaining OTC units on site: Units 3 (320 MW), 4 (320 MW) and
5 (480 MW) for OTC schedule extension consideration.
The CAISO also notes that in the CPUC Assigned Commissioner and Administrative Law Judge
Ruling of June 20, 2019, in Rulemaking 16-02-007, the option of “Extending deadlines for some
portion of planned OTC retirements until new procurement is authorized or online”5 was proposed
to mitigate against potential system-wide capacity shortages beginning in 2021. Further, the
Ruling suggested “that the appropriate individuals within staff of the Commission begin
discussions through appropriate channels with the Statewide Advisory Committee on Cooling
Water Intake Structures (SACCWIS) to the State Water Resources Control Board (Water Board),
under whose jurisdiction the OTC retirements are set”6, regarding potentially postponing the
retirement of one or more OTC units by a year or two.
In light of the inherent forecast risk and the sensitivity of the local capacity requirement results for
the need for Alamitos to load forecast levels, as well as the potential need for extension of OTC
compliance for system capacity, the CAISO considers it prudent to commence activities seeking
an extension to the OTC compliance date for Alamitos at this time. Actual procurement levels
would depend on the 2021 local capacity technical study requirements developed early in 2020,
or, possibly, by the need for system capacity determined by the CPUC.
3
800 MW represents the approximate difference in load in the SCE service territory between the 2017 IEPR and 2018 IEPR.
4
260 MW of this generation was assumed to be retired as part of the Scoping Ruling from the CPUC Long-Term Procurement Plan
(LTPP) Track 4 Study (Rulemaking 12-03-014) due to age of the generation before its refurbishment; the other 100 MW generation
had mothballed status previously but withdrew its mothball request in Q4 2018 after securing a power contract with SCE.
5
Page 14, CPUC Assigned Commissioner and Administrative Law Judge Ruling of June 20, 2019, in Rulemaking 16-02-007, Order
Instituting Rulemaking to Develop an Electricity Integrated Resource Planning Framework and to Coordinate and Refine Long-Term
Procurement Planning Requirements
6
Page 15, id
2July 11, 2019
Summary of Local Capacity Technical Study Results
The 2020 and 2021 total LCR needs are provided below:
2021 Local Capacity Needs
Capacity
2021 LCR Need 2021 LCR Need
Qualifying Capacity Available Alamitos OTC
Category B Category C
at Peak Capacity Need
Grid- Extension
QF/
Non-Solar connected Total Total Capacity Needed Capacity Needed (MW)
Local Area Name Muni
(MW) Solar (MW) (MW) (MW) (MW)
(MW)
(MW)
Study Results based on 2018 IEPR’s 2018-2030 CEDU Forecast7 (Most Recent Adopted Forecast)
LA Basin 1,344 6,934 17 8,295 8,295 5,946 6,246 None
Western LA Basin Subarea 640 3,738 0 4,378 4,378 N/A 3,965 None
San Diego/ Imperial Valley 4 4,032 523 4,559 4,036 3,944 3,944 N/A
Sensitivity Study Results based on 2017 IEPR’s 2018-2030 CED Forecast (Previously Adopted Forecast)
Scenario 1 Sensitivity Study
LA Basin 1,344 6,934 17 8,295 8,295 N/A 7,102* 476
Western LA Basin Subarea 640 3,738 0 4,378 4,378 N/A 4,800* 476
San Diego/ Imperial Valley 4 4,032 523 4,559 4,036 3,944 3,944 N/A
Scenario 2 Sensitivity Study
LA Basin 1,344 6,574 17 7,935 7,935 N/A 7,082* 816
Western LA Basin Subarea 640 3,378 0 4,018 4,018 N/A 4,780* 816
San Diego/ Imperial Valley 4 4,032 523 4,559 4,036 3,944 3,944 N/A
Notes: * Area or subarea is resource deficient. An overall LCR area can also be resource deficient
if its subarea(s) are resource deficient.
2020 Local Capacity Needs8
7
The 2018 IEPR 2018-2030 CEDU Forecast is the most recent adopted demand forecast that was used for the baseline LCR study.
8
The 2020 LCR study results were based on the 2018 IEPR 2018-2030 CEDU Forecast, which is the same demand forecast that
was used for the 2021 Limited LCR baseline study.
3July 11, 2019
Capacity
2020 LCR Need 2020 LCR Need
Qualifying Capacity Available
Category B Category C
at Peak
QF/
Non-Solar Solar Total Total
Local Area Name Muni Capacity Needed Capacity Needed
(MW) (MW) (MW) (MW)
(MW)
LA Basin 1,344 9,078 17 10,439 10,104 7,364 7,364
Western LA Basin Subarea 639 5,913 0 6,552 4,378 N/A 3,706
San Diego/ Imperial Valley 4 3,891 439 4,334 3,895 3,895 3,895
4July 11, 2019
Intentionally left blank
5July 11, 2019
Table of Contents
Executive Summary .................................................................................................................... 1
1 Overview of the Study: Inputs, Outputs and Options........................................................ 8
1.1 Objectives ...................................................................................................... 8
1.2 Key Study Assumptions ................................................................................. 8
1.2.1 Inputs, Assumptions and Methodology ..................................................... 8
1.3 Grid Reliability .............................................................................................. 10
1.4 Application of N-1, N-1-1, and N-2 Criteria ................................................... 11
1.5 Performance Criteria .................................................................................... 11
1.5.1 Performance Criteria- Category B........................................................... 11
1.5.2 Performance Criteria- Category C .......................................................... 11
1.5.3 CAISO Statutory Obligation Regarding Safe Operation .......................... 12
1.6 The Two Options Presented In This Limited LCT Study Report .................... 16
1.6.1 Option 1 - Meet Performance Criteria Category B .................................. 16
1.6.2 Option 2 - Meet Performance Criteria Category C and Incorporate
Suitable Operational Solutions ............................................................... 16
2 Assumption Details: How the Study was Conducted...................................................... 18
2.1 System Planning Criteria .............................................................................. 18
2.1.1 Power Flow Assessment: ....................................................................... 19
2.1.2 Post Transient Load Flow Assessment: .................................................. 20
2.1.3 Stability Assessment: ............................................................................. 20
2.2 Load Forecast .............................................................................................. 20
2.2.1 System Forecast .................................................................................... 20
2.2.2 Base Case Load Development Method .................................................. 21
2.3 Power Flow Program Used in the LCR analysis ........................................... 22
3 Locational Capacity Requirement Study Results ........................................................... 23
3.1 Summary of Study Results ........................................................................... 23
3.2 Summary of Results by Local Area .............................................................. 25
3.2.1 LA Basin Area ........................................................................................ 25
3.2.2 San Diego-Imperial Valley Area .............................................................. 38
3.3 Results and Recommendations.................................................................... 44
Attachment A – List of physical resources by PTO, local area and market ID ........................... 47
Attachment B – Effectiveness factors ........................................................................................ 64
6July 11, 2019
Intentionally left blank
7July 11, 2019
1 Overview of the Study: Inputs, Outputs and Options
1.1 Objectives
The CAISO undertook a separate and special 2021 Limited Local Capacity Study to preliminarily
assess the local capacity requirements for the LA Basin and San Diego/Imperial Valley local
capacity areas, and to consider the need for requesting an extension of the Once-Through
Cooling (OTC) compliance date for the Alamitos Generating Station beyond the December 31,
2020 date established by the State Water Resources Control Board in the Policy on the Use of
Coastal and Estuarine Waters for Power Plant Cooling (OTC Policy). This study followed the
study processes and criteria that were discussed and recommended for the 2020 Local Capacity
Technical Study Criteria, Methodology and Assumptions Stakeholder Meeting held on October
31, 2018.
The study assumptions, processes, and criteria used for the 2021 Local Capacity Study for the
Alamitos OTC generation implementation schedule extension mirror those used in the 2007-2020
Local Capacity Technical (LCT) Studies, which were previously discussed and recommended
through the LCT Study Advisory Group (“LSAG”)9, an advisory group formed by the CAISO to
assist the CAISO in its preparation for performing prior LCT Studies.
1.2 Key Study Assumptions
1.2.1 Inputs, Assumptions and Methodology
The inputs, assumptions and methodology were discussed and agreed to by stakeholders at the
2020 LCT Study Criteria, Methodology and Assumptions Stakeholder Meeting held on October
31, 2018. They are similar to those used and incorporated in previous LCT studies. The
following table sets out a summary of the approved inputs and methodology that have been used
in this 2021 Limited LCT Study, which were based largely on those used in the 2024 Long-Term
LCT Study prepared by the CAISO earlier in 2019:
Table 1.2-1 Summary Table of Inputs and Methodology Used in this LCT Study:
Issue How Incorporated into this LCT Study:
Input Assumptions:
9
The LSAG consists of a representative cross-section of stakeholders, technically qualified to assess the issues related to the study
assumptions, process and criteria of the existing LCT Study methodology and to recommend changes, where needed.
8July 11, 2019
Transmission System Configuration The existing transmission system has been modeled,
including all projects operational on or before June 1,
of the study year and all other feasible operational
solutions brought forth by the PTOs and as agreed to
by the CAISO.
Generation Modeled The existing generation resources has been modeled
and also includes all projects that will be on-line and
commercial on or before June 1, of the study year
Load Forecast Uses a 1-in-10 year summer peak load forecast
Methodology:
Maximize Import Capability Import capability into the load pocket has been
maximized, thus minimizing the generation required in
the load pocket to meet applicable reliability
requirements.
QF/Nuclear/State/Federal Units Regulatory Must-take and similarly situated units like
QF/Nuclear/State/Federal resources have been
modeled on-line at qualifying capacity output values
for purposes of this LCT Study.
Maintaining Path Flows Path flows have been maintained below all
established path ratings into the load pockets,
including the 500 kV. For clarification, given the
existing transmission system configuration, the only
500 kV path that flows directly into a load pocket and
will, therefore, be considered in this LCT Study is the
South of Lugo transfer path flowing into the LA Basin.
Performance Criteria:
Performance Level B & C, including This LCT Study is being published based on
incorporation of PTO operational Performance Level B and Performance Level C
solutions criterion, yielding the low and high range LCR
scenarios. In addition, the CAISO will incorporate all
new projects and other feasible and CAISO-approved
operational solutions brought forth by the PTOs that
can be operational on or before June 1, of the study
year. Any such solutions that can reduce the need for
procurement to meet the Performance Level C criteria
will be incorporated into the LCT Study.
9July 11, 2019
Load Pocket:
Fixed Boundary, including limited This LCT Study has been produced based on load
reference to published effectiveness pockets defined by a fixed boundary. The CAISO
factors only publishes effectiveness factors where they are
useful in facilitating procurement where excess
capacity exists within a load pocket.
Further details regarding the 2024 Long-Term LCT Study methodology and assumptions, also
employed in this 2021 Limited LCT Study, are provided in Section III, below.
1.3 Grid Reliability
Service reliability builds from grid reliability because grid reliability is reflected in the Reliability
Standards of the North American Electric Reliability Council (NERC) and the Western Electricity
Coordinating Council (“WECC”) Regional Criteria (collectively “Reliability Standards”). The
Reliability Standards apply to the interconnected electric system in the United States and are
intended to address the reality that within an integrated network, whatever one Balancing
Authority Area does can affect the reliability of other Balancing Authority Areas. Consistent with
the mandatory nature of the Reliability Standards, the CAISO is under a statutory obligation to
ensure efficient use and reliable operation of the transmission grid consistent with achievement
of the Reliability Standards.10 The CAISO is further under an obligation, pursuant to its FERC-
approved Transmission Control Agreement, to secure compliance with all “Applicable Reliability
Criteria.” Applicable Reliability Criteria consists of the Reliability Standards as well as reliability
criteria adopted by the CAISO (Grid Planning Standards).
The Local Capacity Technical Study will determine the minimum amount of Local Capacity Area
Resources needed to address the Contingencies identified in the CAISO Tariff Section 40.3.1.2.
In performing the Local Capacity Technical Study, the CAISO will apply those methods for
resolving Contingencies considered appropriate for the performance level that corresponds to a
particular studied Contingency, as provided in NERC Reliability Standards TPL-001-4, as
augmented by CAISO Reliability Criteria in accordance with the Transmission Control Agreement
and Section 24.2.1. It is noted that the CAISO is currently undergoing a stakeholder process11 to
review and update the Local Capacity Technical (LCT) Study criteria, pursuant to the ISO Tariff
section 40.3.1.1 and contingencies identified in section 40.3.1.2. The ISO will update the criteria
and contingencies to align them in form and substance with current national (i.e., NERC) and
regional (i.e., WECC) mandatory standards.
10
Pub. Utilities Code § 345
11
http://www.caiso.com/informed/Pages/StakeholderProcesses/LocalCapacityTechnicalStudyCriteriaUpdate.aspx
10July 11, 2019
1.4 Application of N-1, N-1-1, and N-2 Criteria
The CAISO will maintain the system in a safe operating mode at all times. This obligation
translates into respecting the Reliability Criteria at all times, for example during normal operating
conditions (N-0) the CAISO must protect for all single contingencies (N-1) and common mode (N-
2) double line outages. Also, after a single contingency, the CAISO must re-adjust the system to
support the loss of the next most stringent contingency. This is referred to as the N-1-1 condition.
The N-1-1 vs N-2 terminology was introduced only as a temporal differentiation between two
existing12 NERC Category C events. N-1-1 represents NERC Category C3 (“category B
contingency, manual system adjustment, followed by another category B contingency”). The N-2
represents NERC Category C5 (“any two circuits of a multiple circuit tower line”) as well as WECC-
S2 (for 500 kV only) (“any two circuits in the same right-of-way”) with no manual system
adjustment between the two contingencies.
1.5 Performance Criteria
As set forth on the Summary Table of Inputs and Methodology, this LCR Report is based on
NERC Performance Level B and Performance Level C criterion. The NERC Standards refer
mainly to thermal overloads. However, the CAISO also tests the electric system in regards to the
dynamic and reactive margin compliance with the existing WECC standards for the same NERC
performance levels. These Performance Levels can be described as follows:
1.5.1 Performance Criteria- Category B
Category B describes the system performance that is expected immediately following the loss of
a single transmission element, such as a transmission circuit, a generator, or a transformer.
Category B system performance requires that all thermal and voltage limits must be within their
“Applicable Rating,” which, in this case, are the emergency ratings as generally determined by
the PTO or facility owner. Applicable Rating includes a temporal element such that emergency
ratings can only be maintained for certain duration. Under this category, load cannot be shed in
order to assure the Applicable Ratings are met however there is no guarantee that facilities are
returned to within normal ratings or to a state where it is safe to continue to operate the system
in a reliable manner such that the next element out will not cause a violation of the Applicable
Ratings.
1.5.2 Performance Criteria- Category C
The NERC Planning Standards require system operators to “look forward” to make sure they
safely prepare for the “next” N-1 following the loss of the “first” N-1 (stay within Applicable Ratings
after the “next” N-1). This is commonly referred to as N-1-1. Because it is assumed that some
time exists between the “first” and “next” element losses, operating personnel may make any
12
NERC Category B and C terminology no longer aligns with the current NERC standards. It is used in this report since the ISO Tariff
still uses this terminology that was in effect at the time when the ISO Tariff section was written.
11July 11, 2019
reasonable and feasible adjustments to the system to prepare for the loss of the second element,
including, operating procedures, dispatching generation, moving load from one substation to
another to reduce equipment loading, dispatching operating personnel to specific station locations
to manually adjust load from the substation site, or installing a “Special Protection Scheme” that
would remove pre-identified load from service upon the loss of the “next “ element.13 All Category
C requirements in this report refer to situations when in real time (N-0) or after the first contingency
(N-1) the system requires additional readjustment in order to prepare for the next worst
contingency. In this time frame, load drop is not allowed per existing planning criteria.
Generally, Category C describes system performance that is expected following the loss of two
or more system elements. This loss of two elements is generally expected to happen
simultaneously, referred to as N-2. It should be noted that once the “next” element is lost after
the first contingency, as discussed above under the Performance Criteria B, N-1-1 scenario, the
event is effectively a Category C. As noted above, depending on system design and expected
system impacts, the planned and controlled interruption of supply to customers (load shedding),
the removal from service of certain generators and curtailment of exports may be utilized to
maintain grid “security.”
1.5.3 CAISO Statutory Obligation Regarding Safe Operation
The CAISO will maintain the system in a safe operating mode at all times. This obligation
translates into respecting the Reliability Criteria at all times, for example during normal operating
conditions A (N-0) the CAISO must protect for all single contingencies B (N-1) and common mode
C5 (N-2) double line outages. As a further example, after a single contingency the CAISO must
readjust the system in order to be able to support the loss of the next most stringent contingency
C3 (N-1-1).
Figure 1.5-1 Temporal graph of LCR Category B vs. LCR Category C
13
A Special Protection Scheme is typically proposed as an operational solution that does not require additional generation and permits
operators to effectively prepare for the next event as well as ensure security should the next event occur. However, these systems
have their own risks, which limit the extent to which they could be deployed as a solution for grid reliability augmentation. While they
provide the value of protecting against the next event without the need for pre-contingency load shedding, they add points of potential
failure to the transmission network. This increases the potential for load interruptions because sometimes these systems will operate
when not required and other times they will not operate when needed.
12July 11, 2019
A (N-0) C5 (N-2)
Loading within A/R (normal) as well as making sure the system can Loading
support the loss of the most stringent next single element or credible Within A/R
double and be within post-contingency A/R (emergency). (emergency)
Planned and
Load Shedding Not Allowed Controlled
Load Shedding
---------------------Example (30 min)-------------- Allowed
A (N-0) B (N-1) C3 (N-1-1)
Loading Loading Manual adjust per NERC Loading
Within A/R Within A/R C3 in order to support the Within A/R
(normal) (emergency) Loss of the next element. (emergency)
First N-1 Second
occurs trip
occurs
“LCR Category B”
“LCR Category C”
The following definitions guide the CAISO’s interpretation of the Reliability Criteria governing safe
mode operation and are used in this LCT Study:
Applicable Rating:
This represents the equipment rating that will be used under certain contingency conditions.
Normal rating is to be used under normal conditions.
Long-term emergency ratings, if available, will be used in all emergency conditions as long as
“system readjustment” is provided in the amount of time given (specific to each element) to
reduce the flow to within the normal ratings. If not available, the normal rating is to be used.
Short-term emergency ratings, if available, can be used as long as “system readjustment” is
provided in the “short-time” available in order to reduce the flow to within the long-term
emergency ratings where the element can be kept for another length of time (specific to each
element) before the flow needs to be reduced the below the normal ratings. If not available
long-term emergency rating should be used.
Temperature-adjusted ratings shall not be used because this is a year-ahead study, not a
real-time tool, and as such the worst-case scenario must be covered. In case temperature-
adjusted ratings are the only ratings available then the minimum rating (highest temperature)
given the study conditions shall be used.
13July 11, 2019
CAISO Transmission Register is the only official keeper of all existing ratings mentioned
above.
Ratings for future projects provided by PTO and agreed upon by the CAISO shall be used.
Other short-term ratings not included in the CAISO Transmission Register may be used as
long as they are engineered, studied and enforced through clear operating procedures that
can be followed by real-time operators.
Path Ratings need to be maintained within their limits in order to assure that proper capacity
is available in order to operate the system in real-time in a safe operating zone.
Controlled load drop:
This is achieved with the use of a Special Protection Scheme.
Planned load drop:
This is achieved when the most limiting equipment has short-term emergency ratings AND the
operators have an operating procedure that clearly describes the actions that need to be taken in
order to shed load.
Special Protection Scheme:
All known SPS shall be assumed. New SPS must be verified and approved by the CAISO and
must comply with the new SPS guideline described in the CAISO Planning Standards.
System Readjustment:
This represents the actions taken by operators in order to bring the system within a safe operating
zone after any given contingency in the system.
Actions that can be taken as system readjustment after a single contingency (Category B):
1. System configuration change – based on validated and approved operating procedures
2. Generation re-dispatch
a. Decrease generation (up to 1150 MW) – limit given by single contingency SPS as
part of the CAISO Grid Planning standards (ISO G4)
b. Increase generation – this generation will become part of the LCR need
Actions, which shall not be taken as system readjustment after a single contingency (Category
B):
1. Load drop – based on the intent of the CAISO/WECC and NERC criteria for category B
contingencies.
14July 11, 2019
The NERC Transmission Planning Standards footnote mentions that load shedding can be done
after a category B event in certain local areas in order to maintain compliance with performance
criteria. However, the main body of the criteria spells out that no dropping of load should be done
following a single contingency. All stakeholders and the CAISO agree that no involuntary
interruption of load should be done immediately after a single contingency. Further, the CAISO
and stakeholders now agree on the viability of dropping load as part of the system readjustment
period – in order to protect for the next most limiting contingency. After a single contingency, it is
understood that the system is in a Category B condition and the system should be planned based
on the body of the criteria with no shedding of load regardless of whether it is done immediately
or in 15-30 minute after the original contingency. Category C conditions only arrive after the
second contingency has happened; at that point in time, shedding load is allowed in a planned
and controlled manner.
A robust California transmission system should be, and under the LCT Study is being, planned
based on the main body of the criteria, not the footnote regarding Category B contingencies.
Therefore, if there are available resources in the area, they are looked to meet reliability needs
(and included in the LCR requirement) before resorting to involuntary load curtailment. The
footnote may be applied for criteria compliance issues only where there are no resources
available in the area.
Time allowed for manual readjustment:
Tariff Section 40.3.1.1, requires the CAISO, in performing the Local Capacity Technical Study, to
apply the following reliability criterion:
Time Allowed for Manual Adjustment: This is the amount of time required for the Operator to take
all actions necessary to prepare the system for the next Contingency. The time should not be
more than thirty (30) minutes.
The CAISO Planning Standards also impose this manual readjustment requirement. As a
parameter of the Local Capacity Technical Study, the CAISO must assume that as the system
operator the CAISO will have sufficient time to:
(1) make an informed assessment of system conditions after a contingency has
occurred;
(2) identify available resources and make prudent decisions about the most effective
system redispatch;
(3) manually readjust the system within safe operating limits after a first contingency
to be prepared for the next contingency; and
(4) allow sufficient time for resources to ramp and respond according to the operator’s
redispatch instructions. This all must be accomplished within 30 minutes.
Local capacity resources can meet this requirement by either (1) responding with sufficient speed,
allowing the operator the necessary time to assess and redispatch resources to effectively
15July 11, 2019
reposition the system within 30 minutes after the first contingency, or (2) have sufficient energy
available for frequent dispatch on a pre-contingency basis to ensure the operator can meet
minimum online commitment constraints or reposition the system within 30 minutes after the first
contingency occurs. Accordingly, when evaluating resources that satisfy the requirements of the
CAISO Local Capacity Technical Study, the CAISO assumes that local capacity resources need
to be available in no longer than 20 minutes so the CAISO and demand response providers have
a reasonable opportunity to perform their respective and necessary tasks and enable the CAISO
to reposition the system within the 30 minutes in accordance with applicable reliability criteria.
1.6 The Two Options Presented In This Limited LCT Study Report
This Limited LCT Study sets forth different solution “options” with varying ranges of potential
service reliability consistent with CAISO’s Reliability Criteria. The CAISO applies Option 2 for its
purposes of identifying necessary local capacity needs and the corresponding potential scope of
its backstop authority. Nevertheless, the CAISO continues to provide Option 1 as a point of
reference for the CPUC and Local Regulatory Authorities in considering procurement targets for
their jurisdictional LSEs.
1.6.1 Option 1 - Meet Performance Criteria Category B
Option 1 is a service reliability level that reflects generation capacity that must be available to
comply with reliability standards immediately after a NERC Category B given that load cannot be
removed to meet this performance standard under Reliability Criteria. However, this capacity
amount implicitly relies on load interruption as the only means of meeting any Reliability Criteria
that is beyond the loss of a single transmission element (N-1). These situations will likely require
substantial load interruptions in order to maintain system continuity and alleviate equipment
overloads prior to the actual occurrence of the second contingency.14
1.6.2 Option 2 - Meet Performance Criteria Category C and Incorporate Suitable
Operational Solutions
Option 2 is a service reliability level that reflects generation capacity that is needed to readjust
the system to prepare for the loss of a second transmission element (N-1-1) using generation
capacity after considering all reasonable and feasible operating solutions (including those
involving customer load interruption) developed and approved by the CAISO, in consultation with
the PTOs. Under this option, there is no expected load interruption to end-use customers under
normal or single contingency conditions as the CAISO operators prepare for the second
contingency. However, the customer load may be interrupted in the event the second contingency
occurs in non-high density load areas.
14
This potential for pre-contingency load shedding also occurs because real time operators must prepare for the loss of a common
mode N-2 at all times.
16July 11, 2019
As noted, Option 2 is the local capacity level that the CAISO requires to reliably operate the grid
per NERC, WECC and CAISO standards. As such, the CAISO recommends continuing the
adoption of this Option to guide resource adequacy procurement.
17July 11, 2019
2 Assumption Details: How the Study was Conducted
2.1 System Planning Criteria
The following table provides a comparison of system planning criteria, based on the NERC
performance standards, used in the study:
Table 2.1-1: Criteria Comparison
Contingency Component(s) ISO Grid Old RMR Local Capacity
Planning Criteria Criteria Criteria
A – No Contingencies X X X
B – Loss of a single element
1. Generator (G-1) X X1 X1
2. Transmission Circuit (L-1) X X X1
3. Transformer (T-1) X X2 X1,2
4. Single Pole (dc) Line X X X1
5. G-1 system readjusted L-1 X X X
C – Loss of two or more elements
1. Bus Section X
2. Breaker (failure or internal fault) X
3. L-1 system readjusted G-1 X X
3. G-1 system readjusted T-1 or T-1 system readjusted G-1 X X
3. L-1 system readjusted T-1 or T-1 system readjusted L-1 X X
3. G-1 system readjusted G-1 X X
3. L-1 system readjusted L-1 X X
3. T-1 system readjusted T-1 X
4. Bipolar (dc) Line X X
5. Two circuits (Common Mode) L-2 X X
6. SLG fault (stuck breaker or protection failure) for G-1 X
7. SLG fault (stuck breaker or protection failure) for L-1 X
8. SLG fault (stuck breaker or protection failure) for T-1 X
9. SLG fault (stuck breaker or protection failure) for Bus section X
WECC-S3. Two generators (Common Mode) G-2 X3 X
D – Extreme event – loss of two or more elements
Any B1-4 system readjusted (Common Mode) L-2 X4 X3
All other extreme combinations D1-14. X4
1 System must be able to readjust to a safe operating zone in order to be able to support the loss of the next contingency.
2
A thermal or voltage criterion violation resulting from a transformer outage may not be cause for a local area reliability
requirement if the violation is considered marginal (e.g. acceptable loss of facility life or low voltage), otherwise, such a
violation will necessitate creation of a requirement.
3
Evaluate for risks and consequence, per NERC standards. No voltage collapse or dynamic instability allowed.
4
Evaluate for risks and consequence, per NERC standards.
18July 11, 2019
A significant number of simulations were run to determine the most critical contingencies within
each Local Capacity Area. Using power flow, post-transient load flow, and stability assessment
tools, the system performance results of all the contingencies that were studied were measured
against the system performance requirements defined by the criteria shown below. Where the
specific system performance requirements were not met, generation was adjusted such that the
minimum amount of generation required to meet the criteria was determined in the Local Capacity
Area. The following describes how the criteria were tested for the specific type of analysis
performed.
2.1.1 Power Flow Assessment:
Table 2.1-2 Power flow criteria
Contingencies Thermal Criteria3 Voltage Criteria4
Generating unit 1, 6 Applicable Rating Applicable Rating
Transmission line 1, 6 Applicable Rating Applicable Rating
Transformer 1, 6 Applicable Rating5 Applicable Rating5
(G-1)(L-1) 2, 6 Applicable Rating Applicable Rating
Overlapping 6, 7 Applicable Rating Applicable Rating
1
All single contingency outages (i.e. generating unit, transmission line or transformer) will
be simulated on Participating Transmission Owners’ local area systems.
2
Key generating unit out, system readjusted, followed by a line outage. This over-lapping
outage is considered a single contingency within the ISO Grid Planning Criteria.
Therefore, load dropping for an overlapping G-1, L-1 scenario is not permitted.
3
Applicable Rating – Based on CAISO Transmission Register or facility upgrade plans
including established Path ratings.
4
Applicable Rating – CAISO Grid Planning Criteria or facility owner criteria as appropriate
including established Path ratings.
5
A thermal or voltage criterion violation resulting from a transformer outage may not be
cause for a local area reliability requirement if the violation is considered marginal (e.g.
acceptable loss of facility life or low voltage), otherwise, such a violation will necessitate
creation of a requirement.
6
Following the first contingency (N-1), the generation must be sufficient to allow the
operators to bring the system back to within acceptable (normal) operating range (voltage
and loading) and/or appropriate OTC following the studied outage conditions.
7
During normal operation or following the first contingency (N-1), the generation must be
sufficient to allow the operators to prepare for the next worst N-1 or common mode N-2
19July 11, 2019
without pre-contingency interruptible or firm load shedding. SPS/RAS/Safety Nets may be
utilized to satisfy the criteria after the second N-1 or common mode N-2 except if the
problem is of a thermal nature such that short-term ratings could be utilized to provide the
operators time to shed either interruptible or firm load. T-2s (two transformer bank
outages) would be excluded from the criteria.
2.1.2 Post Transient Load Flow Assessment:
Table 2.1-3 Post transient load flow criteria
Contingencies Reactive Margin Criteria 2
Selected 1 Applicable Rating
1
If power flow results indicate significant low voltages for a given power flow contingency,
simulate that outage using the post transient load flow program. The post-transient
assessment will develop appropriate Q/V and/or P/V curves.
2
Applicable Rating – positive margin based on the higher of imports or load increase by 5%
for N-1 contingencies, and 2.5% for N-2 contingencies.
2.1.3 Stability Assessment:
Table 2.1-4 Stability criteria
Contingencies Stability Criteria 2
Selected1 Applicable Rating
1
Base on historical information, engineering judgment and/or if power flow or post transient
study results indicate significant low voltages or marginal reactive margin for a given
contingency.
2
Applicable Rating – CAISO Grid Planning Criteria or facility owner criteria as appropriate.
2.2 Load Forecast
2.2.1 System Forecast
The California Energy Commission (CEC) derives the load forecast at the system and
Participating Transmission Owner (PTO) levels. This relevant CEC forecast is then distributed
across the entire system, down to the local area, division and substation level. The PTOs use an
econometric equation to forecast the system load. The predominant parameters affecting the
system load are (1) number of households, (2) economic activity (gross metropolitan products,
GMP), (3) temperature and (4) increased energy efficiency and distributed generation programs.
20July 11, 2019
2.2.2 Base Case Load Development Method
The method used to develop the load in the base case is a melding process that extracts, adjusts
and modifies the information from the system, distribution and municipal utility forecasts. The
melding process consists of two parts: Part 1 deals with the PTO load and Part 2 deals with the
municipal utility load. There may be small differences between the methodologies used by each
PTO to disaggregate the CEC load forecast to their level of local area as well as bar-bus model.
PTO Loads in Base Case
The methods used to determine the PTO loads are, for the most part, similar. One part of the
method deals with the determination of the division15 loads that would meet the requirements of
1-in-5 or 1-in-10 system or area base cases and the other part deals with the allocation of the
division load to the transmission buses.
a. Determination of division loads
The annual division load is determined by summing the previous year division load and the current
division load growth. Thus, the key steps are the determination of the initial year division load and
the annual load growth. The initial year for the base case development method is based heavily
on recorded data. The division load growth in the system base case is determined in two steps.
First, the total PTO load growth for the year is determined, as the product of the PTO load and
the load growth rate from the system load forecast. Then this total PTO load growth is allocated
to the division, based on the relative magnitude of the load growth projected for the divisions by
the distribution planners. For example, for the 1-in-10 area base case, the division load growth
determined for the system base case is adjusted to the 1-in-10 temperature using the load
temperature relation determined from the latest peak load and temperature data of the division.
b. Allocation of division load to transmission bus level
Since the loads in the base case are modeled at the various transmission buses, the division
loads developed must be allocated to those buses. The allocation process is different depending
on the load types. For the most part, each PTO classifies its loads into four types: conforming,
non-conforming, self-generation and generation-plant loads. Since the non-conforming and self-
generation loads are assumed to not vary with temperature, their magnitude would be the same
in the system or area base cases of the same year. The remaining load (the total division load
developed above, less the quantity of non-conforming and self-generation load) is the conforming
load. The remaining load is allocated to the transmission buses based on the relative magnitude
of the distribution forecast. The summation of all base case loads is generally higher than the load
forecast because some load, i.e., self-generation and generation-plant, are behind the meter and
must be modeled in the base cases. However, for the most part, metered or aggregated data with
telemetry is used to come up with the load forecast.
15
Each PTO divides its territory in a number of smaller area named divisions. These are usually smaller and compact areas that have
the same temperature profile.
21July 11, 2019
Municipal Loads in Base Case
The municipal utility forecasts that have been provided to the CEC and PTOs for the purposes of
their base cases were also used for this study.
2.3 Power Flow Program Used in the LCR analysis
The technical studies were conducted using General Electric’s Power System Load Flow (GE
PSLF) program version 21.0_05 and PowerGem’s Transmission Adequacy and Reliability
Assessment (TARA) program version 1702. This GE PSLF program is available directly from GE
or through the Western System Electricity Council (WECC) to any member and TARA program is
commercially available.
To evaluate Local Capacity Areas, the starting base case was adjusted to reflect the latest
generation and transmission projects as well as the one-in-ten-year peak load forecast for each
Local Capacity Area as provided to the CAISO by the PTOs.
Electronic contingency files provided by the PTOs were utilized to perform the numerous
contingencies required to identify the LCR. These contingency files include remedial action and
special protection schemes that are expected to be in operation during the year of study. A CAISO
created EPCL (a GE programming language contained within the GE PSLF package) routine
and/or TARA software were used to run the combination of contingencies; however, other routines
are available from WECC with the GE PSFL package or can be developed by third parties to
identify the most limiting combination of contingencies requiring the highest amount of generation
within the local area to maintain power flows within applicable ratings.
22July 11, 2019
3 Locational Capacity Requirement Study Results
3.1 Summary of Study Results
LCR is defined as the amount of resource capacity that is needed within a Local Capacity Area
to reliably serve the load located within this area. The results of the CAISO’s analysis are
summarized in the Executive Summary Tables.
Table 3.1-1 2021 Local Capacity Needs vs. Peak Load and Local Area Resources
Total NQC Local Area
Peak Load 2021 LCR as
2021 Total Resources (MW) / 2021 LCR as % of
(1 in10) % of Peak
LCR (MW) Available Resources Total NQC
(MW) Load
at Peak Load (MW)
LA Basin 6,246 19,330 32% 8,295 75%**
San Diego/Imperial Valley 3,944 4,635 85% 4,559 / 4,036 87% / 98%
Total 10,190 23,965* 43% 12,854 / 12,331 79% / 83%
* Value shown only illustrative, since each local area peaks at a different time.
** Resource deficient LCA (or with sub-area that are deficient) – deficiency included in LCR. Resource deficient area implies that
in order to comply with the criteria, at summer peak, load must be shed immediately after the first contingency.
Table 3.1-1 shows how much of the Local Capacity Area load is dependent on local resources
and how many local resources must be available in order to serve the load in those Local Capacity
Areas in a manner consistent with the Reliability Criteria. These tables also indicate where new
transmission projects, new resource additions or demand side management programs would be
most useful in order to reduce the dependency on existing, generally older and less efficient local
area resources.
The term “Qualifying Capacity” used in this report is the “Net Qualifying Capacity” (“NQC”) posted
on the CAISO web site at:
http://www.caiso.com/planning/Pages/ReliabilityRequirements/Default.aspx
The NQC list includes the area (if applicable) where each resource is located for units already
operational. The NQC list in Attachment A does not include Demand Side Management programs
and their related NQC. However, the amount of demand response used in each study area is
included in the study results for each area. Resources scheduled to become operational before
June 1 of 2021 have been included in this 2021 Local Capacity Study Report (for evaluation of
Alamitos local capacity need). Those resources capacity values are added to the total NQC values
for those respective areas (see detail write-up for each area in Section 3).
Regarding the main tables up front (page 2), the first column, “Qualifying Capacity,” reflects two
sets of resources. The first set is comprised of resources that would normally be expected to be
on-line such as Municipal and Regulatory Must-take resources (state, federal, QFs, wind and
nuclear units). The second set is “market” resources. The second column, “YEAR LCR
Requirement Based on Category B” identifies the local capacity requirements, and deficiencies
23July 11, 2019
that must be addressed, in order to achieve a service reliability level based on Performance
Criteria- Category B. The third column, “YEAR LCR Requirement Based on Category C with
Operating Procedure”, sets forth the local capacity requirements, and deficiencies that must be
addressed, necessary to attain a service reliability level based on Performance Criteria-Category
C with operational solutions.
24July 11, 2019
3.2 Summary of Results by Local Area
Each local capacity area’s overall requirement is determined by achieving each sub-area
requirement as well as the overall local capacity area’s requirement. Because these sub-areas
are a part of the interconnected electric system, the total for each local capacity area is not simply
a summation of the sub-area needs. This is because some sub-areas may overlap and therefore
the same generating units may count for meeting the needs in those sub-areas. When
aggregating for the overall local capacity area requirement, those generating units are accounted
once for the overall local capacity need.
3.2.1 LA Basin Area
Area Definition:
The transmission tie lines into the LA Basin Area are:
San Onofre - San Luis Rey #1, #2, and #3 230 kV Lines
San Onofre - Talega #1 & #2 230 kV Lines
Lugo - Mira Loma #2 & #3 500 kV Lines
Lugo - Rancho Vista #1 500 kV Line
Vincent – Mesa 500 kV Line
Sylmar - Eagle Rock 230 kV Line
Sylmar - Gould 230 kV Line
Vincent - Mesa #1 & #2 230 kV Lines
Vincent - Rio Hondo #1 & #2 230 kV Lines
Devers - Red Bluff 500 kV #1 and #2 Lines
Mirage – Coachella Valley # 1 230 kV Line
Mirage - Ramon # 1 230 kV Line
Mirage - Julian Hinds 230 kV Line
The substations that delineate the LA Basin Area are:
San Onofre is in San Luis Rey is out
San Onofre is in Talega is out
San Onofre is in Capistrano is out
Mira Loma is in Lugo is out
Rancho Vista is in Lugo is out
Eagle Rock is in Sylmar is out
25July 11, 2019
Gould is in Sylmar is out
Mira Loma is in Vincent is out
Mesa is in Vincent is out
Rio Hondo is in Vincent is out
Devers is in Red Bluff is out
Mirage is in Coachella Valley is out
Mirage is in Ramon is out
Mirage is in Julian Hinds is out
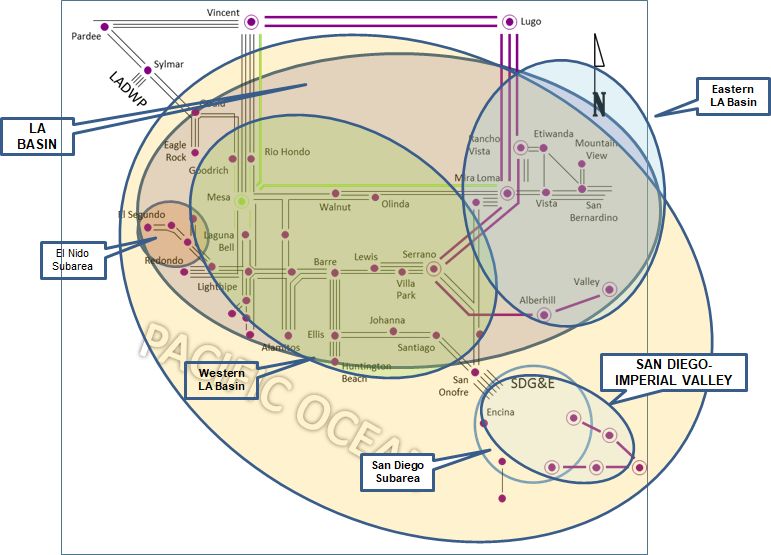
3.2.1.1.1 LA Basin LCR Area Diagram
Figure 3.2-1 LA Basin LCR Area
3.2.1.1.2 LA Basin LCR Area Load and Resources
Table 3.2-1 provides the forecast load and resources in the LA Basin LCR Area in 2021. The list
of generators within the LCR area are provided in Attachment A and does not include new LTPP
26July 11, 2019
Preferred resources as well as the existing 20-minute demand response. These resources are
included in the Table 3.2-1.
In the year 2021, the estimated time of local area peak demand occurs at 5:00 p.m. PDT on
September 7th.
At the local area peak time the estimated, behind the meter, solar output is 26%.
At the local area peak time the estimated, ISO metered, solar output is 33.4%.
If required, all non-solar technology type resources are dispatched at NQC.
Table 3.2-1 LA Basin LCR Area 2021 Forecast Load and Resources
Load (MW) Generation (MW) NQC At Peak
Gross Load 21,078 Market, Net Seller, Battery, Wind, Solar 5,975 5,975
AAEE -364 MUNI 1,110 1,110
Behind the meter DG -1,689 QF 234 234
Net Load 19,025 LTPP Preferred Resources 374 374
Transmission Losses 285 Existing 20-minute Demand Response 267 267
Pumps 20 Mothballed 335 335
Load + Losses + Pumps 19,330 Total 8,295 8,295
The total load plus losses and pump loads above is for the LA Basin geographic area (same area
from the CEC’s demand forecast for the LA Basin in the LSE/BA Table). However, the electrically
defined LA Basin LCR area does not include Saugus substation load, which is 736 MW. When
Saugus load is subtracted from the geographically defined LA Basin load and losses (19,330
MW), the total load plus losses for the electrically defined LA Basin area is estimated to be 18,594
MW.
3.2.1.1.3 Approved transmission and resource projects modeled:
Mesa Loop-In Project (230 kV portion only)16 and Laguna Bell Corridor 230 kV line
upgrades
Interim operating procedure that includes closing Mesa 230 kV sectionalizing circuit
breaker to connect Mesa North and South 230 kV buses. Utilizing this interim operating
procedure will help provide interim mitigation to SCE-owned 230 kV transmission line’s
loading concern under overlapping contingency condition for the 2021 timeframe. The
Mesa North and South 230 kV buses will need to be electrically separated due to high
16
The Mesa 500 kV loop-in portion is delayed until March 2022.
27July 11, 2019
short circuit duty concern when the Vincent-Mira Loma 500 kV line is looped into the Mesa
Substation by March 2022. Looping the 500 kV line into the Mesa Substation provides
another power source in the western LA Basin, as well mitigation to previously identified
230 kV transmission line loading constraint (i.e., Serrano corridor).
Hassayampa – North Gila #2 500 kV Line (APS)
Deployment of CPUC-approved preferred resources from the long-term procurement plan
(R.12-03-014) for local capacity need in the western LA Basin sub-area (320 MW)
Utilization of 460 MW of 20-minute demand response within SCE service area
Retirement of 1,356 MW of the existing Redondo Beach OTC generation
Alamitos repowering (640 MW)
Retirement of 2,010 MW of the existing Alamitos OTC generation
Huntington Beach repowering (644 MW)
Retirement of 452 MW of the existing Huntington Beach OTC generation
Completion of Stanton Energy Reliability Center (98 MW)
El Nido Sub-area
El Nido is Sub-area of the LA Basin LCR Area.
3.2.1.2.1 El Nido LCR Sub-area Diagram
Please refer to Figure 3.2-1 above.
3.2.1.2.2 El Nido LCR Sub-area Load and Resources
Table 3.2-2 provides the forecast load and resources in El Nido LCR Sub-area in 2021. The list
of generators within the LCR Sub-area are provided in Attachment A.
Table 3.2-2 El Nido LCR Sub-area 2021 Forecast Load and Resources
Load (MW) Generation (MW) NQC At Peak
Gross Load 1014 Market, Net Seller, Battery, Wind, Solar 536 536
AAEE -17 MUNI 0 0
Behind the meter DG -31 QF 0 0
Net Load 966 LTPP Preferred Resources 23 23
Transmission Losses 14 Existing 20-minute Demand Response 8 8
Pumps 0 Mothballed 0 0
Load + Losses + Pumps 980 Total 567 567
28July 11, 2019
3.2.1.2.3 El Nido LCR Sub-area Hourly Profiles
Figure 3.2-2 illustrates the forecast 2021 profile for the summer peak day in the El Nido LCR Sub-
area. The load profile is obtained from the CEC’s SCE hourly demand forecast (CEDU 2018) for
the 2018-2022 timeframe17.
Figure 3.2-2 El Nido LCR Sub-area 2021 Peak Day Forecast Profiles
3.2.1.2.4 El Nido LCR Sub-area Requirement
Table 3.2-3 identifies the sub-area requirements. There is no Category B (Single Contingency)
LCR requirement and the LCR requirement for Category C (Multiple Contingency) is 374 MW.
Table 3.2-3 El Nido LCR Sub-area Requirements
Year Limit Category Limiting Facility Contingency LCR (MW)
2021 First Limit B None None 0
2021 First Limit C La Fresa-La Cienega 230 kV La Fresa – El Nido #3 & #4 230 kV 374
17
https://ww2.energy.ca.gov/2018_energypolicy/documents/cedu_2018-2030/2018_demandforecast.php
29July 11, 2019
3.2.1.2.5 Effectiveness factors:
All units within the El Nido Sub-area have the same effectiveness factor.
For most helpful procurement information please read procedure 2210Z Effectiveness Factors
under 7630 (G-219Z) posted at: http://www.caiso.com/Documents/2210Z.pdf
Western LA Basin Sub-area
Western LA Basin is Sub-area of the LA Basin LCR Area.
3.2.1.3.1 Western LA Basin LCR Sub-area Diagram
Please refer to Figure 3.2-1 above.
3.2.1.3.2 Western LA Basin LCR Sub-area Load and Resources
Table 3.2-4 provides the forecast load and resources in Western LA Basin LCR Sub-area in 2021.
The list of generators within the LCR Sub-area are provided in Attachment A.
Table 3.2-4 Western LA Basin Sub-area 2021 Forecast Load and Resources
Load (MW) Generation (MW) NQC At Peak
Market, Net Seller, Battery18, Wind, 3,369
Gross Load 11,796 3,369
Solar
AAEE -188 MUNI 582 582
Behind the meter DG -483 QF 58 58
Net Load 11,125 LTPP Preferred Resources 220 220
Transmission Losses 167 Existing 20-minute Demand Response 149 149
Pumps 0 Mothballed 0 0
Load + Losses + Pumps 11,292 Total 4,378 4,378
3.2.1.3.3 Western LA Basin LCR Sub-area Hourly Profiles
The load profile is obtained from the CEC’s SCE hourly demand forecast (CEDU 2018) for the
2018-2022 timeframe.
18
This includes battery energy storage system that has long-term procurement approved by the CPUC.
30You can also read