Annual Market Update 2019 - Electricity market insights - Final
←
→
Page content transcription
If your browser does not render page correctly, please read the page content below

Annual Market
Update 2019
Electricity market insights

Introduction
Annual Market Update 2019, an electricity market review focused                                                      Introduction
on the Netherlands and Germany, including wider European trends
This Annual Market Update (AMU) is focussed on relevant developments on the Central Western European                 Main findings
electricity markets, and the Dutch and German electricity markets in particular. This is the second edition of the
TenneT Annual Market Update. In the past, TenneT published the TenneT Market Review annually to share its
insights on last year’s developments in the electricity market for everyone interested (see link for previous         Wholesale
                                                                                                                     market prices
editions). The structure and topics of the AMU are largely comparable to the TenneT Market Reviews, but the
format is different.
                                                                                                                     Fuel prices &
                                                                                                                      generators
The developments in the Annual Market Update are structured alongside several main topics. The chapter
Wholesale market prices discusses wholesale day-ahead, intraday and futures prices and identifies price trends.
As our electricity system is still highly dependent on fossil-fuelled power, the chapter Fuel prices describes         Capacity
developments in hard coal, natural gas and emission allowance prices, as well as the margins for generators.         & generation

The chapter Capacity & generation focuses on the supply side of the electricity system and discusses
developments in installed capacity and generation. Support for renewables in the Dutch system is discussed in
                                                                                                                     RES support
the chapter RES support schemes, by looking at budget distribution, awarded capacity and generation of the            schemes
SDE+ schemes. In the chapter Wholesale Market integration the storyline zooms out and includes the
interactions of the Dutch electricity system with neighbouring systems. Additionally, the ongoing efforts of          Wholesale
                                                                                                                        market
coupling EU electricity markets are discussed in this chapter. The last two chapters focus on mechanisms in           integration
place to ensure the stability and functioning of the electricity system: Balancing measures, to ensure supply and
demand is equal at all times; and Redispatch measures, to resolve congestion in the grid.
                                                                                                                      Balancing

                                                                                                                     Congestion
                                                                                                                     management

March-26-2020    Annual Market Update 2019                                                                           2
Main Findings (1/3)
Lower wholesale electricity prices across Europe in 2019, prices
                                                                                                                   Introduction
within CWE had a higher convergence. Coal-to-gas switching since
spring.
                                                                                                                  Main findings
Wholesale electricity prices across Europe decreased in 2019. The average day-ahead electricity price
decreased in the Netherlands by 21.5% to 41.2 €/MWh and decreased within the CWE region with 21.7% to 39.7
€/MWh. Additionally wholesale prices within the CWE region also converged more than in 2018. For the               Wholesale
                                                                                                                  market prices
Netherlands the amount of hours with full price convergence increased with all neighbours and reaching 50% full
convergence with Germany. For Germany an increase of full convergence with most of its neighbours was
reached, reaching the highest full convergence with Denmark (DK1) by 66%.
                                                                                                                  Fuel prices &
                                                                                                                   generators

This decrease in wholesale electricity prices across Europe is mainly explained by a significant decrease in
natural gas (36%) and coal prices (28%), the annual average carbon emission allowance price stabilised around       Capacity
25 €/t CO2 an average increase of 61% compared to 2018. The effect of these changes in fuel and carbon prices     & generation

resulted since March in coal-to-gas switching due to higher generator margins for gas-fired power plants
compared to coal-fired power plants in both the Dutch and German markets.
                                                                                                                  RES support
                                                                                                                   schemes

                                                                                                                   Wholesale
                                                                                                                     market
                                                                                                                   integration

                                                                                                                    Balancing

                                                                                                                  Congestion
                                                                                                                  management

March-26-2020    Annual Market Update 2019                                                                        3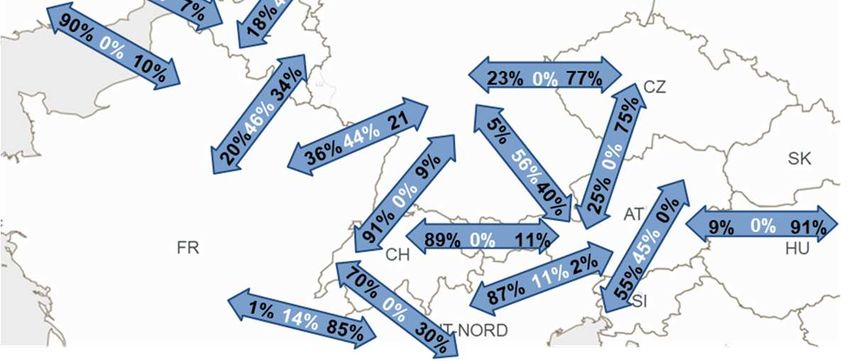
Main Findings 2/3
Installed Solar capacity in NL increased by 2.4 GW. NL net
                                                                                                                      Introduction
positions switching from a more dominant import position towards
a more balanced import/export position.
                                                                                                                     Main findings
Total generation in the Netherlands increased due to less imports and increased exports. As a consequence of
coal-to-gas switching, generation based on natural gas significantly increased and generation based on coal
significantly decreased. Renewable generation slightly increased by 13.9% to 16.7 TWh for wind and solar              Wholesale
                                                                                                                     market prices
generation. Additionally around 1.7 TWh of biomass co-firing in coal-fired power plants was certified, meaning
1.7 TWh of total generation in coal-fired power plants can be attributed to the biomass co-firing.
                                                                                                                     Fuel prices &
                                                                                                                      generators
In 2019 round I, less funds were made available for SDE+ subsidies compared to previous SDE+ rounds. The
available budget was not fully allocated due to incomplete requests or lack of appropriate permits. For 2019
round II, another 5 B€ was made available, bringing the total available budget for 2019 to 10 B€. At the time of       Capacity
writing, the budget distribution of 2019 round II had not yet been published. Solar projects still had the largest   & generation

share in allocated SDE+ subsidies by 2.54 B€ in 2019 round I. The cumulative development of awarded projects
in SDE+ show more than 20 GW of renewable capacity is expected to be installed which accounts for an annual
                                                                                                                     RES support
generation of around 45 TWh, of which 7 TWh by unsubsidised offshore wind.                                            schemes

                                                                                                                      Wholesale
Physical net import and export positions in the CWE region changed significantly in some countries in 2019              market
                                                                                                                      integration
compared to 2018. The Netherlands increased its export position due to improved competitiveness of gas-fired
power plants resulting in a near equal amount of annual imports and exports over 2019. First flows between DK1
and NL were realised due to the go-live of the DK1-NL interconnector COBRAcable in September. The German
net position remained predominantly exporting but a significant increase in hours with an importing net position       Balancing

can be observed. Increased availability of Belgium nuclear plants resulted in a more balanced import and export
position over 2019 after a dominant importing position over 2018.                                                    Congestion
                                                                                                                     management

March-26-2020    Annual Market Update 2019                                                                           4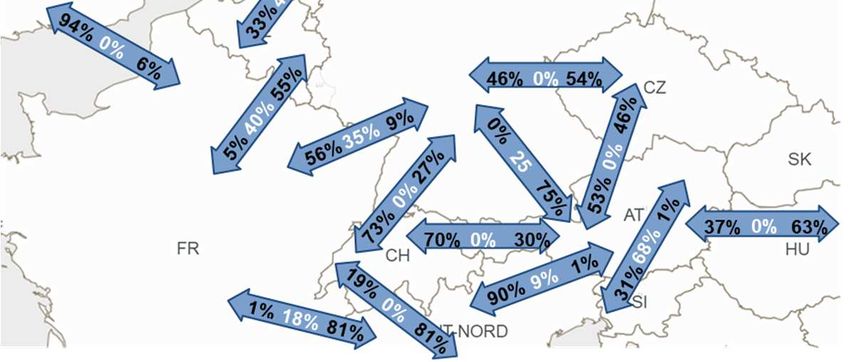
Main Findings (3/3)
Capacity prices for NL FRR balancing products decreased
                                                                                                                       Introduction
significantly during 2019. Redispatch costs up in NL and DE.
                                                                                                                      Main findings
Capacity prices for Frequency Restoration Reserves (FRR) decreased again in 2019 after a steep increase in
2018 as a result of an increase in the amount of contracted capacity in order to comply with the EU Electricity
Balancing Guideline. Prices almost returned to pre-2018 levels indicating a significant response from the market.      Wholesale
                                                                                                                      market prices
Capacity prices for Frequency Containment Reserves (FCR) decreased as well. Furthermore, since July 2019,
FCR capacity is auctioned daily instead of weekly and marginal pricing was introduced in the FCR auctions. The
daily auctions led to more volatile prices.
                                                                                                                      Fuel prices &
                                                                                                                       generators

Since 2013, a trend was observed: a decreasing number of ISPs with a low net imbalance volume and an
increasing number of ISPs with high net imbalance volume. This trend seems to have stopped in 2019 compared             Capacity
to 2018. Similar to 2018, the 2019 imbalance volume shows a more symmetrical distribution of ISPs with long           & generation

and short imbalance volumes. This is also seen in the imbalance price delta, which reached a near equal level
for long and short systems in 2018 and 2019.
                                                                                                                      RES support
                                                                                                                       schemes

In September the first Intraday Congestion Spreads (IDCONS) were activated via the Grid Operators Platform
                                                                                                                       Wholesale
for Congestion Solutions (GOPACS). GOPACS is a TSO-DSO coordinated market-based congestion                               market
management platform that enables intraday bids with a geo-tag to be used for congestion management as well             integration

(see for more info www.gopacs.eu). Costs for congestion management in the Netherlands increased to €61
million in 2019 (+12%). Most costs were related to redispatch, and a smaller share can be attributed to restriction
contracts, which are contracts with market parties to withhold a share of production for a certain period. Across       Balancing
the border in Germany, cost for congestion management in the first three quarters (Q4 data unavailable yet) of
2019 were in the order of €1 billion.                                                                                 Congestion
                                                                                                                      management

March-26-2020    Annual Market Update 2019                                                                            5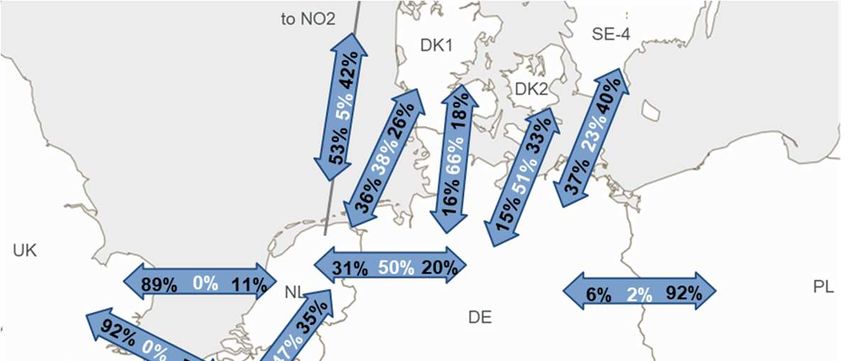
Wholesale Market Prices

                          6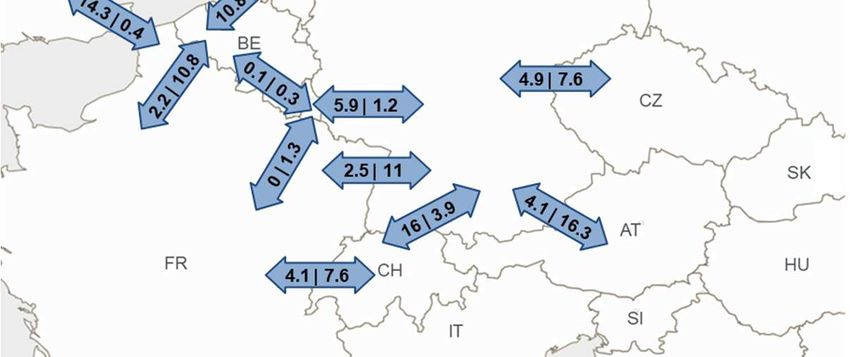
Market Timeframes
The wholesale market consists of several sub-markets
                                                                                                                             Introduction
 Market Timeframe and Balancing

                                                                                                                             Main findings

                                                                                                                              Wholesale
                                                                                                                             market prices

                                                                                                                             Fuel prices &
                                                                                                                              generators

                                                                                                                               Capacity
                                                                                                                             & generation

                                                                                                                             RES support
                                                                                                                              schemes

                                                                                                                              Wholesale
                                                                                                                                market
 • The figure above shows the relation between the different timeframes of the wholesale market and the balancing             integration

   market. In wholesale markets, electricity generators sell electricity to large industrial consumers and electricity
   suppliers. The electricity suppliers sell electricity to the final consumer in retail markets. The scope of this Annual
   Market Update is on wholesale markets.                                                                                     Balancing
 • Balancing and redispatch are system services that are important features of the electricity system. TSOs procure
   balancing reserves that can be activated in real-time to resolve disruptions in system balance. Also, TSOs perform
                                                                                                                             Congestion
   network security analyses to identify congestion, which is resolved by activating redispatch.                             management

March-26-2020     Annual Market Update 2019                                                                                  7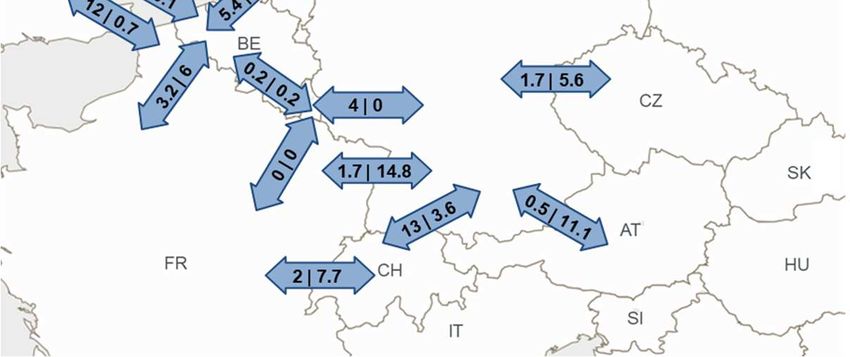
Day-ahead prices Europe
2019: significant decrease of day-ahead prices across Europe
                                                                                                                 Introduction
 Yearly Average DA Prices Europe
 2018                                                         2019

                                                                                                                Main findings

                                                  € / MWh                                                        Wholesale
                                                                                                                market prices
                                                       70

                                                       60                                                       Fuel prices &
                                                                                                                 generators

                                                       50

                                                                                                                  Capacity
                                                       40                                                       & generation

                                                       30
                                                                                                                RES support
                                                                                                                 schemes

                                                                                                                 Wholesale
                                                                                                                   market
                                                                                                                 integration

• Annual average day-ahead prices of almost all European countries significantly decreased from 2018 to 2019.     Balancing
• The Netherlands, Ireland, the UK and France experienced the steepest decline in the range of 20% - 30%.
• Germany , the Southern European countries and Sweden experienced a decrease of around 15%.                    Congestion
                                                                                                                management

March-26-2020     Annual Market Update 2019       Source: MRC Market Coupling                                    8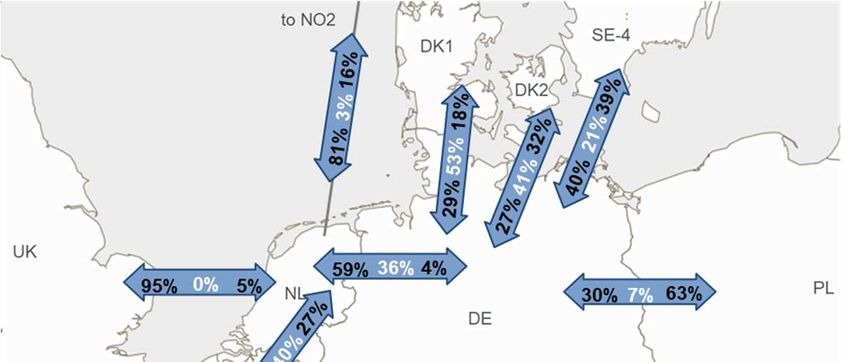
Day-ahead prices CWE
 Prices significantly decreased and converged within CWE
                                                                                                                                     Introduction
  Monthly Average Day-ahead Wholesale Prices in the CWE region

€ / MWh
                                                                                                                                    Main findings
100
  90
  80                                                                                                                                 Wholesale
                                                                                                                                    market prices
  70
  60
  50                                                                                                                                Fuel prices &
  40                                                                                                                                 generators

  30
  20                                                                                                                                  Capacity
                                                                                                                                    & generation
  10
    -
          J   F M A M J          J    A S O N D J           F M A M J          J   A S O N D J          F M A M J   J   A S O N D
                                                                                                                                    RES support
                             2017                                          2018                                 2019                 schemes

                   NL                BE           DE/AT*               DE*              AT*             FR     yearly average
                                                                                                                                     Wholesale
        * On October 1st, 2018 the German/Austrian bidding zone split into two separate bidding zones                                  market
                                                                                                                                     integration
 • The average day-ahead (DA) electricity price decreased in the Netherlands by 21.5% to 41.2 €/MWh and decreased
   within the Central Western European (CWE) region by 21.7% to 39.7 €/MWh.
 • Overall, DA prices in the CWE region decreased, mainly due to lower fuel prices (see Fuel Prices & Generators).
   Additionally within the CWE region DA prices converged significantly in comparison to previous years.                              Balancing
 • A typical peak in monthly average DA prices in Q4, typically observed in previous years, was absent in 2019. This
   absence is likely the result of higher availability of nuclear power plants in both Belgium and France, and relatively mild
                                                                                                                                    Congestion
   temperatures which dampened the demand in France which has of a large share of electric heating.                                 management

March-26-2020           Annual Market Update 2019              Source: MRC Market Coupling                                           9
Price volatility
   Price volatility decreased in 2019
                                                                                                                                           Introduction
  Spread of Day-Ahead prices in selected European countries
  2018                                                   2019

€ / MWh                                                    € / MWh                                                                        Main findings

 100                                                        100                                                          95% percentile
                    CWE                    Other                               CWE                   Other
  90                                                         90
                                                                                                                                           Wholesale
                                                                                                                         75% percentile   market prices
  80                                                         80
                                                                                                                         median
  70                                                         70
                                                                                                                         25% percentile
                                                             60                                                                           Fuel prices &
  60
                                                                                                                                           generators
  50                                                         50                                                          5% percentile

  40                                                         40
                                                                                                                                            Capacity
                                                             30                                                                           & generation
  30

  20                                                         20

  10                                                         10                                                                           RES support
                                                                                                                                           schemes
   0                                                          0
          AT   DE    BE   FR    NL    GB    DK1    NO2               AT   DE   BE    FR   NL    GB    DK1    NO2
                                                                                                                                           Wholesale
                                                                                                                                             market
   • Lower volatility in general in almost all selected countries and smaller differences in volatility between countries in 2019          integration
     compared to 2018. These effects are likely a consequence price damping effects such as higher availability of nuclear
     power in Belgium and France and lower fuel prices (see Fuel Prices & Generators).
   • Electricity prices in the Netherlands are strongly influenced by gas fuel price developments, because gas-fired power
                                                                                                                                            Balancing
     plants most of the time set the electricity price in NL. In countries such as Germany, Belgium, France and Denmark
     nuclear or renewables (typically lower marginal costs than gas) are more often price setting, especially on low demand
     days such as weekend or holidays. This effect of this difference in generation mix is seen in the volatility in the lower            Congestion
     price range (below the median up to the 5% percentile) for these countries that reach lower prices than in the                       management
     Netherlands.
  March-26-2020       Annual Market Update 2019          Source: MRC Market Coupling                                                      10
Futures Prices NL & DE
Futures prices became more volatile and were converging up to
Introduction
Q3 2019
Dutch and German Baseload Year Futures
€ / MWh Main findings
70
60 Wholesale
market prices
50
40 Fuel prices &
generators
30
20 Capacity
& generation
10
0
RES support
J J F F MM AA MM JJ JJ AA SS OO NN DD J J FF MM AA M
M JJ JJ AA SS O
O N
N D
D JJ FF M
M AA MM JJ JJ AA SS OO NN DD schemes
2017 2018 2019
2017 2018 2019 Wholesale
NL 2019 NL 2020 NL 2021 NL 2022 DE 2019 DE 2020 DE 2021 DE 2022 market
integration
• Baseload Year Futures prices stabilised at the start of 2019 around 50 €/MWh with a slightly decreasing trend after
July 2019 after a relatively strong increase in prices during 2018.
Balancing
• Futures prices between Germany and the Netherlands were converging in 2019 up to Q3 which suggests that market
parties expected that the average price spread between the Netherlands and Germany will decrease in the future. This
converging development is contrary to the diverging observations of the futures for 2020-2022 traded in 2018. From Q3 Congestion
onwards prices were diverging again. management
March-26-2020 Annual Market Update 2019 Source: EEX 11Intraday Prices
In 2019: Smaller differences between DA and ID prices
Introduction
Differences between Dutch Day-ahead and Intraday Prices
Hours / Year
2000 Main findings
1800
1600
1400 Wholesale
1200 market prices
1000
800
600 Fuel prices &
generators
400
200
0 Capacity
20
& generation
DA < ID DA > ID RES support
schemes
Price Delta Cluster (€/MWh)
2017 2018 2019
Wholesale
ID trade takes place in a continuous auction, so there is no single price per hour as in the DA market. Therefore, ID prices per hour were market
determined by taking hourly average prices weighted on trading volumes. integration
• The results show more hours with a smaller difference between day-ahead (DA) and intraday (ID) prices in 2019
compared to 2018 and 2017. Furthermore, there is a steep increase in hours with a relatively low price delta (-2-0 and
Balancing
0-2).
• Historically, as well as in 2019, the above graph has been skewed to the right, indicating that there were more hours in
which the DA price was higher than the ID price, than there were hours with higher a ID price than DA price. This effect Congestion
was slightly less pronounced in 2018. management
March-26-2020 Annual Market Update 2019 Source: APX, ETPA, MRC Market Coupling 12Intraday Trading Volumes
57% increased ID volume in 2019 compared to 2018
Introduction
Monthly Intraday Trading Volumes in the Netherlands
GWh First wave Second wave Main findings
go-live XBID go-live XBID
450
400 Wholesale
*+57% market prices
350
300
+51% Fuel prices &
250 generators
200
150 Capacity
& generation
100
50
RES support
0 schemes
J F M A M J J A S O N D J F M A M J J A S O N D J F M A M J J A S O N
2017 2018 2019 Wholesale
market
Crossborder Spot Yearly average *2019 data is up to November, year-on-year increase is therefore preliminary integration
• Significant increase in intraday (ID) trades in 2018 (51%) and in 2019 (57%). A likely explanation is the larger share of
variable renewable generation. Market participants use the intraday market to optimise their position, since new
information (e.g. better renewable feed-in forecasts, better demand forecasts, unexpected outages) becomes available Balancing
after closure of the DA market. More variable renewable generation thus leads to a shift of trade closer to real-time.
• Bulgaria, Croatia, Czech Republic, Hungary, Poland, Romania and Slovenia joined the Cross-Border intraday platform
Congestion
(XBID) with the second wave go-live in November 2019. This increases liquidity for intraday trading providing that there management
is available transmission capacity.
March-26-2020 Annual Market Update 2019 Source: APX, ETPA 13Intraday Trades
Number of trades more than doubled for all delivery hours in 2019
Introduction
Most intraday trades for the evening peak
Average Amount of Intraday Trades per Delivery Hour
Main findings
Number. of trades
180
160 Wholesale
market prices
140
120 Fuel prices &
generators
100
80 Capacity
& generation
60
40 RES support
schemes
20
Wholesale
0 market
integration
1 2 3 4 5 6 7 8 9 10 11 12 13 14 15 16 17 18 19 20 21 22 23 24
2017 2018 2019 Delivery hour
• The above figure shows the average amount of trades per delivery hour of the day. Balancing
• Intraday trades were highest after midday and peaking in the evening. This is could be related to a decrease in solar
infeed after noon and the increase in electricity consumption in the evening hours.
Congestion
• The number of trades more then doubled for all delivery hours, whereas the annual average traded volume increased management
by 57%, indicating lower volumes per trade.
March-26-2020 Annual Market Update 2019 Source: APX, ETPA 14Fuel Prices
15Fuel Prices
Major drop in fuel prices up to mid 2019
Introduction
Natural Gas Prices Coal Prices
€/MWhth €/MWhth
Main findings
30 14
+5%
-28%
+26% -36%
25 12
Wholesale
market prices
10
20
8 Fuel prices &
15 generators
6
10 Capacity
4 & generation
5 2
RES support
0 0 schemes
2017 2018 2019 2017 2018 2019
Gas price Yearly average Coal price Yearly average Wholesale
market
Gas prices are based on OTC natural gas prices at the Dutch virtual Coal prices are based on the over the counter API#2 integration
exchange Title Transfer Facility (TTF). price index.
• The annual average gas price decreased by 36% from 22.3 €/MWhth in 2018 to 14.1 €/MWhth in 2019. This decreasing
price effect is partly the result of relatively high stock levels of gas at the start of 2019 due to mild temperatures (and Balancing
consequently less demand for heating) in the 2018-2019 winter. Additionally LNG imports in Europe significantly
increased since September 2018 increasing the supply of gas which also had a decreasing effect on prices.
• The annual average hard coal prices decreased as well by 28% from 11.2 €/MWhth in 2018 to 8 €/MWhth in 2019. This Congestion
management
is likely the result of a drop in coal demand for electricity generation due to the lower gas prices.
March-26-2020 Annual Market Update 2019 Source: energate 16Carbon Prices
Carbon prices stabilised around 25 €/tCO2 in 2019
Introduction
Year-on-year carbon price increased by 61% in 2019
CO2 Emissions Allowance (EU ETS) Prices
Main findings
€ / tCO2
35
Wholesale
market prices
30 +61.0%
25
Fuel prices &
generators
20 +66.0%
15 Capacity
& generation
10
RES support
5 schemes
0 Wholesale
2017 2018 2019 market
CO2 price Yearly average integration
• After the CO2 Emission Allowances price more than doubled during 2018, the price roughly stabilised by the end of
2019 around 25 €/tCO2. The annual average year-on-year price increased by 61% in 2019 compared to 2018.
Balancing
• 2018 price volatility was partly driven by Brexit and by the run-up to the Market Stability Reserve that came in effect in
January 2019.
• The volatility during 2019 can partly be attributed to speculation on CO2 Emission Allowances prices, fuelled by Congestion
political uncertainty in the UK over Brexit, and developments and speculation regarding the German coal phase out. management
March-26-2020 Annual Market Update 2019 Source: energate 17Generator Margins NL
Coal-fired power plants’ margins significantly decreased
Introduction
Coal-to-gas switching since March/April 2019
Dutch Monthly Average Clean Dark Spread and Clean Spark Spread
Main findings
€ / MWh
40
Wholesale
market prices
30
20
Fuel prices &
generators
10
0
Capacity
& generation
-10
-20
RES support
J F M A M J J A S O N D J F M A M J J A S O N D J F M A M J J A S O N D schemes
2017 2018 2019
Wholesale
Clean Dark Spread Base Clean Dark Spread New Clean Spark Spread Base Clean Spark Spread Peak market
Assumptions integration
Coal: efficiency Base 40%, New 45%, emission factor 91.7 tCO2/TJth, heating value 25.1 MJ/kg; Gas: efficiency Base & Peak 55% emission factor 55.6 tCO2/TJth,.
• Around March/April the Clean Dark Spread Base and new (for modern high efficient coal-fired power plants) decreased
below the Clean Spark Spread Base suggesting coal-to-gas switching. This indicates the point at which it is more Balancing
profitable to produce electricity from natural gas than from coal.
• The effects of coal-to-gas switching in the actual monthly generation mix (Generation in the Netherlands) shows a
Congestion
significant decrease in generation from coal-fired power plants and an increase in the generation of gas-fired power management
plants.
March-26-2020 Annual Market Update 2019 Source: energate, MRC Market Coupling 18Generator Margins DE
Negative Margins in March 2019
Introduction
German Monthly Average Clean Dark Spread and Clean Spark Spread
€ / MWh Main findings
40
Wholesale
30 market prices
20
Fuel prices &
generators
10
0
Capacity
& generation
-10
J F M A M J J A S O N D J F M A M J J A S O N D J F M A M J J A S O N D
RES support
2017 2018 2019 schemes
Clean Dark Spread Base Clean Dark Spread New Clean Spark Spread Base Clean Spark Spread Peak
Wholesale
Assumptions market
Coal: efficiency Base 40%, New 45%, emission factor 91.7 tCO2/TJth, heating value 25.1 MJ/kg; Gas: efficiency Base & Peak 55% emission factor 55.6 tCO2/TJth,. integration
• The German Clean Dark and Clean Spark Spreads show a similar pattern. Coal-to-gas switching occurs in March as
well. Exception to the Dutch pattern is the negative margins in March as a result of high renewable in-feed in Germany
Balancing
suppressing monthly average day-ahead prices down below healthy margins of both coal- and gas-fired power plants.
Congestion
management
March-26-2020 Annual Market Update 2019 Source: energate, MRC Market Coupling 19Capacity & Generation
20Capacity in the Netherlands
Main capacity increase by Solar PV, which grew by 2.4 GW
Introduction
Dutch Operational Capacity Dutch Mothballed Capacity Changes (∆2018-2019)
GW GW GW
33 Main findings
35 10 3,0
31 2,6
9
30 2,5
8 Wholesale
2,0 market prices
25 7
6 1,5
20 Fuel prices &
5 1,0 generators
15
4 0,5
2,9 2,8
10 3 - Capacity
- & generation
2
5 -0,1
1 -0,5
RES support
- 0 -1,0 -0,6 schemes
2018 2019 2018 2019 Operational Mothballed
Wholesale
Solar Offshore Wind Onshore wind Biomass Hydro market
Oil Natural gas Hard coal Nuclear Other integration
The figures represent the end-of-year installed capacity as observed on December 31st of 2018 and 2019
• Operational capacity increased by 2.6 GW, almost fully the result of solar PV which grew by 2.4 GW in 2019. Onshore
wind capacity grew by a modest 70MW in 2019. Balancing
• Closing the Hemweg coal-fired power plant resulted in a 600MW decrease in operational capacity (see Capacity in the
Netherlands). Congestion
• Mothballed capacity dropped by 100 MW due to permanent decommissioning of Centrale Merwedekanaal. management
March-26-2020 Annual Market Update 2019 Source: TenneT NL, CBS 21Capacity in Germany
Capacity growth mainly from renewables
Introduction
German Operational Capacity German Reserve and Mothballed Capacity Changes (∆2018-2019)
GW GW GW
10 9,6 9,9
250 10 Main findings
8,8
9
211
204 8
200 8
Wholesale
market prices
7 6
150 6
4
Fuel prices &
5
generators
2
100 4 0,8
2,7 0,0
3 2,3 0 Capacity
0,0 & generation
50 2 -0,4
-2
1
-3,0 RES support
0 0 -4 schemes
2018 2019 Reserves * Mothballed Reserves Mothballed Operational Reserves Mothballed
2018 2019
Wholesale
Solar Offshore Wind Onshore wind Biomass Hydro Other market
Oil Natural gas Lignite Hard coal Nuclear integration
* Consist of ‘Sicherheitsbereitschaft’ outside market back-up capacity, and ‘Netzreserve’ used for congestion management
• As in previous years, the majority of the increase in operational capacity between 2018 and 2019 came from
renewables, of which 5 GW Solar and 3.6 GW Wind (on- and offshore). Balancing
• In 2019, 800 MW of lignite capacity was taken out of operation and transferred to the Reserves which now totals 9.6
GW.
Congestion
• The decrease of mothballed gas capacity is due to a decommissioning of a 400 MW gas-fired power plant. The 500 management
MW increase in operational gas-fired power is new-build.
March-26-2020 Annual Market Update 2019 Source: Kraftwerksliste Bundesnetzagentur, ENTSO-E Transparency Platform 22Generation in the Netherlands
Coal-to-gas switching resulted in increased generation from gas
Introduction
and decreased generation from hard coal
Dutch Yearly Gross Electricity Generation Dutch Monthly Generation, net Imports and Exports
TWh TWh Main findings
98 97
100 94
12
10 Wholesale
80 market prices
8
60 6
Fuel prices &
4 generators
40
2
20 Capacity
0
& generation
0 -2
2017 2018 2019 J FMAM J J A SOND J FMAM J J A SOND J FMAM J J A SOND
RES support
2017 2018 2019 schemes
Nuclear Hard coal Certified co-fired biomass Waste Natural gas Wind Uncategorized
Net import (+) / export (-) Load + grid losses
Wholesale
*Generation shown is electricity infeed measured on public grids: ~82-85% of total NL generation. Uncategorised: unitsRenewable Generation NL
Solar generation increased to 5.3 TWh in 2019
Introduction
On- and offshore wind generation 2019 was comparable with 2018
Dutch Solar and Wind Generation annually and monthly
Main findings
TWh TWh
18 2,0
Wholesale
market prices
15
1,5
12
Fuel prices &
generators
9 1,0
6 Capacity
& generation
0,5
3
RES support
0 0,0 schemes
2017 2018 2019 J FMAM J J A SOND J FMAM J J A SOND J FMAM J J A SOND
2017 2018 2019 Wholesale
market
Solar Onshore wind Offshore Wind integration
• Solar generation increased most of the weather dependent renewable generation sources in the Netherlands by
5.3TWh (+31.5%) , a logical consequence of the 2.4 GW installed capacity increase in 2019.
• In 2019 both on- and offshore wind in generated roughly the same amount of electricity as in 2018 which is also a Balancing
logical consequence of only 70 MW addition of onshore wind and no additions in offshore wind in 2019. Differences in
wind related generation between 2018 and 2019 are therefore mainly weather related.
Congestion
• The monthly pattern shows that wind and solar were complementary on a monthly aggregated level with typically more management
solar in the summer and more wind in the winter. Variability on an hourly or daily level is significantly larger.
March-26-2020 Annual Market Update 2019 Source: energieopwek.nl 24Generation Germany
Coal-to-gas switching resulted in decreased generation from hard
Introduction
coal and Lignite, generation from gas and renewables increased
German Yearly Gross Electricity Generation German Monthly Generation, net Imports and Exports
Main findings
TWh TWh
60
600 558
537
516 Wholesale
50 market prices
500
40
400
Fuel prices &
30 generators
300
20
200 Capacity
10 & generation
100 0
RES support
0 -10 schemes
2017 2018 2019 J FMAM J J A SOND J FMAM J J A SOND J FMAM J J A SOND
2017 2018 2019 Wholesale
market
Nuclear Hard coal Lignite Biomass Oil Natural gas Hydro Wind Solar Uncategorized
integration
Net import (+) / export (-) Load
• Coal-to-gas switching mostly affecting of coal based generation -23 TWh (-32%) and lignite -30 TWh (-22%). Gas
increased by 8.5 TWh (19%) but not enough to cover for the reduced generation of coal and lignite. This was covered Balancing
by increased renewables and reduced exports.
• Nuclear, biomass and hydro based generation remained a similar generation output over the past three years. Congestion
• 2019 exports in Q2 and Q3 were almost zero indicating a less competitive electricity mix in DE compared to management
neighbours than in previous years.
March-26-2020 Annual Market Update 2019 Source: Fraunhofer Energy Charts www.energy-charts.de 25Renewable Generation DE
Wind generation increased with 14% in 2019 compared to 2018
Introduction
Annual and Monthly Solar and Wind Generation Germany
Main findings
TWh TWh
200 25
Wholesale
180 market prices
20
160
140 Fuel prices &
15 generators
120
100
10
80 Capacity
& generation
60 5
40
20 0 RES support
schemes
0 J FMAM J J A SOND J FMAM J J A SOND J FMAM J J A SOND
2017 2018 2019 2017 2018 2019 Wholesale
market
Solar Wind integration
• In 2019 wind generation was up 14% compared to 2018, reaching 127 TWh which was a logical consequence of the
3.6 GW additions in on- and offshore wind. Solar generation increased only marginally up to 46 TWh (+2%)
• The monthly pattern shows that wind and solar were complementary on a monthly aggregated level by typically more Balancing
solar in the summer and more wind in the winter. Variability on an hourly or daily level are likely to be significantly
larger.
Congestion
management
March-26-2020 Annual Market Update 2019 Source: Fraunhofer Energy Charts www.energy-charts.de 26RES Support Schemes
27Budget Distribution SDE+
Lower available budget for SDE+ in 2019
Introduction
Budget Distribution per SDE+ Round
Billion € • The SDE+ is an operating (feed- Main findings
12 in-tariff) subsidy. Producers
receive a guaranteed payment
(subsidy) for the energy they Wholesale
10 market prices
generate from renewable
sources.
8 • In relation to the expected
Fuel prices &
technological improvements and generators
associated cost reductions, the
6 available SDE+ budget is
decreasing. This decision was
Capacity
made to ensure sufficient & generation
4
competition in development of
renewable energy projects.
2 • In 2019 round I, several subsidy RES support
requests were rejected due to schemes
insufficient adherence to
0 requirements set by the Wholesale
2012 2013 2014 2015 2016 I 2016 II 2017 I 2017 II 2018 I 2018 II 2019 I Netherlands Enterprise Agency market
integration
Solar Onshore wind (RVO).
Biomass co-firing Hydro • Available grid capacity was not
part of the requirements yet will
Heat/gas/CHP/all other technologies Rejected submissions Balancing
become part of the project
Available budget assessments in 2019 round II.
Congestion
management
March-26-2020 Annual Market Update 2019 Source: RVO 28Capacity & Generation SDE+
2019 round I SDE+ subsidy allocation resulted mostly in solar
Introduction
capacity
Subsidised Capacity per SDE+ Round Subsidised expected yearly generation per SDE+ Round
Main findings
GW TWh/yr
4 5
Wholesale
market prices
4
3
Fuel prices &
3 generators
2
2
Capacity
& generation
1
1
RES support
schemes
0 0
2012 2013 2014 2015 2016 I 2016 II 2017 I 2017 II 2018 I 2018 II 2019 I 2012 2013 2014 2015 2016 I 2016 II 2017 I 2017 II 2018 I 2018 II 2019 I
Wholesale
Market
Solar Onshore wind Biomass co-firing integration
• 2019 round I resulted mostly in SDE+ subsidised solar capacity. In each round except 2015, the SDE+ budget
allocation resulted in a majority of solar capacity.
Balancing
• A clear discrepancy is seen between awarded capacity and awarded electricity generation per SDE+ round. Even
though the majority of capacity was awarded to solar in recent years, electricity generation from wind or biomass co-
firing is higher. This can be attributed to the higher load factor of these technologies. Congestion
management
March-26-2020 Annual Market Update 2019 Source: RVO 29Cumulative development SDE+
Over 20 GW renewable electricity capacity is projected to be
Introduction
installed under the SDE+ subsidy scheme
End of Year Cumulative Capacity to be installed under End of Year Cumulative Electricity Generation to be
SDE+ generated annually under SDE+
Main findings
GW TWh/yr
25 50
Wholesale
45 market prices
20 40
35 Fuel prices &
generators
15 30
25
10 20 Capacity
& generation
15
5 10
RES support
5 schemes
0 0
2012 2013 2014 2015 2016 2017 2018 2019 2012 2013 2014 2015 2016 2017 2018 2019 Wholesale
Solar Onshore wind Biomass co-firing Hydro Offshore wind Offshore wind unsubsidised Market
integration
*Note that 2019 round II is excluded in 2019 figures
• After 7.5 years of SDE+ subsidy schemes, more than 20 GW, of awarded capacity of solar, on- and offshore wind,
hydro, biomass co-firing is in operation or is planned to be installed. 1.5 GW of this capacity is unsubsidised offshore Balancing
wind.
• This cumulative capacity is good for 45TWh annual generation of which 7 TWh from unsubsidised offshore wind. With
Congestion
an annual consumption of 117 TWh in 2018 (AMU 2018), renewable generation resulting from SDE+ subsidies management
(excluding the unsubsidised offshore wind) would correspond to 32% of total annual consumption.
March-26-2020 Annual Market Update 2019 Source: RVO 30Wholesale Market Integration
31Aggregated Exchange EU
Less imports by Belgium and the Netherlands, less exports by
Introduction
Germany
Yearly Aggregated Import and Export Volumes
2018 2019
Main findings
TWh/year
Net export Wholesale
market prices
70
30
Fuel prices &
generators
0
Capacity
-30
& generation
-70
RES support
schemes
Wholesale
market
integration
• The Netherlands is a net importing country. Net import decreased from 8.2 TWh in 2018 to 0.3 TWh in 2019 (-96%).
Germany is typically a net exporting country due to large capacity of wind and coal (typically low marginal costs), but
this has changed due to coal-to-gas switching. As a result net exports decreased from 51.1 TWh to 33.8 TWh (-34%).
Balancing
• In 2019 France was again Europe’s largest electricity exporter. Whereas the Belgium net export position became more
balanced due to increased nuclear availability.
• Poland changed from a more balanced import/export position to a more pronounced import position. Lower export Congestion
positions were seen for Norway due to the summer drought that resulted in lower hydro stocks. management
March-26-2020 Annual Market Update 2019 Source: ENTSO-E Transparency Platform 32Cross-border Flows 2018
Most NL imports came from DE and exports went to BE
Introduction
Physical Cross Border Flows 2018
• The Netherlands received most Main findings
of its imports from Germany (20.9
TWh). This is complemented by
imports from Norway via NorNed Wholesale
market prices
(3.9 TWh) and Belgium (1.8
TWh). The majority of exports
were going to Belgium (10.8
TWh), followed by the UK (6.7 Fuel prices &
generators
TWh).
• Germany’s main exports went to
Switzerland (16 TWh), Austria
Capacity
(16.3 TWh) and the Netherlands & generation
(20.9TWh). Total imports were
much lower as Germany is a net
exporting country, but were RES support
mostly received from France (11 schemes
TWh), the Czech Republic (4.9
TWh) and Denmark (4.4 TWh). Wholesale
market
• The unavailability of nuclear integration
plants in Belgium in the second
half of 2018 was resolved by an
increased amount of imports from
France. Balancing
• Note that this figure shows physical
flows between countries, which are
different from scheduled commercial Congestion
management
exchanges between bidding zones.
March-26-2020 Annual Market Update 2019 Source: ENTSO-E Transparency Platform 33Cross-border Flows 2019
Less cross-border flows in 2019 | Go-Live of COBRA in September
Introduction
Physical Cross Border Flows 2019
• In general less cross-border flows in Main findings
2019 compared to 2018. By less
flows a higher convergence was
reached (see DA Price Wholesale
Convergence 2018 and 2019) . This market prices
is most likely a consequence of the
impact fuel prices had by the market
decreasing the differences in cost Fuel prices &
prices between the marginal generators
generators in different countries.
• NL – BE imports and exports were
Capacity
more balanced in 2019 after two & generation
years of nuclear unavailability
issues leading to dominantly
exports towards BE.
RES support
• Imports from Germany decreased schemes
from 20.9 TWh in 2018 towards 9.1
TWh in 2019. Wholesale
market
• Go-live of Nemo Link interconnector integration
between BE and UK end of January
and the COBRAcable between NL
and DK in September resulted in
the first BE-UK and NL-DK flows Balancing
respectively. There was no
dominant direction of the flow on
Congestion
COBRAcable.
management
March-26-2020 Annual Market Update 2019 Source: ENTSO-E Transparency Platform 34Net Positions CWE
Annual net position distribution of NL and BE more balanced
Introduction
Distribution of DE net positions more volatile
Spread of day-ahead net position in CWE
GW Netherlands NL GW/h Belgium BE Main findings
4 4 95% percentile
Importing | Exporting
3 3
2 2
1 1 75% percentile Wholesale
0 0 market prices
median
-1 -1
-2 -2 25% percentile
-3 -3
Fuel prices &
-4 -4 generators
2017 2018 2019 GW/h 2017 2018
France FR 2019 5% percentile
GW Germany DE
14 14
12 12
10 10 Capacity
8 & generation
| Exporting
8
6 6
4 4
2 2
0 0 RES support
-2 schemes
-2
Importing
-4 -4
2017 2018 2019 2017 2018 2019 Wholesale
‘Net Position' means the netted sum of electricity exports and imports for each market time unit (hourly in above graph) for a bidding zone market
integration
• Both NL and BE increased their annual export position significantly in 2019 compared to previous years by an increased
amount of hours with a positive net position (which reflects a net export of electricity). Additionally both positions were
neither dominating towards either imports or exports but were more evenly spread during the year.
Balancing
• FR and DE had a decreased, but still dominant, annual export position. In addition, the net positions of Germany in 2019
became more volatile, including around 25% of the hours an importing position. The DE-AT split from October 2018
could explain the hours with a higher net exporting position for DE since DE-AT exchanges were made visible in the net Congestion
positions. The hours with a lower and importing position were most likely the result of coal and lignite power losing management
competitive advantage to foreign gas power resulting in more imports.
March-26-2020 Annual Market Update 2019 Source: MRC Market Coupling 35Price Areas in CWE
Increased amount of hours with full price convergence in 2019
Introduction
compared to 2018
Monthly Distribution of Day-ahead Price Areas in the CWE Region
DE / AT Main findings
Bidding zone split
100%
90%
Wholesale
80% market prices
70%
60% Fuel prices &
50% generators
40%
30% Capacity
& generation
20%
10%
0% RES support
schemes
J F M A M J J A S O N D J F M A M J J A S O N D J F M A M J J A S O N D
2017 2018 2019 Wholesale
market
1 2 3 4 5 integration
• The figure shows the time distribution of the number of day-ahead price areas in the CWE region bidding zones. When
there is one price area, full price convergence occurs (all bidding zones have the same price).
• There was full price convergence (1 price area) for 42% of the time in 2019, a significant increase compared to the Balancing
33% in 2018. This higher convergence has emerged by less cross border exchanges (see cross border flows 2019). It
is therefore likely that the decreasing fuel prices and coal-to-gas switching has led to less differences between the
Congestion
marginal operating units in the several CWE countries. As a consequence prices could converge with less exchanges. management
Additionally the higher availability of nuclear power plants in France and Belgium allowed for higher convergence.
March-26-2020 Annual Market Update 2019 Source: MRC Market Coupling 36DA Price Convergence 2018
High convergence within the CWE region & DE-DK
Introduction
Day-ahead Price Convergence for Selected Countries in 2018
• Relatively high convergence for Main findings
CWE countries and DE-DK.
Lower convergence between
CWE and other countries. Wholesale
market prices
• Centrally located countries that
are included in the flow-based DA
market coupling had higher price
Fuel prices &
convergence with each other. generators
• For some bidding zone borders
there is inherently zero or low
price convergence as: Capacity
o Grid losses are implicitly & generation
included in market coupling
(e.g. NL-GB, NL-NO2)
o For explicit coupled borders, RES support
the capacity auction price schemes
needs to be added to the DA
prices (DE-PL, DE-CZ, AT- Wholesale
CZ, AT-HU, all CH borders). market
integration
Notes for figure:
• DA price convergence in white, black
numbers show how often the DA price
was higher in that country.
Balancing
• Percentages do not always count up to
100% due to rounding
• * Values for DE-AT border based on Congestion
October – December (after split). management
March-26-2020 Annual Market Update 2019 Source: ENTSO-E Transparency Platform 37DA Price Convergence 2019
Increased DA price convergence on CWE borders
Introduction
Day-ahead Price Convergence for Selected Countries in 2019
• 2019 DA price convergence Main findings
increased on all CWE borders
• Full convergence for NL with DE
in 50% of the time(+14%pp), and Wholesale
market prices
20% of the time DE prices were
higher than NL(+16%pp).
• Between DE and DK full
Fuel prices &
convergence increased up to generators
66% (+13%pp)
• BE prices less often higher than
FR (-21 %pp) and less often Capacity
higher than NL (-15 %pp). & generation
Notes for figure:
• DA price convergence in white, black RES support
numbers show how often the DA price schemes
was higher in that country.
• Percentages do not always count up to Wholesale
100% due to rounding market
integration
Balancing
Congestion
management
March-26-2020 Annual Market Update 2019 Source: ENTSO-E Transparency Platform 38DC Interconnectors – BritNed
Decreasing NL to GB export dominance
Introduction
BritNed Flow Distribution and NL-GB Day-Ahead Price Spread Distribution
MW Main findings
• The BritNed flow distribution
1200
Rated capacity: 1000MW* ↓↑ shows that flows were typically
800 often in an export position from NL
NL exports >
to GB. Further, in 2019 the volume Wholesale
400 market prices
distribution is increasing and the
0 median trend is downwards.
Finally more hours of importing
< NL imports
-400
flows from GB to NL were Fuel prices &
generators
-800 observed in 2019.
-1200 • These observations can be
Q1 Q2 Q3 Q4 Q1 Q2 Q3 Q4 Q1 Q2 Q3 Q4 explained by the spread between
Capacity
2017 2018 2019 the DA prices between GB and & generation
NL. These spreads show a
€/MWh decreasing trend as well as
increase of hours in which NL DA RES support
35
prices were higher than GB. schemes
25
GB DA higher >
• *Hours exceeding rated capacity are due Wholesale
to trials for increasing the capacity of market
15 BritNed. integration
95% percentile
5
75% percentile
Balancing
< NL DA higher
-5 median
Q1 Q2 Q3 Q4 Q1 Q2 Q3 Q4 Q1 Q2 Q3 Q4
2017 2018 2019 25% percentile
Congestion
management
5% percentile
March-26-2020 Annual Market Update 2019 Source: ENTSO-E Transparency Platform 39DC Interconnectors – NorNed
Direction of the flow on the NorNed cable was more volatile in 2019
Introduction
NorNed Flow Distribution and NL-NO2 Day Ahead Price Spread Distribution
MW
• The NorNed flow distribution Main findings
800 Rated capacity: 700MW↓↑
shows that flows were typically
NL exports >
often in an Import position from
400 NO to NL. Further, in 2019 the Wholesale
market prices
volume distribution is increasing
0 and the median trend is
< NL imports
downwards. Finally more hours of
-400 exporting flows from NL to NO Fuel prices &
generators
are observed in 2019.
-800 • These observations can be
Q1 Q2 Q3 Q4 Q1 Q2 Q3 Q4 Q1 Q2 Q3 Q4 explained by the spread between
Capacity
2017 2018 2019 the DA prices between NO and & generation
NO2 DA higher >
NL that shows a median around
€/MWh
zero. These spreads further show
20
a decreasing trend as well as RES support
10 increase of hours in which NO schemes
0 DA prices were higher than NL.
-10 Wholesale
< NL DA higher
market
-20 integration
95% percentile
-30
-40 75% percentile
Balancing
-50 median
Q1 Q2 Q3 Q4 Q1 Q2 Q3 Q4 Q1 Q2 Q3 Q4
2017 2018 2019 25% percentile
Congestion
management
5% percentile
March-26-2020 Annual Market Update 2019 Source: ENTSO-E Transparency Platform 40DC Interconnectors – COBRA
Go-Live of the COBRAcable in September 2019
Introduction
COBRAcable Flow Distribution and NL-DK1 Day Ahead Price Spread Distribution
MW Main findings
• On September 7th, the
800 Rated capacity: 700MW ↓↑
COBRAcable between DK1 and
NL exports >
600
NL started operating.
400 Wholesale
• The COBRAcable flow
200 market prices
Distribution shows that there is
0 no typical import or export
< NL imports
-200 direction. Further the volume
Fuel prices &
-400 distribution is spread over the full generators
-600 import and export which could
-800 indicate that flexibility facilitated
September October November December has a complementary character.
Capacity
2019 • These observations can be & generation
explained by the spread between
€/MWh
the DA prices between DK1 and
DK1 DA higher >
25 NL. These spreads show for the RES support
majority of hours a zero or near schemes
15
zero spread, indicating high
5
convergence between DK1 and Wholesale
market
NL. integration
< NL DA higher
-5 95% percentile
-15
75% percentile
Balancing
-25 median
September October November December
25% percentile
2019 Congestion
management
5% percentile
March-26-2020 Annual Market Update 2019 Source: ENTSO-E Transparency Platform 41Transmission Rights (LTTRs)
DE NL LTTR's higher than NL DE
Introduction
NL DE monthly and yearly Long Term Transmission Rights (LTTR) auction volume and price
MW €/MWh MW €/MWh
1200 10 1200 10
Main findings
1000 8 1000 8
800 800
6 6
600
4 600
400 Wholesale
4
2 400 market prices
200
0 0 200 2
J F M A M J J A S O N D J F M A M J J A S O N D J F M A M J J A S O N D
0 0
2017 2018 2019 2017 2018 2019 2020 Fuel prices &
generators
DE NL monthly and yearly Long Term Transmission Rights (LTTR) auction volume and price
MW €/MWh MW €/MWh
1200 10 1200 10 Capacity
1000 1000 & generation
8 8
800 800
6
600 6
4 600
400
4 RES support
200 2 400 schemes
0 0 200 2
J F M A M J J A S O N D J F M A M J J A S O N D J F M A M J J A S O N D
0 0 Wholesale
2017 2018 2019 2017 2018 2019 2020 market
Offered capacity monthly Offered capacity yearly Auction price integration
• A LTTR is a Long Term Transmission Right that allow the holder to be paid the price differential between coupled
markets. A LTTR reflects the expectation of the value of price differentials for the next month or next year based on the
underlying transmission constraint. Balancing
• The monthly DE/NL LTTRs show higher prices and a more volatile pattern for the LTTR in the DE NL direction and a
much lower and near zero value for the NL DE direction. This indicates higher NL than DE prices were expected.
Congestion
• From the yearly LTTRs it can be seen that price differential expectations for 2020 indicates a higher value for DE NL management
2.34 €/MWh versus NL DE 0.99 €/MWh.
March-26-2020 Annual Market Update 2019 Source: JAO 42Transmission Rights (LTTRs)
Q1 & Q4 NL BE LTTR's higher than BE NL, vice versa in Q2 & Q3
Introduction
NL BE monthly and yearly LTTR auction volume and price
MW €/MWh MW €/MWh
500 50 500 50
Main findings
400 40 400 40
300 30 300 30
200 20 Wholesale
200 20
100 10 market prices
0 0 100 10
J F M A M J J A S O N D J F M A M J J A S O N D J F M A M J J A S O N D
0 0
2017 2018 2019 2017 2018 2019 2020 Fuel prices &
BE NL monthly and yearly LTTR auction volume and price generators
MW €/MWh MW €/MWh
500 50 500 50
Capacity
400 40 400 40 & generation
300 30 300 30
200 20
200 20
100 10 RES support
100 10 schemes
0 0
J F M A M J J A S O N D J F M A M J J A S O N D J F M A M J J A S O N D
0 0
2017 2018 2019 2017 2018 2019 2020 Wholesale
market
Offered capacity monthly Offered capacity yearly Auction price integration
• A LTTR reflects the expectation of the value of price differentials for the next month or next year based on the
underlying transmission constraint.
• The monthly BE/NL LTTRs show a seasonal pattern value for the LTTR in the BE NL direction, higher in Q2 and Balancing
Q3, and NL BE direction, higher in Q1 and Q4. The 2018 Q4 peak for NL BE is the result nuclear unavailability
and consequently expectation of a higher value for the price differential.
Congestion
• From the yearly LTTRs it can be seen that price differential expectations for 2020 indicates a slightly higher value for management
NL BE 2.56 €/MWh versus BE NL 1.73 €/MWh.
March-26-2020 Annual Market Update 2019 Source: JAO 43Balancing
44Net Imbalance Volumes
Increased number of ISP’s in short system Imbalance Cluster
Introduction
Imbalance Volume Distribution in the Netherlands
Number of ISPs
Main findings
4500
4000
3500
3000 Wholesale
market prices
2500
2000
1500
Fuel prices &
1000 generators
500
0
150
Capacity
& generation
RES support
< short long> schemes
Imbalance Cluster (MWh)
2017 2018 2019 Wholesale
market
integration
• This figure shows the total number of Imbalance Settlement Periods(ISPs) per year in which the net system imbalance
volume fell within a certain cluster of net imbalance volumes.
• The imbalance Volume distribution in 2019 shows some more skewedness towards the left side indicating an increase Balancing
of the number of ISP’s in a short system Imbalance Cluster compared to the previous years.
• Since 2013, a continuing trend was seen: a decreasing number of ISPs with low net imbalance volumes and an
Congestion
increasing number of ISPs with high net imbalance volumes. This trend seems to have stopped in 2019 compared to management
2018.
March-26-2020 Annual Market Update 2019 Source: TenneT NL 45Imbalance Price Delta NL
Average long and short system prices decreased in 2019
Introduction
Average Imbalance Price Delta in the Netherlands
€/MWh
45 Main findings
40
35 Wholesale
market prices
30
25
20 Fuel prices &
generators
15
10
Capacity
5 & generation
0
J F M A M J J A S O N D J F M A M J J A S O N D J F M A M J J A S O N D
RES support
2017 2018 2019 schemes
Short system state Long system state
Wholesale
Yearly average short system state Yearly average long system state market
In the AMU 2018 ISPs with dual pricing were not included. In the AMU 2019 these are included using the weighted average ISP price. integration
• The imbalance price delta is the difference between the imbalance price and the day-ahead price and can be
considered as the penalty for being in imbalance.
Balancing
• The average imbalance price delta of short system state (imbalance shortage) and of long system state (imbalance
surplus) were lower in 2019 than in 2018, most likely due to decreasing fuel costs over 2019.
Congestion
management
March-26-2020 Annual Market Update 2019 Source: TenneT NL, MRC Market Coupling 46Imbalance price delta spreads
Higher prices at higher imbalance volume clusters
Introduction
Spread of Dutch Imbalance Price Delta 2019
€/MWh
450 95% percentile Main findings
400
350 75% percentile
Wholesale
300 median market prices
250 25% percentile
200
Fuel prices &
5% percentile generators
150
100
50 Capacity
& generation
0
-50
-150 to -125
-125 to -100
-100 to -75
-25 to 0
0 to 25
75 to 100
100 to 125
125 to 150
150
RES support
schemes
< short long>
Wholesale
Imbalance Cluster (MWh) market
integration
• The figure shows the spread or variability in imbalance price delta for certain imbalance clusters.
• The spread is higher at larger imbalance volume clusters, which corresponds to the principle that the incentive to stay
Balancing
balanced or to help restore the system is larger with larger system imbalance volumes.
• As was the case last years as well (see TMR 2017 and AMU 2018), the imbalance price spread includes negative
values in most imbalance clusters. This can be attributed to the depressing price effect of IGCC (cooperation between Congestion
TSOs to exchange imbalance volumes in opposite directions). management
March-26-2020 Annual Market Update 2019 Source: TenneT NL, MRC Market Coupling 47FCR common & Dutch auction
Marginal pricing and daily auctions since July 2019
Introduction
Frequency Containment Reserve (FCR) Capacity Prices in the Common and Dutch Auctions
€/MWh
45
Pay as bid Marginal pricing Main findings
< weekly auction daily auction >
40
35 Wholesale
market prices
30
25
Fuel prices &
generators
20
15
Capacity
& generation
10
5
RES support
0 schemes
J J F FM MA AM MJ JJ JA AS SO ON ND DJ JF M
F M A M
A M J JJ JA AS SO ON ND DJ JF M
F M
A A
M MJ JJ JA AS SO ON ND D
2017
2017 2018
2018 2019 Wholesale
2019 market
Dutch Average Weekly Dutch Marginal Daily Common Average Weekly Common Marginal Daily integration
• From July 2019 the auction systematics changed in two ways for both the Common and Dutch Auction. Firstly the pay-
as-bid system was replaced by a marginal pricing system. Secondly, the auctions are now held every day, two days Balancing
before the delivery day (D-2).
• FCR prices became more volatile due to daily instead of weekly auctions. The prices for the common auction reached
Congestion
a record low price of 4.17 €/MW/h at 20/11/2019 whereas the Dutch auction price significantly increased for most management
auction days since July.
March-26-2020 Annual Market Update 2019 Source: regelleistung.net 48aFRR in the Netherlands
Prices for aFRR decreased during 2019
Introduction
Contracted automatic Frequency Restoration Reserve (aFRR) Capacity Volumes and Prices in the Netherlands
MW €/MW/h
600 12 Main findings
500 10
Wholesale
market prices
400 8
Fuel prices &
300 6 generators
200 4
Capacity
& generation
100 2
RES support
- - schemes
J F M A M J J A S O N D J F M A M J J A S O N D J F M A M J J A S O N D
2017 2018 2019 Wholesale
market
Volume aFRR symmetrical Volume aFRR upward Price integration
• Prices for aFRR significantly decreased in 2019 almost returning to pre-2018 levels. In 2018 prices increased because
of a tighter balancing market caused by increased capacity contracted for mFRRda (see next slide).
Balancing
• Since 2018, a fixed amount of capacity for aFRR and mFRRda (see next slide) combined is contracted, contracting the
least costly combination, instead of fixed amounts for aFRR and mFRRda products separately. Therefore, 2018 and
2019 show more variation in aFRR volumes. Since July 2019 these volumes stabilised due to the significant decrease Congestion
in mFRRda prices. management
March-26-2020 Annual Market Update 2019 Source: TenneT NL 49mFRRda in the Netherlands
Prices for mFRRda decreased during 2019
Introduction
Manual Frequency Restoration Reserve directly activated (mFRRda) Capacity
Volumes and Prices in the Netherlands
MW €/MW/h
• Prices for mFRRda decreased in Main findings
900 10
9
2019 for both upward and
800
8 downward reserves.
700
7 • Both upward and downward Wholesale
600 market prices
500
6 reserve prices returned to almost
5 the same price levels of 2017
400
4
300 when significantly less reserves
3 Fuel prices &
200 needed to be contracted. The generators
2
100 1
increase in contracted mFRRda
- -
volumes was a direct result from
J F M A M J J A S O N D J F M A M J J A S O N D J F M A M J J A S O N D new requirements in the EU
Capacity
2017 2018 2019 Electricity Balancing Guideline & generation
900 10
that came into force in 2018.
800 9 • The decreasing prices observed
700 8 during 2019 reflect an increased RES support
7 competition for these reserve schemes
600
6 products decreasing the costs for
500
5 the TSO for ancillary services. Wholesale
400
4 market
300 3 integration
200 2
100 1
- -
J F M A M J J A S O N D J F M A M J J A S O N D J F M A M J J A S O N D Balancing
2017 2018 2019
Congestion
Volume mFRRda upward Volume mFRRda downward Price management
March-26-2020 Annual Market Update 2019 Source: TenneT NL 50You can also read