Annual Market Update 2018 - Electricity market insights - TenneT

Page created by Roland Miller
 
CONTINUE READING
Annual Market Update 2018 - Electricity market insights - TenneT
Annual Market
Update 2018
Electricity market insights
Annual Market Update 2018 - Electricity market insights - TenneT
Introduction
A new year, a new item: the Annual Market Update                                                                    Introduction

In the past, TenneT yearly published the TenneT Market Review to share its insights on last year’s developments
                                                                                                                    Main findings
in the electricity market for everyone interested (see link for previous editions). The TenneT Market Review has
been given a new look this year, in the form of the TenneT Annual Market Update before you. The structure and
topics are largely comparable to the previous TenneT Market Reviews, but the format is different. The focus of       Electricity
                                                                                                                    market prices
this Annual Market Update is on relevant developments in the Central Western European electricity markets, and
the Dutch electricity market in particular.
                                                                                                                    Fuel prices &
                                                                                                                     generators
The developments in the Annual Market Update are structured alongside several main topics. The chapter
Electricity market prices discusses wholesale day-ahead, intraday and futures prices and identifies price trends.      Power
As our electricity system is yet highly dependent on fossil-fuelled power, the chapter Fuel prices describes        consumption
                                                                                                                    & generation
developments in hard coal, natural gas and emission allowance prices, as well as the margins for generators.
The chapter Power consumption & generation focuses on the supply and demand sides of the electricity system
                                                                                                                    RES support
and discusses developments in installed capacity, consumption and generation. Support for renewables in the          schemes

Dutch system is discussed in the chapter RES support schemes, by looking at budget distribution, awarded
capacity and generation of the SDE+ schemes. In the chapter Market integration the storyline zooms out and             Market
                                                                                                                     integration
includes the interactions of the Dutch electricity system with neighbouring systems. Additionally, the ongoing
efforts of coupling EU electricity markets are discussed in this chapter. The last two chapters focus on
mechanisms in place to ensure the stability and functioning of the electricity system. Balancing measures, to        Balancing

ensure supply and demand is equal at all times, and Redispatch measures, to resolve congestion in the grid.

                                                                                                                     Redispatch

March-28-2019     Annual Market Update 2018                                                                         2
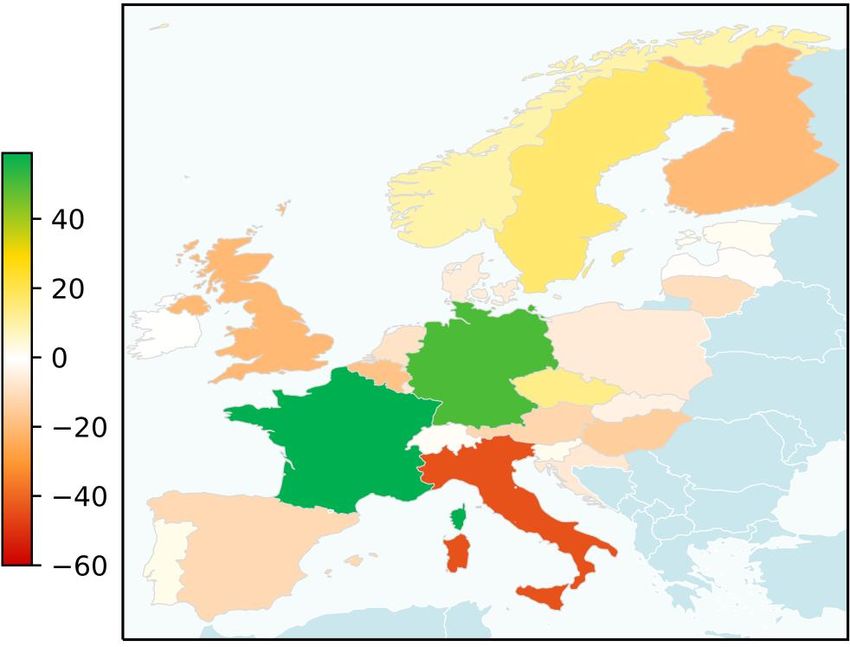
Annual Market Update 2018 - Electricity market insights - TenneT
Main findings (1/3)
Higher electricity prices across Europe in 2018. Prices                                                                Introduction

in NL increased faster than the CWE average.
                                                                                                                      Main findings
The year 2018 saw an increase in electricity prices across Europe. The average day-ahead electricity price in the
Netherlands rose by 33% to 50.7 €/MWh, a larger increase than on average in the Central Western European
                                                                                                                       Electricity
(CWE) region (+24%). Within the CWE region it can be seen that in previous years prices of the Netherlands and        market prices
Germany were close together, as well as prices of France and Belgium. In 2018, these combinations have
changed. The first half of 2018 showed prices of the Netherlands and Belgium closer together, as well as those of
                                                                                                                      Fuel prices &
Germany and France. In the last quarter of 2018, prices within the CWE region are diverging. Belgium                   generators

experienced high prices in the second half of 2018, due to unexpected nuclear outages.
                                                                                                                         Power
                                                                                                                      consumption
Electricity price increases across Europe are mainly explained by increases in natural gas, coal and carbon           & generation

emission allowance prices. Also, the summer drought affected prices, especially in countries that rely on hydro.
Carbon prices rose sharply in 2018, caused by a new phase of the Market Stability Reserve coming into force in        RES support
2019. Speculation on carbon allowances in the second half of 2018 is reflected in the prices for futures in this       schemes

period, that follow almost exactly the same trend. For Dutch generators gross margins on the wholesale market
remained healthy in 2018, whereas German generators saw their margins drop below zero in several months.                 Market
                                                                                                                       integration

A big event in 2018 was the German-Austrian bidding zone split on October 1st. In the three months after the split,
prices in Germany were on average 7.3 €/MWh lower than in Austria. Another event in 2018 was the go-live of the         Balancing
cross-border intraday trading platform XBID on June   12th.   The months after the go-live show increased cross-
border trade when compared to the same months of 2017. In general, the intraday market is becoming more
                                                                                                                       Redispatch
important, both in terms of volumes and amount of trades.
March-28-2019    Annual Market Update 2018                                                                            3
Annual Market Update 2018 - Electricity market insights - TenneT
Main findings (2/3)
Mostly solar in 2018 SDE+ spring round, in total SDE+                                                                 Introduction

awarded over 14 GW of RES. Imports in NL increased.
                                                                                                                     Main findings
No big changes in electricity consumption within the CWE region were seen in 2018. In the Netherlands, total
generation decreased and was replaced by an increased amount of imports. Natural gas remains the dominant
                                                                                                                      Electricity
source of electricity generation. Generation with renewables increased slightly, partly resulting from increased     market prices

renewable capacity, which was mainly solar.
                                                                                                                     Fuel prices &
In the 2018 spring round of the SDE+ subsidy scheme, the total of projects submitted undershoot the available         generators

budget for the first time in SDE+ history. In the autumn round, the total submitted budget exceeded the available
                                                                                                                        Power
budget again. At the time of writing, the budget allocation of the autumn round was still ongoing. Solar dominated   consumption
in the 2018 spring round, whereas a low amount of budget was allocated to onshore wind projects, caused by a         & generation

low number of applications. For offshore wind, only a small auction was held in 2018: the innovation parcel
Borssele V (19 MW). A new large-scale offshore auction is planned for 2019: “Hollandse Kust Zuid III & IV”. Up to    RES support
                                                                                                                      schemes
and including the 2018 spring round, over 14 GW of renewable electric capacity is (projected to be) installed
under SDE+ subsidy schemes, accounting for an annual generation of almost 35 TWh.
                                                                                                                        Market
                                                                                                                      integration
Physical net import and export positions in the CWE region remained relatively stable in 2018, but the
Netherlands took more often a net import position. The Netherlands receives most imports from Germany, and
exports mainly to Belgium. With the split of the German-Austrian bidding zone, the Austrian bidding zone has           Balancing

taken a net import position, with imports in the same order of magnitude as Belgium. The unavailability of nuclear
plants in Belgium in the second half of 2018 was resolved with an increased amount of imports from France.
                                                                                                                      Redispatch

March-28-2019    Annual Market Update 2018                                                                           4
Annual Market Update 2018 - Electricity market insights - TenneT
Main findings (3/3)
Larger imbalance volumes and higher balancing capacity                                                             Introduction

prices. Redispatch costs up in NL, slightly down in DE.
                                                                                                                  Main findings
Lastly, the Annual Market Update looked into two types of important system services: balancing and redispatch.

When looking at balancing services, more ISPs with larger imbalance volumes occurred in the Netherlands,           Electricity
                                                                                                                  market prices
which is an continuing trend since 2013. Whereas in previous years the Dutch imbalance volumes showed that
Dutch market participants tend to oversupply the system, the year 2018 showed a more symmetrical distribution
                                                                                                                  Fuel prices &
of ISPs with long and short imbalance volumes. This is also seen in the imbalance price delta, which became        generators

almost equal for long and short systems in 2018. Capacity prices for all balancing products increased in 2018,
                                                                                                                     Power
mostly caused by an increased amount of manual Frequency Restoration Reserves directly activated (mFRRda)         consumption
being contracted since January 2018 to comply with the EU Electricity Balancing Guideline, leading to a tighter   & generation

market for all balancing products.
                                                                                                                  RES support
Costs for congestion management in the Netherlands increased to €53 million in 2018 (+16%). Most costs were        schemes

related to redispatch, and a smaller share can be attributed to restriction contracts, which are contracts with
market parties to withhold a share of production for a certain period. Across the border in Germany, cost for        Market
                                                                                                                   integration
congestion management in 2018 were in the order of €1 billion. Costs decreased slightly (-5%) compared to
2017 because of more moderate weather conditions in 2018. The use of grid reserve in Germany decreased
significantly in the second half of 2018, since after the German-Austrian bidding zone split the Austrian grid      Balancing

reserve plants were not contracted anymore, and thus not available anymore.

                                                                                                                   Redispatch

March-28-2019    Annual Market Update 2018                                                                        5
Annual Market Update 2018 - Electricity market insights - TenneT
Market timeframes
The wholesale market consists of several markets                                                                        Introduction

                                          Market timeframe                                  Balancing
                                                                                                                        Main findings
                            > Day -1              Day -1          Intraday (ID)            Real-time (RT)

                          Forward and          Day-ahead            Intraday                                             Electricity
        Market                                                                                                          market prices
                         futures market         market               market

                                                                                      Participants avoid adverse
                                 Participants optimise their portfolio                                                  Fuel prices &
                                                                                  contributions to the system balance
        Market                                                                                                           generators
      Participants
                                                                                    Participants provide balancing
                                                                                                                           Power
                                                                                                energy                  consumption
                                                                                                                        & generation

                          TSO procures balancing reserves                          TSO activates balancing energy
          TSO                                                                                                           RES support
                                       TSO performs network security analyses                                            schemes
                                               & activates redispatch

                                                                                                                           Market
 • The figure above shows the relation between the different timeframes of the wholesale market and the                  integration
   balancing market. In wholesale markets, electricity generators sell electricity to large industrial consumers
   and electricity suppliers. The electricity suppliers sell electricity to the final consumer in retail markets. The
   scope of this Annual Market Update is on wholesale markets.                                                           Balancing
 • Important features of the electricity system are two types of system services: balancing and redispatch. TSOs
   procure balancing reserves that can be activated in real-time to resolve disruptions in system balance. Also,
   TSOs perform network security analyses to identify congestion, which is resolved by activating redispatch.            Redispatch

March-28-2019        Annual Market Update 2018                                                                          6
Day-ahead prices Europe
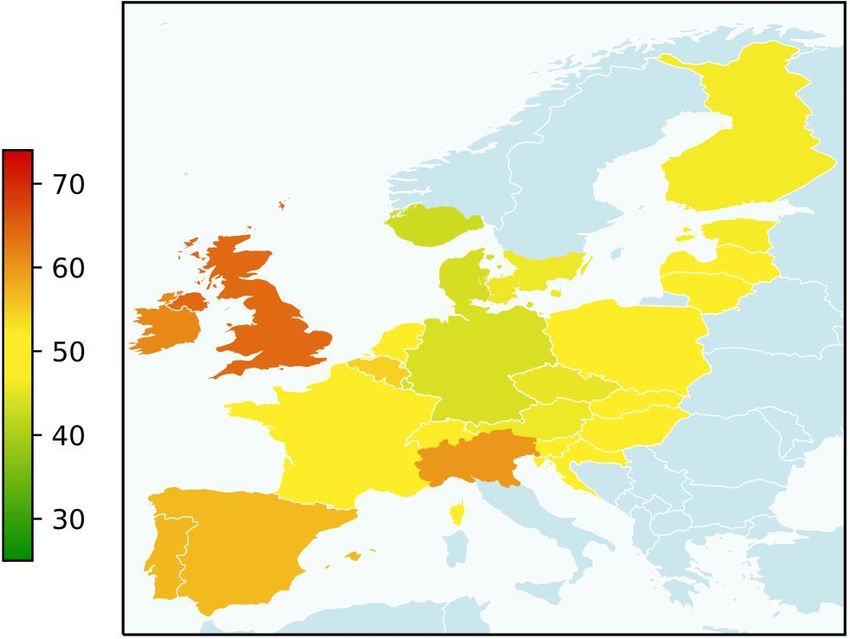
2018: increase of day-ahead prices across Europe                                                                    Introduction

Yearly Average Day-ahead Prices in Europe                                                                          Main findings
 2017                                                            2018

                                                                                                                    Electricity
                                                     €/MWh                                                         market prices

                                                                                                                   Fuel prices &
                                                                                                                    generators

                                                                                                                      Power
                                                                                                                   consumption
                                                                                                                   & generation

                                                                                                                   RES support
                                                                                                                    schemes

                                                                                                                      Market
                                                                                                                    integration
 • Almost all European countries saw an increase in day-ahead prices from 2017 to 2018.
 • While Nordic prices remain relatively low compared to other countries, the increase in day-ahead prices was
   relatively large. Also the Baltics saw a large price increase. This is possibly a result from the summer heat     Balancing
   wave in the Summer of 2018, leading to a hydro shortage Scandinavia and low wind generation.
 • Croatia was the only country that saw a price decrease in 2018 compared to 2017, due to the coupling with
   the Slovenian market. The lowest price increases are seen in Slovenia and Portugal (
Day-ahead prices CWE
DA prices in the Netherlands increased faster than the                                                                 Introduction

CWE region average
                                                                                                                      Main findings
                      Monthly Average Day-ahead Wholesale Prices in the CWE region
    100
                                  +21%                               +24%                                              Electricity
€/MWh                                                                                                                 market prices

                                                                                                     NL
     60
                                                                                                     BE               Fuel prices &
                                                                                                                       generators
                                                                                                     DE/AT*
     40
                                                                                                     DE*
                                                                                                                         Power
     20                                                                                              AT*              consumption
                                                                                                                      & generation
                                                                                                     FR
      0                                                                                              yearly average
          J F MAM J J A S O N D J F MAM J J A S O N D J F MAM J J A S O N D                                           RES support
                                                                                                                       schemes
                      2016                            2017                           2018

     * On October 1st, 2018 the German/Austrian bidding zone split into two seperate bidding zones
                                                                                                                         Market
                                                                                                                       integration
 • In the Netherlands, prices increased from 39.3 €/MWh to 52.5 €/MWh, an increase of 33%. This increase is
   larger than the CWE region average (24%, from 40.8 €/MWh in 2017 to 50.7 €/MWh in 2018).
 • Increasing yearly DA prices mostly due to increasing fuel- and emission allowance prices (see slide 16/17).          Balancing
 • Higher prices in winter months. Winter effect bigger in Belgium and France due to a large share of electric
   heating in France, and capacity shortage in Belgium due to unexpectedly high nuclear outages.
 • Relatively high prices in winter 2016/2017 due to cold spell.                                                       Redispatch

March-28-2019     Annual Market Update 2018          Source: MRC Market Coupling                                      8
Day-ahead prices DE & AT
 Large DA price spread between DE and AT on days                                                                                                                                        Introduction

 with high wind feed-in and low demand
                                                                                                                                                                                       Main findings

                  Daily Average Day-ahead Wholesale Prices in DE and AT (left) and Forecasted DE
                                  wind production (right) after bidding zone split
  100                                                                                                                                                                        1,500      Electricity
                                                                                                                                                                                       market prices

€/MWh                                                                                                                                                                        GWh/day

                                                                                                                                                                                       Fuel prices &
   60                                                                                                                                                                        900        generators

   40                                                                                                                                                                        600          Power
                                                                                                                                                                                       consumption
                                                                                                                                                                                       & generation
   20                                                                                                                                                                        300

    0                                                                                                                                                                        0
                                                                                               3-nov                                                                                   RES support
                                                        6-okt
        1-sep

                8-sep

                                                                13-okt

                                                                         20-okt

                                                                                     27-okt

                                                                                                       10-nov

                                                                                                                17-nov

                                                                                                                         24-nov

                                                                                                                                  1-dec

                                                                                                                                          8-dec
                        15-sep

                                 22-sep

                                          29-sep

                                                                                                                                                  15-dec

                                                                                                                                                           22-dec

                                                                                                                                                                    29-dec
                                                                                                                                                                                        schemes

                                                   DE           AT            DE/AT           Forecasted wind DE (right axis)
                                                                                                          1-
                                                                                                          ja
                                                                                                          n
                                                                                                                                                                                          Market
                                                                                                                                                                                        integration
  • After the split, low prices occur more often in the DE bidding zone. The average price of DE over October-
    December 2018 (52.6 €/MWh) is 7.3 €/MWh lower than the average price of AT in the same period (59.9
    €/MWh). The average spread is significantly larger than the 2-4 €/MWh spread that was seen in the public                                                                             Balancing
    market coupling simulations performed in the three months before the split.
  • The spread between DE and AT prices is moderately correlated with the combination of high wind feed-in and
    low demand, mainly causing the drops in DE prices.                                                                                                                                  Redispatch

 March-28-2019           Annual Market Update 2018                                Source: MRC Market Coupling, SMARD                                                                   9
Price volatility (1/2)
Increasing fuel prices led to increased price volatility                                                                                                                       Introduction

 Yearly boxplots of Day-ahead wholesale prices in selected European countries
                                                                                                                                                                              Main findings
         2017                                                                                             2018
   120                                                                                              120
              CWE                    Other                 Nordics                 95% quantile                CWE                  Other                    Nordics
€/MWh                                                                              75% quantile   €/MWh                                                                        Electricity
                                                                                                                                                                              market prices
                                                                                   Median
    80                                                                                               80
                                                                                   25% quantile
                                                                                                                                                                              Fuel prices &
                                                                                   5% quantile                                                                                 generators
    60                                                                                               60

                                                                                                                                                                                 Power
    40                                                                                               40                                                                       consumption
                                                                                                                                                                              & generation

    20                                                                                               20
                                                                                                                                                                              RES support
     0                                                                                                0                                                                        schemes

                                                                                                                                        GB

                                                                                                                                                       DK1
                                                                                                                              NL
                                                                                                                    AT

                                                                                                                                                             FI
                                                                                                                                                                  NO2
                                                                                                                                                                        SE4
                                                                                                                         FR
                                      GB

                                                                                                          BE

                                                                                                                                   CH
                                                     DK1

                                                                                                               DE
                           NL

                                                                                                                                             IT Nord
                                                                      SE4
                      FR

                                                           FI
                                                                NO2
         BE
              DE/AT

                                CH

                                           IT Nord

                                                                                                                                                                                 Market
                                                                                                                                                                               integration
 • Higher volatility in general in almost all countries and smaller differences in volatility between countries
   compared to 2017. Mostly due to higher DA prices in the second half of 2018 compared to the first half of
   2018.                                                                                                                                                                        Balancing
 • In 2017, price volatility of DE/AT and NL are close together, as well as price volatility of BE and FR. In 2018,
   the price volatility of CWE countries lies closer together, with relatively high upward volatility in BE due to
   unexpectedly high nuclear outages and a tight market.                                                                                                                       Redispatch

March-28-2019          Annual Market Update 2018                            Source: MRC Market Coupling                                                                       10
Price volatility (2/2)
Price volatility does not vary significantly in countries                                                                                                                         Introduction

with multiple bidding zones, except for Sicilia
                                                                                                                                                                                 Main findings
                                                                    Yearly Box Plot of selected European Countries
         140
                                                                           Day-ahead Wholesale Prices 2018
                                                  Italy                                         Denmark             Norway                      Sweden            95% quantile    Electricity
      €/MWh                                                                                                                                                                      market prices
                                                                                                                                                                  75% quantile

         100                                                                                                                                                      Median
                                                                                                                                                                                 Fuel prices &
          80                                                                                                                                                      25% quantile    generators

                                                                                                                                                                  5% quantile
          60
                                                                                                                                                                                    Power
                                                                                                                                                                                 consumption
          40                                                                                                                                                                     & generation

          20

           0                                                                                                                                                                     RES support
                                                                                                                                                                                  schemes
                                                                                                DK1

                                                                                                      DK2

                                                                                                            NO1

                                                                                                                  NO2

                                                                                                                        NO3

                                                                                                                              NO4

                                                                                                                                    NO5

                                                                                                                                          SE1

                                                                                                                                                SE2

                                                                                                                                                      SE3

                                                                                                                                                            SE4
                                              IT-North

                                                                                   IT-Sicilia
                                                         IT-South

                                                                     IT-Sardinia
                IT-C. North

                                IT-C. South

                                                                                                                                                                                    Market
                                                                                                                                                                                  integration
 • Price volatility is generally a little lower in bidding zones located centrally within their country.
 • The island Sicily is an exception in Italy with a high upward volatility. Day-ahead prices in Sicily are
   historically higher than in the rest of Italy, due to its isolated location, the dependency on fossil-powered                                                                   Balancing
   (mostly diesel) plants, and significant industrial demand (amongst others for desalinating seawater).
 • The SE4 bidding zone (southern Sweden) has relatively higher prices than the other Swedish bidding zones,
   due to high consumption and low renewable generation compared to the rest of the country.                                                                                      Redispatch

March-28-2019                 Annual Market Update 2018                                               Source: MRC Market Coupling                                                11
Futures prices NL & DE
 Futures price volatility in the second half of 2018 is                                                                          Introduction

 linked to volatility in carbon prices
                                                                                                                                Main findings
                      Dutch and German Base Load Year Futures Prices (left axis)
                          and Carbon Emission Allowance Prices (right axis)
   70                                                                                             70
                                                                                                                                 Electricity
                                                                                                                                market prices
€/MWh                                                                                             €/tCO2
                                                                                                                 NL 2018

   50                                                                                             50             NL 2019
                                                                                                                                Fuel prices &
                                                                                                                 NL 2020         generators
   40                                                                                             40
                                                                                                                 NL 2021
                                                                                                                                   Power
   30                                                                                             30             DE-AT 2018     consumption
                                                                                                                                & generation
                                                                                                                 DE 2019
   20                                                                                             20
                                                                                                                 DE 2020
                                                                                                                 DE 2021        RES support
   10                                                                                             10                             schemes
                                                                                                                 Carbon price
    0                                                                                             0
                   2016                          2017                          2018                                                Market
                                                                                                                                 integration
   • After reaching a record low in February 2016, futures prices have been steadily increasing.
   • Increases in future prices were relatively strong in 2018, because of increased carbon emission allowance-
     and fuel prices. Volatility in futures prices in the second half of 2018 is linked to volatility in carbon emission          Balancing
     allowance prices (see also slide 17).
   • The diverging futures prices show that market parties expect that the average price spread between the
     Netherlands and Germany will increase in the future.                                                                        Redispatch

 March-28-2019     Annual Market Update 2018        Source: EEX                                                                 12
Intraday prices
In 2018: larger differences between DA and ID prices                                                                                                                                                                                                              Introduction

and more hours with higher ID than DA prices
                                                                                                                                                                                                                                                                 Main findings
                                     Differences between Dutch Day-ahead (DA) and Intraday (ID) Prices
        1200

          h/a                                                                                                                                                                                                                                                     Electricity
                                                                                                                                                                                                                                                                 market prices

          800

                                                                                                                                                                                                                                                                 Fuel prices &
          600                                                                                                                                                                                                                                                     generators

          400
                                                                                                                                                                                                                                                                    Power
                                                                                                                                                                                                                                                                 consumption
                                                                                                                                                                                                                                                                 & generation
          200

            0
                                                                                                                                                                                                                                                                 RES support
                                                                                                                                 -4 to -2

                                                                                                                                                                                                                                                           >20
                                                                                                         -8 to -6

                                                                                                                      -6 to -4
                 DA DA > ID
                   2016                            2017                        2018
                                                                       Difference DA and ID prices                                                                                                                                                                  Market
                                                                                                                                                                                                                                                                  integration
    ID trade takes place in a continuous auction, so there is no single price per hour as in the DA market. Therefore, ID prices per hour
    have been determined by taking hourly average prices weighted on trading volumes.

 • Whereas in 2017 differences between DA and ID prices were similar to 2016, the results from 2018 show                                                                                                                                                           Balancing
   more hours with larger differences between DA and ID prices. Additionally, where the graphs from 2016 and
   2017 are skewed to the left, indicating more hours with higher ID prices than DA prices, the graph from 2018
   is skewed to the right, indicating more often higher DA prices than ID prices.                                                                                                                                                                                 Redispatch

March-28-2019          Annual Market Update 2018                                                                    Source: APX, MRC Market Coupling                                                                                                             13
Intraday trading volumes
Renewables growth and XBID go-live contributed to the                                                                Introduction

further increase of intraday market volumes
                                                                                                                    Main findings
                             Monthly Intraday Trading Volumes in the Netherlands
        300
                                                                                       XBID go-live                  Electricity
 GWh/month                                                                                                          market prices
                                                                             +49%
        200
                                         +63%                                                                       Fuel prices &
        150                                                                                                          generators

        100
                                                                                                                       Power
                                                                                                                    consumption
         50                                                                                                         & generation

          0
                J   F M A M J    J A S O N D J           F M A M J    J A S O N D J    F M A M J      J A S O N D   RES support
                                                                                                                     schemes
                              2016                                 2017                          2018

                                     Crossborder (GWh)        Spot (GWh)      Yearly average
                                                                                                                       Market
 • Significantly more ID volumes traded in 2017 (+63%) and 2018 (+49%). A possible explanation is the larger         integration

   share of variable renewables in generation. Market participants use the intraday market to optimise their
   position, since new information (better renewable feed-in forecasts, demand changes, unexpected outages,
   etc.) becomes available after closure of the DA market. More variable renewable generation thus leads to a         Balancing
   shift of trade closer to real-time.
 • Cross-border trade in Q4 2018 relatively high, probably due to the go-live of cross-border intraday trading
   platform XBID on June 12th, 2018.                                                                                 Redispatch

March-28-2019       Annual Market Update 2018        Source: APX                                                    14
Intraday trades
 Especially in terms of amount of trades, the ID market is                                                                                  Introduction

 increasing. Most ID trades for delivery in evening peak.
                                                                                                                                           Main findings

                                     Average amount of Intraday Trades per delivery hour
             70                                                                                                                             Electricity
                                                                                                                                           market prices
Number of trades

             50
                                                                                                                                           Fuel prices &
                                                                                                                                            generators
             40

             30                                                                                                                               Power
                                                                                                                                           consumption
                                                                                                                                           & generation
             20

             10
                                                                                                                                           RES support
                                                                                                                                            schemes
              0
                     1    2     3      4   5   6   7   8   9   10   11   12    13   14   15   16   17   18   19   20   21   22   23   24

              2016       2017       2018                       Delivery hour                                                                  Market
                                                                                                                                            integration

   • This figure shows for the average amount of trades pre delivery hour of the day.
   • In 2017 and 2018 there was a larger variability in the hours in which ID trades are made compared to 2016,                              Balancing
     probably because the amount of trades increased significantly, making the variability more clear.
   • ID trades are peaking in the evening, related to increases in electricity consumption in the evening hours.
   • Also a “night peak” around 5 am, probably due to ramp-up of generation units.                                                          Redispatch

 March-28-2019           Annual Market Update 2018         Source: APX, MRC Market Coupling                                                15
Fuel prices
Fuel prices have been increasing since 2016                                                                                        Introduction

                         Natural gas prices                                                    Hard Coal Prices
       30                                                                  14
                                                                                                +41%             +5%              Main findings
                                            +30%                   €/MWh.th
€/MWh.th
                            +22%
                                                                           10                                                      Electricity
       20                                                                                                                         market prices
                                                                            8
       15
                                                                            6                                                     Fuel prices &
                                                                                                                                   generators
       10
                                                                            4
        5                                                                                                                            Power
                                                                            2                                                     consumption
                                                                                                                                  & generation
        0                                                                   0
                  2016               2017             2018                         2016              2017              2018
                         Gas price          Yearly average                              Coal price          Yearly average
                                                                                                                                  RES support
                                                                                                                                   schemes
  Gas prices are based on OTC natural gas prices at the Dutch virtual       Coal prices are based on the over the counter API#2
  exchange Title Transfer Facility (TTF).                                   price index.
                                                                                                                                     Market
 • The average yearly gas price increased by 30% from 17.2 €/MWhth in 2017 to 22.3 €/MWhth in 2018. The                            integration

   increase was higher than from 2016 to 2017 (22%). Prices were volatile in spring 2018, caused by
   successive cold snaps leading to high gas demand, while stock levels were low as usual at the end of winter.
   Prices remained high during the rest of the year because of required injections to increase stocks levels.                      Balancing

 • Hard coal price increased from by 5% from 10.7 €/MWhth in 2017 to 11.2 €/MWhth in 2018. The increase was
   much lower than the year before (41%), mainly due to the drop in prices in spring 2018. Despite low
   temperatures in Europe, high stock levels lead to little spot demand                                                            Redispatch

March-28-2019       Annual Market Update 2018           Source: energate                                                          16
Carbon prices
Carbon prices have increased sharply in 2018                                                                    Introduction

                                      CO2 Emission Allowance prices
                                                                                                               Main findings
      30

  €/tCO2                                                                                                        Electricity
                                                                                                               market prices

      20
                                                                         +166%
                                                                                                               Fuel prices &
      15                                                                                                        generators

      10                               +9%                                                                        Power
                                                                                                               consumption
                                                                                                               & generation
       5

       0                                                                                                       RES support
                                                                                                                schemes
                       2016                             2017                            2018

                                            CO2 price        Yearly average
                                                                                                                  Market
                                                                                                                integration
 • Prices of EU Emission allowances (EUA) reached a 10-year record of 25.2 €/tCO2 on September 10, 2018
   and have remained relatively high ever since. The main reason for this development is a new phase in the
   EU Emission Trading Scheme: a Market Stability Reserve will come into force in January 2019 (see link for    Balancing
   more information), which will lead to cuts in EUAs.
 • The volatility in late Q3 and Q4 can be explained by speculation on EUA prices, fuelled by political
   uncertainty in the UK, statements on the coal phase out in Germany, and debate on carbon floor prices.       Redispatch

March-28-2019   Annual Market Update 2018     Source: energate                                                 17
Generator margins in NL
Despite rising carbon prices, margins for NL coal plants                                                                                        Introduction

improved. Overall healthy margins for NL generators.
                                                                                                                                               Main findings
                       Dutch Monthly Average Clean Dark Spread and Clean Spark Spread
    40

€/MWh                                                                                                                                           Electricity
                                                                                                                                               market prices

    20

    10                                                                                                                                         Fuel prices &
                                                                                                                                                generators
     0
                                                                                                                                                  Power
    -10                                                                                                                                        consumption
                                                                                                                                               & generation
    -20
          J   F M A M J         J   A S O N D         J   F M A M J         J   A S O N D         J   F M A M J          J   A S O N D
                            2016                                        2017                                        2018                       RES support
                                                                                                                                                schemes
                           Clean Dark Spread Base            Clean Spark Spread Base            Clean Spark Spread Peak
   Assumptions.
   Coal: efficiency 40%, emission factor 0.0917 tCO2/GJth, heating value 25.1 MJ/kg; Gas: efficiency 55%, emission factor 0.0556 tCO2/GJth,.
                                                                                                                                                  Market
 • In 2016 and 2017, gas generators for base- or peak load have had higher margins than coal generators in                                      integration

   the Netherlands. This trend is less apparent in 2018.
 • Despite rising carbon emission allowance prices hitting coal-fired generation harder than gas, coal margins
                                                                                                                                                Balancing
   improved in 2018. Electricity prices in the Netherlands are strongly influenced by gas fuel price
   developments, because gas-fired power plants most of the time set the electricity price in NL. These gas-
   fired power plants increased their bid prices in 2018 to compensate for higher fuel costs, which offset the cost
   increase for coal-fired power plants caused by carbon prices.                                                                                Redispatch

March-28-2019        Annual Market Update 2018              Source: energate, MRC Market Coupling                                              18
Generator margins in DE
Q2 2018: negative margins for German generators                                                                                                Introduction

                     German Monthly Average Clean Dark Spread and Clean Spark Spread
    40
                                                                                                                                              Main findings

€/MWh
                                                                                                                                               Electricity
                                                                                                                                              market prices
    20

    10                                                                                                                                        Fuel prices &
                                                                                                                                               generators

     0
                                                                                                                                                 Power
                                                                                                                                              consumption
    -10                                                                                                                                       & generation
          J   F M A M J         J   A S O N D         J   F M A M J         J   A S O N D         J   F M A M J           J   A S O N D
                            2016                                        2017                                        2018
                                                                                                                                              RES support
                           Clean Dark Spread Base            Clean Spark Spread Base            Clean Spark Spread Peak                        schemes

   Assumptions.
   Coal: efficiency 40%, emission factor 0.0917 tCO2/GJth; heating value 25.1 MJ/kg; Gas: efficiency 55%, emission factor 0.0556 tCO2/GJth.      Market
                                                                                                                                               integration
 • In Germany 2018 shows low margins both for coal and gas generators. Unlike the Netherlands, electricity
   generation in Germany is not gas-dominated, showing less spread between coal and gas generator margins.
 • In the first half of 2018, bullish coal and carbon prices pushed generator margins for the least efficient plants                           Balancing
   to record lows, while the share of renewables continued to increase.
 • In Q3 generator margins recovered due to higher prices caused by low summer wind and Belgian nuclear
   unavailability.                                                                                                                             Redispatch

March-28-2019        Annual Market Update 2018              Source: energate, MRC Market Coupling                                             19
Consumption in CWE
Average consumption in CWE, with a few exceptions                                                                                                           Introduction

TWh/month                Development of Monthly Electricity Consumption in the CWE Region
12                                                                                 12                                                                      Main findings
                        The Netherlands                                                                                  Belgium

10                                                                                 10
                                                                                                                                                            Electricity
                                                                                                                                                           market prices
 8                                                                                  8

 6                                                                                  6                                                                      Fuel prices &
                                                                                                                                                            generators
     J      F   M   A    M    J    J      A        S       O       N       D              J       F       M      A   M   J     J       A   S   O   N   D
60                                                                                 60
                        Germany                                                                                              France                           Power
                                                                                                                                                           consumption
                                                                                   50                                                                      & generation
50

40                                                                                 40                                                                      RES support
                                                                                                                                                            schemes
                                              30
30                                                                                 30
                                                       J       F       M       A   M      J       J       A  S O N             D
     J      F   M   A    M    J    J      A        S       O       N       D                  J       F    M A M J                 J   A   S   O   N   D
                                                                                                                                                              Market
                                                               2011-2016                2017              2018                                              integration

  • Electricity consumption of most countries in 2017 and 2018 remains within the 2011-2016 average, with a few
    exceptions, e.g. the Netherlands in spring months.
                                                                                                                                                            Balancing
  • Electricity consumption of the Netherlands and Belgium in 2018 higher than in 2017.
  • Electricity consumption of France is relatively high during cold periods and low in the summer, due to a large
    share of electric heating in heating demand.                                                                                                            Redispatch

March-28-2019       Annual Market Update 2018                      Source: ENTSO-E Power Statistics                                                        20
Capacity in the Netherlands
    Growth in renewable capacity mainly due to solar                                                                                                                Introduction

             Dutch operational                                     Dutch Mothballed                                 Changes (Δ2018-2017)                           Main findings
                 capacity                                              Capacity
    35                                                    10                                              2.0
                    30.4                31.0
                                                                                                                         1.5                                        Electricity
   GW                                                                                                     GW                                                       market prices
                                                         GW
    25                                                                                                    1.0

    20                                                     6                                                                                                       Fuel prices &
                                                                                                          0.5                             0.1                       generators
    15                                                                                                    0.0
                                                           4
                                                                     2.7               2.9                                                                            Power
    10                                                                                                    -0.5                                                     consumption
                                                           2                                                                                                       & generation
     5                                                                                                    -1.0
                                                                                                                         -0.9
     0                                                     0                                              -1.5                                                     RES support
                2017                    2018                         2017              2018                          Operational       Mothballed                   schemes
                    1
                    0
Nuclear   Lignite       Hard coal   Natural gas   Oil   Hydro   Biomass    Wind (onshore)    Wind (offshore)     Solar   Other     Minimum load     Maximum load
                                                                                     2017
                                                                                                                                                                      Market
                                                                                                                                                                    integration

      • Operational capacity increased by 1.5 GW, mainly due to added solar capacity (1.1 GW) and also due to
        added onshore wind capacity (0.4 GW).
      • Operational capacity decreased by 0.9 GW, mainly due to the mothballing of Moerdijk 1 and a single unit of                                                  Balancing

        the Eemscentrale power plant. Still, the mothballed capacity increased only by 0.1 GW as the additions were
        largely offset by the definite closure of the Claus-Centrale A which was previously mothballed.
                                                                                                                                                                    Redispatch

    March-28-2019              Annual Market Update 2018             Source: TenneT NL, CBS, Nationale Energieverkenning, ENTSO-E Power                            21
                                                                     Statistics
Capacity in Germany
    Growth of renewable capacity mainly due to wind                                                                                                                  Introduction

           German operational                                       German Reserve and
               capacity                                             Mothballed Capacity                                        Changes (Δ2018-2017)                 Main findings

   250                                                  10                                                         10          9.2
                                                                                           8.8
                                                                                                                   GW                                                Electricity
                    198                 204                       7.8                                                                                               market prices
   GW                                                   GW
                                                                                                                     6

   150                                                   6                                                           4
                                                                                                                                                                    Fuel prices &
                                                                                                                     2                                               generators
                                                                                                                                           1.1
   100                                                                                                                                                 0.0
                                                         4                                                           0
                                                                                3.1                      2.7
                                                                                                                                           0.0         -0.4            Power
                                                                                                                    -2                                              consumption
    50                                                   2                                                                                                          & generation
                                                                                                                    -4        -3.3
     0                                                   0                                                          -6
                2017                    2018                    Reserves Mothballed Reserves Mothballed                                                             RES support
                                                                                                                           Operational   Reserves   Mothballed       schemes
                                                                        2017                      2018
                    1
                    0
Nuclear   Lignite       Hard coal   Natural gas   Oil   Hydro     Biomass      Wind (onshore)    Wind (offshore)   Solar    Other    Minimum load    Maximum load
                                                                                         2017                                                                          Market
                                                                                                                                                                     integration
      • As in previous years, German conventional capacity decreased. A total of 3.3 GW fossil capacity was phased
        out of the market, whereas 0.9 GW gas entered. Renewable capacity increased by more than 8 GW in 2018,
        mainly due to added on- and offshore wind capacity.                                                                                                          Balancing
      • Reserve capacity increased with 1 GW to a total of almost 9 GW, mostly hard coal and gas fired.
      • Mothballed capacity decreased mainly due to the de-mothballing of the two 200 MW gas-fired Weisweiler
        units in Eschweiler-Weisweiler, Nordrhein-Westfalen.                                                                                                         Redispatch

    March-28-2019              Annual Market Update 2018                Source: Kraftwerksliste Bundesnetzagentur, ENTSO-E Power Statistics                         22
Generation & trade in NL
  Relatively little generation from coal in 2018                                                                                                Introduction

              Dutch Gross Electricity
                   Generation                                             Dutch Monthly Generation, Imports and Exports                        Main findings
                                                                12
     120
               97            98               94      TWh/month
TWh/year
                                                                 8                                                                              Electricity
      80                                                                                                                                       market prices
                                                                 6
      60                                                         4
                                                                                                                                               Fuel prices &
      40                                                         2
                                                                                                                                                generators

      20                                                         0
                                                                 -2                                                                               Power
       0                                                              J F M A M J         J A S O N D J F M A M J                J A S O N D
                                                                                                                                               consumption
                                                                                                                                               & generation
              2016          2017              2018
                                                                                      2017                                   2018
                                  Nuclear                 Waste                           Natural gas                     Wind
                                                          Uncategorised                   Net Import (+) / export (-)     Load + grid losses   RES support
                                  Hard coal
                                                                                                                                                schemes

     * Generation shown is electricity infeed measured on public grids: ¬82-85% of total NL generation. Uncategorised: units
Budget distribution SDE+
Total budget & share onshore wind in SDE+ decreased                                                                                   Introduction

                       Budget distribution per SDE+ round
       12
                                                                                                • A total of €5.3 billion was        Main findings

                                                                                                  submitted for the 2018 spring
                                                                                                  round (2018-I), undershooting
                                                                                                                                      Electricity
 billion €                                                                                        the available budget (€6           market prices
                                                                                                  billion) for the first time. The
                                                                                                  total allocated budget in the
        8                                                                                         2018-I round decreased to          Fuel prices &
                                                                                                  €3.6 billion, compared to €5.8      generators
                                                                                                  and €6.0 billion in 2017-I and
        6                                                                                         2017-II, respectively. Solar          Power
                                                                                                                                     consumption
                                                                                                  accounted for the largest          & generation
                                                                                                  share of allocated budget (€2.0
        4                                                                                         billion), followed by
                                                                                                  heat/gas/CHP (€1.4 billion).       RES support
                                                                                                • The share of onshore wind           schemes

        2                                                                                         was remarkably low in the
                                                                                                  2018-I round. However, a              Market
                                                                                                  considerable share (budget of       integration
        0                                                                                         €2 million) has applied for the
             2012    2013   2014     2015    2016-I 2016-II 2017-I 2017-II 2018-I 2018-II*        2018-II round*.
         Solar                         Onshore wind                      Biomass co-firing      • For offshore wind, there was        Balancing
         Hydro                         Heat/gas/CHP                      Rejected submissions     only a small tender in 2018:
         Available budget          * Results 2018-II not yet published                            the innovation parcel
                                                                                                  Borssele V (19 MW).                 Redispatch

March-28-2019        Annual Market Update 2018              Source: RVO                                                              24
Capacity & generation SDE+
SDE+ of ’17 and ’18 will lead to GWs of solar capacity                                                                                                                                            Introduction

                              Capacity                                                                                  Electricity Generation
                           per SDE+ round                                                                                  per SDE+ round                                                        Main findings
 4                                                                                                   5

                                                                                                 TWh/a                                                                                            Electricity
GW
                                                                                                                                                                                                 market prices

                                                                                                     3
 2
                                                                                                                                                                                                 Fuel prices &
                                                                                                     2                                                                                            generators

 1
                                                                                                                                                                                                    Power
                                                                                                     1
                                                                                                                                                                                                 consumption
                                                                                                                                                                                                 & generation

 0                                                                                                   0
             2013
      2012

                    2014

                             2015

                                    2016-I

                                                       2017-I

                                                                            2018-I
                                             2016-II

                                                                2017-II

                                                                                      2018-II*

                                                                                                                                       2016-I

                                                                                                                                                          2017-I

                                                                                                                                                                             2018-I
                                                                                                                                                2016-II

                                                                                                                                                                   2017-II
                                                                                                          2012

                                                                                                                 2013

                                                                                                                        2014

                                                                                                                                2015

                                                                                                                                                                                      2018-II*
                                                                                                                                                                                                 RES support
                                                                                                                                                                                                  schemes

                                                       Solar              Onshore wind              Biomass co-firing          Hydro

 * For 2018-II results are not yet published. Therefore, submitted capacity and generation is shown. These values will become lower when results                                                    Market
 are published, due to rejected projects.                                                                                                                                                         integration

 • In each round except 2015, the SDE+ budget allocation resulted in a majority of solar capacity.
 • A clear discrepancy is seen between awarded capacity and awarded electricity generation per SDE+ round.                                                                                        Balancing

   Even though the majority of capacity was awarded to solar in recent years, electricity generation from wind or
   biomass co-firing is higher. This can be attributed to the higher load factor of these technologies.
                                                                                                                                                                                                  Redispatch

March-28-2019              Annual Market Update 2018                                 Source: RVO                                                                                                 25
Cumulative capacity/generation
Over 14 GW renewable electricity capacity is (projected                                                                                         Introduction

to be) installed under SDE+ subsidy scheme
                                                                                                                                               Main findings
                End of Year Cumulative Capacity                                     End of Year Cumulative Electricity
 16
                   (to be) installed via SDE+                              35
                                                                                   Generation (to be) installed via SDE+
                                                                                                                                                Electricity
GW                                                                                                                                             market prices
                                                                      TWh/a
 12
                                                                           25
 10                                                                                                                                            Fuel prices &
                                                                           20                                                                   generators
  8
                                                                           15
  6                                                                                                                                               Power
                                                                           10                                                                  consumption
  4                                                                                                                                            & generation

  2                                                                         5

  0                                                                         0                                                                  RES support
                              2014
         2012

                   2013

                                      2015

                                             2016

                                                      2017

                                                              2018*

                                                                                   2012

                                                                                               2013

                                                                                                         2014

                                                                                                                 2015

                                                                                                                         2016

                                                                                                                                2017

                                                                                                                                       2018*
                                                                                                                                                schemes

 * Results 2018-II not included
 because they are not yet published           Solar    Onshore wind        Biomass co-firing          Hydro     Offshore wind                     Market
                                                                                                                                                integration
 • After 6.5 years of SDE+ subsidy schemes, over 14 GW of awarded capacity renewable solar, onshore wind,
   hydro, biomass co-firing is in operation or is planned to be installed.
 • This capacity is good for a yearly electricity generation of almost 35 TWh. With an annual consumption of 117                                Balancing
   TWh in 2018, renewable generation resulting from SDE+ subsidies would correspond to 30% of total annual
   consumption. The increasing trend of awarded electricity generation slowed in 2018 due to the large share of
   awarded solar capacity in the 2018-I round, and the fact that the results for the 2018-II are not yet published.                             Redispatch

March-28-2019             Annual Market Update 2018          Source: RVO                                                                       26
Aggregated exchange EU
Minor changes in net export positions in 2018                                                                        Introduction

Yearly Aggregated Physical Import and Export Volumes
 2017                                                            2018                                               Main findings

                                                    TWh/year
                                                    Net export                                                       Electricity
                                                                                                                    market prices

                                                                                                                    Fuel prices &
                                                                                                                     generators

                                                                                                                       Power
                                                                                                                    consumption
                                                                                                                    & generation

                                                                                                                    RES support
                                                                                                                     schemes
                                                    Net import

                                                                                                                       Market
 • The Netherlands is a net importing country. Net import increased from 3.8 TWh in 2017 to 8.2 TWh in 2018          integration
   (+118%). Germany is a net exporting country due to large capacity of wind and coal (low marginal costs). Net
   exports decreased from 55.4 TWh to 51.1 TWh (-8%). Germany and France are the largest exporting
   countries within the EU.                                                                                          Balancing
 • In 2018: France overtook Germany as largest exporting country. Switzerland changed from net importing to
   net exporting country. Lower export positions are seen for Norway and Sweden due to the summer drought
   and low hydro stocks.                                                                                             Redispatch

March-28-2019   Annual Market Update 2018     Source: ENTSO-E Power Statistics. See annex for volumes per country   27
Cross-border flows 2017
     Most Dutch imports are from DE and exports to BE                                                                                                   Introduction

Physical cross-border flows in CWE region in 2017
                                            to NO                                     SE
 Values in TWh/a                                             DK                                               • The Netherlands receives               Main findings

                                                                                                                most of its imports from
                                                                                                                Germany (15.1 TWh). This is
                                                                                                                                                        Electricity
                                                                                                                complemented by imports from           market prices
                                                                                                                Norway via NorNed (5.1 TWh)
UK                                                                                                              and Belgium (2.2 TWh). The
                                                                                                                majority of exports is going to        Fuel prices &
                                                                                                                Belgium (10.3 TWh), followed            generators
                                                                                                                by the UK (7 TWh).
                                             15.1 | 1.4
                        7 | 0.2
                                       NL
                                                                                                              • Germany’s main exports are to             Power
                                                                                      0 | 7.3                                                          consumption
                                                                                                       PL       Switzerland (19.3 TWh),                & generation
                                                                                                                Austria (19.2 TWh) and the
                                  BE                                                                            Netherlands (15.1 TWh). Total
                                                                  DE
                                                                                                                imports are much lower as              RES support
                                                                                                                                                        schemes
                                                                                                                Germany is a net exporting
                                                                                                CZ
                                            LU   6.1 | 1.3                  5.6 | 9                             country, but are mostly
                                                                                                                received from France (7 TWh),             Market
                                                                                                       SK       the Czech Republic (5.6 TWh)            integration
                                                     2.9 | 7                                                    and Denmark (5.3 TWh).
                                                                                           AT

                                                                                                      HU      • Note that this figure shows physical    Balancing
                   FR             6.4 | 8.4           CH                                                        flows between countries, which are
                                                                                                                different from scheduled
                                                                                           SI
                                                                                                                commercial exchanges between
                                                                  IT-NOR                                        bidding zones.                          Redispatch

     March-28-2019           Annual Market Update 2018                     Source: ENTSO-E Power Statistics                                            28
Cross-border flows 2018
     Belgian capacity shortage resolved by French imports                                                                                             Introduction

Physical cross-border flows in CWE region in 2018
                                           to NO
 Values in TWh/a                                           DK
                                                                                     SE                     • The unavailability of nuclear          Main findings
                                                                                                              plants in Belgium in the second
                                                                                                              half of 2018 was resolved with an
                                                                                                              increased amount of imports from        Electricity
                                                                                                              France.                                market prices

UK                                                                                                          • In 2018, exports from the
                                                                                                              Netherlands stayed relatively the
                                                                                                              same compared to 2017. Imports         Fuel prices &
                                                                                                                                                      generators
                                                                                                              from Germany increased
                                                                                                              significantly, partly due to the new
                                           20.9 | 0.7
                     6.7 | 0.2                                                                                interconnector Doetinchem –               Power
                                      NL                                                                                                             consumption
                                                                                     0 | 7.1                  Wesel that came into operation in
                                                                                                     PL                                              & generation
                                                                                                              the second half of 2018.
                                 BE
                                                                                                            • Imports from Norway decreased,
                                                                DE                                            due to a lower availability of the     RES support
                                                                                                              NorNed interconnector.                  schemes

                                               5.9 | 1.2                 4.9 | 7.6
                                                                                               CZ           • German exports to Austria, the
                                                                                                              Czech Republic and Switzerland
                                                                                                              decreased.                                Market
                                                                                                     SK                                               integration
                                                   2.5 | 11                                                     • For Austria, due to the split
                                                                                                                   of bidding zone DE-AT into
                                                                                          AT
                                                                                                                   DE and AT.
                                                                                                    HU                                                Balancing
                                                                                                                • For the Czech Republic and
                   FR            4.1 | 7.6          CH
                                                                                                                   Switzerland, because of
                                                                                          SI                       more often higher prices in
                                                                IT-NOR                                             Germany (see slides 33-34).        Redispatch

     March-28-2019         Annual Market Update 2018                     Source: ENTSO-E Power Statistics                                            29
Net positions CWE
New AT bidding zone has taken a net import position                                                                                             Introduction

                                                    Monthly average day-ahead net positions in CWE region                                      Main findings

                         12
                         GW                                                                                                                     Electricity
                                                                                                                                               market prices
                          8
                          6                                                                                                            AT
                                                                                                                                               Fuel prices &
                                                                                                                                       BE
 Importing | Exporting

                          4                                                                                                                     generators
                          2                                                                                                            DE

                          0                                                                                                            FR         Power
                                                                                                                                               consumption
                                                                                                                                       NL      & generation
                         -2
                                                                                                                                       DE-AT
                         -4
                         -6                                                                                                                    RES support
                                                                                                                                                schemes
                              J F M A M J       J A S O N D J F M A M J             J A S O N D J F M A M J              J A S O N D
                                             2016                                2017                                2018
                                                                                                                                                  Market
                              * Net positions represent the commercial net positions after the closure of the day-ahead market                  integration

    • Since the split of bidding zone DE-AT into DE and AT, internal DE-AT trades are now part of cross-border
      trade. The split positioned AT as a net importer. The export position of DE increased by the split.
                                                                                                                                                Balancing
    • More import of NL in 2018 (see slide 33-34) mainly due to high imports late spring/early summer (May-July).
    • FR exports mostly in summer, and not in winter when indigenous production is necessary to cover the
      (largely electric) domestic heat demand.                                                                                                  Redispatch

March-28-2019                           Annual Market Update 2018          Source: MRC Market Coupling                                         30
Price areas in CWE
Full price convergence low in Q2 and, when compared                                                                           Introduction

to 2017, high in Q4
                                                                                                                             Main findings
                     Monthly distribution of Day-ahead Price Areas in the CWE region
 100%
  90%
                                                                                                                              Electricity
  80%                                                                                                                        market prices

  70%
  60%
                                                                                                                             Fuel prices &
                                                                                                                         5    generators
  50%
                                                                                                                         4
  40%
                                                                                                                         3      Power
  30%                                                                                                                        consumption
                                                                                                                         2   & generation
  20%
                                                                                                                         1
  10%
   0%                                                                                                                        RES support
                                                                                                                              schemes
        J   F M A M J     J A S O N D J          F M A M J         J A S O N D J          F M A M J        J A S O N D
                      2016                                    2017                                       2018
                On October 1st, 2018 the German/Austrian bidding zone split into two seperate bidding zones                     Market
                                                                                                                              integration
 • The figure shows the time distribution of the number of day-ahead price areas in the CWE bidding zones.
   When there is one price area, full price convergence occurs (all bidding zones have the same price).
 • There was full price convergence (1 price area) for 33% of the time in 2018, a small decrease compared to                  Balancing
   the 34% in 2017. Full price convergence was relatively low in Q2 of 2018 compared to previous years.
   Contrarily full price convergence was relatively high in 2018 Q4, possibly due to introduction of the minimum
   Remaining Available Margin (minRAM) mechanism in CWE Flow-Based Market Coupling on 26/4/2018.                              Redispatch

March-28-2019    Annual Market Update 2018            Source: MRC Market Coupling                                            31
DA price convergence 2017
     2017: High convergence CWE & DE-DK                                                                                                Introduction

Day-ahead price convergence for selected countries in 2017
                                 to NO2                             SE
                                               DK
                                                                                             • Relatively high convergence for        Main findings
                                                                                               CWE countries and DE-DK.
                                                                                               Lower convergence between
                                                                                               CWE and other countries.                Electricity
                                                                                                                                      market prices
                                                                                             • Centrally located countries that
UK
                                                                                               are included in DA market
                                                                                               coupling have higher price
                                                                                                                                      Fuel prices &
                                                                                               convergence with each other.            generators
                                                                                             • For some bidding zone borders
              96% 0% 4%             46% 43% 11%
                            NL
                                                                  43% 5% 53%
                                                                                               there is inherently zero or low           Power
                           NL
                                                                                        PL     price convergence as:                  consumption
                                                                                                                                      & generation
                                                                                               • Grid losses are implicitly
                          BE
                                                                                                  included in market coupling
                                                    DE/AT                                         (e.g. NL-GB, NL-NO2)                RES support
                                                                                               • For explicit coupled borders,         schemes
                                                            42% 0% 58%   CZ                       the capacity auction price
                                                                                                  needs to be added to the DA
                                                                                                                                         Market
                                                                                                  prices (DE-PL, DE-CZ, AT-            integration
                                                                                        SK
                                   62% 35% 3%                                                     CZ, AT-HU, all CH borders).
                                                                                             Notes for figure:
                                                                              15% 0% 85%     • DA price convergence in white, black    Balancing
                                               79% 0% 21%                                      numbers show how often the DA price
                FR                        CH
                                                                                               was higher in that country.
                                                                                   HU
                                                                    SI
                                                                                             • Percentages do not always count up
                                                                                               to 100% due to rounding                 Redispatch
                                                IT-NOR
     March-28-2019   Annual Market Update 2018               Source: MRC Market Coupling                                              32
DA price convergence 2018
     2018: decreased DA price convergence on CWE borders                                                                                  Introduction

Day-ahead price convergence for selected countries in 2018
                                   to NO2                               SE
                                                 DK
                                                                                                • 2018: convergence decreased            Main findings
                                                                                                  on most CWE borders.
                                                                                                • BE prices more often higher
                                                                                                  than FR (+28 %pp), but more             Electricity
                                                                                                                                         market prices
UK
                                                                                                  often lower than NL (-6 %pp).
                                                                                                  FR prices were relatively lower
                                                                                                  in 2018 than in 2017, resulting        Fuel prices &
                                                                                                  to more BE imports from FR.             generators
                                                                                                  Same effect seen at GB-FR
              95% 0%   5%             59% 36% 4%
                                                                       30% 7% 63%
                                                                                                  border: more often higher                 Power
                             NL
                              NL
                                                                                           PL     prices in GB (+14 %pp).                consumption
                                                                                                                                         & generation
                                                                                                • Big increase in AT-SI
                            BE                                                                    convergence, due to AT having
                                                      DE
                                                                                                  higher prices after DE-AT              RES support
                                                                                                  bidding zone split.                     schemes
                                                            45% 0% 54%       CZ

                                                                                                Notes for figure:                           Market
                                                                                                                                          integration
                                     56% 35% 9%
                                                                                           SK   • DA price convergence in white, black
                                                                   *   AT                         numbers show how often the DA price
                                                                                                  was higher in that country.
                                                                                  32% 0% 68%    • Percentages do not always count up      Balancing
                                                      73% 0% 27%                                  to 100% due to rounding
                FR                          CH
                                                                                      HU        • * Values for DE-AT border based on
                                                                        SI
                                                                                                  October – December (after split).
                                                                                                                                          Redispatch
                                                  IT-NOR
     March-28-2019     Annual Market Update 2018              Source: MRC Market Coupling                                                33
Net imbalance volumes NL
Trend of larger imbalance volumes continues                                                                                                                                                                                                                                                                                                                                                      Introduction

      5,000
                                                                                                              Imbalance Volume Distribution in the Netherlands
                                                                                                                                                                                                                                                                                                                                                                                                Main findings

 No. of ISPs

                                                                                                                                                                                                                                                                                                                                                                                                 Electricity
      3,000                                                                                                                                                                                                                                                                                                                                                                                     market prices

      2,000
                                                                                                                                                                                                                                                                                                                                                                                                Fuel prices &
                                                                                                                                                                                                                                                                                                                                                                                                 generators
      1,000

                                                                                                                                                                                                                                                                                                                                                                                                   Power
          0                                                                                                                                                                                                                                                                                                                                                                                     consumption
                                                                                                                                                                                                                                                                                                                                                                                                & generation
                 150
                                                                                                                             -75 to -62.5

                                                                                                                                                           -50 to -37.5

                                                                                                                                                                          -37.5 to -25

                                                                                                                                                                                         -25 to -12.5
                                                                                              -100 to -87.5

                                                                                                                                                                                                                                                                                                               87.5 to 100
                                                                                                                                                                                                        -12.5 to 0
                         -150 to -137.5

                                           -137.5 to -125

                                                            -125 to -112.5

                                                                             -112.5 to -100

                                                                                                                                                                                                                                                                                                                             100 to 112.5

                                                                                                                                                                                                                                                                                                                                                           125 to 137.5
                                                                                                                                                                                                                                                                                                                                            112.5 to 125

                                                                                                                                                                                                                                                                                                                                                                          137.5 to 150
                                                                                                                                                                                                                     0 to 12.5
                                                                                                                                                                                                                                                                                                                                                                                                RES support
                                                                           < short long >                                                                                                                                                                                                                                                                                                        schemes

                    2016         2017          2018                    Imbalance cluster (MWh)
               ISPs with dual pricing not included (respectively 7.0%, 7.8% and 6.8% of total ISPs in 2016, 2017 and 2018).
                                                                                                                                                                                                                                                                                                                                                                                                   Market
                                                                                                                                                                                                                                                                                                                                                                                                 integration
 • This figure shows the total number of ISPs per year in which the net imbalance volume fell within a certain
   cluster of net imbalance volumes.
 • Since 2013, a continuing trend is seen: a decreasing number of ISPs with low net imbalance volumes and an                                                                                                                                                                                                                                                                                     Balancing
   increasing number of ISPs with high net imbalance volumes.
 • In previous years the graph skewed to the right, meaning that market participants tended to oversupply the
   system. In 2018, the graph is less skewed and more normally distributed.                                                                                                                                                                                                                                                                                                                      Redispatch

March-28-2019                             Annual Market Update 2018                                                                                                   Source: TenneT NL                                                                                                                                                                                                         34
Imbalance price delta NL
 Yearly average imbalance price delta of short and long                                                                                     Introduction

 system states almost equal in 2018
                                                                                                                                           Main findings
                                    Average Imbalance Price Delta in the Netherlands
   50

                                                                                                                                            Electricity
€/MWh
                                                                                                                                           market prices

   30
                                                                                                                                           Fuel prices &
   20                                                                                                                                       generators

   10                                                                                                                                         Power
                                                                                                                                           consumption
                                                                                                                                           & generation
    0
        J   F M A M J           J   A S O N D        J     F M A M J      J   A S O N D           J   F M A M J       J   A S O N D
                          2016                                        2017                                        2018                     RES support
                                                                                                                                            schemes
            Long system state         Short system state       Yearly average long system state        Yearly average short system state
        Note: ISPs with dual pricing not included (respectively 7.0%, 7.8% and 6.8% of total ISPs in 2016, 2017 and 2018). The imbalance
        price delta is calculated differently for a short systems state (imbalance price – DA price) and long system state (DA price –        Market
        imbalance price), as both systems require different incentives to stay balanced.                                                    integration

  • In previous years the average imbalance price delta of a short system state (imbalance shortage) was
    significantly higher than of a long system state (imbalance surplus). In 2018, the two are almost equal.
                                                                                                                                            Balancing
  • The converging of prices of short and long system states relates to the results from the previous slide, in
    which 2018 showed a more symmetrical distribution of short and long system state imbalance volumes.
    Apparently, the incentives to stay balanced in long and short system states have become more equal in 2018.
                                                                                                                                            Redispatch

March-28-2019        Annual Market Update 2018               Source: TenneT NL, MRC Market Coupling                                        35
Imbalance price delta spreads
Higher prices at higher imbalance volume clusters                                                                                                                                                           Introduction

                                                                     Spread of Dutch Imbalance Price Delta 2018
      400                                                                                                                                                                                                  Main findings
  €/MWh                                                                                                                                                                                     95% quantile

      300                                                                                                                                                                                   75% quantile
                                                                                                                                                                                                            Electricity
      250                                                                                                                                                                                   Median         market prices

      200
                                                                                                                                                                                            25% quantile
      150
                                                                                                                                                                                            5% quantile    Fuel prices &
      100                                                                                                                                                                                                   generators

       50
                                                                                                                                                                                                              Power
        0                                                                                                                                                                                                  consumption
                                                                                                                                                                                                           & generation
      -50

                                                                                                                                                           100 to 125

                                                                                                                                                                        125 to 150
                150
                         -150 to -125

                                        -125 to -100

                                                                                                    -25 to 0

                                                                                                               0 to 25
                                                                       -75 to -50

                                                                                    -50 to -25

                                                                                                                         25 to 50

                                                                                                                                    50 to 75
                                                                                                                                                                                                           RES support
                                                                                                                                                                                                            schemes
                                                                                                 < short       long >
                                                                                      Imbalance cluster (MWh)
                                                                                                                                                                                                              Market
                                                                                                                                                                                                            integration
 • The figure shows the spread or variability in imbalance price delta for certain imbalance clusters.
 • The spread is higher at larger imbalance volume clusters, which corresponds to the principle that the
   incentive to stay balanced or to help restore the system is larger with larger system imbalance volumes.                                                                                                 Balancing
 • As was the case last year (see TMR 2017), the imbalance price spread includes negative values in most
   imbalance clusters. This can be attributed to the depressing price effect of IGCC (cooperation between TSOs
   to exchange imbalance volumes in opposite directions).                                                                                                                                                   Redispatch

March-28-2019           Annual Market Update 2018                                                  Source: TenneT NL, MRC Market Coupling                                                                  36
FCR prices in the Netherlands
Larger differences between the Dutch and joint auctions                                                                 Introduction

                Frequency Containment Reserve (FCR) Capacity Prices in the Netherlands                                 Main findings
      30

                                                                                                                        Electricity
 €/MW/h
                                                                                                                       market prices

      20
                                                                                                                       Fuel prices &
                                                                                                                        generators
      15
                                                                                                                          Power
                                                                                                                       consumption
      10                                                                                                               & generation

       5
                                                                                                                       RES support
                                                                                                                        schemes

       0
                        2016                                 2017                             2018
                                             Dutch auction       Joint auction                                            Market
                                                                                                                        integration

 • Whereas in previous years the prices of the Dutch FCR auction and the joint auction are close together, the
   prices are diverging in 2018 with higher prices in the Dutch auction.
                                                                                                                        Balancing
 • Per January 2018 a higher amount of mFRRda capacity is procured in the Netherlands (see slide 39). This
   likely increased the value for capacity products for ancillary services in general, lifting the FCR prices in the
   Dutch auction above the FCR prices in the joint auction.
                                                                                                                        Redispatch

March-28-2019    Annual Market Update 2018       Source: Regelleistung.net                                             37
aFRR in the Netherlands
Higher prices for aFRR in 2018                                                                                                            Introduction

                Contracted Automatic Frequency Restoration Reserve (aFRR) Capacity Volumes
    600
                             (left axis) and Prices (right axis) in the Netherlands                                             12       Main findings

   MW                                                                                                                           €/MW/h
                                                                                                                                          Electricity
    400                                                                                                                         8        market prices

    300                                                                                                                         6
                                                                                                                                         Fuel prices &
    200                                                                                                                         4         generators

    100                                                                                                                         2           Power
                                                                                                                                         consumption
                                                                                                                                         & generation
      0                                                                                                                         0
          J   F M A M J       J A S O N D J          F M A M J         J A S O N D J         F M A M J        J A S O N D
                          2016                                      2017                                  2018                           RES support
                                                                                                                                          schemes
                                 Normal volume aFRR (symmetrical)          Additional volume aFRR (upward)         Price

      * The price (€/MW/h) for normal aFRR (symmetrical) is divided by two to enable comparison with additional aFRR (upward)
                                                                                                                                            Market
 • Since 2018, a fixed amount of capacity for aFRR and mFRRda (see next slide) combined is contracted,                                    integration

   instead of fixed amounts for aFRR and mFRRda products separately. Therefore, 2018 shows more variation
   in aFRR volumes. In January and February 2018, a shortage of offered upward FRR capacity led to the
   organisation of an additional tender. Both aFRR and mFRRda were allowed in this tender, and aFRR turned                                Balancing
   out to be the most economically attractive option.
 • aFRR prices were relatively high in 2018, mostly due to a tighter balancing market caused by increased
   amounts of contracted mFRRda (see next slide).                                                                                         Redispatch

March-28-2019       Annual Market Update 2018             Source: TenneT NL                                                              38
mFRRda in the Netherlands
 Higher prices for mFRRda in 2018                                                                                            Introduction

Manual Frequency Restoration Reserve directly activated (mFRRda)
Capacity Volumes (left axis) and Prices (right axis) in the Netherlands                 • For the balancing product         Main findings
900                                                                            9
MW                                                                             €/MW/h
                                                                                          mFRRda, upward and
700                                                                            7          downward capacity is
                                                                                                                             Electricity
600                                                                            6          contracted separately.            market prices
500                                                                            5        • The increase in contracted
400                                                                            4          mFRRda volumes is a direct
300                                                                            3
                                                                                          result from new requirements      Fuel prices &
200                                                                            2                                             generators
100                                                                            1
                                                                                          in the EU Electricity Balancing
  0                                                                            0          Guideline that came into force
      J F MAM J J A S O N D J F MAM J J A S O N D J F MAM J J A S O N D                   in 2018.                             Power
                                                                                                                            consumption
                2016                   2017                   2018                      • In 2016, downward mFRRda          & generation

900                                                                            9
                                                                                          was not yet contracted in the
MW                                                                             €/MW/h     Netherlands. In anticipation of
700                                                                            7          the EU Electricity Balancing      RES support
                                                                                                                             schemes
600                                                                            6          Guideline, TenneT started
500                                                                            5          contracting downward
400                                                                            4          mFRRda in 2017.                      Market
300                                                                            3        • The higher amounts of              integration
200                                                                            2          contracted volume has led to a
100                                                                            1
                                                                                          tighter market in 2018, and to
  0                                                                            0
                                                                                          increased prices for all           Balancing
      J F MAM J J A S O N D J F MAM J J A S O N D J F MAM J J A S O N D
                                                                                          balancing products.
                2016                   2017                   2018
           Volume mFRRda downward             Volume mFRRda upward         Price                                             Redispatch

March-28-2019          Annual Market Update 2018       Source: TenneT NL                                                    39
Redispatch volumes NL
Redispatch mostly required on critical branches                                                                                       Introduction

                                        Redispatch volumes in the Netherlands
       250                                                                                                                           Main findings

GWh/month
                                                                                                                                      Electricity
                                                                                                                                     market prices

       150

                                                                                                                                     Fuel prices &
       100                                                               +4%                                                          generators

        50                                                                                                                              Power
                                                                                                                                     consumption
                                                                                                                                     & generation

         0
                J   F   M     A    M    J   J     A    S     O   N   D    J    F      M    A    M   J   J      A    S    O   N   D
                                                                                                                                     RES support
                                        2017                                                        2018                              schemes

                    Critical branches           Other network elements             Yearly average           Yearly average
                                                                                                                                        Market
 • Critical branches are lines that are included in CWE flow-based market coupling, as they significantly impact                      integration
   and are impacted by CWE cross-border exchanges. Redispatch takes place to ensure that grid operation
   remains within operational security limits.
 • An increase in redispatch application is seen following the implementation of a 20% minimum remaining                              Balancing
   available margin (minRAM) in the CWE Flow-Based Market Coupling methodology on 26/4/2018.
 • Average redispatch volumes increased slightly in the Netherlands from 55.3 GWh/month in 2017 to 57.4
   GWh/month in 2018 (+4%)                                                                                                            Redispatch

March-28-2019       Annual Market Update 2018              Source: TenneT NL                                                         40
Redispatch costs NL
Costs for congestion management up in 2018                                                                                                           Introduction

                                       Redispatch and Restriction Costs in the Netherlands
     40
                                                     -28%                                                                                           Main findings

  mln. €

     30                                                                                                                                              Electricity
                                                                                                                                                    market prices
     25
                                                                                                 +16%
     20
                                                                                                                                                    Fuel prices &
                                                                                                                                                     generators
     15

     10                                                                                                                                                Power
                                                                                                                                                    consumption
       5                                                                                                                                            & generation

       0
              Q1          Q2           Q3       Q4          Q1         Q2          Q3         Q4         Q1          Q2          Q3        Q4
                                                                                                                                                    RES support
                                                                                                                                                     schemes
                               2016*                                        2017                                          2018
                                                            Total costs            Yearly average
     * For 2016, the distinction between redispatch and restriction costs was not available, and costs for 2016 are thus reported as total costs.
                                                                                                                                                       Market
 • This figure shows redispatch and restriction costs in the Netherlands. Restriction concerns contracts with                                        integration

   market parties to withhold a share of production for a certain period. Total costs increased from €46.1 million
   in 2017 to €53.3 million in 2018. Costs were significantly high in Q4 2016, mainly induced by high electricity
   generation volumes in the Netherlands and congestion issues in the Eemshaven, where almost all plants                                             Balancing
   were generating electricity to enable exports to Belgium and France. This has been largely resolved by a
   temporarily line between substations Eemshaven and Eemshaven Oudeschip. After a reduction of average
   costs in 2017 over 2016 (-28%), costs rose again in 2018 by 16%.                                                                                  Redispatch

March-28-2019        Annual Market Update 2018               Source: TenneT NL                                                                      41
Redispatch volumes DE
Congestion in the German grid mostly solved by                                                                                         Introduction

conventional redispatch + countertrade
                                                                                                                                      Main findings
                                              Redispatch Volumes in Germany
     12,000
                                                                                                                                       Electricity
GWh/quarter                                                                                                                           market prices

      8,000
                                                                                                                                      Fuel prices &
      6,000                                                                                                                            generators

      4,000                                                                                                                              Power
                                                                                                                                      consumption
                                                                                                                                      & generation
      2,000

          0
                                                                                                                                      RES support
                 Q1          Q2          Q3         Q4         Q1         Q2          Q3         Q4         Q1          Q2       Q3    schemes
                                  2016                                         2017                                   2018*

                                         Redispatch + countertrade      Netzreserve        EinsMan**                                     Market
     * For 2018 only costs for the first three quarters were available. ** EinsMan volumes exist only of downward adjustments.         integration

  • Conventional redispatch in combination with countertrade is the most common process used for solving
    congestion in the German grid.                                                                                                     Balancing
  • For the first three quarters of the 2018, the use of grid reserves decreased significantly compared with the
    first three quarters of 2017, especially because there were less congestion management measures required
    in Q1.                                                                                                                             Redispatch

March-28-2019         Annual Market Update 2018             Source: Bundesnetzagentur                                                 42
Redispatch costs DE
    Redispatch costs slightly down in Q1-Q3 2018                                                                                                  Introduction

                             Redispatch Costs in Germany
         600
                                                                                                           • In 2017 total redispatch costs      Main findings

                                                                                                             amounted to €1,511 million, of
mln.€/quarter                                                                                                which €999 million in the first
                                                                                                                                                  Electricity
                                                                                                             three quarters of the year. Costs   market prices
                                                                                                             in the first three quarters of
         400                                                                                                 2018 amounted to €826 million.
                                                                                                             Redispatch costs decreased in       Fuel prices &
                                                                                                             2018 compared to the first three     generators
         300                                                                                                 quarters of 2017.
                                                                                                           • The year 2017 saw high                 Power
                                                                                                                                                 consumption
         200
                                                                                                             redispatch costs, fueled by a       & generation
                                                                                                             cold winter and high wind feed-
                                                                                                             in because of stormy weather.
         100                                                                                                 2018 had more moderate              RES support
                                                                                                                                                  schemes
                                                                                                             weather conditions, but an
                                                                                                             increased share of renewables.
           0                                                                                               • Redispatch costs are higher in         Market
                 Q1      Q2     Q3      Q4     Q1      Q2     Q3      Q4     Q1      Q2     Q3
                                                                                                             winter months, due to generally      integration

                             2016                         2017                     2018*                     more stressed grid conditions.
                Redispatch                   Countertrade**                Netzreserve**                   • When compared to the previous
                EinsMan                      Yearly average                                                  slide, redispatch measures           Balancing

                                                                                                             show the lowest costs per GWh,
       * For 2018 only costs for the first three quarters were available. ** Countertrade costs for 2016
       and Netzreserve costs for all years were given as yearly aggregated values. Therefore, costs          and EinsMan the highest.
       have been equally divided over the four quarters.                                                                                          Redispatch

    March-28-2019          Annual Market Update 2018               Source: Bundesnetzagentur                                                     43
Annex (1/3)
           Day-ahead Day-ahead Day-ahead Day-ahead                                                     Net export Net export
           average    average    median     median     Physical    Physical    Physical    Physical    position   position
           price 2017 price 2018 price 2017 price 2018 import 2017 import 2018 export 2017 export 2018 2017       2018
           €/MWh     €/MWh    €/MWh    €/MWh    TWh/year TWh/year TWh/year TWh/year TWh/year TWh/year
AT              34.2     46.3     33.8     46.5      31.0     29.4     23.3     19.0     -7.7   -10.4
BE              44.6     55.3     39.4     52.6      14.2     21.6      8.2      4.3     -6.0   -17.4
CH              45.9     52.2     41.2     51.4      36.0     30.3     30.0     31.6     -6.0      1.3
CZ              36.5     46.0     35.0     46.1      15.1     11.6     28.1     25.5     13.0     13.9
DE              34.2     44.5     33.8     45.1      28.1     31.5     83.4     82.6     55.4     51.1
DE-AT           34.2     41.7     33.8     36.4   #N/A     #N/A     #N/A     #N/A     #N/A     #N/A
DK1             30.1     44.1     30.1     44.2
                                                      15.3     15.6     10.6     10.4     -4.7     -5.2
DK2             32.0     46.2     30.6     45.5
EE              33.2     47.1     30.8     46.2       2.3      3.4      5.1      5.2      2.7      1.7
ES              52.2     57.3     51.0     60.0      23.8     24.0     14.6     12.9     -9.2   -11.1
FI              33.2     46.8     30.8     46.1      22.6     23.4      2.1      3.4   -20.4    -20.0
FR              45.0     50.2     40.1     49.9      21.1     13.4     60.8     76.0     39.6     62.6
GB              51.7     64.9     49.8     63.0      19.8     22.7      3.5      2.2   -16.3    -20.5
HR              60.0     52.0     47.8     51.8      12.2     12.7      4.8      6.5     -7.4     -6.2
HU              50.4     51.0     46.4     50.1      19.8     18.6      6.9      4.3   -12.9    -14.3
IE              45.7     61.9     42.1     58.9       1.1      1.6      1.8      1.6      0.7      0.0
IT-CNOR         54.1     61.1     50.0     60.8
IT-CSUD         51.6     60.9     48.8     61.0
IT-NOR          54.4     60.7     50.0     60.4
                                                      42.9     47.1      5.2      3.2   -37.8    -43.9
IT-SARD         51.5     60.7     48.8     60.9
IT-SICI         60.9     69.5     56.6     63.8
IT-SUD          49.8     59.4     48.2     60.1

March-28-2019    Annual Market Update 2018     Source: MRC Market Coupling, ENTSO-E Power Statistics                  44
Annex (2/3)
           Day-ahead Day-ahead Day-ahead Day-ahead                                                     Net export Net export
           average    average    median     median     Physical    Physical    Physical    Physical    position   position
           price 2017 price 2018 price 2017 price 2018 import 2017 import 2018 export 2017 export 2018 2017       2018
           €/MWh    €/MWh    €/MWh    €/MWh    TWh/year TWh/year TWh/year TWh/year TWh/year TWh/year
LT             35.1     50.0     31.8     47.9      11.9     12.8      3.2      3.2     -8.7     -9.6
LV             34.7     49.9     31.7     48.0       4.1      5.1      4.1      4.3      0.1     -0.8
NL             39.3     52.5     36.9     50.9      22.5     26.8     18.8     18.6     -3.8     -8.2
NO1            29.0     43.7     29.0     43.9
NO2            28.8     43.2     28.9     43.6
NO3            29.5     44.1     29.1     44.9        5.9      8.1     20.7     18.0    14.8       9.9
NO4            25.7     43.7     25.0     44.7
NO5            28.8     43.0     29.0     43.7
PL             36.7     52.0     34.4     48.9      13.3     13.8     11.0      8.1     -2.3     -5.7
PT             52.5     57.5     51.1     60.0       5.5      5.7      8.2      8.3      2.7      2.7
SE1            30.8     44.2     30.0     44.8
SE2            30.8     44.2     30.0     44.8
                                                     13.8     14.2     33.0     31.6    19.2     17.3
SE3            31.2     44.5     30.0     44.9
SE4            32.2     46.4     30.2     45.4
SI             49.5     51.2     47.0     50.6       9.1      8.9      9.6      9.3      0.4      0.4
SK             40.9     48.5     36.5     47.4      15.6     12.5     12.5      8.7     -3.0     -3.8

March-28-2019    Annual Market Update 2018     Source: MRC Market Coupling, ENTSO-E Power Statistics                  45
You can also read