Genomic Profiling of the Steroidogenic Acute Regulatory Protein in Breast Cancer: In Silico Assessments and a Mechanistic Perspective - MDPI
←
→
Page content transcription
If your browser does not render page correctly, please read the page content below
cancers
Article
Genomic Profiling of the Steroidogenic Acute
Regulatory Protein in Breast Cancer: In Silico
Assessments and a Mechanistic Perspective
Pulak R. Manna 1, *, Ahsen U. Ahmed 1 , Shengping Yang 2 , Madhusudhanan Narasimhan 3 ,
Joëlle Cohen-Tannoudji 4 , Andrzej T. Slominski 5,6 and Kevin Pruitt 1
 1   Departments of Immunology and Molecular Microbiology, School of Medicine, Texas Tech University Health
     Sciences Center, Lubbock, TX 79430, USA; ahsen.ahmed@ttuhsc.edu (A.U.A.); kevin.pruitt@ttuhsc.edu (K.P.)
 2   Internal Medicine, School of Medicine, Texas Tech University Health Sciences Center, Lubbock, TX 79430,
     USA; shengping.yang@ttuhsc.edu
 3   Pharmacology and Neuroscience, School of Medicine, Texas Tech University Health Sciences Center,
     Lubbock, TX 79430, USA; madhu.narasimhan@ttuhsc.edu
 4   Physiologie de l’axe gonadotrope U1133, Institut National de la Santé et de la Recherche Médicale, CNRS,
     Biologie Fonctionnelle et Adaptative UMR 8251, Université Paris Diderot, 75205 Paris, France;
     tannoudji@univ-paris-diderot.fr
 5   Department of Dermatology and Laboratory Medicine, Comprehensive Cancer Center, Cancer
     Chemoprevention Program, University of Alabama at Birmingham, Birmingham, AL 35294, USA;
     aslominski@uabmc.edu
 6   Veterans Administration Medical Center, Birmingham, AL 35294, USA
 *   Correspondence: pulak.manna@ttuhsc.edu; Tel.: +1-806-743-3542; Fax: +1-806-743-2334

 Received: 18 April 2019; Accepted: 30 April 2019; Published: 4 May 2019

 Abstract: Cancer is a multifactorial condition with aberrant growth of cells. A substantial number of
 cancers, breast in particular, are hormone sensitive and evolve due to malfunction in the steroidogenic
 machinery. Breast cancer, one of the most prevalent form of cancers in women, is primarily stimulated
 by estrogens. Steroid hormones are made from cholesterol, and regulation of steroid/estrogen
 biosynthesis is essentially influenced by the steroidogenic acute regulatory (StAR) protein. Although
 the impact of StAR in breast cancer remains a mystery, we recently reported that StAR protein is
 abundantly expressed in hormone sensitive breast cancer, but not in its non-cancerous counterpart.
 Herein, we analyzed genomic profiles, hormone receptor expression, mutation, and survival for
 StAR and steroidogenic enzyme genes in a variety of hormone sensitive cancers. These profiles were
 specifically assessed in breast cancer, exploiting The Cancer Genome Atlas (TCGA) datasets. Whereas
 StAR and key steroidogenic enzyme genes evaluated (CYP11A1, HSD3B, CYP17A1, CYP19A1, and
 HSD17B) were altered to varying levels in these hormone responsive cancers, amplification of the StAR
 gene was correlated with poor overall survival of patients afflicted with breast cancer. Amplification
 of the StAR gene and its correlation to survival was also verified in a number of breast cancer studies.
 Additionally, TCGA breast cancer tumors associated with aberrant high expression of StAR mRNA
 were found to be an unfavorable risk factor for survival of patients with breast cancer. Further
 analyses of tumors, nodal status, and metastases of breast cancer tumors expressing StAR mRNA
 displayed cancer deaths in stage specific manners. The majority of these tumors were found to
 express estrogen and progesterone receptors, signifying a link between StAR and luminal subtype
 breast cancer. Collectively, analyses of genomic and molecular profiles of key steroidogenic factors
 provide novel insights that StAR plays an important role in the biologic behavior and/or pathogenesis
 of hormone sensitive breast cancer.

 Keywords: hormone sensitive cancers; breast cancer; StAR; estrogen; steroidogenic enzymes

Cancers 2019, 11, 623; doi:10.3390/cancers11050623                              www.mdpi.com/journal/cancers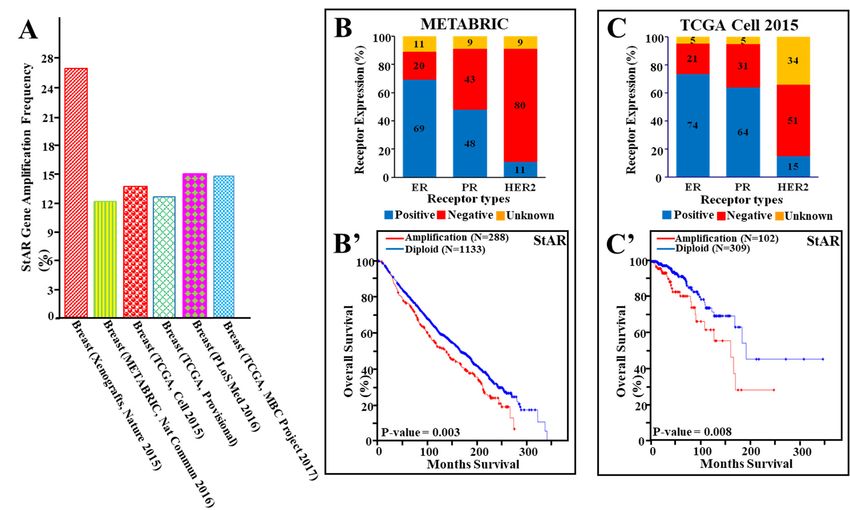
Cancers 2019, 11, 623                                                                                 2 of 16

1. Introduction
      The rate-limiting step in the regulation of steroid hormone biosynthesis is the transport of the
substrate of all steroid hormones, cholesterol, from the outer to the inner mitochondrial membrane,
a process that is predominantly mediated by the steroidogenic acute regulatory (StAR; also called
STARD1) protein [1–4]. There is wealth of information that regulation of steroid biosynthesis is
mediated by mechanisms that enhance the transcription, translation, or activity of StAR [2,4–6].
Noteworthy, whereas phosphorylation of StAR is associated with the optimal cholesterol transferring
ability of the StAR protein in steroid biosynthesis, mutations in the StAR gene results in a protein that is
nonfunctional and inactive in transporting cholesterol. In almost every system studied, agents/factors
that influence StAR expression also influence steroid biosynthesis through endocrine, autocrine,
and paracrine regulation in a variety of classical and non-classical steroidogenic tissues [2,4,7–11].
Following the transport of cholesterol, by StAR, to the inner mitochondrial membrane, the P450 side
chain cleavage (P450scc) enzyme, encoded by the CYP11A1 gene, catalyzes the first enzymatic step
in steroidogenesis i.e., the conversion of cholesterol to pregnenolone [4,6]. In addition, CYP11A1
converts 7-dehydrocholesterol to 7-dehydropregneolone and activates vitamin D, emphasizing the
importance of StAR to transport other substrates for non-canonical activity of CYP11A1 [12,13]. The
first steroid, pregnenolone, is then metabolized to various sex steroids by a series of enzymes in target
tissues. These enzymes include 3β-hydroxysteroid dehydrogenase (3β-HSD), 17α-monooxygenase,
17α-hydroxylase, 17,20-lyase (P45017α), aromatase, and 17β-HSD, which are encoded by the HSD3B,
CYP17A1, CYP19A1, and HSD17B genes, respectively [4,8].
      Steroid hormones are synthesized not only in endocrine tissues, but also in a variety of
extra-gonadal/adrenal tissues, and they play crucial roles in diverse processes, ranging from
development to homeostasis to carcinogenesis [4,10,11,14–16]. Of note, StAR mediates steroid
biosynthesis by controlling the transport of cholesterol and, thus, its entry to the mitochondrial
inner membrane is a key event in influencing various cholesterol/steroid led functions. Conversely,
inappropriate regulation of StAR, involving cholesterol transport, might influence hormone dependent
disorders. Accordingly, cholesterol and its metabolites have been shown to be involved in the etiology
of a number of cancers [17,18]. Moreover, dysregulation of androgen and estrogen biosynthesis has
long been implicated in the pathogenesis a variety of hormone sensitive cancers [16,19].
      One of the most common malignancies in women is breast cancer, which is activated by estrogens,
especially 17β-estradiol (E2), and it accounts for over one-fourth of all cancer cases [16,20–22]. The
American Cancer Society estimated that 266,120 women were expected to be diagnosed with invasive
breast cancer, with 40,920 deaths in 2018. Breast cancers are classified into four subtypes, i.e., luminal A,
luminal B, HER2/ErbB2+ (human epidermal growth factor receptor 2/the erythroblastosis oncogene-B2
positive), and TNBC (triple negative breast cancer), based on estrogen receptor (ER), progesterone
receptor (PR), and HER2 expression [23]. Hormone sensitive breast cancers predominantly express ER,
especially ERα, and/or PR, and account for ~80% of all breast cancer cases. The remaining 15–20%
cancers include HER2+ that expresses HER2, and TNBC that does not express ER, PR, and HER2 [24,25].
In this connection, it is worth noting that expression of the StAR protein has been shown to be markedly
high in ER+/PR+ breast cancer, modest in TNBC, but little to none in normal mammary epithelial
cells [5]. Additionally, accumulation of E2 mirrored StAR protein expression in both noncancerous
and cancerous breast cell lines, suggesting that StAR plays a key role in the development of ER+/PR+
breast cancer. To obtain more insight into the association of StAR in breast cancer, genomic profiling of
StAR and key steroidogenic enzyme genes were analyzed by exploiting two publicly available research
databases: The Cancer Genome Atlas (TCGA, provisional for different cancer types) and cBioPortal
(for independent breast cancer studies).
Cancers 2019, 11, 623                                                                            3 of 16

2. Materials and Methods

2.1. TCGA Hormone Responsive Cancer Tumors and Their Correlation to Copy Number Alterations of StAR
and Steroidogenic Enzyme Genes
     TCGA genomic research databases were assessed for the following hormone sensitive cancers:
breast (1080 tumors), colorectal (616 tumors), melanoma (367 tumors), ovarian (579 tumors), pancreatic
(184 tumors), prostate (492 tumors), and uterine endometrial (539 tumors) [26–29]. These tumors
were analyzed for DNA copy number alterations (CNAs) for StAR and key steroidogenic enzyme
genes using the GISTIC 2.0. algorithm. CNA data were categorized as high-level amplification (+2
copies), gain (+1 copy), diploid (normal/no change), homozygous deletion (−2 copies), and hemizygous
deletion (−1 copy). These analyses were performed using UCSC Xena [30] and/or cBioPortal Cancer
Genomics [31,32] platforms. StAR CNA data were further evaluated for their correlation to StAR
mRNA expression with RNA-Seq data, using the RSEM algorithm [33]. The correlation between StAR
CNA and StAR mRNA levels was verified by Spearman’s rank coefficient analysis.

2.2. Expression of ER, PR, and HER2 in Breast Cancer Tumors
      The predictive immunohistochemical (IHC) markers, employed in clinical settings to classify
breast cancer tumors into biologically distinct subtypes with unique pathogenesis, were examined. The
use of IHC to assess ER, PR, and HER2 expression status in breast cancer has been routinely performed
in clinics. IHC based tumor classification was analyzed for ER, PR, and HER2 expression using TCGA
breast cancer datasets. These receptors were also evaluated in a number of breast cancer publications
and/or projects that are available in cBioPortal website [31,32].

2.3. Amplification of the StAR Gene in Breast Cancer Studies
     Amplification of the StAR gene was assessed in a variety of breast cancer publications/projects
with cBioPortal browser. In particular, StAR gene amplification was analyzed in the following breast
cancer studies: METABRIC (Molecular Taxonomy of Breast Cancer International Consortium), Nature
Communication [34], (2173 tumors); breast cancer patient xenografts [35], (29 tumors); breast invasive
carcinoma [36], (TCGA Cell 2015, 816 tumors); breast invasive carcinoma, [27], (TCGA Provisional;
Nature 2012, 1080 tumors); metastatic breast cancer, PLoS Medicine [37], (216 tumors); and metastatic
breast cancer (MBC) project (TCGA 2017, 103 tumors). These studies include mixed tumor types with
variable numbers, in which amplification of the StAR gene and its correlation to overall survival, were
evaluated, using available datasets.

2.4. Mutational Portraits of the StAR Gene in TCGA Hormone Responsive Cancers
     Mutation in the StAR gene was examined in different hormone responsive cancers by analyzing
exome sequencing, utilizing TCGA datasets. Mutational analyses were limited for functional forms.
Intronic, silent, or other forms of mutations were not considered. These analyses were performed
using UCSC Xena platform [30]. Gene mutation frequency is described as a percentage of total number
of tumors.

2.5. Expression of StAR mRNA in TCGA Breast Cancer Tumors and Their Correlation to TNM Stages
     Expression of StAR mRNA, evaluated from RNA-Seq data, available for breast cancer tumors,
was downloaded from TCGA and UCSC Xena websites. StAR mRNA expressed as upper
quartile-normalized fragments per kilobase of transcript per million mapped reads (fpkm+uq+1),
generated by TCGA, was plotted using the Box and Whisker plot [38]. The Box and Whisker plot depicts
normal distribution of StAR mRNA and determines the median and quartiles in a statistical population.
     The T (tumor), N (node), and M (metastasis) staging, is a globally recognized system for defining
the extent of stage and/or spread of solid tumors for prognosis and treatment [39,40]. The TNM staging
of TCGA breast cancer tumors, expressing StAR mRNA, was performed using the American Joint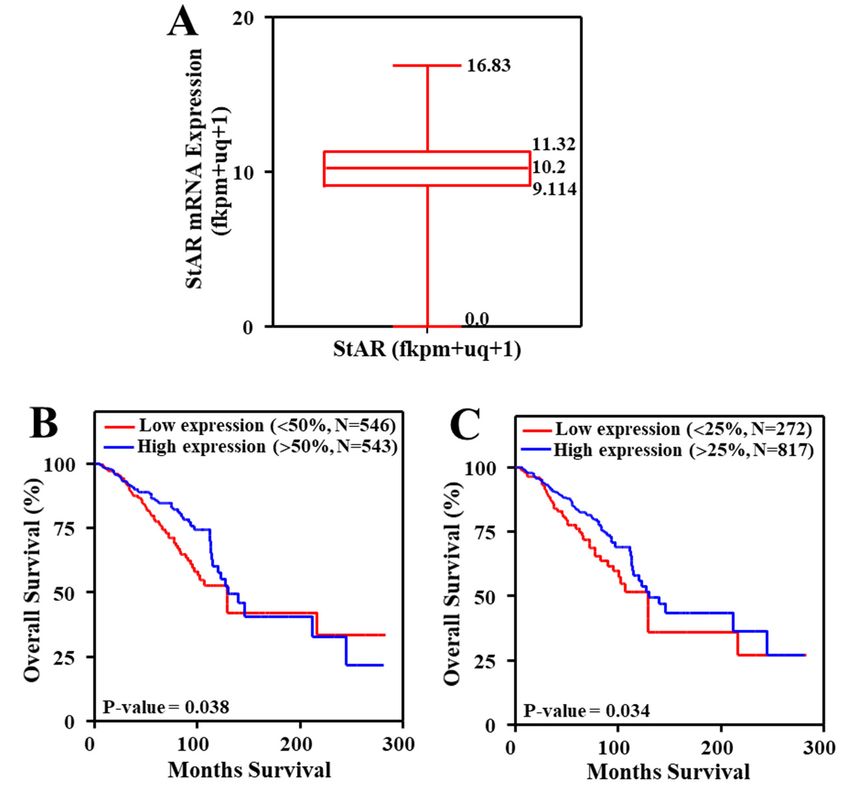
Cancers 2019, 11, 623                                                                           4 of 16

Committee on cancer classifications [39,40]. StAR mRNA/RNA-Seq data analyzed for various purposes
are provided as an Excel file under Supplemental Materials.

2.6. Generation of Kaplan-Meier Curves and Overall Survival Analyses
     Kaplan-Meier curve is frequently used to determine survival analysis for clinical outcomes such
as recovery rates, probability of death, and disappearance of a tumor [41]. Utilizing TCGA and/or
cBioportal breast cancer tumor CNA data, Kaplan-Meier survival curves were generated using with
(high level amplification) and without (diploid) amplification [42–44] for StAR, CYP11A1, HSD3B1,
CYP17A1, CYP19A1, HSD17B1, and HSD17B2 genes. For StAR, survival curve was also generated
with and without (all tumors excluding homozygous deletion) amplification. Both HSD17B1 and
HSD17B2 gene isoforms evaluated were based on their association with breast cancer [45]. Additionally,
Kaplan-Meier survival curves were generated by dividing tumors into non-overlapping upper and
lower groups based on two reports, with StAR mRNA values up to 50th percentile as low and above
50th as high [46]; and up to 25th percentile as low and above 25th percentile as high [47,48].

2.7. Statistical Analysis
      Statistical analyses were performed using GraphPad Prism software (GraphPad, San Diego,
CA, USA). Data represented are the mean ± SEM and analyzed using one-way analysis of variance
(ANOVA) followed by post-hoc test. Spearman’s rank coefficient analysis was performed to determine
the correlation between StAR CNA and StAR mRNA levels. The analysis of overall survival between
groups was performed by log-rank Mantel-Cox method. A p-value less than 0.05 was considered
statistically significant.

3. Results

3.1. Assessment of StAR CNAs in Various Hormone Sensitive Cancers
     Gene amplification, comprising oncogene activation, is a fundamental event in tumor
progression [42]. The hypothesis that estrogen and/or androgen sensitive cancers involve gain
of function of StAR in the transport of cholesterol, and thereby influence hormone sensitive cancers,
was examined. Utilizing TCGA datasets, StAR CNA data were analyzed in a variety of hormone
dependent cancers (Table 1). Breast cancer CNA data for StAR demonstrated ~13% high level
amplification (138 tumors), ~25% gain (268 tumors), ~38% diploid (406 tumors), ~23% hemizygous
deletion (252 tumors), and ~1.5% homozygous deletion (16 tumors). Tumor numbers altered in each
category are shown in parentheses. Analysis of colorectal cancer CNA data for StAR resulted in
~2.5%, ~30%, ~44%, ~23%, and ~8% high level amplification, gain, diploid, hemizygous deletion, and
homozygous deletion, respectively. Whereas StAR CNA data were found to be altered at varying
levels, high level amplification was observed at 4.4% in pancreatic cancer. Likewise, melanoma,
ovarian, prostate, and uterine endometrial cancer CNA data for StAR displayed ~0.3%, ~3.5%, ~2.9%,
and ~1.9% high level amplification in these malignant tumors, respectively (Table 1). These data are
consistent with previous detection of StAR in peripheral tissues and malignant tumors [4,49]. Higher
amplification of the StAR gene (~13%) was next evaluated for its impact on breast cancer.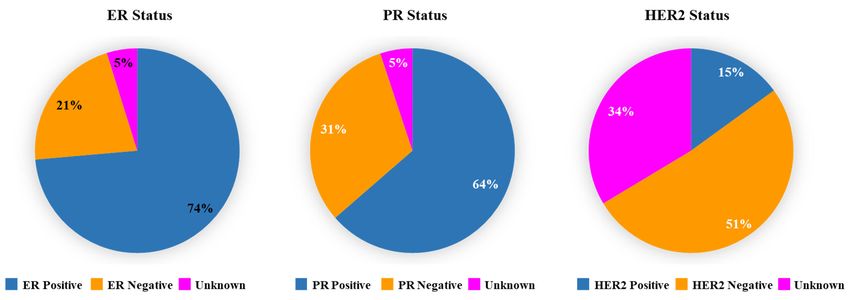
Cancers 2019, 11, x 5 of 16
Table 1. DNA copy number alterations of the steroidogenic acute regulatory (StAR) gene in different
Cancershormone
2019, 11, 623
responsive cancers. 5 of 16
Uterine
Breast Colorectal Melanoma Ovarian Pancreatic Prostate
TableCNAs
1. DNA copy number alterations of the steroidogenic acute regulatory (StAR) geneEndometrial in different
N (%) N (%) N (%) N (%) N (%) N (%)
hormone responsive cancers. N (%)
Homozygous 16 8 3 7 0 32 7
Deletion (1.48) Colorectal
(1.30) (0.82) (1.21) (0.00) (6.50) Uterine
(1.30)
Breast Melanoma Ovarian Pancreatic Prostate
CNAs Endometrial
Hemizygous N (%) 252 N 140
(%) N (%)
69 N215
(%) N42(%) N (%)
133 66N (%)
Deletion (23.33) (22.73) (18.80) (37.13) (22.83) (27.03) (12.24)
Homozygous 16 8 3 7 0 32 7
Deletion (1.48)406 271
(1.30) 184
(0.82) 220
(1.21) 109
(0.00) 258
(6.50) 345(1.30)
Diploid
Hemizygous (37.59)
252 (43.99)
140 (50.14)
69 (38.00)
215 (59.24)
42 (52.44)
133 (64.01)66
Deletion (23.33)268 (22.73)
182 (18.80)
110 (37.13)
117 (22.83)
25 (27.03)
55 111(12.24)
Gain 406 271 184 220 109 258 345
Diploid (24.81) (29.55) (29.97) (20.21) (13.59) (11.18) (20.59)
(37.59) (43.99) (50.14) (38.00) (59.24) (52.44) (64.01)
High Level 138 15 1 20 8 14 10
268 182 110 117 25 55 111
Gain
Amplification (12.78) (2.44) (0.27) (3.45) (4.35) (2.85) (1.86)
(24.81) (29.55) (29.97) (20.21) (13.59) (11.18) (20.59)
HighTotal Number 138
Level 15 1 20 8 14 10
1080 616 367 579 184 492 539
Amplification
of Tumors (12.78) (2.44) (0.27) (3.45) (4.35) (2.85) (1.86)
Total Number
StAR CNA data were assessed
1080 616for the following
367 cancer579 tumors: breast 184(1080 cases), 492colorectal (616
539
of Tumors
cases), melanoma (367 cases), ovarian (579 cases), pancreatic (184 cases), prostate (492 cases), and
StAR CNA data were assessed for the following cancer tumors: breast (1080 cases), colorectal (616 cases), melanoma
uterine
(367 endometrial
cases), ovarian (579 (539 cases).
cases), The CNA
pancreatic (184level was
cases), categorized
prostate as homozygous
(492 cases), and uterine deletion, hemizygous
endometrial (539 cases).
deletion,
The diploid,
CNA level was gain, and high
categorized level amplification,
as homozygous deletion,ashemizygous
described under
deletion,Section 2. N
diploid, (%)and
gain, = number of
high level
amplification,
tumors withaspercentages
described under Section 2. N (%) = number of tumors with percentages in parentheses.
in parentheses.
3.2.
3.2.Expression
ExpressionofofER,
ER,PR
PRand
and HER2
HER2 in
in TCGA
TCGA Breast Cancer Tumors
To
Toassess
assessbreast
breastcancer
cancersubtype(s)
subtype(s)in in TCGA
TCGA tumor
tumor datasets, expression of ER,
ER, PR
PR and
andHER2
HER2waswas
examined.
examined.IHC IHCdata revealed
data differential
revealed expression
differential of ER of
expression (74%ERpositive, 21% negative,
(74% positive, 21% 5% unknown),
negative, 5%
unknown),
PR PR (64%
(64% positive, 31%positive,
negative,31% negative, 5%
5% unknown), unknown),
and HER2 (15% and HER2 (15%
positive, positive, 34%
51% negative, 51% unknown)
negative,
34% unknown)
(Figure 1). These(Figure
results1). These results
indicate indicate
that TCGA thatcancer
breast TCGAtumors
breast cancer tumors
are mostly are mostly
ER+/PR+, ER+/PR+,
representing
representing
they they
are largely are largely
luminal luminal subtypes.
subtypes.
Figure1.1.Expression
Figure Expressionof of ER,
ER, PR
PR and
and HER2
HER2 in in The
The Cancer
Cancer Genome
GenomeAtlas
Atlas(TCGA)
(TCGA)breast
breastcancer
cancertumors.
tumors.
These tumors were previously stained with specific IHC markers in a clinical setting to classify
These tumors were previously stained with specific IHC markers in a clinical setting to classify into into
biologically
biologicallydistinct
distinctsubtypes. PiePie
subtypes. charts illustrate
charts ER, ER,
illustrate PR, and
PR, HER2 expression
and HER2 in breast
expression in cancer
breast tumors,
cancer
which are presented as percentage of total numbers. Expression of these receptors was
tumors, which are presented as percentage of total numbers. Expression of these receptors was categorized as
positive, negative, and unknown. The unknown category includes tumors in which
categorized as positive, negative, and unknown. The unknown category includes tumors in whichIHC analysis was
either not donewas
IHC analysis or indeterminate
either not doneororequivocal or data
indeterminate or was not available.
equivocal or data was not available.
3.3. Amplification of the StAR Gene in Breast Cancer and Its Correlation to Overall Survival
3.3. Amplification of the StAR Gene in Breast Cancer and Its Correlation to Overall Survival
Utilizing TCGA breast cancer data cohort, amplification of the StAR gene was examined for
Utilizing TCGA breast cancer data cohort, amplification of the StAR gene was examined for
cancer survival. As illustrated in Figure 2A, StAR CNA data in different categories were positively
cancer survival. As illustrated in Figure 2A, StAR CNA data in different categories were positively
correlated with StAR mRNA expression (RNA-Seq data). The correlation between StAR CNA and
StAR mRNA levels was verified with Spearman’s correlation coefficient, i.e., 0.463. The analysis of
Kaplan-Meier curve demonstrated that amplification of the StAR gene (~13%) was correlated with poorCancers 2019, 11, x 6 of 16
correlated with StAR mRNA expression (RNA-Seq data). The correlation between StAR CNA and
Cancers 2019, 11, 623 6 of 16
StAR mRNA levels was verified with Spearman’s correlation coefficient, i.e., 0.463. The analysis of
Kaplan-Meier curve demonstrated that amplification of the StAR gene (~13%) was correlated with
survival
poor of breast
survival cancercancer
of breast patients (p-value
patients = 0.020).
(p-value The median
= 0.020). survivalsurvival
The median rate wasrate
noticeably reduced
was noticeably
with amplification
reduced of the StAR
with amplification gene
of the when
StAR compared
gene without amplification
when compared (Figure 2B).
without amplification Similarly,
(Figure 2B).
the survival
Similarly, theofsurvival
breast cancer wascancer
of breast affected
was(p-value = (p-value
affected 0.045) when Kaplan-Meier
= 0.045) curve was curve
when Kaplan-Meier generated
was
with and without
generated with and (inwithout
which all(intumors, excluding
which all tumors, homozygous deletion, was
excluding homozygous wasStAR
included)
deletion, gene
included)
amplification
StAR (Figure 2C).(Figure 2C).
gene amplification
Figure 2. Frequency of StAR CNA data in breast cancer tumors and its correlation to overall survival.
Figure 2. Frequency of StAR CNA data in breast cancer tumors and its correlation to overall survival.
StAR CNA data were obtained from TCGA breast cancer tumor datasets with 1080 tumors. The
StAR CNA data were obtained from TCGA breast cancer tumor datasets with 1080 tumors. The CNA
CNA level was categorized as homozygous deletion, hemizygous deletion, diploid, gain, and high
level was categorized as homozygous deletion, hemizygous deletion, diploid, gain, and high level
level amplification (A), utilizing cBioPortal browser, as described under Section 2. Breast cancer
amplification (A), utilizing cBioPortal browser, as described under Section 2. Breast cancer RNA-Seq
RNA-Seq data were assessed for StAR mRNA expression that positively correlated with StAR CNA
data were assessed for StAR mRNA expression that positively correlated with StAR CNA data in
data in different categories (A), which were presented in Y-axis and X-axis, respectively. Amplification
different categories (A), which were presented in Y-axis and X-axis, respectively. Amplification of the
of the StAR gene was evaluated for overall breast cancer survival (B,C). Kaplan-Meier curve was
StAR gene was evaluated for overall breast cancer survival (B,C). Kaplan-Meier curve was generated
generated with TCGA breast cancer tumor CNA data, using with amplification (138 tumors) vs. without
with TCGA breast cancer tumor CNA data, using with amplification (138 tumors) vs. without
amplification (diploid, 406 tumors; B), or with a category (926 tumors; C) excluding homozygous
amplification (diploid, 406 tumors; B), or with a category (926 tumors; C) excluding homozygous
deletion (16 tumors) of the StAR gene. Red and blue lines in panels B and C represent with and without
deletion (16 tumors) of the StAR gene. Red and blue lines in panels B and C represent with and
amplification of the StAR gene, respectively.
without amplification of the StAR gene, respectively.
3.4. StAR Gene Amplification, Hormone Receptor Expression, and Their Correlation to Cancer Survival in a
3.4. StARofGene
Number Amplification,
Breast Cancer Studies Hormone Receptor Expression, and Their Correlation to Cancer Survival in a
Number of Breast Cancer Studies
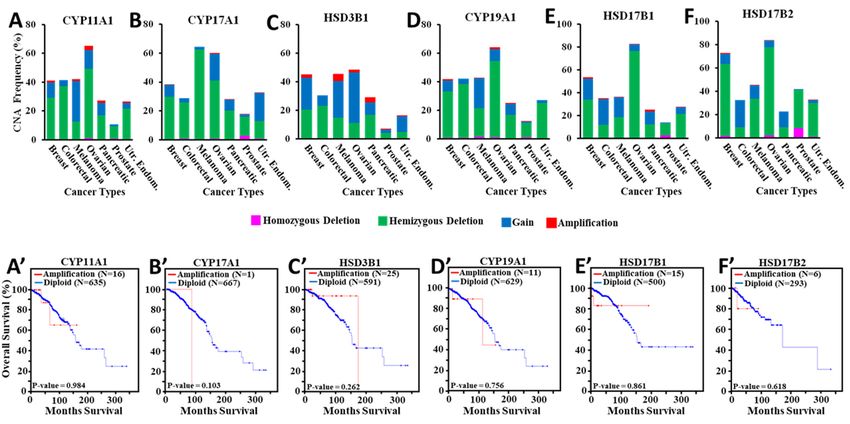
To better understand involvement of StAR gene amplification in breast cancer deaths, genomic
data To
frombetter understand
a number involvement of StAR
of publications/projects, gene amplification
as available in breast
in cBioPortal, cancer deaths,
were analyzed. genomic
As depicted in
data
Figurefrom
3A,aamplification
number of publications/projects,
of the StAR gene was as observed
available between
in cBioPortal, were26%
12% and analyzed. As depicted
in all breast cancer
in Figureexamined.
studies 3A, amplification of theamplification
Specifically, StAR gene wasof observed
the StAR between
gene was12%26%and
in 26% in allcancer
a breast breastpatient
cancer
studies
xenograftsexamined. Specifically,
study, 12% amplification
in breast cancer of the
METABRIC, StAR
and 13% gene wasin26%
and 14% twoinindependent
a breast cancer patient
publications
xenografts study,
associated with 12%
breast in breast
invasive cancer and
carcinomas, METABRIC, and
15% each in two13% and 14%metastatic
independent in two independent
breast cancer
publications associated
studies (specified with 2).
in Section breast invasive carcinomas, and 15% each in two independent metastatic
breast cancer studies (specified in Section 2).3B,B’). In a breast invasive carcinoma study (Cell 2015, 816 tumors), amplification of the StAR gene
(~14%), associated with 74% ER+, 64% PR+, and 51% HER2− (15% HER2+), was found to correlate (p-
value = 0.008) with poor breast cancer survival (Figure 3C,C’). These data corroborate the findings
presented in Figure 2B,C, and demonstrate that amplification of the StAR gene is correlated with poor
survival of patients with luminal subtype breast cancer. Survival data were not available for other
Cancers 2019, 11, 623 7 of 16
studies included in Figure 3A.
Figure
Figure3.3.Amplification
Amplificationofofthe theStAR
StAR gene,
gene,expression
expression of of
hormone
hormone receptors,
receptors,andand
their correlation
their to
correlation
breast cancer
to breast cancersurvival
survivalin in
a number
a numberofofpublications/projects.
publications/projects.Amplification
Amplificationofofthe theStAR
StARgene
gene inin
different
differentbreast
breastcancer
cancerstudies,
studies, asas
available in cBioPortal,
available waswas
in cBioPortal, analyzed. (A), amplification
analyzed. of the of
(A), amplification StAR
the
StARwas
gene gene was evaluated
evaluated in the following
in the following breast studies:
breast cancer cancer studies: breastpatient
breast cancer cancer xenografts,
patient xenografts,
Nature
Nature
2015 (29 2015 (29 tumors),
tumors), [35];
[35]; breast breast METABRIC,
METABRIC, Nature Communication
Nature Communication 2016 (21732016 (2173 tumors)
tumors) [34];TCGA
[34]; breast breast
TCGA
Cell Cell(816
2015, 2015, (816 tumors),
tumors), [36]: TCGA
[36]: TCGA Provisional
Provisional (1080 tumors),
(1080 tumors), [27]; breast
[27]; breast PLoS Medicine
PLoS Medicine 2016
2016 (216
(216 tumors),
tumors), [37]; [37];
and and
TCGA TCGA Metastatic
Metastatic Breast
Breast Cancer
Cancer (MBC)
(MBC) Project2017
Project 2017(103
(103 tumors).
tumors). Receptor
Receptor
expressionwas
expression wascategorized
categorizedas aspositive,
positive,negative,
negative,and
andunknown,
unknown,and andpresented
presentedas aspercentages
percentagesof oftotal
total
numberof
number oftumors
tumors(B,C),
(B,C),asasdescribed
describedin inthe
thelegend
legendofofFigure
Figure1.1.Levels
Levelsof ofER,
ER,PR,
PR,and
andHER2
HER2expression
expression
andtheir
and theircorrelation
correlationto tooverall
overallsurvival
survivalwere
wereanalyzed
analyzedfor forMETABRIC
METABRIC (B,B’)(B,B’) and
and TCGA
TCGA CellCell 2015
2015
(C,C’)studies.
(C,C’) studies.Kaplan-Meier
Kaplan-Meiersurvival
survivalcurves
curveswere
weregenerated
generatedwith
withMETABRIC
METABRIC(red (redline,
line,288
288tumors;
tumors;
blueline,
blue line,1133
1133tumors)
tumors)and Cell2015
andCell 2015(red
(red line,
line, 102
102 tumors;
tumors; blue
blue line,
line, 309
309 tumors)
tumors) CNA
CNA data,
data, using
using
tumors with amplification and without amplification (diploid) of
tumors with amplification and without amplification (diploid) of the StAR gene. the StAR gene.
In additional
3.5. Amplification analyses, ER,Enzyme
of Steroidogenic PR, and HER2
Genes andexpression, amplification
Their Correlation the StAR
to OverallofBreast Cancer gene and its
Survival
correlation to overall survival, were evaluated. In METABRIC study, breast cancer tumors (2173 tumors)
wereEstrogen
69% ER+,plays an important
48% PR+, role in
and 80% HER−, stimulating
representing breastsubtype,
a mixed cancer.inThe
whichinvolvement
amplification ofofkey
the
steroidogenic enzyme genes (Supplementary Figure S1) to estrogen synthesis was next evaluated
StAR gene (~12%) affected the survival (p-value = 0.003) of breast cancer (Figure 3B,B’). In a breast for
their association
invasive to breast
carcinoma studycancer survival
(Cell 2015, utilizing amplification
816 tumors), TCGA data cohort. The data
of the StAR genepresented in Figure
(~14%), associated
4A–F
with 74% ER+, 64% PR+, and 51% HER2− (15% HER2+), was found to correlate (p-value =(blue),
illustrate bar graphs of different CNA frequencies (high level amplification (red), gain 0.008)
hemizygous deletion
with poor breast (green),
cancer and(Figure
survival homozygous
3C,C’).deletion (pink)
These data for CYP11A1,
corroborate CYP17A1,
the findings HSD3B1,
presented in
CYP19A1, HSD17B1, and HSD17B2 enzyme genes in different hormone sensitive cancers.
Figure 2B,C, and demonstrate that amplification of the StAR gene is correlated with poor survival Diploid
category is not
of patients shown
with in these
luminal bar diagrams
subtype for easier
breast cancer. visualization.
Survival data wereCNA data demonstrate
not available for otherthat the
studies
CYP11A1
included ingene was 3A.
Figure amplified at ~1.5%, ~1.4%, ~3%, ~1.6%, and ~1.1% in breast, melanoma, ovarian,
3.5. Amplification of Steroidogenic Enzyme Genes and Their Correlation to Overall Breast Cancer Survival
Estrogen plays an important role in stimulating breast cancer. The involvement of key steroidogenic
enzyme genes (Supplementary Figure S1) to estrogen synthesis was next evaluated for their association
to breast cancer survival utilizing TCGA data cohort. The data presented in Figure 4A–F illustrate bar
graphs of different CNA frequencies (high level amplification (red), gain (blue), hemizygous deletion
(green), and homozygous deletion (pink) for CYP11A1, CYP17A1, HSD3B1, CYP19A1, HSD17B1,
and HSD17B2 enzyme genes in different hormone sensitive cancers. Diploid category is not shown
in these bar diagrams for easier visualization. CNA data demonstrate that the CYP11A1 gene wasCancers 2019, 11, 623 8 of 16
Cancers 2019, 11, x 8 of 16
amplified at ~1.5%, ~1.4%, ~3%, ~1.6%, and ~1.1% in breast, melanoma, ovarian, pancreatic, and
uterine endometrial
pancreatic, cancers,
and uterine respectively
endometrial (Figure
cancers, 4A). No amplification
respectively (Figure 4A). ofNo CYP11A1 gene
theamplification was
of the
observed
CYP11A1 in gene
prostate
wasand colorectal
observed cancers. and
in prostate CYP17A1 gene
The colorectal wasThe
cancers. amplified lessgene
CYP17A1 than was
1% inamplified
all cancer
types analyzed (Figure 4B). Amplification of the HSD3B1 gene was highest (~5%) in
less than 1% in all cancer types analyzed (Figure 4B). Amplification of the HSD3B1 gene was highest melanoma and
none in colorectal cancer (Figure 4C). In breast cancer, this gene was amplified at
(~5%) in melanoma and none in colorectal cancer (Figure 4C). In breast cancer, this gene was ~2.3%. Amplification
the CYP19A1
ofamplified geneAmplification
at ~2.3%. (aromatase) was ~1%,
of the ~0.5%,gene
CYP19A1 ~0.3%, ~0.2%, ~1.6%,
(aromatase) 0%,~0.5%,
was ~1%, and ~0.2%
~0.3%,in~0.2%,
breast,
colorectal, melanoma, ovarian, pancreatic, prostate, and uterine endometrial cancers,
~1.6%, 0%, and ~0.2% in breast, colorectal, melanoma, ovarian, pancreatic, prostate, and uterine respectively
(Figure 4D). Additionally,
endometrial both HSD17B1
cancers, respectively (Figureand HSD17B2
4D). gene isoforms
Additionally, were found
both HSD17B1 to be amplified
and HSD17B2 gene
minimally
isoforms (0–1.4%)
were found in different hormoneminimally
to be amplified sensitive cancers
(0–1.4%) studied (Figurehormone
in different 4E,F). These HSD17B1
sensitive and
cancers
HSD17B2 isoforms
studied (Figure were
4E,F). amplified
These HSD17B1 at ~1.4% and ~0.6%
and HSD17B2 in breast
isoforms cancer,
were respectively.
amplified These
at ~1.4% and results
~0.6% in
breast
are cancer,of respectively.
in support These
previous studies thatresults are in support
demonstrated of previous
upregulation studies
of aberrant that demonstrated
steroidogenesis during
upregulation
tumor of aberrant
progression [49,50].steroidogenesis during tumor progression [49,50].
Figure Analyses
Figure4. 4. Analyses of CNA
of CNAdatadata
for various steroidogenic
for various enzyme
steroidogenic genes in
enzyme different
genes hormonehormone
in different sensitive
cancers andcancers
sensitive their correlation
and theirtocorrelation
breast cancer survival.
to breast TCGA
cancer CNA data
survival. TCGA analyzed
CNA for different
data analyzed cancers
for
were the following:
different cancers werebreastthe
cancer tumorsbreast
following: (1080 cancer
cases), tumors
colorectal (616cases),
(1080 cases),colorectal
melanoma(616 (367cases),
cases),
ovarian
melanoma(579 cases), pancreatic
(367 cases), ovarian(184 cases),
(579 prostate
cases), (492 cases),
pancreatic and uterine
(184 cases), prostateendometrial (539
(492 cases), andcases).
uterineBar
graphs illustrate
endometrial (539CNA dataBar
cases). forgraphs
steroidogenic
illustrateenzyme
CNA data genes:forCYP11A1 (A), CYP17A1
steroidogenic (B), HSD3B1
enzyme genes: CYP11A1 (C),
CYP19A1 (D), HSD17B1
(A), CYP17A1 (B), HSD3B1(E), (C), HSD17B2(D),
and CYP19A1 (F). HSD17B1
Amplification of these
(E), and HSD17B2genes was
(F). analyzed forofoverall
Amplification these
breast
genescancer survival (A’–F’).
was analyzed Kaplan-Meier
for overall breast cancer survival curves
survival were generated
(A’–F’). Kaplan-Meier withsurvival
and without
curves(diploid)
were
amplification
generated with of the following
and withoutsteroidogenic enzyme genes:
(diploid) amplification of theCYP11A1
following (A’;steroidogenic
red line, 16 tumors;
enzymeblue line,
genes:
CYP11A1
635 tumors), CYP17A1
(A; red line, (B’;
16 tumors;
red line, blue line, 635
1 tumor; tumors),
blue CYP17A1
line, 667 tumors), (B’;HSD3B1
red line,(C’;
1 tumor; blue25line,
red line, 667
tumors;
tumors),
blue HSD3B1
line, 591 tumors),(C’;CYP19A1
red line, (D’;
25 tumors;
red line, blue line, 591blue
11 tumors; tumors), CYP19A1
line, 629 tumors),(D’;HSD17B1
red line, (E’;
11 tumors;
red line,
15blue line, 629
tumors; bluetumors),
line, 500HSD17B1
tumors),(E’; andred line, 15 tumors;
HSD17B2 (F’; redblue
line,line, 500 tumors),
6 tumors; and HSD17B2
blue line, 293 tumors).(F’; red
Red
line,
and 6 tumors;
blue blue line,with
lines represent 293 tumors). Red and
and without blue lines represent
amplification of target with
genes, and without amplification
respectively. Utr. Endom., of
target genes,
Uterine respectively. Utr. Endom., Uterine Endometrial.
Endometrial.
The
Theamplification
amplificationofof these
these steroidogenic
steroidogenic enzyme
enzyme genes in breast breast cancer
cancer survival
survival was
was next
next
evaluated.As
evaluated. As determined
determined by byKaplan-Meier
Kaplan-Meiersurvival
survival analyses, amplification
analyses, amplificationof the
ofCYP11A1 gene was
the CYP11A1 gene
notnot
was associated (p-value
associated (p-value = 0.984)
= 0.984) withwith
breast cancer
breast survival
cancer (Figure
survival 4A’). 4A’).
(Figure Similarly, both CYP17A1
Similarly, and
both CYP17A1
HSD3B1
and HSD3B1 genegene
amplifications werewere
amplifications not found to affect
not found to the survival
affect of breastofcancer,
the survival breastincancer,
which p-values
in which
were 0.103
p-values wereand
0.1030.262, respectively
and 0.262, (Figure(Figure
respectively 4B’,C’).4B’,C’).
Kaplan-Meier survival
Kaplan-Meier analysis
survival revealed
analysis that
revealed
that amplification of the CYP19A1 gene was not correlated (p-value = 0.756) with breast cancer survival
amplification of the CYP19A1 gene was not correlated (p-value = 0.756) with breast cancer survival
(Figure
(Figure 4D’).Additionally,
4D’). Additionally,amplification
amplificationof ofboth
bothHSD17B1
HSD17B1 andand HSD17B2
HSD17B2 genegene isoforms
isoformsdid
didnot
notaffect
affect
the survival of breast cancer, where p-values were 0.861 and 0.618, respectively (Figure 4E’,F’).
the survival of breast cancer, where p-values were 0.861 and 0.618, respectively (Figure 4E’,F’). These These
data indicate that none of these steroidogenic enzyme genes were either substantially amplified or
affected the survival of ER+/PR+ breast cancer.Cancers 2019, 11, x 9 of 16
3.6. Assessment of StAR Gene Mutation in Hormone Sensitive Cancers
Cancers 2019, 11, 623 9 of 16
TCGA hormone responsive cancer datasets were analyzed for identifying mutation(s) in the
StAR gene, which has been shown to affect the biological activity of the StAR protein in steroid
data indicate [4,51].
biosynthesis that none
As of these steroidogenic
determined by exomeenzyme genesno
sequencing, were either substantially
mutations in the StARamplified
gene wereor
affected the
observed in survival of ER+/PR+
breast (982 tumors) breast cancer. (499 tumors) cancers (Figure 5), suggesting StAR is
and prostate
functionally active in mobilizing cholesterol to the mitochondria. However, one mutation in the StAR
3.6. Assessment
gene of StAR
was identified inGene
eachMutation in Hormone
of the following Sensitivecolorectal
cancers: Cancers (one out of 223 tumors; 0.45%),
pancreatic
TCGA(one out of responsive
hormone 150 tumors;cancer
0.67%),datasets
and ovarian
were (one out offor
analyzed 316identifying
tumors; 0.32%). In melanoma
mutation(s) in the
and
StARuterine
gene, endometrial
which has been carcinomas,
shown five (368 tumors;
to affect 1.36%) activity
the biological and fourof(248
thetumors; 1.61%) mutations
StAR protein in steroid
were observed
biosynthesis in the
[4,51]. AsStAR gene, respectively
determined (Supplementary
by exome sequencing, Figure S2).
no mutations The
in the absence
StAR of mutation
gene were in
observed
the StAR (982
in breast gene,tumors)
especially
andinprostate
breast cancer, suggests
(499 tumors) that amplification
cancers of the StAR
(Figure 5), suggesting geneisisfunctionally
StAR culpable in
the
active in mobilizing cholesterol to the mitochondria. However, one mutation in the StAR increased
transport of excess cholesterol to the inner mitochondrial membrane, resulting in gene was
estrogen
identifiedsynthesis
in each ofwhich would promote
the following cancers:tumorigenesis.
colorectal (one out of 223 tumors; 0.45%), pancreatic (one
out of 150 tumors; 0.67%), and ovarian (one out of 316 tumors; 0.32%). In melanoma and uterine
3.7. Expressioncarcinomas,
endometrial of StAR mRNA fivein(368
TCGA Breast 1.36%)
tumors; Cancer Tumors
and fourand(248
Its Association to Overall
tumors; 1.61%) Survivalwere
mutations
observed
TCGA the StAR
inbreast gene,
cancer respectively
tumor datasets (Supplementary
were assessed forFigure S2). Theexpression.
StAR mRNA absence ofAsmutation in the
illustrated by
StAR especially in breast cancer, suggests that amplification of the StAR
the Box and Whisker plot, StAR mRNA expression was represented as fkpm+uq+1 (obtainedinfrom
gene, gene is culpable the
transport of
RNA-Seq excess
data), cholesterol
in which normal to distribution
the inner mitochondrial membrane,
across the population wasresulting in increased
visualized estrogen
as 25th (9.114) and
synthesis which would promote tumorigenesis.
75 (11.32) percentiles with a median of 10.2 (Figure 5A).
th
Figure
Figure 5.5. Expression of StAR mRNA in TCGA breast cancer tumors using the Box and Whisker Plot,
and generation
generation ofof Kaplan-Meier
Kaplan-Meier curves
curves with
with low
low vs.vs. high StAR levels.
levels. StAR mRNA expression was
illustrated
illustratedasasfkpm+uq+1,
fkpm+uq+1,generated
generated bybyTCGA
TCGA (1089 tumors),
(1089 and visualized
tumors), with the
and visualized Box the
with and Box
Whisker
and
Plot
Whisker Plot (A), as described in Section 2. Shown are 25 (9.114) and 75 (11.32) percentiles withofa
(A), as described in Section 2. Shown are 25th (9.114) and
th 75th (11.32) percentiles
th with a median
10.2 (indicated
median of 10.2by a horizontal
(indicated by aline). Kaplan-Meier
horizontal survival curves
line). Kaplan-Meier were generated
survival curves were with StAR mRNA
generated with
values up to 50th
StAR mRNA percentile
values (10.2;
high (B), andasup
543 tumors) to 25th
high (B), percentile
and up to 25 asthlow (9.114; 817 (C). Red
tumors) and(C).
as high blueRed
lines represent
and blue lineslowrepresent
and highlowStARandmRNA expression,
high StAR mRNArespectively.
expression,
respectively.
3.7. Expression of StAR mRNA in TCGA Breast Cancer Tumors and Its Association to Overall Survival
TCGA breast cancer tumor datasets were assessed for StAR mRNA expression. As illustrated by
the Box and Whisker plot, StAR mRNA expression was represented as fkpm+uq+1 (obtained fromCancers 2019, 11, 623 10 of 16
RNA-Seq data), in which normal distribution across the population was visualized as 25th (9.114) and
75th (11.32) percentiles with a median of 10.2 (Figure 5A).
To better understand the involvement of StAR in breast cancer, TCGA breast cancer tumors
expressing StAR mRNA were verified for survival analyses with two different quartile combinations.
As depicted in Figure 5B, Kaplan-Meier curve generated with StAR mRNA values up to 50th percentile
(10.2) as high [46], was found to correlate with poor survival
(p-value = 0.038) of patients with breast cancer. In a different category, StAR mRNA values up to 25th
percentile (9.114) as high [48], showed qualitatively similar
effect (p = 0.034) on the survival of breast cancer (Figure 5C). These data suggest that higher expression
of StAR mRNA can be a risk factor for poor survival of patients with breast cancer.
3.8. TNM Staging and Its Correlation to Breast Cancer Deaths
To obtain more insight in to the impact of StAR in breast cancer deaths, TCGA breast cancer tumors
expressing StAR mRNA were analyzed in conjunction with the TNM staging. Specifically, different
TNM stages were evaluated with low and high StAR mRNA levels with two quantile combinations as
those utilized in Figure 5B,C. The results presented in Table 2 demonstrate TNM stage specific effects of
tumors and their correlation to breast cancer deaths. These results show that breast cancer deaths were
found to be coordinately associated with not only to increased tumor sizes, but also to lymph nodes
in stage dependent manners. Additionally, tumor metastasis (M1) markedly affected the survival
of breast cancer when compared with no metastasis (M0) in both low and high categories (Table 2).
Specifically, the results obtained with TNM stages confirm the Kaplan-Meier survival data presented
in Figure 5B,C. Altogether, genomic analyses of key steroidogenic factors, within the context of TCGA
breast cancer datasets, indicated that aberrant amplification/ expression of the StAR gene is involved,
at least in part, in poor survival of ER+/PR+ breast cancer patients. These results are in support of
our recent finding that demonstrated that StAR protein is abundantly expressed in hormone sensitive
breast cancer [5].
Table 2. T, N, M staging of TCGA breast cancer tumors segregated for low and high StAR mRNA
expression based on two different quartile combinations, and their correlation to patient deaths.
Low Expression (50%) Low Expression (25%)
TNM
Staging Tumor Death % Tumor Death % Tumor Death % Tumor Death %
Nos. Nos. Deaths Nos. Nos. Deaths Nos. Nos. Deaths Nos. Nos. Deaths
T1 120 17 14.2 158 16 10.1 54 8 14.8 224 25 11.2
T2 336 44 13.1 294 33 11.2 169 25 14.8 461 52 11.3
T3 63 11 17.5 75 14 18.7 32 9 28.1 106 16 15.1
T4 26 8 30.8 14 7 50 16 5 31.3 24 10 41.7
N0 257 22 8.6 257 22 8.6 120 15 12.5 394 29 7.4
N1 169 31 18.3 190 28 14.7 91 19 20.1 268 40 14.9
N2 75 16 21.3 45 6 13.3 38 6 15.8 82 16 19.5
N3 33 5 15.2 45 12 26.7 16 4 25.0 60 11 18.3
M0 459 62 13.5 621 32 5.2 224 26 11.6 672 83 12.4
M1 13 10 76.9 8 5 62.5 4 2 50 12 9 75.0
TCGA breast cancer tumors expressing low and high StAR mRNA levels (as specified) were categorized based
on tumor sizes (T1–T4), nodal variations (N0–N3), and metastasis and non-metastasis (M0–M1), as described in
Section 2.
4. Discussion
Abnormality in gene expression is responsible for anomalous growth of cells connecting tumor
progression. The majority of the human genome is transcribed, but not translated, and gene
amplification, involving oncogene activation, is a fundamental event in cancers. Hormone responsiveCancers 2019, 11, 623 11 of 16
cancers, especially breast cancer, are most common globally. Since StAR plays an indispensable
role in the regulation of steroidogenesis, its expression must be finely regulated to appropriate
functioning of steroid led activities. Conversely, dysregulation of steroid biosynthesis has been
implicated in the pathophysiology of a number of relevant cancers. While StAR’s involvement in
breast malignancy remains obscure, we recently reported that both StAR protein expression and E2
synthesis are profoundly higher in ER+/PR+ breast cancer cell lines, when compared their levels with
either non-cancerous mammary epithelial cells or TNBC [5]. By analyzing genomic profiles of StAR
and steroidogenic enzyme genes for several hormone sensitive cancers, our data extend previous
observations and provide novel insight that aberrant high amplification/expression of the StAR gene is
correlated with poor survival of patients with breast cancer.
The comprehensive analyses of TCGA and cBioPortal research datasets for various hormone
responsive cancers demonstrate that StAR gene is amplified (associated with a positive correlation
between StAR CNA and StAR mRNA levels), but not mutated, in luminal subtype breast cancer.
Specifically, the association of StAR with ER+/PR+ breast cancer indicates that StAR acts as a tumor
promoter in the most prevalent hormone sensitive breast cancer. Several lines of evidence demonstrate
a close correlation between StAR mRNA and StAR protein synthesis which parallels the synthesis of
steroids in a variety of target tissues [4,7,10,52]. The involvement of StAR in breast cancer appeared
specific, as translocator protein (TSPO), a mitochondrial factor involved in steroidogenesis [53,54], was
not connected (TSPO gene was amplified at 0.7% with a p-value = 0.540) with cancer deaths (data
not illustrated). The mechanism accounting for estrogen sensitive ovarian and endometrial cancers,
connecting mutations in the StAR gene, remains unclear, and may involve one or more compensatory
event(s), including involvement of StAR related lipid transfer proteins 3-6 (STARD3-6) and/or other
factors involved in cholesterol trafficking [55,56]. Of note, the late endosomal membrane protein
STARD3 (also known as metastatic lymph node 64), with ~37% C-terminal homology to StAR, was
initially cloned as a gene amplified in the breast, gastric, and esophageal cancers [57,58]. It has previously
been shown that overexpression of STARD3 is associated with increased cholesterol biosynthesis in
HER2+ breast cancer subtype [59,60]. Regardless of the influence of these transporters, cholesterol and
its oxygenated derivatives were demonstrated to be involved in the pathophysiology of a number of
hormone sensitive malignancies, including breast cancer [17,18]. Studies have also reported that both
cholesterol and its metabolites, including 27-hydroxycholesterol (27-HC) and 6-oxocholestan-diol, are
capable to accelerate and/or enhance breast tumorigenesis [17,61,62]. Noteworthy, 27-HC is a ligand
for ER and liver X receptor (LXR), in which the effects of 27-HC on tumor formation and growth
are dependent on ER, while the action of this oxysterol involves LXR in tumor metastasis in mouse
breast cancer models [17]. Whereas an overwhelming amount of evidence indicates the involvement
of cholesterol in hormone sensitive breast cancer, epidemiologic findings are contradictory, requiring
future studies to assess whether total cholesterol and its metabolites, high-density lipoprotein, or
low-density lipoprotein influence cancer development and progression.
Almost all proteins in eukaryotic cells are modified by various post-translational modifications
(PTMs) that influence protein function. We recently identified that StAR is a novel acetylated protein
in ER+ breast cancer cells, in which three acetyl lysine residues were recognized endogenously,
surmising they contribute to higher accumulation E2 in these cells [5]. It is plausible that both higher
expression and activity of StAR facilitate abnormal cholesterol delivery to the mitochondrial inner
membrane and, as a consequence, precursor availability for estrogen in promoting breast tumorigenesis.
This reinforces the notion that estrogen levels in the majority of hormone sensitive malignant
breast tumors can be 10–30 times higher than those found in either circulation or non-cancerous
counterparts [16,21,63,64]. Previously, we [14,65,66] and others [67,68] have reported that cAMP
mediated mechanisms phosphorylate StAR and this PTM enhances the optimal cholesterol transferring
ability of the StAR protein in steroid biosynthesis. Despite the regulatory events involved, the impact
of StAR to serve as a risk factor in affecting the survival of ER+/PR+ breast cancer opens up a new
avenue in breast cancer research.Cancers 2019, 11, 623 12 of 16
A notable aspect of the present findings is that amplification of the CYP19A1 gene (aromatase),
within the context of TCGA data cohort, was not correlated with breast cancer death [16], even though
aromatase is the rate-limiting enzyme in estrogen biosynthesis. Expression of aromatase has been
shown to be high in both non-cancerous and cancerous breast cell lines, suggesting its relevance in
a number of physiological and pathophysiological events [5,69]. There is increasing evidence that
enhanced expression/activity of aromatase is one of the key events for elevated intra-tumoral production
of estrogen in malignant breast tissues [16,21,70,71]. Estrogen is also produced by the action of the
17β-HSD enzyme, and CNA data revealed that the HSD17B gene was neither significantly amplified nor
connected with the survival of hormone sensitive breast cancer. These data imply that StAR mediated
delivery of excess cholesterol, resulting in a substantial increase in estrogen accumulation, appears to
be a fundamental event in the development of hormone sensitive breast cancer. In accordance with
this, preliminary data obtained reveal that the expression of both StAR mRNA and StAR protein was
markedly high in transgenic (Tg) mouse models of breast cancer, activated by MMTV promoter driven
cNeu and H-Ras oncogenes, and polyomavirus, in comparison to nearly undetectable level of StAR in
normal Tg mammary tissue.
Estrogen is primarily produced in the ovaries via the classical steroidogenic pathway through the
synthesis of androstenedione and testosterone from cholesterol (in which StAR plays a permissive role)
in the theca cells. These androgens are then converted to estrogens in granulosa cells. In peri- and
post-menopausal women, extra ovarian tissues become a major source for estrogen synthesis [72]. This
transition is critical since most hormone sensitive cancers, including breast, occur over the age of 50, in
which estrogens synthesized in peripheral tissues are believed to play pivotal roles [63,64]. The plasma
androgen level in post-menopausal women, with the loss of ovarian estrogen production, remains
stable for years. Utilizing the non-classical pathway, these androgens are converted to estrogens in
peripheral tissues. In addition to peripheral estrogen that reaches the tumor site through systemic
circulation, estrogen is also synthesized locally in malignant breast tumors [16,21,63,64]. Breast cancer
tumors in TCGA datasets were predominantly ER+/PR+, in which aberrant high expression of StAR
mRNA, was found to affect poor survival of breast cancer. Further analyses of these tumors, expressing
StAR mRNA, demonstrated increasing patterns of breast cancer deaths with advanced TNM stages.
It should be noted, however, while breast cancer deaths were steadily increased with various TNM
stages, they were not coordinately associated with StAR mRNA expression, which could be due to
tumor numbers, tumor stages, or involvement of additional factors.
5. Conclusions
Analyses of molecular genomic profiling of steroidogenic factors associated with TCGA and
cBioPortal research datasets revealed that abundant amplification and/or expression of the StAR
gene is connected with poor survival of patients with luminal subtype breast cancer. This is in
support of our recent report that demonstrated that StAR protein, concomitant with E2 synthesis, is
markedly expressed in ER+/PR+ breast cancer, in comparison to nearly undetectable to modest StAR
and E2 levels in non-cancerous mammary epithelial cells [5]. Based on these data (albeit limited),
it is highly likely that StAR facilitates abnormal delivery of cholesterol to the inner mitochondria,
resulting in adequate availability of precursors for E2 overproduction, which could be a plausible
mechanism in the development and growth of hormone sensitive breast cancer. Furthermore, the
results of in silico analyses, together with our in vitro data reported recently, attest that StAR can
serve as a novel prognostic marker in ER+/PR+ breast cancer, whereas its inhibition, involving E2
synthesis, by a number of histone deacetylase inhibitors, might have therapeutic implications in
the prevention/treatment of this devastating disease. The present data indicating the involvement
of the classical pathway in intra-tumoral androgen/estrogen synthesis points to an additional new
mechanism in growth and development of ER+/PR+ breast and/or other pertinent cancers, even though
overexpression of aromatase, resulting in an increase in estrogen synthesis through the non-classicalCancers 2019, 11, 623 13 of 16
pathway is well established. Whereas StAR gene is highly amplified/expressed in hormone sensitive
breast cancer, its association with HER2 and TNBC subtypes remains to be elucidated.
Supplementary Materials: The following are available online at http://www.mdpi.com/2072-6694/11/5/623/s1,
Figure S1: Steroid biosynthetic pathway. Figure S2: Assessment of mutation in the StAR gene in a variety of
hormone sensitive cancers. Supplementary Excel file: StAR mRNA (RNA-Seq) data for overall survival analysis.
Author Contributions: Conceptualization, P.R.M.; Methodology, P.R.M., A.U.A., S.Y. and M.N.; Project
Administration and Supervision, P.R.M.; Validation, P.R.M., A.U.A., S.Y. and M.N.; Formal Analysis, P.R.M.,
A.U.A., S.Y., M.N., J.C.-T., A.T.S. and K.P.; Investigation, P.R.M., A.U.A., S.Y., A.T.S. and M.N.; Writing—Original
Draft Preparation, P.R.M.; Visualization, P.R.M., A.U.A., M.N., J.C.-T., A.T.S. and K.P.; Funding acquisition, A.T.S.
and K.P.; Writing—Review & Editing, P.R.M., A.U.A., S.Y., M.N., J.C.-T., A.T.S. and K.P.
Funding: This work was supported in part by a Cancer Prevention Research Institute of Texas (CPRIT) Award
RR140008 to K.P., and National Institutes of Health grants (1R01AR073004-01A1 and 1RO1AR071189-01A1) and a
V.A. grant (1I01BX004293-01A1) to A.T.S.
Acknowledgments: The authors would like to acknowledge the utilization of TCGA (https://tcga-data.nci.nih.gov),
cBioPortal (http://www.cbioportal.org), and UCSC Xena (http://www.xenabrowser.net) research network datasets
in this study.
Conflicts of Interest: The authors declare that there is no conflict of interest that could be perceived as prejudicing
the impartiality of this work.
References
1. Manna, P.R.; Stocco, D.M. Regulation of the steroidogenic acute regulatory protein expression: Functional
and physiological consequences. Curr. Drug Targets Immune Endocr. Metabol. Disord. 2005, 5, 93–108.
[CrossRef] [PubMed]
2. Manna, P.R.; Dyson, M.T.; Stocco, D.M. Regulation of the steroidogenic acute regulatory protein gene
expression: Present and future perspectives. Mol. Hum. Reprod. 2009, 15, 321–333. [CrossRef]
3. Papadopoulos, V.; Miller, W.L. Role of mitochondria in steroidogenesis. Best Pract. Res. Clin. Endocrinol.
Metab. 2012, 26, 771–790. [PubMed]
4. Manna, P.R.; Stetson, C.L.; Slominski, A.T.; Pruitt, K. Role of the steroidogenic acute regulatory protein in
health and disease. Endocrine 2016, 51, 7–21. [CrossRef] [PubMed]
5. Manna, P.R.; Ahmed, A.U.; Vartak, D.; Molehin, D.; Pruitt, K. Overexpression of the steroidogenic acute
regulatory protein in breast cancer: Regulation by histone deacetylase inhibition. Biochem. Biophys. Res.
Commun. 2019, 509, 476–482. [CrossRef] [PubMed]
6. Miller, W.L.; Bose, H.S. Early steps in steroidogenesis: Intracellular cholesterol trafficking. J. Lipid Res. 2011,
52, 2111–2135. [CrossRef]
7. Manna, P.R.; Dyson, M.T.; Eubank, D.W.; Clark, B.J.; Lalli, E.; Sassone-Corsi, P.; Zeleznik, A.J.; Stocco, D.M.
Regulation of steroidogenesis and the steroidogenic acute regulatory protein by a member of the cAMP
response-element binding protein family. Mol. Endocrinol. 2002, 16, 184–199. [CrossRef] [PubMed]
8. Miller, W.L.; Auchus, R.J. The molecular biology, biochemistry, and physiology of human steroidogenesis
and its disorders. Endocr. Rev. 2011, 32, 81–151. [CrossRef]
9. Manna, P.R.; Cohen-Tannoudji, J.; Counis, R.; Garner, C.W.; Huhtaniemi, I.; Kraemer, F.B.; Stocco, D.M.
Mechanisms of action of hormone sensitive lipase in mouse Leydig cells: Its role in the regulation of the
steroidogenic acute regulatory protein. J. Biol. Chem. 2013, 288, 8505–8518. [CrossRef] [PubMed]
10. Manna, P.R.; Stetson, C.L.; Daugherty, C.; Shimizu, I.; Syapin, P.J.; Garrel, G.; Cohen-Tannoudji, J.;
Huhtaniemi, I.; Slominski, A.T.; Pruitt, K.; et al. Up-regulation of steroid biosynthesis by retinoid signaling:
Implications for aging. Mech. Ageing. Dev. 2015, 150, 74–82. [CrossRef] [PubMed]
11. Slominski, A.T.; Manna, P.R.; Tuckey, R.C. On the role of skin in the regulation of local and systemic
steroidogenic activities. Steroids 2015, 103, 72–88. [CrossRef] [PubMed]
12. Slominski, A.; Semak, I.; Zjawiony, J.; Wortsman, J.; Li, W.; Szczesniewski, A.; Tuckey, R.C. The cytochrome
P450scc system opens an alternate pathway of vitamin D3 metabolism. FEBS J. 2005, 272, 4080–4090.
[CrossRef]
13. Slominski, A.T.; Li, W.; Kim, T.K.; Semak, I.; Wang, J.; Zjawiony, J.K.; Tuckey, R.C. Novel activities of CYP11A1
and their potential physiological significance. J. Steroid Biochem. Mol. Biol. 2015, 151, 25–37. [CrossRef]
[PubMed]You can also read