Prioritization of causal genes for coronary artery disease based on cumulative evidence from experimental and in silico studies - Nature
←
→
Page content transcription
If your browser does not render page correctly, please read the page content below
www.nature.com/scientificreports

            OPEN            Prioritization of causal genes for
                            coronary artery disease based
                            on cumulative evidence from
                            experimental and in silico studies
                            Alexandra S. Shadrina1,2 ✉, Tatiana I. Shashkova1,3,4, Anna A. Torgasheva1,2,
                            Sodbo Z. Sharapov1,2, Lucija Klarić5,6, Eugene D. Pakhomov1, Dmitry G. Alexeev1,
                            James F. Wilson6,7, Yakov A. Tsepilov1,2, Peter K. Joshi7 & Yurii S. Aulchenko2,8 ✉
                            Genome-wide association studies have led to a significant progress in identification of genomic loci
                            affecting coronary artery disease (CAD) risk. However, revealing the causal genes responsible for
                            the observed associations is challenging. In the present study, we aimed to prioritize CAD-relevant
                            genes based on cumulative evidence from the published studies and our own study of colocalization
                            between eQTLs and loci associated with CAD using SMR/HEIDI approach. Prior knowledge of candidate
                            genes was extracted from both experimental and in silico studies, employing different prioritization
                            algorithms. Our review systematized information for a total of 51 CAD-associated loci. We pinpointed
                            37 genes in 36 loci. For 27 genes we infer they are causal for CAD, and for 10 further genes we judge
                            them most likely causal. Colocalization analysis showed that for 18 out of these loci, association with
                            CAD can be explained by changes in gene expression in one or more CAD-relevant tissues. Furthermore,
                            for 8 out of 36 loci, existing evidence suggested additional CAD-associated genes. For the remaining 15
                            loci, we concluded that evidence for gene prioritization remains inconsistent, insufficient, or absent.
                            Our results provide deeper insights into the genetic etiology of CAD and demonstrate knowledge gaps
                            where further research is warranted.

                            Coronary artery disease (CAD) is the most prevalent cardiovascular disease, the major cause of mortality and
                            morbidity in both developed and developing countries1. This pathology is the manifestation of atherosclerosis
                            in the coronary arteries. CAD can lead to a variety of complications, including chest pain, myocardial infarction
                            (MI), arrhythmias and heart failure2. The etiology of CAD is multifactorial and involves a genetic predisposition
                            as well as dietary and other lifestyle risk factors3. The genetic component to CAD has long been recognized.
                            The Framingham Study demonstrated that positive family history is a strong risk factor for incident CAD4–6.
                            According to Swedish and Danish twin studies, the narrow-sense heritability of fatal CAD is about 40–60%7,8.
                            Today, it is widely accepted that much of the genetic component arises from the effect of many common alleles
                            associated with modest increases in CAD risk3,9. Genome-wide association studies demonstrated that the com-
                            mon variation accounts for 40–50% of heritability of MI/CAD10,11.
                                Genetic studies of CAD started from family-based linkage studies discovering monogenic drivers of CAD and
                            small candidate-gene studies which often provided controversial results. Development of high-throughput geno-
                            typing technologies and new statistical methods opened the era of genome-wide association studies (GWAS)12,13.
                            MI was among the very first traits studied with use of genome-wide association strategy already in 200214.

                            1
                             Laboratory of Theoretical and Applied Functional Genomics, Novosibirsk State University, Novosibirsk, 630090,
                            Russia. 2Laboratory of Recombination and Segregation Analysis, Institute of Cytology and Genetics, Novosibirsk,
                            630090, Russia. 3Department of Biological and Medical Physics, Moscow Institute of Physics and Technology,
                            Moscow, 117303, Russia. 4Research and Training Center on Bioinformatics, A.A. Kharkevich Institute for Information
                            Transmission Problems, Moscow, 127051, Russia. 5Genos Glycoscience Research Laboratory, Zagreb, Croatia. 6MRC
                            Human Genetics Unit, Institute of Genetics and Molecular Medicine, University of Edinburgh, Western General
                            Hospital, Edinburgh, EH4 2XU, Scotland, UK. 7Usher Institute, University of Edinburgh, Edinburgh, EH8 9AG,
                            Scotland, UK. 8PolyOmica, ‘s-Hertogenbosch, 5237 PA, The Netherlands. ✉e-mail: weiner.alexserg@gmail.com;
                            yurii@bionet.nsc.ru

Scientific Reports |   (2020) 10:10486 | https://doi.org/10.1038/s41598-020-67001-w                                                         1
www.nature.com/scientificreports/ www.nature.com/scientificreports
Currently, more than 160 loci have been identified robustly associated with this condition9,15. The progress in
this field has been fostered by establishing large international consortia, such as the Coronary ARtery DIsease
Genome-wide Replication and Meta-analysis (CARDIoGRAM) Consortium, the Coronary Artery Disease (C4D)
Genetics Consortium, and the Myocardial Infarction Genetics (MIGen) Consortium, as well as emergence of
large biobanks containing genetic and clinical information, such as UK Biobank, and the development of haplo-
type reference panels for genotype imputation. In parallel, whole-exome and whole-genome sequencing studies
revealed a set of CAD- and MI-promoting low-frequency variants16–20.
While we see major advances in unraveling genetic architecture of CAD, challenges remain in the annotation
of causal genes at identified loci9. The largest proportion (90%) of SNP-based heritability of MI/CAD is explained
by variants located in gene non-coding and intergenic regions, and only 10% resides within the gene coding
regions11. Furthermore, many CAD-associated loci contain several genes. Thus, elucidating the gene responsible
for the revealed association can be an arduous task. Filling the knowledge gaps on CAD-relevant genes is impor-
tant for understanding biological mechanisms underlying this disease and translating GWAS results into novel
treatment strategies.
Post-GWAS research, which aims at transition from GWAS signals to biological understanding, in particular
identification of specific genes and pathways, involves both experimental and in silico studies21. The latter are less
expensive and enable to narrow down the spectrum of candidate genes for subsequent experimental validation.
A range of computational tools and approaches for in silico gene prioritization are currently available, including
those based on data on the co-regulation of gene expression and reconstituted gene sets (DEPICT)22, potential
relationships between the genes based on published scientific literature (GRAIL)23, functional annotation data
from the Mouse Genome Database24, and others. An important tool for interpreting GWAS findings is the expres-
sion quantitative trait loci (eQTL) analysis25. Linking eQTL data with GWAS results can explain some of the asso-
ciations by the presence of regulatory polymorphisms that influence the disease through altering gene expression
in certain tissues. However, variants causative for the disease and changes in gene expression can simply be in
linkage disequilibrium with each other, so identification of a joint SNP is on its own insufficient. This issue can
be addressed using colocalization methods26–29. A method recently proposed by Zhu et al.27 involves summary
data-based Mendelian randomization (SMR) analysis, which provides evidence for pleiotropy or causation with
respect to the analyzed traits (e.g., disease and gene expression level), and heterogeneity in dependent instru-
ments (HEIDI) test, which distinguishes pleiotropy/causation from linkage disequilibrium (LD).
In the present study, we pursued two objectives. First, we applied SMR/HEIDI approach to prioritize the genes
at loci identified by two large genome-wide association meta-analyses30,31. Second, we performed an extensive
literature search to find the genes within these loci linked to CAD in experimental studies or prioritized based
on bioinformatics strategies. Our aim was to summarize and systematize this information and determine 1) the
genes that can be considered causal/the most likely causal for CAD and 2) the loci for which CAD-associated
genes remain unclear.
Methods
Selection of CAD-associated loci. We selected 51 loci robustly associated with CAD for which perform-
ing SMR/HEIDI analysis in our study was feasible. An algorithm we used to select the 51 loci is depicted in
Supplementary Fig. S1. Loci were selected from two large mixed-ancestry genome-wide association meta-analy-
ses: the study by Nikpay et al.30 (60,801 CAD cases and 123,504 controls) and the study by Howson et al.31 (88,192
CAD cases and 162,544 controls). The meta-analysis by Howson et al.31 included the CARDIoGRAMplusC4D
study (63,746 CAD cases and 130,681 controls), and the meta-analysis by Nikpay et al.30 contained a subset of
CARDIoGRAMplusC4D study participants (34,997 CAD cases and 49,512 controls). Thus, the samples analyzed
in Nikpay et al.30 and Howson et al.31 studies contained 84,509 shared individuals. The study by Howson et al.31
was based on the CardioMetabochip32 lacking complete genomic coverage. The meta-analysis by Nikpay et al.30
comprised subjects genotyped with genome-wide SNP arrays and involved 1000 Genomes-based imputation.
Howson et al. study31 was therefore nearly 1.4 times larger in size, while Nikpay et al. study30 had much higher
SNP coverage (9.4 million imputed variants in Nikpay et al. study30 vs. 79,070 SNPs available for the meta-analysis
in Howson et al. study31). In total, we extracted 61 loci from Howson et al. study31 and 35 loci from Nikpay et al.
study30 associated with CAD at a statistical significance threshold of P < 5.0e-08.
SMR/HEIDI tests depend on the LD structure of the reference sample, so deriving summary statistics
from mixed-ancestry cohorts is not appropriate. In our study, we focused on European ancestry individuals.
We required the selected CAD-associated loci to reach at least suggestive level of statistical significance in the
European ancestry datasets (that meant that at least one SNP in the region within ±250 kb around the lead SNP
derived from the mixed-ancestry meta-analyses had to be associated with CAD at P < 5.0e-07 in Europeans,
Supplementary Fig. S1). To check the loci selected from Howson et al. study31, we used summary statistics from
Howson et al. meta-analysis that involved European-ancestry studies (N = 221,568). Since Nikpay et al.30 did not
report GWAS results for European cohorts, for loci collected from that meta-analysis we used summary statistics
from the previously published CARDIoGRAM study (Schunkert et al.33, 22,233 CAD cases and 64,762 controls of
European descent; nearly 2.3 million imputed genotypes). Applying this criterion limited the number of selected
loci to 50 in Howson et al. study31 and to 17 in Nikpay et al. study30, respectively (Supplementary Table S1a,b).
Finally, we matched the loci derived from both datasets. The loci were considered similar if the distance
between the lead SNPs associated with CAD in Europeans was less than 250 kb (see Supplementary Fig. S1).
All 17 loci selected from Nikpay et al.30/CARDIoGRAM33 studies partially overlapped with those derived from
Howson et al. study31, and 16 of them were considered similar. Partially overlapping loci represented by lead SNPs
rs3103349 (derived from Howson et al. study31) and rs10455872 (derived from CARDIoGRAM study33) did not
meet our similarity criterion since the distance between SNPs rs3103349 and rs10455872 was 269 kb. Both loci
were therefore included in the analysis. Thus, we selected a total of 51 loci (±250 kb from lead SNPs associated
Scientific Reports | (2020) 10:10486 | https://doi.org/10.1038/s41598-020-67001-w 2www.nature.com/scientificreports/ www.nature.com/scientificreports
with CAD in the European datasets, Supplementary Fig. S1). The list of these loci is given in Supplementary
Table S1c.
Summary statistics for CAD were obtained from the following resources: (1) the CARDIoGRAMplusC4D
Consortium website (http://www.cardiogramplusc4d.org/; for data from Nikpay et al.30 and the CARDIoGRAM33
studies); (2) the PhenoScanner database (http://www.phenoscanner.medschl.cam.ac.uk; for data from Howson et
al. study31; now these data are available in the GRASP repository34, https://grasp.nhlbi.nih.gov/FullResults.aspx).
Data were downloaded in September 2017.
SMR/HEIDI analysis. SMR/HEIDI approach27 was used to prioritize the genes within CAD-associated loci
based on eQTL data. SMR/HEIDI compares patterns of SNP-trait associations in the loci between two GWAS (in
our case, GWAS for CAD and GWAS for gene expression). The analysis includes several steps of SNP filtration.
To pass the filtering, SNP must have the following properties: (1) being located in the studied locus; (2) present
in both GWAS for CAD and in the analysis of expression quantitative trait loci (cis-eQTL results); (3) having
MAF ≥ 0.03 in both datasets; (4) having squared Z-test value ≥ 10 in CAD GWAS. Those SNPs that meet criteria
(1), (2), (3), (4) and have the lowest P-value for the association with CAD are used as instrumental variable to
investigate relationships between the studied traits (hereinafter we define them as “top SNPs”).
SMR/HEIDI reveals the genes whose expression level may be affected by the same causal SNP that is associ-
ated with the studied condition. However, it is not able to identify this causal SNP. It can be either the top SNP
or any other polymorphism in strong LD with this top SNP. Due to incomplete overlap between SNPs studied
in different works, the top SNP does not necessarily represent a lead SNP within the locus that is associated with
CAD or gene expression level at the highest level of statistical significance.
SMR/HEIDI tests were performed for a total of 51 loci (±250 kb from lead SNPs associated with CAD in the
European datasets, Supplementary Fig. S1). GWAS summary statistics for CAD were derived from Howson et
al. European-ancestry meta-analysis31 (N = 221,568). Summary statistics for eQTLs were obtained from three
resources: GTEx version 7 database35 (https://gtexportal.org), CEDAR project29 (http://cedar-web.giga.ulg.
ac.be/), and Westra Blood eQTL study36 (http://cnsgenomics.com/software/smr/#eQTLsummarydata). In total,
we used data for 12 tissues and cell types: coronary and tibial artery, aorta, liver, and skeletal muscle (from the
GTEx), whole blood (from the GTEx and Westra Blood eQTL), and circulating CD4 + T lymphocytes, CD8 + T
lymphocytes, CD19 + B lymphocytes, CD14 + monocytes, CD15 + granulocytes, and platelets (from CEDAR).
We selected coronary and tibial artery, aorta, liver, and skeletal muscle tissue for the analysis because these tissues
were suggested as genetically causal for CAD37. Whole blood and peripheral blood mononuclear cells/platelets
were selected since atherosclerotic plaques are in direct contact with blood flow. Mononuclear cells infiltrate the
plaques, mediate inflammatory response and participate in atherosclerosis development and progression and also
trigger the thrombotic complications38,39. Platelets adhere to the damaged arteries and form mural thrombi40.
These cells contribute to atherosclerotic inflammation by releasing a number of immune-related molecules and
facilitating inflammatory cells recruitment41.
We considered that expression of a certain gene may be influenced by the same functional polymorphism as
that altering the CAD risk in case SMR test FDR waswww.nature.com/scientificreports/ www.nature.com/scientificreports
The fourth in silico study by Svishcheva et al.49 applied methods of gene-based association analysis using
two large datasets (the UK Biobank data and Myocardial Infarction Genetics and CARDIoGRAM Exome
meta-analysis). We checked whether CAD-associated genes revealed in that study are located in 51 loci selected
for our analysis. If yes, we attributed them to the corresponding loci.
In order to systematize information from all studies, we made a table containing data on 51 loci, including
rs-identifier and chromosomal position of the lead SNP, the gene nearest to the lead SNP (according to the NCBI
SNP database), the genes revealed in SMR/HEIDI analysis, the genes prioritized in previous studies (with the
scores where applicable) and candidate genes found in literature resources. Based on cumulative evidence from
multiple sources, we concluded, which genes can be considered causal/the most likely causal for CAD, for which
loci the role of additional genes can be proposed, and for which loci no conclusion can be made, or evidence is
absent.
It should be noted that in our study, we did not investigate whether the analyzed loci contain single or multiple
association signals. Thus, when choosing SNPs from the studies by Brænne et al.46, Lempiäinen et al.47, and van
der Harst et al.48, we did not make any restrictions on the LD between SNP prioritized in that works and the lead
GWAS SNPs. Similarly, we did not limit the top SNPs in the SMR/HEIDI analysis (the instrumental variable used
for investigating relationships between CAD and gene expression) only to those which are in LD with the lead
SNPs. However, we analyzed LD between all SNPs linked to genes at each locus using LDlink online tool (https://
analysistools.nci.nih.gov/LDlink/; data were obtained for European-ancestry populations) or PLINK 1.9 software
(https://www.cog-genomics.org/plink2/, based on 1000 Genomes phase 3 version 5 data for European ancestry
individuals with MAF ≥ 0.03 filtration). Cases where multiple signals were strongly suspected were discussed
separately.
Results
SMR/HEIDI analysis. We found 83 probes (related to 73 protein-coding genes, 2 pseudogenes, 7 noncoding
RNAs, and one uncharacterized probe HS.443185; listed in Table 1), whose expression levels in CAD-relevant
tissues and cells (coronary and tibial artery, aorta, liver, skeletal muscle37, blood, circulating lymphocytes, mono-
cytes, granulocytes, and platelets) are associated with the same causal variants that account for the association
between 32 out of 51 studied loci and CAD with FDRSMR < 0.05 and PHEIDI ≥ 0.001. Full results of SMR/HEIDI
analysis are presented in Supplementary Table S2. As far as we are aware, 29 of these genes – PSMA5 (locus #2),
DDX59-AS1 (locus #5), USP39 and GNLY (locus #10), FAM117B (locus #12), NME9 and ESYT3 (locus #13),
RP1-257A7.4 and RP1-257A7.5 (locus #18), RP1-283K11.3 and RP3-323P13.2 (locus #20), IFIT1 and IFIT5 (locus
#32), TMEM180 and ARL3 (locus #33), MAP3K11, CTSW, and FIBP (locus #34), RP11-563P16.1 (locus #35),
RP3-462E2.3 (locus #36), ERP29 (locus #37), OASL and COQ5 (locus #38), MORF4L1 (locus #43), PKD1L3,
DHX38, and DHODH (locus #45), C19ORF52 (locus #49), and EDEM2 (locus #50) – have never been previously
proposed as candidate genes for CAD.
For 8 loci (marked by rs4129267, rs10919065, rs12801636, rs3184504, rs441, rs7178051, rs12052058, and
rs867186 and numbered as #3, #4, #34, #36, #37, #43, #49, and #50, respectively, in Supplementary Table S1c),
the genes were revealed using two or three instrumental variables (“top SNPs”) that were in low or medium
LD with each other (Supplementary Table S3a). One or two of the top SNPs in each group were the same as the
lead SNP marking the locus or one tightly linked with it (r2 = 0.99 in European-ancestry populations according
to LDlink). The remaining top SNP in each group was in weak LD with the lead SNP, and association of 5 of
them with CAD did not reach a genome-wide level of statistical significance in the dataset used for our SMR/
HEIDI analysis (European-ancestry meta-analysis from Howson et al. study31; locus #4, rs10800418: P = 2.42e-
07; locus #34, rs644740: P = 7.44e-06; locus #37, rs653178: P = 1.21e-07; locus #49, rs17616661: P = 1.51e-05;
locus #50, rs1415771: P = 4.70e-06; Supplementary Table S3a). We checked the association of these SNPs with
CAD in the meta-analysis of CARDIoGRAMplusC4D and UK Biobank data48 (122,733 cases and 424,528 con-
trols). All these SNPs were either genome-wide significant in this dataset or very close to a genome-wide signifi-
cance level (rs10800418: P = 8.82e-11, rs644740: P = 1.12e-08, rs653178: P = 1.13e-23, rs17616661: P = 5.96e-08,
rs1415771: P = 9.91e-11). Thus, we speculate that the genes NME7, FIBP and CTSW, SH2B3, KANK2, and
EDEM2 identified using these polymorphisms may not be false positive findings. Nevertheless, the gene SH2B3
(locus #37, top SNP rs653178) likely came from the locus #36 partially overlapping with the locus #37. In the
locus #36, SMR/HEIDI analysis suggested the gene SH2B3 using the top SNP rs3184504, which is in high LD
(r2 = 0.95) with rs653178. SNP rs3184504 is the lead SNP in the locus #36 and is associated with СAD with
P = 3.71e-09 in the European-ancestry meta-analysis from Howson et al. study31 and with P = 1.03e-25 in the
CARDIoGRAMplusC4D/UK Biobank meta-analysis48.
The gene IL6R (locus #3 marked by rs4129267) was indicated in analyses of both semi-independent top SNPs,
rs4845625 and rs4129267 (r2 = 0.46 in European-ancestry populations according to LDlink). These polymor-
phisms represent lead SNPs in all-ancestry and European-ancestry meta-analyses reported by Howson et al.31,
respectively, and are associated with CAD with P-value less than 5e-10 (Supplementary Table S1a). This suggests
at least two independent association signals, both of which modulate IL6R expression.
In the locus #25 marked by rs11204085, the top SNP rs1569209 used to identify the gene LPL was in weak LD
with the lead SNP (Supplementary Table S2a; rs11204085-rs1569209 r2 = 0.10 in European-ancestry populations).
Rs1569209 was associated with CAD with P = 2.29e-06 in the European-ancestry meta-analysis from Howson et
al. study31, however, it reached a genome-wide significant level in the meta-analysis of CARDIoGRAMplusC4D
and UK Biobank data48 (P = 1.81e-09). We therefore do not consider the gene LPL found using this polymor-
phism as a false positive result. Moreover, the role LPL in CAD was supported by experimental and in silico
studies (Supplementary Table S4).
Scientific Reports | (2020) 10:10486 | https://doi.org/10.1038/s41598-020-67001-w 4www.nature.com/scientificreports/ www.nature.com/scientificreports
Genes prioritized previously based on
Nearest† known Genes prioritized by Candidate genes bioinformatics approaches46–48 and found
*
Lead SNP ¥
Chr: position gene SMR/HEIDI‡ from literature** in gene-based association analysis49 Conclusion
▪ Lempiäinen et al.47, score range 2-54
PLPP3 (PAP2B, ▪ PLPP3 (PAP2B, PLPP3 (PAP2B) (total score = 10) PLPP3 (PAP2B) is the
1 rs17114036 1: 56 962 821 —
PPAP2B) PPAP2B) ▪ Svishcheva et al.49 causal gene.
PLPP3 (PAP2B) (two datasets)
Brænne et al.46, score range 1-11
▪ CELSR2 (total score = 5) ←
▪ SORT1 (total score = 4) ←
▪ PSRC1 (total score = 4) ←
▪ MYBPHL (total score = 2)
Lempiäinen et al.47, score range 2-54
▪ PSRC1 ← ▪ SORT1 ▪ CELSR2 (total score = 10) ← SORT1 is the causal gene.
2 rs602633 1: 109 821 511 PSRC1 ▪ CELSR2 ← ▪ PSRC1 van der Harst et al.48 PSRC1 and CELSR2 might
▪ PSMA5 ← ▪ CELSR2 ▪ SORT1¶ ← also be involved.
▪ CELSR2 ←
▪ PSRC1 ←
▪ SARS ←
▪ ATXN7L2 ←
Svishcheva et al.49
▪ CELSR2 (two datasets)
Brænne et al.46, score range 1-11
▪ IL6R (total score = 5) ←
▪ UBAP2L (total score = 2) ←
3 rs4129267 1: 154 426 264 IL6R ▪ IL6R ←, ← ← ▪ IL6R ▪ ATP8B2 (total score = 2) ← IL6R is the causal gene.
▪ CHTOP (total score = 1) ←
Lempiäinen et al.47, score range 2-54
▪ IL6R (total score = 10) ←, ← ←
Brænne et al.46, score range 1-11
▪ ATP1B1 ← ← ▪ ATP1B1 (total score = 4) ← ATP1B1 is the most likely
4 rs10919065 1: 169 093 557 ATP1B1 ▪ ATP1B1
▪ NME7 ←, ← ← ▪ NME7 (total score = 2) ← causal gene.
▪ CCDC181 (total score = 1) ←
Brænne et al.46, score range 1-11
▪ DDX59-AS1 (RP11- ▪ KIF14 (total score = 4) ←
92G12.3) ← ▪ CAMSAP2 (total score = 2) ←
5 rs6700559 1: 200 646 073 DDX59-AS1 ▪ DDX59 ← — ▪ DDX59 (total score = 2) ← Evidence is inconsistent.
▪ CAMSAP2 van der Harst et al.48
(CAMSAP1L1) ← ▪ CAMSAP2¶ ←
▪ DDX59 ←
Brænne et al.46, score range 1-11
▪ IPO9 (total score = 4) ←
Evidence is inconsistent.
▪ IPO9 ← ▪ LMOD1 (total score = 2) ←
6 rs2820315 1: 201 872 264 LMOD1 ▪ LMOD1 LMOD1 and IPO9 can be
▪ LMOD1 ← ▪ SHISA4 (total score = 1) ←
involved.
Lempiäinen et al.47, score range 2-54
▪ IPO9 (total score = 10) ←
7 rs16986953 2: 19 942 473 LINC00954 — — — No evidence.
Lempiäinen et al.47, score range 2-54
▪ APOB (total score = 32)
8 rs515135 2: 21 286 057 APOB — ▪ APOB APOB is the causal gene.
Svishcheva et al.49
▪ APOB (one dataset)
Lempiäinen et al.47, score range 2-54
▪ ABCG8 ▪ ABCG8 (total score = 34) ABCG8/ABCG5 are the
9 rs6544713 2: 44 073 881 ABCG8 —
▪ ABCG5 Svishcheva et al.49 causal genes.
▪ ABCG8 (two datasets)
Brænne et al.46, score range 1-11
▪ GGCX (total score = 5) ←
▪ VAMP5 (total score = 5) ←
▪ GGCX ←
▪ VAMP8 (total score = 5) ←
▪ VAMP5 ←
▪ GGCX Lempiäinen et al.47, score range 2-54
10 rs1561198 2: 85 809 989 VAMP8 ▪ VAMP8 ← Evidence is inconsistent.
▪ VAMP8 ▪ VAMP8 (total score = 42) ←
▪ USP39 ←
Svishcheva et al.49
▪ GNLY ←
▪ MAT2A (one dataset)
▪ GGCX (one dataset)
▪ VAMP5 (one dataset)
Lempiäinen et al.47, score range 2-54
11 rs2252641 2: 145 801 461 TEX41 — ▪ ZEB2 Evidence is inconsistent.
▪ TEX41 (total score = 2)
Brænne et al. , score range 1-11
46
▪ NBEAL1 (total score = 4) ←
▪ WDR12 (total score = 4) ←
▪ CARF (total score = 3) ←
▪ ICA1L ←
▪ ALS2CR8 (total score = 2) ←
▪ CARF ←
12 rs2351524 2: 203 880 992 NBEAL1 ▪ WDR12 ▪ ICA1L (total score = 1) ← Evidence is inconsistent.
▪ NBEAL1 ←
Lempiäinen et al.47, score range 2-54
▪ FAM117B ←
▪ ICA1L (total score = 10) ←
Svishcheva et al.49
▪ NBEAL1 (two datasets)
▪ WDR12 (two datasets)
Continued
Scientific Reports | (2020) 10:10486 | https://doi.org/10.1038/s41598-020-67001-w 5www.nature.com/scientificreports/ www.nature.com/scientificreports
Genes prioritized previously based on
Nearest† known Genes prioritized by Candidate genes bioinformatics approaches46–48 and found
*
Lead SNP ¥
Chr: position gene SMR/HEIDI‡ from literature** in gene-based association analysis49 Conclusion
Brænne et al.46, score range 1-11
▪ MRAS (total score = 5) ←
▪ MRAS ← ▪ CEP70 (total score = 2) ←
13 rs2306374 3: 138 119 952 MRAS ▪ NME9 ← ▪ MRAS Lempiäinen et al.47, score range 2-54 MRAS is the causal gene.
▪ ESYT3 ← ▪ MRAS (total score = 34) ←
Svishcheva et al.49
▪ MRAS (one dataset)
Lempiäinen et al.47, score range 2-54
▪ EDNRA (ETA) (total score = 34)
14 rs1429141 4: 148 288 067 MIR548G — ▪ EDNRA (ETA) EDNRA is the causal gene.
Svishcheva et al.49
▪ EDNRA (ETA) (one dataset)
Lempiäinen et al.47, score range 2-54 GUCY1A3 is the causal
15 rs7692387 4: 156 635 309 GUCY1A1 ▪ GUCY1A3 ← ▪ GUCY1A3
▪ GUCY1A3 (total score = 42) ← gene.
SLC22A4 Lempiäinen et al.47, score range 2-54
16 rs273909 5: 131 667 353 — — Insufficient evidence.
MIR3936HG ▪ SLC22A5 (total score = 10)
van der Harst et al. 48
17 rs246600 5: 142 516 897 ARHGAP26 — — Insufficient evidence.
▪ HMHB1
Lempiäinen et al. , score range 2-54
47
▪ PHACTR1 (total score = 2) ←, ← ←
van der Harst et al.48
▪ RP1-257A7.5 ← ▪ EDN1¶ ← ←
PHACTR1 is the causal
18 rs7751826 6: 12 900 977 PHACTR1 ▪ RP1-257A7.4 ← ▪ PHACTR1 ▪ TBC1D7 ← ←
gene.
▪ PHACTR1 ← ▪ PHACTR1 ← ←
▪ GFOD1 ← ←
Svishcheva et al.49
▪ PHACTR1 (two datasets)
Lempiäinen et al.47, score range 2-54
19 rs10947789 6: 39 174 922 KCNK5 — — Insufficient evidence.
▪ KCNK5 (total score = 2)
▪ TCF21 ← TCF21 is the causal gene.
Lempiäinen et al.47, score range 2-54
20 rs2327429 6: 134 209 837 TARID ▪ RP3-323P13.2 ← ▪ TCF21 RP3-323P13.2 might also
▪ TCF21 (total score = 10) ←
▪ RP1-283K11.3 ← be involved.
Brænne et al.46, score range 1-11
▪ SLC22A3 (total score = 5) ← ←
▪ AL591069.5 (total score = 1) ← ←
Lempiäinen et al.47, score range 2-54
▪ LPA (total score = 54)
▪ LPAL2 pseudogene (total score = 10) ← ←
LPA is the causal gene.
▪ IGF2R (total score = 2)
SLC22A3, SLC22A2,
21 rs3103349# 6: 160 740 721 SLC22A3 ▪ LPA ▪ LPA (APOA) ▪ SLC22A2 (total score = 2)
SLC22A1 might also be
▪ SLC22A3 (total score = 2)
involved.
Svishcheva et al.49
▪ LPA (two datasets)
▪ SLC22A1 (two datasets)
▪ SLC22A2 (two datasets)
▪ SLC22A3 (two datasets)
▪ IGF2R (one dataset)
Brænne et al.46, score range 1-11
▪ PLG (total score = 6) ←
▪ SLC22A3 (total score = 5) ← ←
▪ LPAL2 pseudogene (total score = 4) ←
▪ AL591069.5 (total score = 1) ← ←
Lempiäinen et al.47, score range 2-54
LPA is the causal gene.
▪ LPA (total score = 54)
22 rs10455872# 6: 161 010 118 LPA ▪ LPA ← ← ▪ LPA (APOA) PLG and SLC22A3 might
▪ PLG (total score = 46) ←
also be involved.
▪ LPAL2 pseudogene (total score = 10) ← ←
▪ SLC22A3 (total score = 2)
Svishcheva et al.49
▪ SLC22A3 (two datasets)
▪ LPA (two datasets)
▪ PLG (two datasets)
Brænne et al.46, score range 1-11
▪ ZC3HC1 (NIPA) (total score = 4) ←
Lempiäinen et al.47, score range 2-54
▪ ZC3HC1 (NIPA) (total score = 22) ← ZC3HC1 (NIPA) is the
▪ KLHDC10 van der Harst et al.48 most likely causal gene.
23 rs11556924 7: 129 663 496 ZC3HC1(NIPA) ▪ KLHDC10 ←
▪ ZC3HC1 (NIPA) ▪ ZC3HC1¶ ← KLHDC10 might also be
▪ NRF1 ← involved.
▪ KLF14 ←
Svishcheva et al.49
▪ ZC3HC1 (one dataset)
Brænne et al.46, score range 1-11
▪ TBXAS1 (total score = 5)
TBXAS1 is the most likely
24 rs10237377 7: 139 757 136 PARP12 — ▪ TBXAS1 Lempiäinen et al.47, score range 2-54
causal gene.
▪ PARP12 (total score = 10) ←
▪ TBXAS1 (total score = 10) ←
Continued
Scientific Reports | (2020) 10:10486 | https://doi.org/10.1038/s41598-020-67001-w 6www.nature.com/scientificreports/ www.nature.com/scientificreports
Genes prioritized previously based on
Nearest† known Genes prioritized by Candidate genes bioinformatics approaches46–48 and found
*
Lead SNP ¥
Chr: position gene SMR/HEIDI‡ from literature** in gene-based association analysis49 Conclusion
Brænne et al.46, score range 1-11
▪ LPL (total score = 8) ←
Lempiäinen et al.47, score range 2-54
25 rs11204085 8: 19 940 796 SLC18A1 ▪ LPL ▪ LPL LPL is the causal gene.
▪ LPL (total score = 42) ←
Svishcheva et al.49
▪ LPL (one dataset)
26 rs2954032 8: 126 493 392 TRIB1 — ▪ TRIB1 — TRIB1 is the causal gene.
Brænne et al.46, score range 1-11
▪ CDKN2B (total score = 8) ←, ← ←
▪ CDKN2A (total score = 5) ←
Lempiäinen et al.47, score range 2-54
▪ CDKN2B (total score = 9) ←
CDKN2B-AS1 is the
▪ CDKN2B-AS1 (total score = 2) ← ←
CDKN2B-AS1 ▪ CDKN2B-AS1 causal gene, which
27 rs3218020 9: 21 997 872 — van der Harst et al.48
(ANRIL) (ANRIL) regulates CDKN2B and
▪ CDKN2B¶ ← ← ←
CDKN2A expression.
▪ MTAP← ← ←
Svishcheva et al.49
▪ CDKN2B (two datasets)
▪ CDKN2A (two datasets)
▪ MTAP (one dataset)
Lempiäinen et al.47, score range 2-54
▪ DDX31 (total score = 8) ←
▪ SURF1 (total score = 8) ←
▪ SURF1 ← ▪ ABO
28 rs579459 9: 136 154 168 ABO ▪ SURF6 (total score = 8) ← Evidence is inconsistent.
▪ ABO ← ▪ ADAMTS13
Svishcheva et al.49
▪ ABO (one dataset)
▪ ADAMTS13 (one dataset)
Brænne et al.46, score range 1-11
▪ JCAD (KIAA1462) (total score = 6) ←
JCAD ▪ JCAD Lempiäinen et al.47, score range 2-54
29 rs2505083 10: 30 335 122 ▪ JCAD (KIAA1462) ← JCAD is the causal gene.
(KIAA1462) (KIAA1462) ▪ JCAD (KIAA1462) (total score = 6) ←
Svishcheva et al.49
▪ JCAD (KIAA1462) (one dataset)
30 rs10793513 10: 44 494 546 LINC00841 — — — No evidence.
31 rs523297 10: 44 756 557 CXCL12 — ▪ CXCL12 — CXCL12 is the causal gene.
Brænne et al.46, score range 1-11
▪ LIPA (total score = 9) ←
▪ LIPA ←
Lempiäinen et al.47, score range 2-54
32 rs2246833 10: 91 005 854 LIPA ▪ IFIT1 ← ▪ LIPA LIPA is the causal gene.
▪ LIPA (total score = 46) ←
▪ IFIT5 ←
Svishcheva et al.49
▪ LIPA (one dataset)
Brænne et al.46, score range 1-11
▪ NT5C2 (total score = 5) ←
▪ TMEM180
▪ CNNM2 (total score = 4) ←
(MFSD13A) ←
Lempiäinen et al.47, score range 2-54
BORCS7-ASMT ▪ ARL3 ← CYP17A1 is the most
33 rs11191447 10: 104 652 323 ▪ CYP17A1 ▪ CYP17A1 (total score = 34) ←
AS3MT ▪ NT5C2 ← likely causal gene.
Svishcheva et al.49
▪ MARCKSL1P1
▪ CYP17A1 (one dataset)
pseudogene ←
▪ CNNM2 (one dataset)
▪ AS3MT (one dataset)
Brænne et al.46, score range 1-11
▪ RELA (total score = 6) ←
▪ SIPA1 (total score = 4) ←
▪ SIPA1 ←
OVOL1 (total score = 2) ←
▪ MAP3K11 ←
34 rs12801636 11: 65 391 317 PCNX3 ▪ RELA ▪ PCNXL3 (total score = 1) ← Evidence is inconsistent.
▪ CTSW ← ←
Lempiäinen et al.47, score range 2-54
▪ FIBP ← ←
▪ RELA (total score = 40) ←
van der Harst et al.48
▪ EHBP1L1¶ ←
▪ PDGFD ← van der Harst et al.48
35 rs974819 11: 103 660 567 MIR4693 ▪ PDGFD PDGFD is the causal gene.
▪ RP11-563P16.1 ← ▪ PDGFD¶ ←
Brænne et al.46, score range 1-11
▪ SH2B3 (total score = 5) ← ←
▪ SH2B3 ← ← ▪ ATXN2 (total score = 4) ← ←
SH2B3 is the most likely
▪ TMEM116 ← ▪ FLJ21127 (total score = 1) ← ←
▪ SH2B3 (LNK) causal gene.
36 rs3184504 §
12: 111 884 608 SH2B3 (LNK) ▪ ALDH2 ← Lempiäinen et al.47, score range 2-54
▪ ATXN2 ATXN2 might also be
▪ MAPKAPK5 ← ▪ SH2B3 (total score = 14) ← ←
involved.
▪ RP3-462E2.3 ← Svishcheva et al.49
▪ ATXN2 (two datasets)
▪ SH2B3 (one dataset)
Continued
Scientific Reports | (2020) 10:10486 | https://doi.org/10.1038/s41598-020-67001-w 7www.nature.com/scientificreports/ www.nature.com/scientificreports
Genes prioritized previously based on
Nearest† known Genes prioritized by Candidate genes bioinformatics approaches46–48 and found
*
Lead SNP ¥
Chr: position gene SMR/HEIDI‡ from literature** in gene-based association analysis49 Conclusion
Brænne et al.46, score range 1-11
▪ ALDH2 (total score = 6) ←
▪ SH2B3 (total score = 5) ←
▪ TMEM116 (total score = 4) ←
▪ TMEM116 ←
▪ BRAP (total score = 4) ←
▪ ERP29 ← ▪ ATXN2
▪ MAPKAPK5 (total score = 4) ←
37 rs441
§
12: 112 228 849 ALDH2 ▪ SH2B3 ▪ ALDH2 Evidence is inconsistent.
▪ HECTD4 (total score = 2) ←
▪ ALDH2 ← ▪ MAPKAPK5
▪ C12ORF30 (total score = 2) ←
▪ MAPKAPK5 ←
Svishcheva et al.49
▪ ATXN2 (two datasets)
▪ TMEM116 (one dataset)
▪ NAA25 (one dataset)
Brænne et al.46, score range 1-11
▪ OASL ←
▪ HNF1A (total score = 4) ← ← HNF1A is the most likely
38 rs2258287 12: 121 454 313 C12ORF43 ▪ C12ORF43 ← ▪ HNF1A
Lempiäinen et al.47, score range 2-54 causal gene.
▪ COQ5
▪ C12ORF43 (total score = 8) ← ←
Brænne et al.46, score range 1-11
▪ SCARB1 (total score = 6) ←
Lempiäinen et al.47, score range 2-54
SCARB1 is the causal
39 rs11057830 12: 125 307 053 SCARB1 — ▪ SCARB1 ▪ SCARB1 (total score = 34) ←
gene.
▪ DHX37 (total score = 2)
Svishcheva et al.49
▪ SCARB1 (one dataset)
Lempiäinen et al.47, score range 2-54
40 rs9319428 13: 28 973 621 FLT1 (VEGFR1) — ▪ FLT1 (VEGFR1) FLT1 is the causal gene.
▪ FLT1 (total score = 34)
Brænne et al. , score range 1-11
46
▪ IRS2 (total score = 4)
Lempiäinen et al.47, score 2-54
▪ ANKRD10 (total score = 8) ←
▪ COL4A2, COL4A2 and COL4A1 are
41 rs9515203 13: 111 049 623 COL4A2 — ▪ COL4A1 (total score = 2) ← ←
COL4A1 the causal genes.
▪ COL4A2 (total score = 2) ←, ← ←
Svishcheva et al.49
▪ COL4A2 (two datasets)
▪ COL4A1 (one dataset)
Brænne et al.46, score range 1-11
▪ YY1 (total score = 6) ←
HHIPL1 is the most likely
42 rs2895811 14: 100 133 942 HHIPL1 ▪ HHIPL1 ▪ EML1 (total score = 2)
causal gene.
Lempiäinen et al.47, score 2-54
▪ HHIPL1 (total score = 6) ←
Brænne et al.46, score range 1-11
▪ ADAMTS7 (total score = 7) ← ←,
←←←
▪ WDR61 (total score = 2) ← ←
▪ ADAMTS7 ←
Lempiäinen et al.47, score range 2-54
▪ CTSH ←
▪ ADAMTS7 (total score = 38) ← ← ← ADAMTS7 is the causal
43 rs7178051 15: 79 118 296 ADAMTS7 ▪ RP11-160C18.2 ▪ ADAMTS7
▪ CTSH (total score = 8) gene.
pseudogene ←
van der Harst et al.48
▪ MORF4L1 ←
▪ ADAMTS7 ← ← ← ←
▪ RASGRF1 ← ← ← ←
Svishcheva et al.49
▪ ADAMTS7 (two datasets)
Brænne et al.46, score range 1-11
▪ FURIN (total score = 8) ←
▪ FES (total score = 7) ←
▪ MAN2A2 (total score = 3) ←
▪ FURIN ← FURIN is the causal gene.
Lempiäinen et al.47, score range 2-54
44 rs17514846 15: 91 416 550 FURIN ▪ FES ← ▪ FURIN FES might also be
▪ FURIN (total score = 10) ←
▪ MAN2A2 ← involved.
▪ FES (total score = 10) ←
Svishcheva et al.49
▪ FURIN (two datasets)
▪ FES (one dataset)
▪ HP ←
▪ DHX38 ← Svishcheva et al.49 HP is the most likely
45 rs1050362 16: 72 130 815 DHX38 ▪ HP
▪ DHODH ← ▪ HPR (one dataset) causal gene.
▪ PKD1L3 ←
Lempiäinen et al.47, score range 2-54
▪ SMG6 ▪ SRR (total score = 8)
46 rs170041 17: 2 170 216 SMG6 — Evidence is inconsistent.
▪ SRR Svishcheva et al.49
▪ SMG6 (two datasets)
▪ PEMT
▪ SREBF1 Lempiäinen et al.47, score range 2-54 Evidence is inconsistent.
▪ SREBF1 (SREBP1) ←
47 rs12936587 17: 17 543 722 RAI1 (SREBP1) ▪ SREBF1 (total score = 40) ← PEMT, SREBF1, and
▪ PEMT ←
▪ MIR33B (hsa- ▪ PEMT (total score = 40) ← MIR33B can be involved.
mir-33b)
Brænne et al.46, score range 1-11
PECAM1 is the causal
48 rs2070783 17: 62 406 971 PECAM1 ▪ PECAM1 ← ▪ PECAM1 ▪ PECAM1 (total score = 4) ←
gene.
▪ POLG2 (total score = 3) ←
Continued
Scientific Reports | (2020) 10:10486 | https://doi.org/10.1038/s41598-020-67001-w 8www.nature.com/scientificreports/ www.nature.com/scientificreports
Genes prioritized previously based on
Nearest† known Genes prioritized by Candidate genes bioinformatics approaches46–48 and found
*
Lead SNP ¥
Chr: position gene SMR/HEIDI‡ from literature** in gene-based association analysis49 Conclusion
Brænne et al.46, score range 1-11
▪ KANK2 (total score = 5) ← ←
▪ SMARCA4 (total score = 4) ←
▪ ANKRD25 (total score = 2) ← ←
▪ SMARCA4 ← Lempiäinen et al.47, score range 2-54
▪ LDLR LDLR is the causal gene.
▪ CARM1 ← ▪ LDLR (total score = 35) ←
49 rs12052058 19: 11 159 525 SMARCA4 ▪ SMARCA4 SMARCA4 and CARM1
▪ C19ORF52 ← ▪ CARM1 (total score = 40) ←, ← ← ←
▪ CARM1 might also be involved.
▪ KANK2 ▪ SMARCA4 (total score = 40) ←, ← ← ←
▪ C19ORF38 (total score = 10) ← ← ←
Svishcheva et al.49
▪ LDLR (two datasets)
▪ SMARCA4 (one dataset)
Brænne et al.46, score range 1-11
▪ PROCR (total score = 8) ←
▪ MYH7B (total score = 5) ←
▪ TRPC4AP (total score = 3) ←
▪ EIF6 (total score = 3) ←
▪ RBL1 (total score = 3) ←
▪ TRPC4AP ← ▪ ROMO1 (total score = 2) ←
PROCR, ▪ EIF6 ← ▪ ITGB4BP (total score = 2) ←
PROCR is the most likely
50 rs867186 20: 33 764 554 MMP24-AS1- ▪ ITGB4BP ← ▪ PROCR (EPCR) ▪ FLJ25841 (total score = 1) ←
causal gene.
EDEM2 ▪ EDEM2 ← ← ▪ MT1P3 (total score = 1) ←
▪ HS.443185 ← ← van der Harst et al.48
▪ PROCR¶ ←
▪ TRPC4AP¶ ←
▪ GGT7 ←
▪ EDEM2 ←
▪ NCOA6 ←
▪ HMGB3P1 ←
Lempiäinen et al.47, score range 2-54
▪ SON (total score = 8)
▪ MRPS6 KCNE2 is the most likely
51 rs9982601 21: 35 599 128 LINC00310 ▪ KCNE2 (MIRP1) van der Harst et al.48
▪ KCNE2 causal gene.
▪ MRPS6¶ ←
▪ SLC5A3¶ ←
Table 1. Genes in 51 CAD-associated loci (±250 kb around the lead SNP) proposed to be causal according to
different lines of evidence. Alternative gene names or non-coding RNA names are given in parenthesis after
official gene symbols. Literature overview for each candidate gene found in literature sources is provided
in Supplementary Table S4. In the studies46–49, possible candidate genes were linked to the prioritized CAD-
associated SNPs (data on those SNPs located in the51 studied loci can be found in Supplementary Table S3b).
Arrows near gene names indicate that these genes have been linked to the same prioritized SNP in the locus
or to SNPs in high LD with each other (r2 ≥ 0.8; Supplementary Table S3c). If there are two or more groups of
such genes in the locus, single arrow indicates the genes linked to one SNP; double, triple, and quadruple arrows
– genes linked to other SNPs (e.g., in locus 43). We also marked with arrows the genes found in SMR/HEIDI
analysis if the top SNP (instrumental variable used for investigating relationships between gene expression
and CAD) was the same or in high LD (r2 ≥ 0.8; Supplementary Table S3d) with SNPs prioritized in other
studies. ¥Loci for the analysis in our study were defined as regions within ±250 kb around these lead SNPs (see
Supplementary Table S1c). *Chromosome: position of the lead SNP on the chromosome according to GRCh37.
p13 †Nearest gene according to the NCBI dbSNP database (https://www.ncbi.nlm.nih.gov/snp/) ‡Information
on whether increased gene expression in CAD-relevant tissue is associated with the increased or decreased
CAD risk is given in Supplementary Table S2a. **Candidate genes with the most compelling evidence for their
role in CAD according to literature data are shown in bold. ¶Converging evidence of a potential functional
SNP-gene mechanism (demonstrated in the study by van der Harst et al.48). #, §These pairs of loci are overlapping
and contain partially the same genes. Since the distance between the lead SNPs rs3103349–rs10455872 and
rs3184504–rs441 was > 250 kb (269,4 kb and 344,2 kb, respectively), SMR/HEIDI analysis was performed for
each locus (±250 kb around the lead SNP) separately. The genes prioritized based on literature data and revealed
in the gene-based association analysis49, if located in two loci in the pair, were attributed to both. Similarly, if the
CAD-associated SNPs prioritized in the studies by Brænne et al.46, Lempiäinen et al.47, and van der Harst et al.48
were located in two loci in the pair, we attributed the genes linked with these SNPs to both loci.
Cumulative evidence on CAD-associated genes from different studies. The list of genes proposed
to be causal for CAD according to different lines of evidence is given in Table 1. Literature overview for each gene
suggested by experimental studies is provided in the extended version of this table – Supplementary Table S4.
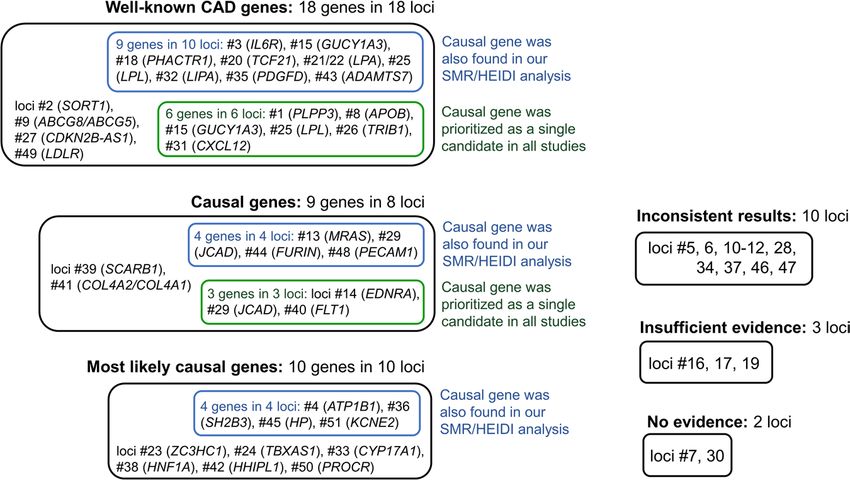
Well-known CAD genes. We analyzed published data and found 18 genes in 18 loci, whose role in CAD and
CAD-related processes was strongly supported by experimental studies and/or has already been known before
publication of GWAS for CAD. These genes are PLPP3 (also known as PAP2B or PPAP2B, locus #1), SORT1 (locus
#2), IL6R (locus #3), APOB (locus #8), ABCG8/ABCG5 (locus #9), GUCY1A3 (locus #15), PHACTR1 (locus #18),
TCF21 (locus #20), LPA (also known as APOA, overlapping loci #21 and #22), LPL (locus #25), TRIB1 (locus
#26), CDKN2B-AS1 (CDKN2B antisense RNA also known as ANRIL, locus #27), CXCL12 (locus #31), LIPA
(locus #32), PDGFD (locus #35), ADAMTS7 (locus #43), and LDLR (locus #49). The products of these genes
Scientific Reports | (2020) 10:10486 | https://doi.org/10.1038/s41598-020-67001-w 9www.nature.com/scientificreports/ www.nature.com/scientificreports
are involved in lipid metabolism, inflammation, nitric oxide signaling, cell proliferation and apoptosis, vascular
remodeling, and regulation of expression of other CAD-relevant genes.
For 9 out of 18 genes (IL6R, GUCY1A3, PHACTR1, TCF21, LPA, LPL, LIPA, PDGFD, ADAMTS7; 10 loci, LPA
corresponds to the loci #21 and #22) we also obtained consistent evidence from SMR/HEIDI analysis, indicating
that the effects of CAD-associated functional polymorphisms located in the loci containing these genes may be
mediated by gene expression. However, data on the expression of ABCG8 was available only for liver, and we
therefore avoid making any conclusions on eQTL effects for this gene. For the remaining well-known CAD genes
(PLPP3, SORT1, APOB, ABCG5, TRIB1, CDKN2B-AS1, CXCL12, and LDLR), our analysis did not support that
their expression levels are affected by the same functional variants that are associated with CAD. Several hypothe-
ses can be put forward to explain these results. First, mechanisms other than expression changes may underlie the
association between these genes and CAD (i.e., the presence of missense polymorphisms altering the properties
of the encoded proteins). Second, CAD-relevant expression changes can occur in tissues/cells, or developmental
stages other than those included in our analysis. Third, the absence of statistically significant results in the colo-
calization analysis does not allow to rule out expression-mediated effects. Genes influencing the trait through
expression could be missed due to statistical power limitations/strict statistical significance threshold set in the
analyses or due to limitations specific to the input dataset (e.g., incomplete data or possible errors). Besides this,
per-SNP sample sizes were not available in the Westra eQTL dataset36, and we estimated the eQTL effect sizes
from Z-statistics without taking into account per-SNP sample size differences, which could lead to the additional
variation in the effect size estimates27. Finally, in case of multiple association signals, the HEIDI test may errone-
ously reject the null hypothesis and disregard the results on the genes whose expression is actually related to the
disease. In an extreme scenario where the two causal variants (e.g., affecting CAD and gene expression) are in
perfect LD, pleiotropy and linkage disequilibrium are indistinguishable by any statistical test27. Thus, it is possible
that our colocalization analysis could miss some CAD-relevant genes.
Fifteen out of 18 well-known CAD genes (all except ABCG5, TRIB1 and CXCL12) were also prioritized in
at least one of the four previously published in silico studies46–49. Thus, only for three genes evidence for their
role in CAD came only from experimental works. It is noteworthy that among the remaining well-known CAD
genes identified in both experimental and in silico (our and/or other) studies, only the genes PLPP3, APOB,
GUCY1A3, and LPL were proposed as single candidates. For ABCG8/ABCG5, bioinformatic studies prioritized
only ABCG8, while literature data support CAD-related effects of both (products of these genes have closely
related function: they form heterodimer that limits intestinal absorption and facilitates biliary secretion of cho-
lesterol)50,51. For other loci, bioinformatic studies prioritized from 2 to 7 genes (median = 5). We presented all
these genes in Table 1 and Supplementary Table S4 regardless of scores given to them in studies46,47, LD between
a lead SNP marking a locus and SNPs that were used to prioritize these genes in studies46–48 (data on LD are given
in Supplementary Table S3b), and LD between lead SNPs and “top SNPs” from SMR/HEIDI analysis (data on LD
are given in Supplementary Table S2a).
We suppose that many of the multiple genes that were simultaneously prioritized in the same loci are not
specific for CAD. For instance, the genes IFIT1 and IFIT5 encoding interferon-induced antiviral RNA-binding
proteins, which were revealed in SMR/HEIDI along with LIPA (locus #32), may be not causal for CAD. It is pos-
sible that the locus #32 contains a regulatory polymorphism (or polymorphisms in very strong LD), which alters
the expression of both LIPA and IFIT1/IFIT5. Its causal effect on CAD can be explained by modulation of LIPA
expression, while effects on IFIT1/IFIT5 expression seem to be pleiotropy.
However, filtering out all of these “unspecific” genes may be too strict approach. It is not necessary that a
single causal gene explains association between a locus and CAD. In fact, each locus can contain more than one
independent association signal, and each association signal can realize its effect via more than one causal gene
(as well as each causal gene can be affected by more than one functional CAD-associated polymorphism). In
our opinion, loci for which multiple studies prioritized the same additional genes deserve special attention. The
examples are locus #2, locus #49 and overlapping loci #21 and #22 (Table 1, Supplementary Table S4). We sup-
pose that besides undoubtedly causal genes LDLR and LPA, relevance for CAD is likely for the genes SLC22A3,
SLC22A2, SLC22A1 (encoding organic cation transporters), PLG (encoding plasminogen involved in hemosta-
sis), SMARCA4 (encoding a protein involved in vascular calcification52), and CARM1 (encoding methyltrans-
ferase involved in the control of stress-induced lipid metabolism53). In the locus #2, almost all in silico and gene
expression studies prioritized CELSR2 and PSRC1 along with the SORT1 gene. Moreover, PSRC1 was shown to
protect against atherosclerosis and enhance the stability of atherosclerotic plaques in Apoe-/- mice by modulating
cholesterol transportation and inflammation54. Thus, CELSR2 and PSRC1 in the locus #2 might be also involved
in CAD development.
Other interesting examples of multiple candidate genes in a locus are the genes of long noncoding RNA
(lncRNA) prioritized in experimental or in silico studies (loci #18, #20, #27, and #35). LncRNA CDKN2B-AS1
(ANRIL; locus #27) regulates the expression of CDKN2A/B and other genes and has well-known effects on ather-
osclerosis55–57. We suppose that lncRNA RP3-323P13.2 (also known as TARID; locus #20) indicated by our SMR/
HEIDI analysis can in the same way be relevant for CAD via the regulation of expression of CAD-associated gene
TCF21. In the study by Arab et al.58, TARID was shown to activate TCF21 expression via interaction with TCF21
promoter as well as with the regulator of DNA demethylation GADD45A. In the loci #18 and #35, SMR/HEIDI
analysis suggested lncRNAs RP1-257A7.4 and RP1-257A7.5 (the first is antisense to PHACTR1 and the gene
encoding the second one is located near PHACTR1) and RP11-563P16.1 (its gene is located 12 kb from PDGFD).
However, we did not find any evidence in published studies that these lncRNAs can regulate PHACTR1 and
PDGFD transcription and therefore do not consider them as a likely causal CAD genes.
Scientific Reports | (2020) 10:10486 | https://doi.org/10.1038/s41598-020-67001-w 10www.nature.com/scientificreports/ www.nature.com/scientificreports
Figure 1. Summary of findings for 51 CAD-associated loci. Matching loci numbers with chromosomal
positions and lead SNPs can be found in Table 1 and Supplementary Table S1c. Prioritized genes are listed in
Table 1 and Supplementary Table S4.
Other causal/the most likely causal CAD genes. We found additional 37 genes in 27 loci, whose role in CAD and
CAD-related processes can be proposed based on evidence from published “wet” experimental studies (Table 1,
Supplementary Table S4). We considered this evidence not strong enough to prioritize any of these genes con-
vincingly based on experimental data alone. However, adding data from in silico studies allowed us to pinpoint 9
causal and 10 most likely causal CAD genes in 8 and 10 loci, respectively.
The genes that we consider as definitely causal for CAD are MRAS (locus #13), EDNRA (also known as ETA,
locus #14), JCAD (also known as KIAA1462, locus #29), SCARB1 (locus #39), FLT1 (also known as VEGFR1,
locus #40), COL4A2/COL4A1 (locus #41), FURIN (locus #44), and PECAM1 (locus #48). The genes that we
define as “the most likely causal” are ATP1B1 (locus #4), ZC3HC1 (also known as NIPA, locus #23), TBXAS1
(locus #24), CYP17A1 (locus #33), SH2B3 (also known as LNK, locus #36), HNF1A (locus #38), HHIPL1 (locus
#42), HP (locus #45), PROCR (locus #50), and KCNE2 (also known as MIRP1, locus #51). Of those, MRAS,
JCAD, FURIN, PECAM1, ATP1B1, SH2B3, HP, and KCNE2 were found in our SMR/HEIDI analysis, supporting
expression-related effects on CAD.
Only for three loci (#14, #29 and #40) the genes EDNRA, JCAD, and FLT1 were proposed as single possible
candidates in all studies. For other loci, from 2 to 14 genes were proposed as potentially causal (median = 4). The
largest number of genes was suggested for the locus #50 (n = 14), and almost all of these genes were prioritized
based on the same putative functional SNP rs867186 as that prioritized with the most likely causal gene PROCR
(Table 1, Supplementary Table S3a,b). Thus, we cannot explain such diversity by the presence of multiple associ-
ation signals in this locus and consider additional genes as likely unspecific results.
Among the remaining loci with multiple proposed candidates, in our opinion, special attention should
be paid to the loci #23, #36, and #44. In the locus #23, we found the strongest evidence for the gene ZC3HC1
(Supplementary Table S4). ZC3HC1 contains a functional missense polymorphism rs1155692459, which is the
lead SNP tagging this locus. However, our SMR/HEIDI analysis revealed that either rs11556924 or other SNP
in LD with rs11556924 is simultaneously associated with CAD and the KLHDC10 gene expression in blood
(Supplementary Table S2). The product of KLHDC10 is involved in oxidative stress-induced cell death and
inflammation60,61. Since all these processes are playing role in atherosclerosis62–64, we suppose that changes in
KLHDC10 expression can be an additional factor explaining association between locus #23 and CAD. In the
locus #36, lead SNP rs3184504 is a missense polymorphism in the SH2B3 gene. Interestingly, rs3184504 was
also a “top SNP” for SH2B3 in our SMR/HEIDI analysis that indicated this gene (Supplementary Table S2). This
may mean that either effect of rs3184504 on CAD is realized not/not only via altering the SH2B3 protein prop-
erties (for example, it can influence SH2B3 transcription or mediate RNA decay), or the locus #36 contains two
functional CAD-associated SNPs in LD with each other – a missense SNP rs3184504 and another SNP affecting
SH2B3 expression. Besides SH2B3 suggested by many studies, three lines of evidence support the role of ATXN2
(Table 1, Supplementary Table S4), including the results of the study on ataxin-2 knock-out mice (such animals
displayed different pathological changes such as obesity and increased serum cholesterol level65). Thus, we do not
exclude causality for ATXN2. Finally, in the locus #44, all in silico studies prioritized both FURIN and FES genes.
Our SMR/HEIDI analysis found association between CAD and FURIN expression changes in blood, and between
CAD and FES expression changes in blood and CD14 + and CD19 + cells. Notably, Liu et al.66 have recently
applied colocalization methods on the transcriptome dataset generated using human coronary artery smooth
muscle cell lines collected from donor hearts. They observed colocalization between CAD and gene expression
association signals in this locus only for FES (the genes found in that study for other loci were TCF21, SIPA1,
PDGFRA, and SMAD3, with the first two also supported by our SMR/HEIDI results and the last two coming from
loci not analyzed in this study). Nevertheless, in the present study, we prioritized FURIN since only for this gene
experimental data support CAD-related role of its protein product (Supplementary Table S4).
Scientific Reports | (2020) 10:10486 | https://doi.org/10.1038/s41598-020-67001-w 11www.nature.com/scientificreports/ www.nature.com/scientificreports
Loci with inconclusive evidence. For the 15 remaining loci, we could not suggest any causal gene due to incon-
sistency in the results of different studies or insufficient data for gene prioritization.
For the loci #7 and #30, no candidate genes were found, and for the loci #16, #17, and #19, evidence was not
enough to make any conclusion. In the loci #5, #6, #10-12, #28, #34, #37, #46, and #47, the studies suggested
multiple genes (from 2 to 10, median = 4). We failed to prioritize any and presented all of them in Table 1 and
Supplementary Table S4 without inferences of causality. It is worth pointing out that in the locus #47, we could
not choose between three strong candidates PEMT, SREBF1, and MIR33B, all of which can be – based on exper-
imental studies – judged as relevant for CAD. Besides this, we want to point out the locus #28, for which experi-
mental studies (Supplementary Table S4) and the gene-based analysis49 proposed the candidate genes ABO and
ADAMTS13. Our SMR/HEIDI analysis supported the role of ABO. For the locus #10, experimental evidence
suggested the genes GGCX and VAMP8, which were prioritized in almost all in silico studies along with VAMP5
and some other candidates. Whether one or more of these genes are causal for CAD remains in question.
Discussion
Genome-wide association studies offer great opportunities for exploring genetic architecture of complex traits
due to their whole-genome scale and hypothesis-free design. However, annotation of GWAS results is usually
not straightforward and requires extensive in silico research and experimental follow-up. In the present study, we
aimed to pinpoint the genes that account for associations between 51 genomic loci and CAD. We also aimed to
reveal the loci for which evidence on CAD-associated genes remains insufficient or controversial. We collected
and systematized data from published studies and complemented their results with the results of our bioinfor-
matics analysis of colocalization between GWAS signals and eQTLs using SMR/HEIDI approach27. Our results,
information from other works and overall conclusions are summarized in Table 1; even more detailed summary
with a literature review of experimental findings is presented in Supplementary Table S4. Overview of all findings
is provided in Fig. 1.
Using merely in silico techniques and previous literature, we conclude that for 36 out of 51 (71%)
CAD-associated loci, the causal/most likely causal genes have been identified. For 18 genes in 18 loci, we
found that very strong previous experimental evidence supports their relevance for CAD and defined them as
“well-known CAD genes”. This role for 15 of them is also supported by bioinformatics studies46–49. Our SMR/
HEIDI analysis confirmed the role of 9 of these 18 genes (IL6R, GUCY1A3, PHACTR1, TCF21, LPA, LPL, LIPA,
PDGFD, ADAMTS7), indicating that the same causal SNPs are associated with CAD and gene expression changes
in CAD-relevant tissues. Furthermore, we made causal inferences for 19 genes in 18 other loci based on cumu-
lative evidence from in silico and experimental works. Eight of them (JCAD, FURIN, PECAM1, ATP1B1, SH2B3,
HHIPL1, HP, and KCNE2) were found in our SMR/HEIDI analysis, supporting expression-mediated mechanisms
underlying CAD-loci associations.
We could not make causal inference for 15 (29%) loci. We found out that for 5 loci, evidence for
CAD-associated genes remains insufficient or absent. For the remaining 10 loci, we observed a considerable
inconsistency in the results obtained using different approaches and/or could not choose from multiple genes for
which strength of evidence supporting their role was similar. Thus, we conclude that for these 15 loci, it would be
beneficial to conduct additional studies clarifying the causal gene.
It should be noted that our and other studies suggested more than one candidate gene per locus for 37 out
of 51 (73%) analyzed loci (including 12 loci with well-known CAD genes). There may be several explanations
for such multiplicity. First of all, in silico methods may produce unspecific results. For instance, colocalization
between gene expression and CAD association signals does not prove causality – this method only provides
possible candidate genes whose transcription is affected by the same SNP that influences the risk of CAD, and the
results of different colocalization methods may have a low concordance with each other67. In bioinformatics stud-
ies of Brænne et al.46 and Lempiäinen et al.47 that used different prioritization algorithms and in silico methods,
the “nonspecificity” issue was addressed by providing scores to the revealed genes. Nevertheless, as can be seen
from Table 1, a high score in one study does not necessarily correlate with a high score in another. We estimated
a correlation between the scores assigned to the genes prioritized in both Brænne et al.46 and Lempiäinen et al.47
studies (only the genes attributed to 51 loci studied in our work were included in the analysis). The Spearman’s
correlation coefficient was ρ = 0.204. When we considered only the genes in these loci prioritized with the same
SNP (or with SNPs in high LD with each other, r2 ≥ 0.8), the Spearman’s correlation coefficient was ρ = 0.290.
Second, in our study, “a CAD-associated locus” was defined as a physical distance of ±250 kb around the lead
SNP (showing the strongest association in GWAS), and we did not focus on independent association signals. In
the case of multiple neighboring SNPs independently associated with the disease, each one can realize its effect
via its own causal gene. Besides this, theoretically, one functional SNP (e.g., regulatory) can affect more than one
disease-relevant gene. Thus, it is not surprising that out colocalization analysis and analyses performed in other
studies often suggested many genes per locus. Here we presented all information on CAD-associated genes sug-
gested by our SMR/HEIDI tests and thoroughly extracted from different studies irrespective of scores given to
these genes (if any) and LD between SNPs, through which the genes were prioritized, and the lead GWAS SNPs
(data on LD can be found in Tables S2 and S3). Furthermore, our study emphasized the loci where multiple causal
genes are likely (e.g. TCF21 and RP3-323P13.2 in locus #20; ZC3HC and KLHDC10 in locus #23, SH2B3 and
ATXN2 in locus #36 etc., see Table 1). In our opinion, such loci should receive special attention in subsequent
research.
Our study has strengths and limitations. A principal strength of our study is a systematic and comprehensive
approach to data extraction and reporting. Each locus was analyzed individually taking into accordance all avail-
able information. However, we acknowledge that manual annotation may lead to some degree of subjectivity in
making decisions, and we therefore made as much data as possible available for independent scrutiny. Another
limitation is that we analyzed only 51 CAD-associated loci discovered until 2017 and for which we were able to
Scientific Reports | (2020) 10:10486 | https://doi.org/10.1038/s41598-020-67001-w 12You can also read