Preliminary Cost Benefit Analysis (CBA) of Zero-Emission Transit Bus Options for the City of Winnipeg
←
→
Page content transcription
If your browser does not render page correctly, please read the page content below
Preliminary Cost Benefit Analysis (CBA) of
Zero-Emission Transit Bus Options for the
City of Winnipeg
Sustainability Economics (IDM 7090 G05)
Master of Business Administration (MBA) Program
I.H. Asper School of Business, University of Manitoba
Winter Session 2020

Robert V. Parsons *, Michael J. Kizuik, Thomas G. Miles, Shannon C.
Prud’homme, Jordan S. Sodomsky and Mingyang Wang

* Course Instructor

                                                                      i
Table of Contents
                                                                                  Page

Table of Contents                                                                   ii

Summary                                                                             iv

 1. Introduction                                                                    1

 2. Methods                                                                         3

       2.1 Options Considered                                                       3

       2.2 Analysis Approach and Costs Considered                                   3

       2.3 Common Assumptions Employed                                              4

       2.4 Major Assumptions for Technology Options                                 5

       2.5 Major Assumptions for Externalities                                      8

       2.6 Limitations of Analysis                                                 13

 3. Results                                                                        14

 4. Discussion                                                                     18

       4.1 Major Insights from Analysis                                            18

       4.2 Future Potential Directions for City of Winnipeg and Follow-up Steps    21

References                                                                         23

                                                 ii
List of Figures
                                                                                           Page
Figure 1   Present Values of Total Costs for Options over 12 Years ($ millions)              vi

Figure 2   Present Values Costs per Tonne Net Emissions Reduction for Options               vi

Figure 3   Photograph of Overhead Gantry of Rapid-Charging Station for Transit               2
           Buses Still Located at James A. Richardson International Airport, Winnipeg
           (March, 2020)

Figure 4   Box Plot of Approximate Variability of Annual Bus Travel Distance                 5

Figure 5   Breakdown of 12-Year Present Value Costs for 16 Conventional Buses               16
           using Diesel and 16 Conventional Buses using Renewable Diesel

Figure 6   Breakdown of 12-Year Present Value Costs for 16 BEB and 20 BEB                   16
           involving Larger Battery Packs and using Depot Charging

Figure 7   Breakdown of 12-Year Present Value Costs for 16 BEB and 20 BEB                   17
           involving Smaller Battery Packs and using On-Route Charging

Figure 8   Breakdown of 12-Year Present Value Costs for 16 FCEB using Hydrogen              17
           from Steam Methane Reforming and using Hydrogen from Electrolysis

List of Tables

Table 1    Cost Categories Included in CBA for Zero-Emission Transit Buses                  3

Table 2    Present Values of General Service Medium Electrical Fee Components               8
           over 12-Years

Table 3    Importance of Eight Clusters of Externality Factors for Different Bus Options    8

Table 4    Comparison of 12-Year Present Value Costs for Options Considered                14

Table 5    Comparison of 12-Year Cumulative GHG Emissions Results                          14

                                            iii
Summary
A major trend currently underway in public transit systems across the world has been
movement toward zero-emission technologies, primarily via electrification, in order to
significantly reduce the generation of greenhouse gases and conventional air pollutants.
The technologies primarily involve either all-electric, battery electric buses (BEB), or
hydrogen-based, fuel cell electric buses (FCEB), although other options are also
available to reduce emissions. The City of Winnipeg, through Winnipeg Transit, has
already had early leadership in the testing and evaluation of multiple zero-emission
technologies, and is currently in the process of evaluating options in order to select a
suitable direction for the future.
As a means to address a potential problem with real world implications, MBA students
at the I.H. Asper School of Business, University of Manitoba, studying Sustainability
Economics during the Winter term of 2020, undertook independent work on cost benefit
analysis (CBA) of zero-emission transit bus technologies, compared to base-case
implementation of 16 conventional, 40-foot diesel buses. Three major options are
specifically considered, with variations as noted, as follows:
1. Battery electric buses (BEB), including the technical options: (a) central depot-
charged buses incorporating larger battery packs, versus (b) on-route charged
buses incorporating somewhat smaller battery packs; and considering: (a) 16 BEB to
replace 16 conventional diesel buses, versus (b) 20 BEB to replace 16 conventional
diesel buses, the latter given uncertainty as to BEB capacity to fully replace diesel.
2. Fuel cell electric buses (FCEB), considering 16 such buses, and including the
technical options: (a) hydrogen (H2) production via steam methane reforming (SMR)
of natural gas, versus (b) hydrogen production via electrolysis.
3. Sufficient 100% renewable diesel, to supply 16 conventional diesel buses, still
resulting in significant reduction of GHG emissions, although with this option
included primarily for cost comparison, given significant uncertainty of fuel supply.
ivThe analysis is based on reviewing available literature from the public domain. A
compendium of results is presented in this report, comparing the present values of total
costs for the options, with variations, based on a standard bus lifespan of 12-years.
Detailed series of assumptions are outlined for each of the options, with resulting
estimated costs organized into five major categories, summarized as follows:
• Buses, involving purchase costs for 40-foot versions of respective bus types;
• Infrastructure, involving necessary initial infrastructure and upgrades where
necessary for each specific option;
• Maintenance, involving on-going maintenance costs;
• Fuel, involving on-going fuel costs, whether diesel, renewable diesel, electricity or
hydrogen; and
• Externalities, involving calculated costs based on eight major clusters of externality
factors identified in an earlier detailed report.
The first two categories are more oriented to “initial” capital-related costs, while the final
three are more oriented to “on-going” operation. A summary of overall results for the
options, based on present values of total costs over 12-years of operation, is presented
in Figure 1.
Interestingly, the use of 100% renewable diesel appears to be an economically
attractive option, despite a high price per Litre assumed. As discussed further in the
report, however, there is significant uncertainty about securing sufficient fuel volumes,
even at a high price, due to still limited production. As such, this option is unlikely to be
realistic.
Of the others considered, the options employing BEB appear to be generally more
realistic than considering FCEB. Further, based on assumptions for operation and
costing, as employed and discussed more later, the options with BEB incorporating
smaller battery packs and using on-route charging, appear to represent the most
economically attractive at this time.
vFigure 1. Present Values of Total Costs for Options over 12 Years ($ millions)
GHG emissions reduction is a key reason for considering zero-emission transit
technologies. Costs per tonne net emissions reduction are summarized in Figure 2.
Figure 2. Present Values Costs per Tonne Net Emissions Reduction for Options
viConsistent with the results for present values of total costs, the options employing BEB
also all appear to show lower present value costs per tonne emissions reduction than
FCEB. Again, based on assumptions for operation and costing as employed, the
options with BEB incorporating smaller battery packs and using on-route charging,
appear to show lower present value costs per tonne emission reduction at this time.
As such, overall, BEB appear to represent a better option for the City of Winnipeg to
pursue into the near future compared to FCEB. Further, BEB incorporating smaller
battery packs and using on-route charging appear to hold the economic edge at this
time, albeit based on operating and cost assumptions that would need to be confirmed.
A series of insights are also identified from the analysis, and discussed in more detail in
the report. These are briefly summarized as follows:
• Achieving emissions reduction will incur a net cost for the City of Winnipeg, a point
that is important to communicate to higher-levels of government
• Federal carbon tax imposes significant costs already on Winnipeg Transit, but is
grossly insufficient on its own to prompt any technology changes
• Currency exchange rate with the U.S. dollar (USD) is surprisingly critical to the
success of zero-emission transit technologies, likely the most important new finding
• Using renewable diesel appears economically positive, but likely not realistic
• Site-specific electricity rate structure is critical to incorporate when considering BEB,
in this case Manitoba Hydro’s General Service Medium or other rate. This is likely
the second most important new finding of the investigation and associated analysis
• Clarifying bus replacement ratio for BEB compared to conventional diesel buses is
important to the economics, especially the cost per tonne for emissions reduction
• Considering extended lifespan may improve economic viability, especially for BEB
• FCEB work well technically, but remain too expensive to be realistic at this time.
The main concern is the still the high purchase price of such vehicles
• Most realistic fuel option for FCEB, if considered, involves steam methane reforming
of natural gas, even if it does not initially appear environmentally attractive
viiThe City of Winnipeg can pursue a number of directions into the future regarding zero-
emission transit technologies. Based on the analysis, three major alternative directions
are summarized as follows:
1. City of Winnipeg could deliberately remain with conventional diesel buses.
Deliberately remaining with diesel buses is a valid response to worsening and uncertain
currency exchange rates, which make zero-emission transit technologies significantly
more expensive over the near- to medium-term. Even the presence of a carbon tax on
diesel does not alter the economics.
Such an approach, however, is not merely an excuse for inaction. If pursued, an
important measure would be to ramp-up the purchase of conventional diesel buses.
Recent work confirms that, when including modal-shift effects, i.e., moving consumers
away from personal vehicles toward mass transit, two diesel buses can achieve roughly
the same overall net emissions reduction as a single zero-emission bus, noting initial
costs for the latter are currently twice or more. While remaining equivalent in terms of
reduction, a larger number of diesel buses in service would help to address other
identified concerns. If this direction is pursued, further follow-up actions could include:
• Ramping up diesel bus implementation to a higher level to maximize emissions
reduction related to modal-shift; and
• Continuing to actively monitor progress on zero-emission transit technologies.
2. City of Winnipeg could further pursue implementation option based on BEB.
Of the available options, those involving BEB appear to be the most realistic at this time.
BEB incorporating smaller battery packs and using on-route charging appear to be the
most attractive options at this time, based on operating and cost assumptions as
employed. More detailed evaluation will be necessary for confirmation.
viiiInitial costs, involving bus purchase and infrastructure, represent the most important
economic constraint for municipal governments in general. These are still significantly
higher for BEB, i.e., incrementally $8 to $12 million more for on-route charging options
or $13 to $19 million more for depot-charging options. At the same time, base-case
initial costs to cover 16 conventional diesel buses are around $11 million. Funding-
partnerships with higher levels of government will be needed to reasonably cover off
these higher incremental costs, with the Low Carbon Economy Leadership Fund
(LCELF) identified as an available potential candidate for collaborative funding. If this
direction is pursued, further follow-up actions could include:
• Confirming the prices for BEB and infrastructure, as well as better understanding in
more detail the relevant operational characteristics for the various types of BEB;
• Working closely with Manitoba Hydro to understand implications of rate structures in
order to determine the best approach to manage demand and minimize costs;
• Better confirming the number of BEB required to fully replace the role of a single
conventional diesel bus; and
• Actively engaging with federal and provincial representatives to consider co-funding
opportunities, such as the LCELF.
3. City of Winnipeg could further pursue implementation option based on FCEB.
Implementation of this approach is more costly in general terms, and thus much more
difficult. It is not necessarily completely off the table, however, in particular if other
potential opportunities were to emerge, such as lower relative costs at much higher
levels of implementation for Winnipeg Transit’s fleet. If this direction is pursued, further
follow-up actions could include:
• Investigating more fully the prices for FCEB and future associated trends; and
• Investigating more fully hydrogen production technologies and associated costs.
ix1. Introduction
A major trend currently underway in public transit systems across the world has been movement
toward zero-emission technologies, primarily via electrification. Such technologies involve either
zero or near-zero generation of both greenhouse gas (GHG) emissions, and conventional air
pollutant emissions, the latter collectively termed as criteria air contaminants (CAC). This trend
has been driven by a combination of environmental and public-health concerns, in particular
resulting from the combustion of diesel fuel, which still dominates overwhelmingly in transit
systems across North America, as well as elsewhere. Further, transit systems typically involve
diesel-powered vehicles operating in the densest urban areas, thus exacerbating problems.
Electrification of public transit, however, has been not totally new, considering for example
once-common electric trolley buses across Canada. Recent significant acceleration has been
due to increasingly practical new technologies, of which there are two major options: all electric,
battery electric buses (BEB); and hydrogen-based, fuel cell electric buses (FCEB). There are
also other options available to reduce emissions from transit buses.
A transition to zero-emissions often appears, from the outside, as simple and straightforward,
yet is not. Parsons (2019), in a major national report in conjunction with Clean Energy Canada,
summarized the complex intricacies of actually trying to implement zero-emission transit
technologies under real-world conditions within Canada. Eight major factors are identified that
need to be at least considered: (1) overall life-cycle costs; (2) integration of new technologies
into already complex networks developed based on diesel bus characteristics; (3) deployment
strategy, in particular emphasizing quantum changes rather than piecemeal incremental
changes; (4) technology uncertainties, of which there are still many; (5) ownership structure; (6)
infrastructure requirements, in particular regarding electricity; (7) externalities, and associated
costs; and (8) federal funding support. Achieving a successful transition is not so simple.
The City of Winnipeg has already had early leadership involvements in testing and operation of
several successful zero-emission related transit technologies. These include hydrogen-based
buses, specifically the in-service demonstration of the hydrogen hybrid internal combustion
engine (HHICE) transit bus (Manitoba Energy, Science and Technology 2005), which around
the same time also involved novel testing of an advanced hydrogen mitigation technology in an
existing Winnipeg bus garage (Marcinkowska et al. 2004).
More recently, the focus has been on all-electric buses, specifically the in-service pilot of four
second-generation electric buses beginning in 2014 and running for more than three years. The
demonstration was undertaken by a consortium of partners led by New Flyer (now NFI Group),
and included co-funding from Sustainable Development Technology Canada (Winnipeg Transit
2014). Given the extent of electric buses as employed locally, Winnipeg Transit already has the
most real-life experience with BEB of any transit agency across Canada.
Consideration of how to move forward on broader implementation was outlined in the 2016-
based report of the Government of Manitoba and City of Winnipeg Joint Task Force on Transit
1Electrification (JTF 2016). While their report found that new low-emission technologies show
promise for the future, overall costs were identified as being still somewhat high compared to
conventional diesel, thus necessitating caution. To follow-up, Winnipeg’s 2019 budget included
funding support to study how, in more detail, the city should proceed forward (City of Winnipeg
2019). Importantly, this included engaging a project manager to coordinate the investigation of
suitable zero-emission options for long-term and large-scale implementation. A resulting
internal report and plan, providing future directions, will be submitted to Winnipeg’s City Council
in the future.
As a means to address a potential problem with real world implications, MBA students at the
I.H. Asper School of Business, University of Manitoba, studying Sustainability Economics during
the Winter term of 2020, undertook an independent cost benefit analysis (CBA) of zero-emission
transit bus technologies. The analysis was based on a review of available literature from the
public domain. A compendium of results for the options considered is presented in this report.
Limitations of the analysis are also outlined.
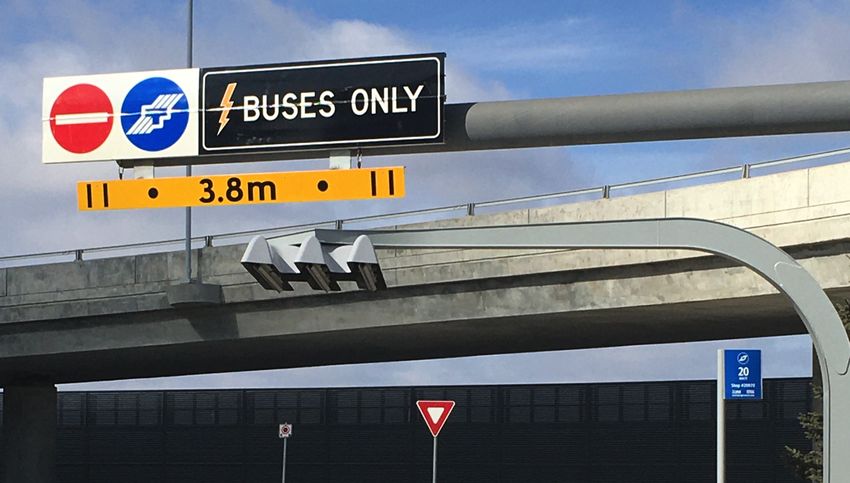
Figure 3. Photograph of Overhead Gantry of Rapid-Charging Station for Transit Buses Still
Located at James A. Richardson International Airport, Winnipeg (March 2020 by M. Kizuik)
22. Methods
This report summarizes the results of the analysis, considering three main zero-emission transit
technology options for implementation by Winnipeg Transit as part of an initial large-scale
deployment equivalent to 16 conventional, 40-foot diesel buses. This is consistent with the first
step implementation of 12 to 20 buses, as recommended by the Joint Task Force (JTF 2016).
2.1 Options Considered: The three main technology options considered, with associated
variations, are as follows:
1. Battery electric buses (BEB), including the technical options of (a) central depot-charged
buses incorporating larger battery packs, versus (b) on-route charged buses incorporating
somewhat smaller battery packs; and considering (a) 16 BEB as fully capable of replacing
16 conventional diesel buses, i.e., 1.00 to one replacement, versus (b) 20 BEB replacing 16
conventional diesel buses, i.e., 1.25 to one replacement, given concerns that a single BEB
may not be adequate alone to fully replace an individual conventional diesel bus.
2. Fuel cell electric buses (FCEB), only considering 16 such buses given it is well understood
FCEB are fully capable of replacing conventional diesel on a one to one basis, as recently
confirmed by Wagner (2019), and including the technical options of (a) hydrogen fuel
production via steam methane reforming (SMR) using natural gas as input, versus (b)
hydrogen fuel production via electrolysis using electricity as input.
3. Sufficient 100% renewable diesel, also known as hydrogenation-derived renewable diesel
(HDRD), to supply 16 conventional diesel buses, still resulting in significant reduction of
GHG emissions.
2.2 Analysis Approach and Costs Considered: The CBA involves calculating the present
values of costs over the lifespan of the vehicles for each of the options considered, including
variations, based on five cost categories, as summarized in Table 1, as follows:
Table 1: Cost Categories Included in CBA for Zero-Emission Transit Buses
Cost Category Description
Buses Purchase costs for 40-foot versions of respective bus types
Infrastructure Necessary initial infrastructure for each specific option, whether
refuelling system upgrades, charging systems, or facility safety
modifications, as well as ongoing infrastructure upgrades where
necessary
Maintenance On-going maintenance costs
Fuel On-going fuel costs, whether diesel, renewable diesel, electricity
or hydrogen
Externalities Calculated costs based on eight major clusters of externality
factors identified in earlier analysis by students in the Asper
MBA program (Parsons et al. 2017) and described in more
detail later in Table 3
3Net benefits, as such, for each option are thus evident by way of lower costs under a particular
category.
2.3 Common Assumptions Employed: A number of consistent assumptions are included
across all options and the base-case, as follows:
• Base Year: All calculations and costs are based in 2020.
• Currency Conversion: Given that all pricing for transit buses in North America tends to be
is conducted in U.S. dollars (USD), a uniform conversion rate for Canadian dollars (CAD) is
assumed as: 1.00 CAD = 0.74 USD.
• Lifespan of Buses: Consistent with U.S. industry standards, as suggested by the U.S.
Federal Transit Administration, a standard bus lifespan of 12 years is assumed, with
justification for this value provided by Laver et al. (2007). It is known that Winnipeg Transit
tends to keep buses running longer, with Winnipeg Transit’s “Transit Facts” Web Page
listing average bus lifespan as 18 years ( https://winnipegtransit.com/en/about-
us/interestingtransitfacts/ ). Implications of considering a longer lifespan are discussed later.
• Cost of Capital (Discount Rate): A uniform discount rate of 4.35% is assumed for City of
Winnipeg transit-related activities, based on the public report by Deloitte (2014). City of
Winnipeg staff suggests that discount rates ranging from 3% to 5% can be employed,
depending on circumstances, such that the selected value is essentially in the middle.
Given an assumed lifespan of 12 years, the resulting present value interest factor annuity
(PVIFA) is roughly 9.20, permitting easy conversion between present value and
corresponding yearly annual value.
• Average Annual Bus Travel Distance: For all analyses, an average annual travel distance
of 50,000 km per year is assumed for each bus. The “Transit Facts” Web Page lists total
cumulative annual travel as about 30 million km, and total buses as 640, translating to
46,875 km per bus, which is a bit lower. Winnipeg Transit themselves suggests an average
travel value of close to 50,000 km.
• Variability of Annual Bus Travel Distance (for further note): Although a single relevant
average annual travel distance for all buses is assumed in the analysis, it is important to
note there is significant variability of travel experienced in transit operations, in particular as
noted in the report of the Joint Task Force (JTF 2016), with bus utilization being more
“bimodal” in nature. So-called “High Use” buses, especially newer buses, can be in use
upwards of 22 hours daily, and travel as much as 70,000 km per year, this typically
considered as the upper limit. So-called “Peak Use” buses are used to service morning and
afternoon peak periods, and travel approximately 35,000 km per year. Some buses may be
used even less frequently, with lower travel still. Information on annual bus travel distance
can be represented in the form of a “box plot” as shown in Figure 1.
4Figure 4: Box Plot of Approximate Variability of Annual Bus Travel Distance
• Base-Case Renewables Content: For the base-case of 16 conventional diesel buses, as
used for comparison for all options, the diesel fuel-blend likely to be employed over the next
12-year period is assumed. Currently, Manitoba’s mandate requires all diesel to contain at
least 2% renewable content (i.e., biodiesel or renewable diesel), but the Government of
Manitoba recently announced the intent to increase the mandate level to 5%, which is
employed for the analysis (Biofuels International 2020).
2.4 Major Assumptions for Technology Options: Key assumptions for evaluation of the
various technology options are summarized, as follows:
• Buses: Approximate bus purchase prices for the major options are summarized as follows:
o For conventional diesel buses, and buses using 100% renewable diesel, which are
essentially identical, a purchase price of about $500,000 USD was approximated
from results presented in the recent update report by Red River College (RRC 2018).
This translates to approximately $675,000 per bus, based on current exchange, and
is assumed for this work. The value is also known to be reasonable compared with
Winnipeg Transit’s approximate current cost for conventional diesel buses.
o For BEB, a variety of recent costs certainly have been available from public domain
sources. In most cases, however, these are not specific enough to allow relevant
prices to be understood, e.g., technologies not sufficiently clear, or additional
inclusions in cited values. Fortunately, recent work by M.J. Bradley and Associates
(Lowell 2019) usefully outlines consistent data in terms of costs per unit mile (USD)
to cover purchase for conventional diesel buses and for electric buses, both depot-
charged BEB incorporating larger battery packs, and on-route charged BEB
incorporating smaller battery packs. The results suggest the BEB options to be
approximately 2.10-times and 1.46-times that of conventional diesel buses,
respectively. Resulting purchase prices, based on the conventional diesel bus price
noted above, translate to $1,418,000 per bus and $986,000 per bus, respectively,
with both values assumed for this work. The resulting average of the two costs, of
about $1.2 million per bus, is consistent with BEB price expectations noted earlier by
the City of Winnipeg (Rollason 2019).
5o For FCEB, the average purchase price for such buses in the U.S. during 2019 was
listed by Beshilas (2019) as about $1,270,000 USD. At the same time, Le Flore
(2019), on behalf of Sunline Transit in the U.S., noted their most recent purchase
price for five new buses as only $1,170,000 USD. The latter, more optimistic, value
is considered. This translates to approximately $1,581,000 per bus, based on
current exchange, and is assumed for this work.
• Infrastructure: Infrastructure costs for the major options are summarized as follows:
o For conventional buses, both using diesel fuel and 100% renewable diesel, ongoing
annual costs of $30,000 are assumed to cover ongoing fuel system upgrades, this
approximated from the recent update report by Red River College (RRC 2018).
o For conventional buses using 100% renewable diesel, incremental fuel storage and
dispensing equipment costs to handle this separate fuel are assumed, representing
roughly $2,000,000, in addition to the ongoing upgrade costs as noted above.
o For BEB, with larger battery packs, employing depot-charging systems rated at 150
kW, total present value costs (installed) for chargers are estimated to be $1,708,000
for 16 buses, and $1,952,000 for 20 buses. These are based on one charger having
daily capacity to handle 2.5 buses, with installed costs reflecting the recent update
report by Red River College (RRC 2018).
o For BEB, with smaller battery packs, employing on-route rapid charging systems
rated at 480 kW, total present value costs (installed) for chargers are estimated to be
$3,711,000 based on three units, whether for 16 buses or 20 buses. This implies
sufficient capacity available with the chargers to be able to handle a slightly larger
number of buses. Costs in this case were based on direct discussions with Siemens.
o For FCEB, irrespective of hydrogen source, necessary infrastructure primarily
involves ventilation and safety upgrades to ensure buses can be worked on in the
existing maintenance garage building. Based on earlier work by Marcon DDM
(2005), this is estimated to represent approximately $1,050,000 in current terms.
Capital costs for fuel production, compression and dispensing equipment are
inherently included in the allocated hydrogen fuel prices, as described later.
• Fuel Consumption: Fuel consumption values for the major options are summarized as
follows:
o Conventional diesel buses and 100% renewable diesel buses are both assumed to
consume 60 Litres per 100 km of liquid fuel blend along with 2% (or 1.2 Litres per
100 km) of diesel emission fluid (DEF), as required for Tier 4 emission controls. The
“Transit Facts” Web Page lists total diesel consumption as 18 million Litres, and
annual travel as 30 million km, yielding average consumption of 60 Litres per 100
6km. Winnipeg Transit has noted average fuel consumption of 59.7 Litres per 100 km
in practice, but this is effectively the same.
o BEB are assumed to require 130 kWh per 100 km plus 0.9 Litre per 100 km of diesel
fuel, used for auxiliary heating but without any additional DEF required. The latter
contributes a small amount of GHG emissions, and is needed given that electrical
heating of buses in very cold weather can be constrained. Values were approximated
from data as presented in the update report by Red River College (RRC 2018), with
the electricity consumption confirmed by Winnipeg Transit to be very close to the
average experienced for the four-BEB pilot operation.
o FCEB are assumed to require 10 kg hydrogen per 100 km, but in this case with no
auxiliary heating fuel required. Eudy and Post (2018), specifically Table ES-1,
showed hydrogen consumption for FCEB to be 7.01 miles per Diesel Gallon
Equivalent (DGE), reflecting recent actual use in the U.S. Given that a DGE for
hydrogen involves about 1.13 kg, this translates to approximately 10 kg per 100 km.
• Fuel Cost: Unit fuel costs for the major options are summarized as follows:
o For conventional buses using diesel fuel, an average future diesel base-price of
$1.10 per Litre is assumed, this including account-volume discounts, and
approximated from the recent update report by Red River College (RRC 2018). DEF
is assumed to have the same price as diesel.
o For conventional buses using 100% renewable diesel, an average price of $1.80 per
Litre is assumed, consistent with analysis outlined by Deloitte (2013). This relatively
high price is assumed, especially given the lack of any prospective production
facilities in proximity to Winnipeg, and reflects the difficulty in acquiring this
specialized fuel in the open market.
o For BEB, Manitoba Hydro’s costs and conditions for the applicable General Service
Medium rate-class are assumed (Manitoba Hydro 2020), including fees for
connection service, energy (per kWh) and demand (per kVA). A breakdown of
present values of rate components is presented in Table 2 that includes escalation in
rates over time of 2.6% from current Manitoba Hydro values. Although more
complicated, this aspect of analysis more realistically reflects the situation for BEB.
o For FCEB using hydrogen from steam methane reforming, a unit price at the
dispenser of $6.00 per kg is assumed, reasonably reflecting the cost of delivered
high-pressure hydrogen gas. This case also assumes 4 m3 of natural gas per kg.
For FCEB using hydrogen from electrolysis, a unit price at the dispenser of $10.00
per kg is assumed, reasonably reflecting the cost of delivered high-pressure
hydrogen gas. This case assumes approximately 50 kWh of electricity per kg.
7Table 2: Present Values of General Service Medium Electrical Fee Components over 12-Years
Case Service Fee Energy Fee Demand Fee Total
Depot charge, 16 buses - $548,630 $1,463,640 $2,012,270
Depot charge, 20 buses - $661,980 $1,672,730 $2,334,710
On-route charge, 16 buses $12,250 $766,890 $884,750 $1,663,890
On-route charge, 20 buses $12,250 $887,190 $884,750 $1,784,190
• Maintenance: Maintenance costs for the major options are summarized as follows:
o For conventional buses, both using diesel fuel and 100% renewable diesel,
maintenance costs are assumed to be about $21,000 per year per bus,
approximated from the update report by Red River College (2018).
o For BEB, NFI Group (2020), recently suggested simple cumulative maintenance
savings for a BEB compared to a diesel bus over 12-years translate to about
$125,000. Compared to diesel, above, this thus translates to annual maintenance
costs of about $10,600 per year per bus, which is assumed.
o For FCEB, Eudy and Post (2018) indicate that maintenance costs for such buses in
the U.S. recently averaged $0.49 USD per mile, which translates using current
exchange to $0.41 per km. Given travel distance, this means about $20,700 per
year per bus, which is assumed.
2.5 Major Assumptions for Externalities: Externalities represent adverse consequences of a
particular activity that are typically not directly included in the costs normally accounted for the
good or service involved (Khemani et al. 1993). Regarding the operation of vehicles, and as
reflected in this analysis, externalities most typically involve environmental effects, but can also
reflect social concerns. Identifying and costing of externalities in this report are based primarily
on the recent work by Parsons et al. (2017), and consider eight systematic clusters of externality
factors summarized in Table 3, as follows:
Table 3: Importance of Eight Clusters of Externality Factors for Different Bus Options
Type of Bus Diesel HDRD BEB FCEB
1. GHG Emissions Significant cost Slight cost Slight cost Depends on H2
2. Diesel Price Volatility Significant cost No cost Slight cost No cost
3. Noise Impacts Significant cost Significant cost No cost No cost
4. Rare Minerals No cost No cost Potential cost but low
5. Weight Damage No cost No cost Heavier vehicles impose cost
6. Air Pollution Important cost Important cost Slight cost No cost
7. Engine Fluids Slight cost Slight cost No cost No cost
8. Cell/FC Disposal No cost No cost Notable cost with uncertainties
Relevant assumed impacts and costs regarding each externality factor for the applicable bus
options are described in more detail in the following points:
8• GHG Emissions: GHG emissions per 100 km for the major bus options are summarized as
follows:
o Conventional bus emissions of 155.6 kg per 100 km, using diesel fuel, based on:
o Diesel fuel emissions of 2,720 g per Litre with 5% renewable content, yielding net of
2,580 g per Litre blend; and
o DEF emissions of 500 g per Litre, based on production ultimately via ammonia from
natural gas.
o Conventional bus, using 100% renewable diesel, emissions of 9.6 kg per 100 km:
o Renewable diesel emissions of 150 g per Litre, based on hydrogen sourcing via
steam methane reforming of natural gas as part of HDRD process; and
o DEF emissions of 500 g per Litre, based on production ultimately via ammonia from
natural gas.
o BEB (of any type), using electricity (diesel auxiliary), emissions of 2.7 kg per 100 km:
o Electricity emissions of 3.1 g per kWh based on Manitoba five-year average grid
intensity (2014-2018) from the National Inventory Report (ECCC 2020); and diesel
fuel emissions of 2,720 g per Litre with 5% renewable content, yielding net of 2,580 g
per Litre blend.
o FCEB, using electrolysis hydrogen, emissions of 1.6 kg per 100 km:
o Electricity emissions of 3.1 g per kWh based on Manitoba five-year average grid
intensity (2014-2018) from National Inventory Report, and requiring 50 kWh per kg
hydrogen for production.
o FCEB, using steam methane reforming hydrogen, emissions of 75 kg per 100 km:
o Hydrogen fuel emissions of 7,500 g per kg hydrogen based on input natural gas from
steam methane reforming. Natural gas combustion emissions in this case about
1,880 g per m3, combined with inputs of approximately 4 m3 per kg hydrogen.
• Compared to the conventional diesel bus, resulting net emission reductions per 100 km for
the major options thus translate as follows:
o 94% reduction for conventional bus using 100% renewable diesel;
o 98% reduction for BEB, irrespective of battery size and charging format, and
irrespective of replacement ratio within range considered;
o 99% reduction for FCEB, with hydrogen sourced via electrolysis; and
o 52% reduction for FCEB, with hydrogen sourced via steam methane reforming.
• GHG Emissions Cost: Costs for the relevant major bus options are summarized as follows:
o For conventional bus, using diesel, the emission levy for diesel stipulated by
Revenue Canada Agency (2018) is $0.1341 per Litre (at $50 per tonne cost level),
9which based on consumption rate of 60 Litres per 100 km and 50,000 km travel,
translates to $4,020 annually, and is assumed for the analysis.
o For BEB, using diesel as auxiliary fuel, the emission levy for diesel stipulated by
Revenue Canada Agency (2018) is $0.1341 per Litre (at $50 per tonne cost level),
which based on consumption rate of 0.9 Litres per 100 km and 50,000 km travel,
translates to $60 annually, and is assumed for the analysis.
o For FCEB, using hydrogen via steam methane reforming, the emission levy for
natural gas stipulated by Revenue Canada Agency (2018) is $0.0979 per m3 (at $50
per tonne cost level), which based on effective combustion of 40 m3 per 100 km and
50,000 km travel, translates to $1,960 annually, and is assumed for the analysis.
• Diesel Price Volatility Cost: Costs for the relevant major bus options are summarized as
follows:
o For conventional bus, using diesel, the suitable cost to account for diesel price
volatility based on analysis by Parsons et al. (2017) is $0.0534 per Litre, which
based on consumption rate of 60 Litres per 100 km and 50,000 km travel, translates
to $1,600 annually, and is assumed for the analysis.
o For BEB, using diesel as auxiliary fuel, the suitable cost to account for diesel price
volatility based on analysis by Parsons et al. (2017) is $0.0534 per Litre, which
based on consumption rate of 0.9 Litres per 100 km and 50,000 km travel, translates
to $25 annually, and is assumed for the analysis.
• Noise Impact Cost: Costs for the relevant major bus options are summarized as follows:
o For conventional buses, both using diesel fuel and 100% renewable diesel, the
suitable cost to account for noise impacts based on annual travel of 50,000 km,
based on analysis by Parsons et al. (2017) is $1,880 annually. This cost includes
impacts of direct effects on passengers, direct effects on people exterior to the bus in
proximal vicinity, and indirect effects on property values, and is assumed for the
analysis. BEB and FCEB, on the other hand, are both relatively quiet.
• Rare Mineral Cost: For the alternative bus technologies considered, both BEB and FCEB
can involve reliance on relatively rare minerals to a significant extent. Considerations of
issues and costs for the two technologies are outlined as follows:
o BEB today involve primarily lithium-ion type batteries, with cobalt being the primary
rare mineral of concern, and lithium being of secondary concern (Parsons et al.
2017). While there are six major lithium-ion chemistries broadly available in
commercial batteries today (Boston Consulting Group 2010), two tend to dominate
for transit buses: Lithium-nickel-manganese-cobalt oxide (NMC); and Lithium-iron
10phosphate (LFP). NMC involves modest content of cobalt, while LFP involves
almost none, with both requiring lithium. As noted by Xiao (2019), an important
duality now exists, whereby Chinese manufacturers, including most prominently
BYD, tend to focus on LFP, while major western manufacturers, both in Europe and
North America, the latter known to include both NFI Group and Proterra, tend to
focus on NMC. Work by Parsons et al. (2017) identified significant issues with cobalt
at the time, including environmental and social concerns, and volatile and rapidly
escalating prices. As such, a relatively significant externality cost was identified. Up-
to-date review, however, reveals a relatively stable price situation to exist today for
both cobalt and lithium, suggesting no significant externality cost is applicable at this
time.
o FCEB involve two metals of concern, specifically platinum and palladium, in the
construction of proton exchange membrane (PEM) fuel cells. While both metals are
expensive, up-to-date review reveals no specific concerns with excessive price
volatility or price escalations, suggesting as well no significant externality cost is
applicable at this time.
• Weight Damage Cost: Costs for the relevant major bus options are summarized as follows:
o For the alternative bus technologies considered, both BEB and FCEB involve
appreciably heavier weight than comparable conventional buses, whether used with
diesel fuel or 100% renewable diesel. Given that roadway infrastructure damage
increases by the fourth power of the axle weight of the vehicle involved, the heavier
mass of the BEB and FCEB imposes additional damage costs, which were evaluated
in more detail by Parsons et al. (2017). A relatively simple preliminary methodology
was employed at the time, termed “Equivalent Single Axle Load” or ESAL. For
simplicity, based on the earlier analysis, the annual cost per BEB or FCEB translates
to approximately $860 per bus, and is assumed for the analysis.
• Air Pollution Cost: Conventional air pollutants, termed CAC as noted earlier, are
byproducts of fuel combustion, and are typically governed through environmental-related
regulations of some kind. The main constituents of concern include: nitrogen oxides (NOx);
volatile organic compounds (VOC); designated toxic compounds, such as formaldehyde or
benzene, which are termed “air toxics”; particulate matter (PM); and carbon monoxide (CO).
Releases of these constituents are determined primarily by the nature of the engine or
combustion system involved, rather than the fuel, and are applicable whenever combustion
of some kind occurs. A formerly important concern in the past had been sulphur oxides
(SOx), which were indeed tied primarily to the fuel itself (Parsons et al. 2017), however,
implementation of “ultra-low sulphur diesel” or ULSD has effectively mitigated this concern,
such that effectively no cost is applicable. Costs for remaining CAC for the relevant major
bus options are summarized as follows:
11o For conventional buses, both using diesel fuel and 100% renewable diesel, the
suitable cost to account for conventional air pollutants with annual travel of 50,000
km, based on analysis by Parsons et al. (2017) is $426 annually. This cost is
assumed for the analysis.
o For BEB, a small amount of diesel is consumed for auxiliary heating, such that a cost
was estimated simply using a ratio of fuel consumption compared to a diesel bus,
i.e., 0.9 ÷ 60 or 1.5% of conventional diesel, which translates to $6 annually, with this
cost assumed with BEB for the analysis.
o No diesel fuel combustion occurs either directly or indirectly for the FCEB, so there is
zero cost in this case. Even for the case of steam methane reforming, any
combustion of natural gas occurs in a stationary rather than mobile situation, and is
controlled in such a way that CAC contributions and costs are negligible.
• Waste Engine Fluids Cost: Costs for the relevant major bus options are summarized as
follows:
o For conventional buses, both using diesel fuel and 100% renewable diesel, the
suitable cost to account waste engine fluids, including lubricating oil and antifreeze,
with annual travel of 50,000 km, based on analysis by Parsons et al. (2017) is $17
annually. This cost is assumed for the analysis.
• Battery/Fuel Cell Disposal Cost: Costs for the relevant major bus options are summarized
as follows:
o For conventional buses, impacts regarding final disposal are already understood and
monetized. A potentially growing, but as yet not entirely certain problem for both
BEB and FCEB is final recycling and/or disposal costs for batteries and fuel cells.
o For BEB, the estimated cost for final disposal of batteries is estimated to be about
$5,000 per tonne on a present value basis. BEB incorporating larger battery packs
contain about 2.7 tonnes of batteries, while BEB incorporating smaller battery packs
contain about 1.4 tonnes. Final disposal costs thus translate to $13,500 and $7,000,
respectively, on a present value basis.
o For FCEB, the lack of any significant quantities of fuel cells limits the ability to
estimate a final recycling or disposal cost for these. There could well be some cost
involved, however, still uncertain. At the same time FCEB operate primarily as
hybrids and also contains quantities of batteries, about 0.6 tonnes. Final disposal
costs in this case thus translate to $3,000, on a present value basis. Further review
of disposal-related costs for FCEB is warranted.
122.6 Limitations of Analysis: Key limitations of the analysis as undertaken are summarized as
follows:
• The results of the report, as presented, only reflect analyses undertaken as part of an
academic course of study, and are provided solely for information purposes.
• Findings of this report do not constitute formal recommendations, as might be obtained from
the engagement of a qualified professional consultant organization.
• The results of the analysis, as reported, reflect various operating and cost assumptions,
known in cases to be preliminary in nature and/or with uncertainties, and as such requiring
verification.
• Analysis includes no costs for redundancies in systems, as may be required in some
instances, and that would reflect a need to increase relevant costs.
• The results are based on available public domain information sources that are as up-to-date
as possible, but may not necessarily reflect costs as may be incurred for actual
implementation into the near future. More precise information, as provided in formal
quotations or from other proprietary sources, could provide somewhat different results.
• The results, as presented, are based on the incremental, stand-alone implementation of
zero-emission transit technology options equivalent to 16 conventional diesel buses.
Implications of overall system implementation covering Winnipeg Transit’s entire fleet are
thus not considered, and could well differ somewhat from just looking an initial step
implementation, as considered here.
• Training costs and other costs related to integration are not included.
• GHG emissions calculations are based on the methodology of the National Inventory Report
(NIR), which considers only emissions generated within the jurisdiction under consideration
itself. This method does not correspond to either a combustion-only basis (sometimes
termed “tank-to-wheels” evaluation) or a full-cycle basis (sometimes termed “well-to-wheels”
evaluation), but is valid in its own right, representing the manner in which individual
jurisdictions and entities within those jurisdictions are judged within the context of the NIR.
• Although modal-shift related emissions reduction is mentioned in the Discussion section, it is
not considered in the evaluation of GHG emissions for the various zero-emission transit
options as part of the analysis and costing.
133. Results
Present value costs, in millions, for all of the bus options considered are summarized in Table 4,
broken down into firstly initial costs, which include bus purchase and infrastructure and which
are typically are most constraining for municipal governments, and secondly ongoing costs,
which include fuel, maintenance and externalities.
Table 4: Comparison of 12-Year Present Value Costs for Options Considered
Bus Option Initial Costs Ongoing Costs Total Costs
Considered ($ million) ($ million) ($ million)
16 Conventional buses (Diesel fuel) $11.10 $9.30 $20.40
16 Conventional buses (Renewable) $13.10 $11.50 $24.60
16 BEB (Depot charging) $24.40 $4.00 $28.40
20 BEB (Depot charging) $30.40 $4.80 $35.20
16 BEB (On-route charging) $19.50 $3.60 $23.10
20 BEB (On-route charging) $23.40 $4.20 $27.60
16 FCEB (SMR hydrogen) $26.40 $7.90 $34.30
16 FCEB (Electrolysis hydrogen) $26.40 $10.00 $36.40
Cost breakdowns of the different options in terms of the five major cost categories considered
(i.e., buses, infrastructure, fuel, maintenance and externalities) are provided in individual plots
on a consistent cost scale:
• Conventional buses using diesel fuel, and using 100% renewable diesel in Figure 5;
• BEB involving larger battery packs and using depot charging in Figure 6;
• BEB involving smaller battery packs and on-route charging in Figure 7; and
• FCEB using hydrogen from steam methane reforming and from electrolysis in Figure 8.
Total 12-year cumulative GHG emissions are summarized in Table 5. Also included are
estimated net emissions reduction values compared to base-case, and resulting overall costs
per tonne of emissions reduction. The latter involve differences in present value total cost
relative to the base case (in Table 4), divided by respective estimated net reduction (in Table 5).
Table 5: Comparison of 12-Year Cumulative GHG Emissions Results
Bus Option Total Emissions Net Reduction Reduction Cost
Considered (tonnes) (tonnes) ($ per tonne)
16 Conventional buses (Diesel fuel) 14,941
16 Conventional buses (Renewable) 922 14,020 $300
16 BEB (Depot charging) 259 14,682 $545
20 BEB (Depot charging) 324 14,617 $1,012
16 BEB (On-route charging) 259 14,682 $184
20 BEB (On-route charging) 324 14,617 $493
16 FCEB (SMR hydrogen) 7,200 7,741 $1,796
16 FCEB (Electrolysis hydrogen) 154 14,788 $1,082
14Observations regarding the results of the analysis are presented as follows:
• In terms of absolute emissions, and resulting net emissions reduction data in Table 5, the
following order of performance is evident:
o FCEB, using hydrogen sourced via electrolysis, show the lowest absolute emissions
of any of the options, and thus the highest overall net emissions reduction (i.e.,
99%). This is given the need to use DEF in conjunction with renewable diesel, and
the need for some auxiliary diesel fuel for heating with BEB.
o BEB, where 16 buses can be employed, irrespective of charging, show the second
lowest absolute emissions, and thus the second highest net emissions reduction
(i.e., 98%).
o BEB, where 20 buses must be employed, irrespective of charging, show the third
lowest absolute emissions, and thus the third highest net emissions reduction (i.e.,
97%).
o Conventional buses employing 100% renewable diesel show the fourth lowest
absolute emissions, and thus the fourth highest net emissions reduction (i.e., 94%).
o FCEB, using hydrogen sourced via steam methane reforming, show the fifth lowest
absolute emissions, and thus the fifth highest net emissions reduction (i.e., 52%).
• For the zero-emission technologies, the present value total cost data in Table 4, and the
costs per tonne emissions reduction values outlined in Table 5, both suggest the following
relative order in terms of economic viability, including externalities:
o Conventional buses using 100% renewable diesel appear at first glance to have a
relatively low cost to achieve emissions reduction, however, as discussed further,
there are significant uncertainties in terms of supply availability.
o BEB, involving smaller battery packs and using on-route charging, depending on
number of buses required, can be either best or second best in terms of overall
costs, and lowest costs to achieve emissions reduction.
o BEB, involving larger battery packs and using depot charging, appear to have
somewhat higher overall costs, and higher costs to achieve emission reductions.
o FCEB, whether using hydrogen sourced via electrolysis or steam methane reforming
or have the highest overall costs, with the latter showing the highest costs to achieve
emission reductions.
15Figure 5. Breakdown of 12-Year Present Value Costs for 16 Conventional Buses using Diesel
and 16 Conventional Buses using Renewable Diesel
Figure 6. Breakdown of 12-Year Present Value Costs for 16 BEB and 20 BEB involving Larger
Battery Packs and using Depot Charging
16Figure 7. Breakdown of 12-Year Present Value Costs for 16 BEB and 20 BEB involving Smaller
Battery Packs and using On-Route Charging
Figure 8. Breakdown of 12-Year Present Value Costs for 16 FCEB using Hydrogen from Steam
Methane Reforming and using Hydrogen from Electrolysis
174. Discussion
4.1 Major Insights from Analysis: A variety of insights emerge from the results of the analysis,
summarized as follows:
“Achieving emissions reduction will incur a net cost for the City of Winnipeg”
• A major reason for considering zero-emission technologies is the reduction of GHG
emissions. Yet, it is obvious from the data in Table 4 that all of the zero-emission transit
technologies, as evaluated, end up having a higher present value of total costs than for the
base-case, involving conventional buses using diesel fuel, this even with identified
externalities monetized and included in the totals. This confirms that in order to achieve
GHG emissions reduction, by whatever means, the City of Winnipeg would incur a net cost.
This situation is important to understand for discussions with and to communicate to higher
levels of government.
“Federal carbon tax level is grossly insufficient on its own to prompt any changes”
• As part of the analysis of externalities, a levy for diesel fuel blend is included sufficient to
meet the $50 per tonne carbon pricing level, as required by Canada Revenue Agency (CRA)
starting April 2022 (CRA 2018). The federal tax already imposes additional costs on transit
agencies, including Winnipeg Transit, yet the level of carbon tax makes little difference in
changing the relative economics of the options. Indeed, as a sensitivity-related evaluation,
consideration of increased carbon tax was briefly investigated. It was determined that in
order to prompt changes on its own, i.e., to make the present value costs of the base-case
more comparable to the alternative options, the level of the tax would have to be almost ten
times higher, i.e., $500 per tonne equivalent, which is an entirely unrealistic level.
“Currency exchange rate with the USD is surprisingly critical”
• For the zero-emission transit options, the initial costs, i.e., bus purchase and associated
infrastructure, are significantly higher than for the base-case, which involves just
conventional diesel buses. A lesser-known characteristic of the North American transit bus
industry is that transactions are based in USD. A significant but unexpected barrier for zero-
emission transit technologies emerges. Given strong emphasis on initial capital-oriented
costs, relative economic viability depends critically on the currency exchange rate. In the
earlier analysis by the Joint Task Force (JTF 2016), BEB options were found to be only
somewhat more expensive, with the expectation for improvement into the future. Yet, the
current analysis, based on similar assumptions, shows viability compared to diesel to have
worsened somewhat. A key difference over the intervening period from 2016 to present is
softening of the CAD. Volatile currency exchange represents an entirely economic problem,
with identification of this dependency likely the most important new finding of the analysis.
“Using renewable diesel appears economically positive, but likely not realistic”
• Conventional buses using 100% renewable diesel appear at first glance to have a low cost
to achieve emissions reduction. This option was included largely to permit a cost
18comparison, however, at the same time there are significant uncertainties for supply, even at
the high price considered. There are currently no appreciable quantities of renewable diesel
yet produced in Canada, and recent analysis by Carter (2018) for the U.S. shows their
domestic production to be insufficient to meet their own demands, requiring significant net
imports, primarily from Asia. With no prospect for reasonably predictable availability, this
option cannot be realistically pursued.
“Site specific electricity rate structure is critical to incorporate when considering BEB”
• This is likely the second most important new finding of the investigation and analysis.
• This aspect is utility-specific, with the nature of Manitoba Hydro’s General Service Medium
rate directly considered, involving component fees for service, demand and energy. This
aspect of the analysis is also relatively unique among studies in the recent past.
• Many recently published investigations, including Marcon (2016) for Edmonton Transit
System, Aber (2016) for New York City Transit, Tong et al (2017), and even local reports
(i.e., JTF 2016 and RRC 2018), employ simplified unit-energy prices per kWh, not including
demand fees as would be incurred in practice. Issues with demand fees have begun to be
noticed (e.g., TTC 2018, Lowell 2019, BC Hydro 2019), and will need to be addressed.
• The costing approach, as undertaken in this work, is more complicated, but more realistic.
• The analysis, as undertaken, leads to clarifying a potential advantage for on-route charging,
based on the operational assumptions as employed. An important implication in earlier
studies, not considering demand fees, is that using only an unit-energy price per kWh leads
invariably to selecting a depot-charging option, given on-route chargers are more expensive.
• The presence of demand fees in Manitoba Hydro’s relevant rate structure, especially with
depot charging options, could also be addressed using load management techniques and
technologies, the latter including newer battery-based approaches as involved in a recently
announced local demonstration project (NRCan 2019).
• As part of the analysis work, full-electrification of a single route has been identified as one
option for the initial BEB implementation step, this in order to better evaluate suitability and
performance. In this regard, the #20 Watt route represents a useful candidate, given both
experience already with the route through the earlier pilot, and some remaining electrical
support infrastructure at the airport that may be reusable.
“Clarifying bus replacement ratio for BEB compared to conventional diesel buses is important”
• A significant uncertainty remaining for BEB is the number of such vehicles required in
practice to replace a conventional diesel bus. Two ratio values were considered: (a) 1.00 to
one replacement; and (b) 1.25 to one replacement. As outlined in Table 4, an increase of
25% in the number of buses increases the present value of total costs between 20% and
25%, as would be reasonably expected, but as outlined by data in Table 5, essentially
doubles the cost per tonne for emissions reduction. In terms of improving economic viability
for BEB, better clarifying how many more buses would be required is thus important.
“Considering extended lifespan may improve economic viability, especially for BEB”
• For the analysis as undertaken, a standard lifespan of 12 years is assumed, also consistent
with an earlier analysis in Winnipeg (JTF 2016). However, Winnipeg Transit tends to keep
19You can also read