Transit Development Plan 2016 - 2021 Adopted by the BFT Board of Directors - Ben Franklin Transit
←
→
Page content transcription
If your browser does not render page correctly, please read the page content below
2016 – 2021
Transit Development
        Plan
   Adopted by the BFT Board of Directors
              July 14th, 2016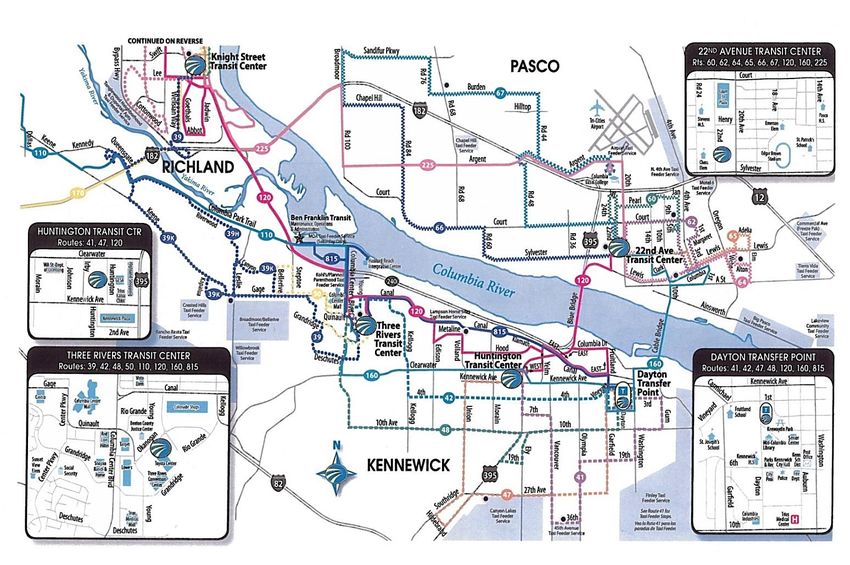
General Manager:                                   Gloria Boyce

Interim Administrative Services:                   Kevin Hebdon
Interim Operations Manager:                        Katherine Ostrom
Maintenance, Facilities & Special Projects:        Jerry Otto
Interim Human Resources Manager:                   Christine DeVere
Planning & Service Development Manager             Tony Kalmbach
Marketing & Customer Service Manager               Christy Watts
Rideshare Manager                                  Terry DeJuan

Ben Franklin Transit
1000 Columbia Park Trail
Richland WA, 99352
(509) 734-5100

BFT operates its programs without regard to race, color and national origin. To receive
additional information on BFT’s discrimination obligations including our complaint
procedures please contact us at (509) 734-5119.

Transit Development Plan 2016 – 2021                                            Page ii
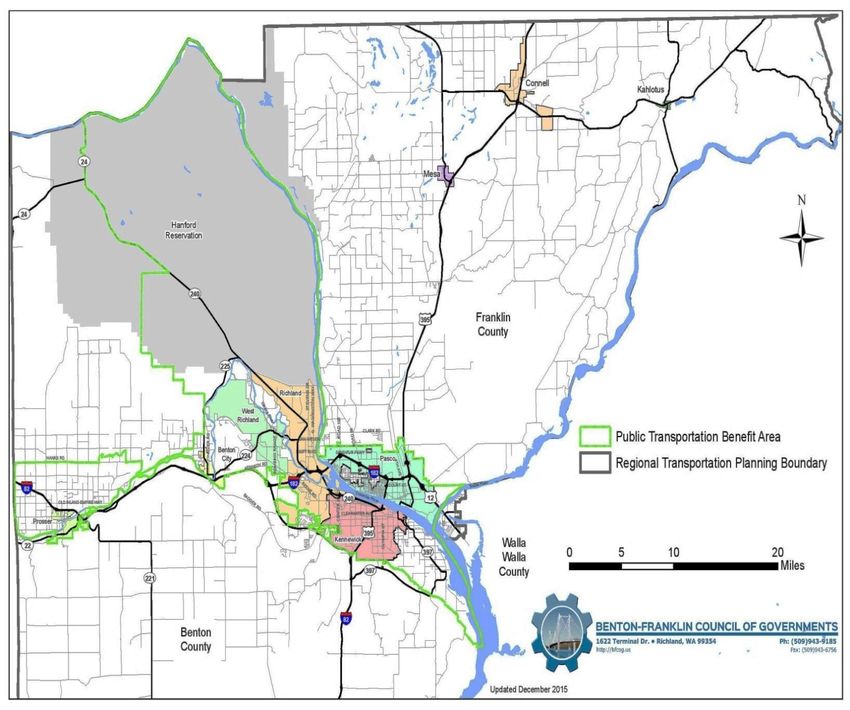
TABLE OF CONTENTS
Section 1        Introduction ....................................................................................................................... 1
Section 2        Agency Overview ............................................................................................................. 3
  Background ....................................................................................................................................... 3
  Governance ....................................................................................................................................... 4
  Organization ...................................................................................................................................... 5
Section 3        Public Participation ........................................................................................................... 7
  Title VI .............................................................................................................................................. 7
  Public Involvement Processes........................................................................................................... 8
  General Public Comment Procedures ............................................................................................... 9
  Customer Comments ....................................................................................................................... 10
Section 4        Service Characteristics .................................................................................................... 11
  Fare Structure .................................................................................................................................. 14
Section 5        BFT Accomplishments & Objectives ............................................................................. 15
  Washington Transportation Plan (WTP 2035) ............................................................................... 15
  Ben Franklin Transit Strageic Plan ................................................................................................. 16
  2015 Accomplishments ................................................................................................................... 17
Section 6        Budget & Plan Assumptions 2016 – 2021 ...................................................................... 19
Section 7        Service Plan .................................................................................................................... 21
Section 8        Service Performance ....................................................................................................... 22
  Projected Operating Data, 2016 – 2021 (in thousands) .................................................................. 24
  Proposed Service Changes, Vehicle Purchases & Facilities Improvements................................... 25
Section 9        Financial Plan 2015 - 2021 ............................................................................................. 26
Section 10           Program of Projects - Capital Projects 2016 - 2021 ................................................... 27
  Vehicle Procurement Projections 2016 - 2021 ..................................................................... 27
  Program of Projects 2016 - 2021 ............................................................................................ 29

Appendix A           Facilities Overview & Park N Ride Data.................................................................... 32
Appendix B           List of Equipment ....................................................................................................... 39

Transit Development Plan 2016 – 2021                                                                                                           Page iii
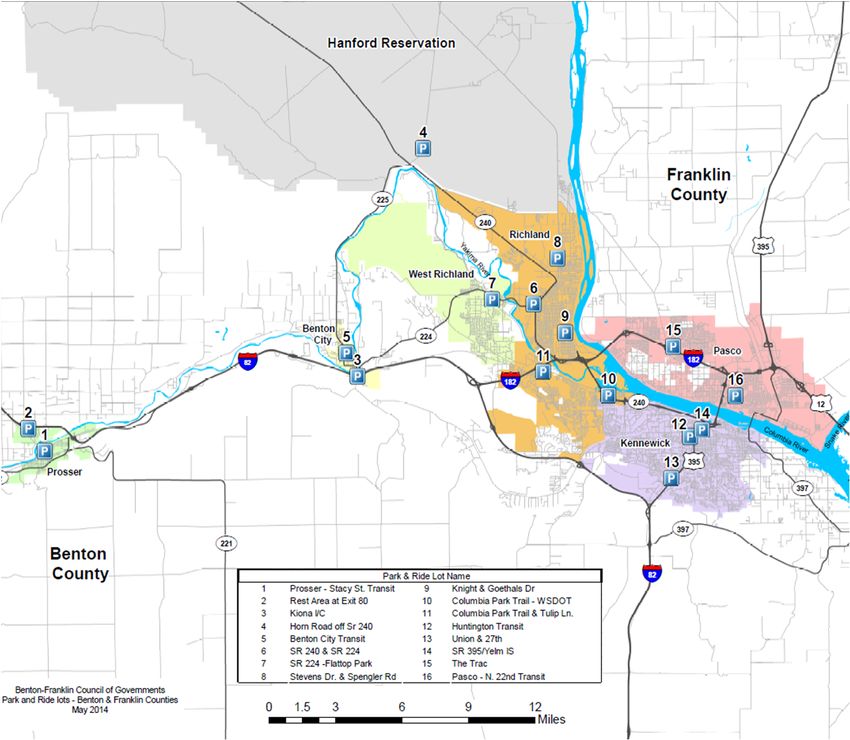
TABLE OF FIGURES
Figure 1: Ben Franklin Transit Organizational Chart 2016 .................................................................. 5
Figure 2: Ben Franklin Public Transportation Benefit Area Boundaries* ........................................... 6
Figure 3: Transit System Map............................................................................................................. 13
Figure 4: 2015 Unlinked Passenger Trips by Mode* ......................................................................... 22
Figure 5: Unlinked Passenger Trips Comparison 2005 - 2015* ......................................................... 23
Figure 6: Benton - Franklin Park & Ride Lots ................................................................................... 38

TABLE OF TABLES
Table 1: Force Account* ....................................................................................................................... 5
Table 2: Major Employers using BFT Vanpool ................................................................................. 14
Table 3: Fare Structure*...................................................................................................................... 14
Table 4: Service Types and Levels: Year End 2014 - 2015 calculations* ......................................... 23
Table 5: Projected Operating Data 2016 – 2021* ............................................................................... 24
Table 6: Proposed Service Changes, Vehicle Purchases and Facilities Improvements
          2016 – 2021 ........................................................................................................................ 25
Table 7: Financial Forecasting Model 2015 – 2021* ......................................................................... 26
Table 8: Owned Facilities Inventory*................................................................................................. 32
Table 9: Benton - Franklin Park & Ride Lots ..................................................................................... 37

Transit Development Plan 2016 – 2021                                                                                                  Page iv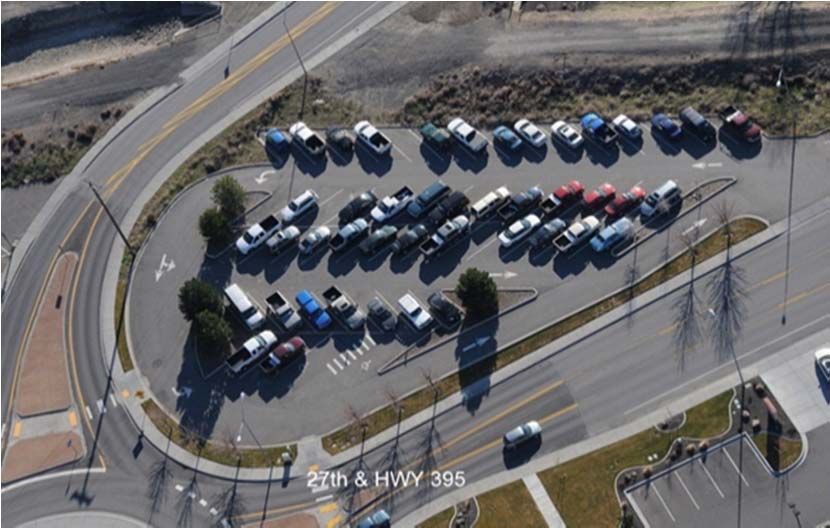
SECTION 1 INTRODUCTION
Ben Franklin Transit’s Transit Development Plan (TDP) provides a summary of information as well
as projected changes over the next six-years. BFT is required to submit the six-year plan per RCW
35.58.2795 to the Washington State Department of Transportation (WSDOT) on an annual basis.
The information contained herein will be used as part of WSDOT’s annual report to the Washington
State Legislature.
TRANSIT DEVELOPMENT PLAN (TDP) & PROGRAM OF PROJECTS (POP)
The TDP is a six-year transit plan required by the Washington State Legislature and Federal Transit
Administration. The TDP is prepared by the independent transit properties and submitted to the
State DOT for approval and final submittal to the Federal Transit Administration. The TDP includes
a summary document which shows the size of the fleet, costs, revenue, service revenue hours,
revenue miles, expenses, operating characteristics and capital expenditures. Public hearings and a
thirty-day comment period are held to obtain input from the public on the TDP. The POP is a listing
of planned capital expenditures including construction, vehicles, equipment and consulting support
that are funded with FTA grants, state and local funding.
TRANSIT IMPROVEMENT PLAN (TIP)
The TIP is a planning document that identifies capital projects expected to be funded with federal
and state grants. The TIP is prepared annually by Benton Franklin Council of Governments (BFCG)
and includes BFT’s TDP. All TIPs from local jurisdictions, counties and city agencies are compiled
into a Regional TIP as required by the federal government. If a capital item BFT would like to
pursue is not listed in the TIP, it cannot be funded with state or federal money. The TIP is only for
capital projects and represents the Capital Plan section of the TDP. Although the TIP is a federal
requirement, the document goes through approval by the region and the state. Public hearings are
held to obtain comments from the public on the TIP and again as the projects become part of the
State Transportation Improvement Plan.
PROCEDURES
In order to ensure the maximum opportunity for public input and involvement in the decision
process regarding major service changes and fare increases, BFT adheres to the following
procedures:
Provide at least a 30 day advance notice of public hearings regarding major service changes
or fare increases, in both Spanish and English.
Customers, the public and the community will be informed of the proposed change,
comment process and public hearings by way of: newspaper display ads, multimedia news
releases, onboard fliers, and postings at BFT offices and on BFT’s website, all in both
Spanish and English.
Transit Development Plan 2016 – 2021 Page 1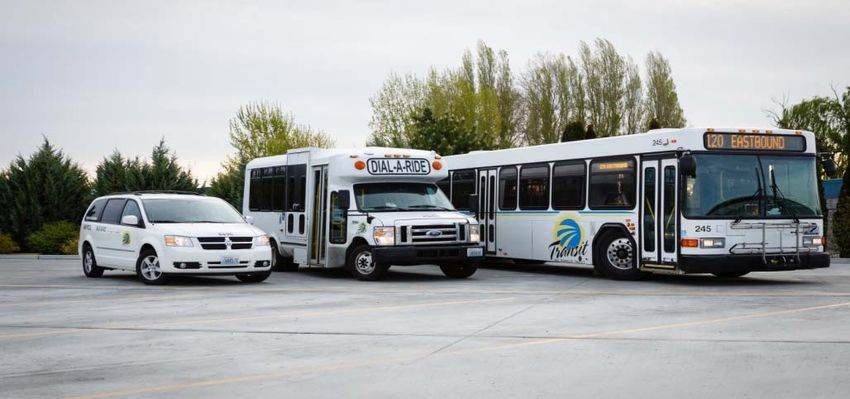
Proposals for major service changes and fare increases are also submitted to the BFT
Citizens Advisory Committee (CAC) for review and comment. The CAC is a group of
citizens that includes representatives of the disabled, low income, educational institutes,
major employers and limited English proficiency (LEP) portions of our customer base.
BFT staff facilitates the meetings and makes regular presentations to the group, seeking
input and in-depth discussions.
All input and comments including minutes of public hearings and CAC and BFT staff
recommendations are provided to BFT’s Board of Directors (Board) prior to any decision
regarding any program of projects, major service changes, fare changes and other policies
as needed. Interpreters are present at public hearings to translate information and take
comments.
ADOPTION TIME LINE & PUBLIC PROCESS
The six-year TDP is developed using staff input, information from BFT’s Board and public input.
The draft plan includes a summary of the completion of the project goals reflecting agency core
values. Public comment is sought through the Citizen Advisory Committee as well as a public
hearing advertised thirty days prior to the hearing. The Board receives copies of all public
comments and participates in discussions during committee meetings, Board retreats and regularly
scheduled Board meetings. The meetings are open to the public and the dates and times are posted
on our website (www.bft.org). The flow chart shown below depicts the TDP development and public
process.
Public Process: Transit Development Plan
April and May: June: July:
Staff develops TDP, presentation Staff presents Draft TDP to
to board committees of Program Board Committees and the
Hold Public Hearing
of Projects, Assumptions and CAC for public input
Accomplishments. release.
August: September:
July/August Approval: Joint BFCG and BFT open Submittal to WSDOT
Board of Directors house, submit final TDP to by BFCG
BFCG
Transit Development Plan 2016 – 2021 Page 2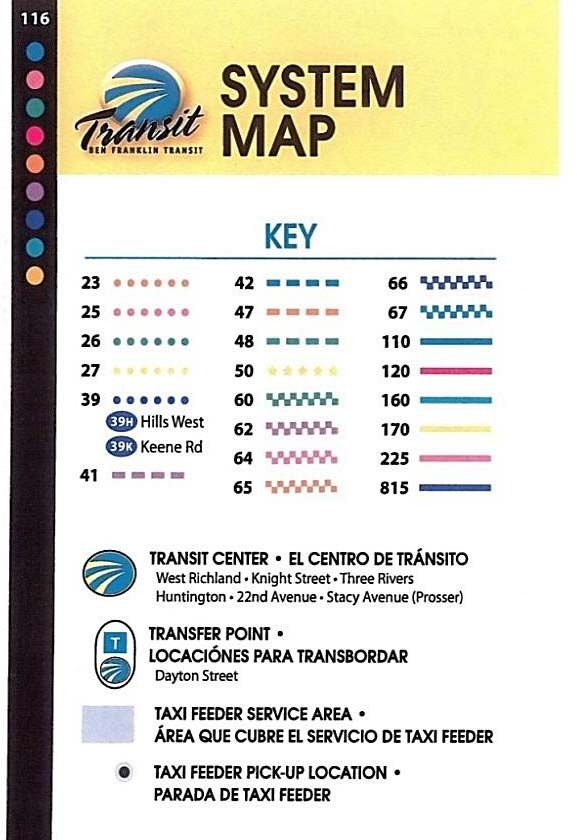
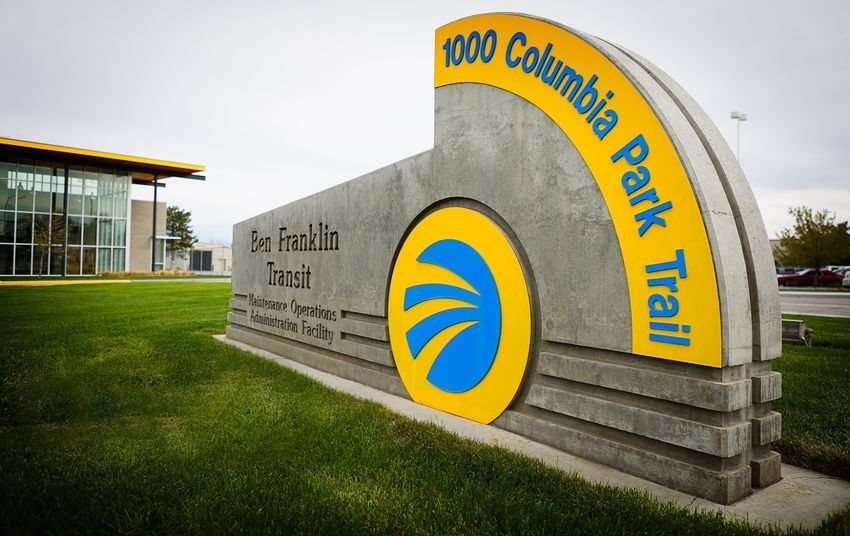
SECTION 2                 AGENCY OVERVIEW

MISSION

The mission of Ben Franklin Transit is to provide exceptional and cost-effective transportation
services that consistently exceed customer expectations while promoting the principles and practices
of livable communities and sustainable development.

BACKGROUND

Ben Franklin Transit (BFT) is a municipal corporation, which provides public transportation services
in a 616 square mile area known as the Public Transportation Benefit Area (PTBA), serving an
estimated population of 246,149 in 2014 (Washington State Financial Management, Forecasting and
Research Division) Figure 2. BFT’s Public Transportation Benefit Area covers portions of Benton
and Franklin Counties including the jurisdictions of West Richland, Prosser, Benton City, Richland,
Kennewick, Finley, and Pasco. BFT’s headquarters and maintenance facility are located at 1000
Columbia Park Trail, Richland, Washington 99352. The Customer Service Office is located at the
Three Rivers Transit Center, 7109 W Okanogan Pl, Kennewick, Washington 99337. For more
detailed information on all BFT facilities, transit centers and park and rides, please refer to Appendix
A.

BFT was formed May 11, 1981, when the voters in the service area voted to levy a 0.3 percent sales
tax to support public transit with a 64% majority. The Dial-A-Ride system was started January 1,
1982, by contract with the Benton Franklin Developmental Center. BFT assumed the operation of
the Dial-A-Ride system January 1, 1985. The Vanpool service was initiated in September of 1982,
under a contract with the Benton-Franklin Council of Governments. BFT took over Vanpool
operations on January 1, 1984.

On November 4, 1997, the voters of Benton City and Prosser elected to be annexed to the Benton
Franklin Public Transportation Benefit Area (PTBA), with a 62% majority. Service was contracted
with the City of Prosser to provide service to the communities of Prosser and Benton City using their
Prosser Rural Transit system. In January 1999, BFT took over the Prosser and Benton City
Operations. On May 15, 2001 an additional sales tax proposition of 0.3 percent was voted on. It
was narrowly defeated by 169 votes. On March 12, 2002, the Voters of Benton and Franklin
Counties approved the sales tax proposition of 0.3 percent. Voting statistics by county are as
follows: Franklin County--53.5% and Benton County--56.28%. On April 26, 2005 the Voters of
Finley elected to be annexed to the Benton Franklin PTBA with a 65.12% majority. Currently, the
authorized taxing level is 0.6 percent total sales and use tax - 0.3 was approved in May 1981 and an
additional 0.3 percent was approved in March 2002.

Transit Development Plan 2016 – 2021                                                            Page 3
GOVERNANCE

BFT is a Public Transportation Benefit Area governed by a ten member board of directors. The
Board consists of two Franklin County commissioners, one Benton County commissioner, a city
council member from each of six cities: (Richland, Pasco, Kennewick, West Richland, Benton City,
and Prosser) and one non-voting Collective Bargaining Representative. Our Board of Directors
holds public meetings the second Thursday of each month at Ben Franklin Transit’s Administration
building located at 1000 Columbia Park Trail, Richland, 99352.

                                     Board of Directors
                              Watkins, Matt, Chair – City of Pasco
                            Koch, Bob, Vice Chair – Franklin County
                                Becken, Steve – City of Prosser
                                Parish, Paul – City of Kennewick
                                 Miller, Rick – Franklin County
                             Bloom, Richard, City of West Richland
                              Christensen, Terry – City of Richland
                                Delvin, Jerome – Benton County
                                Stade, Lisa – City of Benton City
                   Nelson, Norma – Non-Voting Union Rep, Teamsters Union

                               Alternate Board of Directors
                                 Garrison, Mike – City of Pasco
                               Trumbo, John – City of Kennewick
                                Taylor, Randy – City of Prosser
                                 Peck, Brad – Franklin County
                               Buel, Rich – City of West Richland
                               Thompson, Bob – City of Richland
                                 Small, Shon – Benton County
                             Sandretto, David – City of Benton City
                   Lilyblade, Chris – Non-Voting Union Rep, Teamsters union

Transit Development Plan 2016 – 2021                                                     Page 4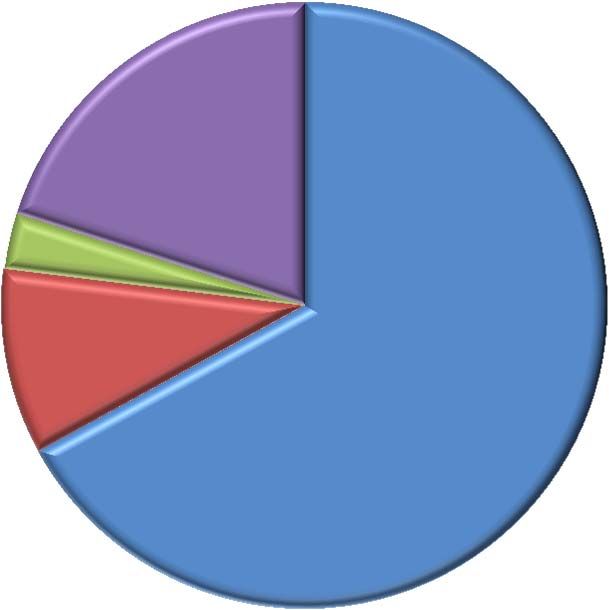
ORGANIZATION

BFT does not discriminate on the basis of race, color or national origin. BFT is an equal opportunity
employer. BFT’s 2016 budget included the following number of positions listed by Department:
Table 1: Force Account*
         Department                           Current                          Proposed
Operations                                    114.0                             114.0
Dial-A-Ride                                    91.5                             91.5
General Demand                                  8.5                              8.5
Vanpool                                         5.0                              5.0
Maintenance                                    32.0                              32.0
Human Resources                                 4.5                              4.5
Administration                                 12.5                             12.5
Service Development                            11.0                              11.0
                                               279                               279
*Data source BFT 2016 Budget

Figure 1: Ben Franklin Transit Organizational Chart 2016

Transit Development Plan 2016 – 2021                                                         Page 5
Figure 2: Ben Franklin Public Transportation Benefit Area Boundaries* *Data Source BFCG Transit Development Plan 2016 – 2021 Page 6
SECTION 3 PUBLIC PARTICIPATION
Board Meetings: The Board holds monthly meetings the 2nd Thursday of each month and the public
is invited to attend.
Customer Comment Process: Citizens may call BFT’s Customer Service Department to report a
complaint, suggestion, or service request. All comments are input into a database and then
distributed to the respective department to be addressed as needed.
General Awareness Surveys: BFT conducts surveys every to onboard riders, and a general
awareness survey is conducted every 5-6 years. Both surveys are staggered so that a survey is
performed every three years. In addition, there are route or service specific surveys taken as needed
to help BFT make informed service changes. These are distributed in Spanish and English and are
often coordinated with other agencies.
Bilingual Outreach: BFT provides an outreach program to Spanish-speaking customers to help
them understand how to ride the bus through seminars and one-on-one assistance. BFT attends
Hispanic tradeshows and delivers information on its Title VI and DBE programs. Spanish is the
primary language for a significant portion of the people in our communities. BFT provides Spanish
translations in all of our published schedules and public notices. Spanish speaking translators attend
our public meetings and if a significant portion of the attendees speak Spanish, we translate the full
presentation. In addition, a telephone translation service is available in customer service to aid
communication for all languages. Additionally, BFT’s website can be translated through Google
Translate allowing for all information and trip information to be available in numerous languages.
TITLE VI
BFT does not discriminate on the basis of race, color or national origin.
BFT is committed to ensuring that no person is excluded from participation in or denied the
benefits of its transit services on the basis of race, color, or national origin, as protected by
Title VI in Federal Transit Administration (FTA) Circular 4702.1.B. A complaint process is
in place for anyone with concerns about discrimination.
BFT is committed to breaking language barriers by implementing consistent standards of
language assistance across its service area.
There are pass and ticket outlets located throughout the area; in addition, these may be
purchased on line at www.bft.org or by standard mail.
Community Outreach is a requirement of Title VI. As such, BFT seeks out and considers the
viewpoints of minority and low-income populations in the course of conducting public outreach.
BFT has wide latitude to determine what specific measures are most appropriate and makes this
determination based on the composition of the affected population, the public involvement process,
and its available resources. BFT consistently and continually engage the public in its planning and
decision-making processes as well as its marketing and outreach activities.
Transit Development Plan 2016 – 2021 Page 7It is the policy of BFT to encourage broad comment and input on proposed Program of Projects,
Service Changes, Fare Changes and various policies. Title VI requires setting thresholds for this
process to be implemented, as well as a complaint process. The Disproportionate Burden and/or
Discriminatory Impact Policies are included in this document, as they state required public input and
BFT’s intention to resolve any concern regarding changes in the system.
Finally, BFT encourages broad comment on policies that may impact our customers, and frequently
carries out surveys, public forums and open houses in addition to formal processes. The Customer
Comment Records capture concerns or compliments received from the public; this process is
detailed below.
PUBLIC INVOLVEMENT PROCESSES
Service Changes requiring a public process will include those changes defined in the BFT
Title VI policies. Additional policies may be taken through a Public Input Process at the discretion
of the General Manager. Public involvement will be undertaken for changes including but not
limited to the following:
A major service change is defined as any change in service on any individual route that
would add or eliminate more than twenty percent (20%) of the route revenue miles or twenty
percent of the route revenue hours. All major service changes will be subject to an equity
analysis, which includes an analysis of adverse effects.
A service change leading to an adverse effect is defined as a geographical or time-based
reduction in service, which includes but is not limited to: span of service changes, frequency
changes, route segment elimination, re-routing, or route elimination.
A service change that could lead to a disproportionate burden occurs when the low-income
population adversely affected by a fare or service change is twenty percent (20%) more than
the average low-income population of Ben Franklin Transit’s service area.
A disparate impact occurs when the minority population adversely affected by a fare or
service change is twenty percent (20%) more than the average minority population of Ben
Franklin Transit’s service area.
Changes to the Program of Projects (POP) as included in the Transit Development Plan
(TDP), Transportation Improvement Program (TIP), or any Environmental Justice (EJ)
analyses. These are described more fully below.
Any fare changes.
Transit Development Plan 2016 – 2021 Page 8GENERAL PUBLIC COMMENT PROCEDURES
The BFT Customer Comment Policy has been established to ensure that riders of all modes of the
system, including bus, paratransit, vanpool and contracted services have an easy and accessible way
to provide feedback to the agency. Ben Franklin Transit is open to hearing any customer feedback
including complaints, comments, suggestions, or concerns.
To Provide Public Comments Contact Ben Franklin Transit by:
Postage-free Customer Comment Cards are available on BFT and contractor vehicles and
at Pass Outlets in Spanish and English. Included in Appendix “B” after the Title VI forms.
US Mail.
Telephone: Riders can contact Ben Franklin Transit Customer Service Department or use
established public comment lines when available.
E-mail: Riders can contact Ben Franklin Transit by e-mail.
Language Line: For riders who speak a language other than English, Ben Franklin Transit
will utilize the services of The Language Line to facilitate calls. BFT emphasizes bilingual
staffing to assure communications with LEP customers.
In-person at the Three Rivers Customer Service Center or the Administration Building.
Website: Riders can offer feedback on the Ben Franklin Transit website (www.bft.org), by
going to the “Contact Us” link. Google Translate is linked to our site and assists
communication with LEP customers.
Feedback Review Process: All feedback from customers is valued. Anyone who submits a
comment, complaint, or service suggestion to Ben Franklin Transit and requests a response will
receive an initial response within fifteen (15) working days, provided they give legible contact
information.
Complaints are recorded and investigated by staff. Suggestions and improvements for the system
are made to address complaints if possible. Appropriate actions are taken to address complaints
regarding staff, equipment or processes.
Information about Policy: Information about the Customer Comment Policy, including how to
submit a complaint, is made available to riders in our schedule book, at all sales outlets and on our
vehicles.
Reporting: Staff will compile an annual summary of customer comments for the board and
employees for use in reviewing and evaluating service.
Transit Development Plan 2016 – 2021 Page 9CUSTOMER COMMENTS
The categories listed below are broad with specific complaints placed in each using the best
judgment of the staff person receiving the call:
Safety Issue: includes any safety related issues including driving.
Discourteous: includes any behavioral issues involving BFT staff.
Repeating Callers: are members of the public that call on a regular basis with similar or
varying complaints or comments.
Equipment Problems: all types of mechanical issues.
Fares: payment issues.
Bus Stop: usually locations (additional, or removal).
Schedule Change: timing issues.
Missed Connection: people missing their bus.
Passed by Passengers: bus did not stop and caller was at the stop.
Route Requests: additional locations.
Table 2: 2015 Customer Comments*
Service
Total Complaint Commendation Requests Unknown
Count % Count % Count % Count %
Bus Operations 434 331 76% 67 15% 35 8% 1 0%
Bus Stops 46 30 65% 1 2% 15 33% 0 0%
Contracted
73 59 81% 3 4% 11 15% 0 0%
Services
Customer Service 4 3 75% 1 25% 0 0% 0 0%
Dial ‐a‐Ride 121 73 60% 48 40% 0 0% 0 0%
Facilities / Maint 7 2 29% 3 43% 2 29% 0 0%
Other 5 5 100% 0 0% 0 0% 0 0%
Prosser / BC 0 0 0% 0 0% 0 0% 0 0%
Public Information 2 2 100% 0 0% 0 0% 0 0%
Vanpool 69 66 96% 2 3% 1 1% 0 0%
Total Records 761 571 75% 125 16% 64 8% 1 0%
*Data Source BFT CCR Database
Transit Development Plan 2016 – 2021 Page 10SECTION 4 SERVICE CHARACTERISTICS WEEKDAY AND SATURDAY FIXED ROUTE BUS SERVICE BFT has 23 routes serving Benton City, Kennewick, Pasco, Prosser, Richland, and West Richland. There are seven (7) Inter-City routes, routes providing service to multiple cities and 16 routes called locals, routes assigned to a specific city. During travel, a majority of riders make multiple transfers between routes to get to their final destination. Buses are scheduled to arrive at the transit centers at approximately the same time and leave at the same time so transferring from bus to bus is simple to do and easy to understand. Route and schedule information is available online at www.bft.org and in Google Transit. TAXI FEEDER ROUTES Premium service that provides linked service from lower density areas to regular fixed route service. Customers contact BFT’s contractor to schedule trips. Taxis pick up the customers at designated locations and then drop the customer off at the closest bus stop. Feeder service provides access to locations that would otherwise be too costly to serve with fixed route service. DIAL-A-RIDE PARATRANSIT SERVICE Ben Franklin Transit exceeds requirements set forth in the Americans with Disabilities Act (ADA) by providing Paratransit service within the PTBA. Service provided outside the ¾ mile of fixed routes requires a premium fare. Operating hours for Paratransit services are the same as fixed route. Trips include access to employment opportunities, medical appointments, and general access to the community. We provide reasonable modification to aid riders who utilize the services. BFT completed an “ADA Reasonable Modification Plan” in early 2013 that coordinated ADA processes and policies throughout the modes. This was taken out for public comment and approved by the Board of Directors in May and will be updated as needed. TRANS+PLUS NIGHT AND SUNDAY SERVICE Service that operates from 6:30 p.m. to 2:00 a.m. Monday thru Saturday and from 8:00 a.m. to 6:00 p.m. on Sundays, allowing customers access to transportation when regular services are not available. Reservation lines open at 2:00 p.m. daily and riders schedule trips as needed. Subscription trips may be booked for clients taking the same trips daily for weeks or months at a time; work related trips are a good example of subscription service. Tri-City Taxi currently provides this service. Transit Development Plan 2016 – 2021 Page 11
DEMAND RESPONSE SERVICES Demand response service provides trips as needed in low-density communities such as Prosser and Finley. Finley service is contracted by a local taxi company. Reservations are made the day prior to travel, or can be set up through a subscription. Designated stops have been established for pick-up by the taxi and BFT provides door-to-door service for Paratransit eligible riders. Prosser services are provided by Ben Franklin Transit. Reservations are made for the day prior to travel, or can be set up through a subscription. Designated stops have been established for pick-up and door-to-door service is available for Paratransit eligible riders. VANPOOLS BFT’s Vanpool program is a ride share alternative for those with long commutes. Volunteer drivers and riders share the cost of fuel, maintenance, and insurance through a monthly fare to utilize BFT vans. Vanpool drivers are fellow commuters, responsible for collecting the monthly fee and fueling the vehicle. The monthly Vanpool fare is based upon miles travelled. COMMUNITY VANS BFT makes 12-passenger and mini vans available for use on specific pre-approved trips with volunteer drivers and coordinators for community non-profit or governmental groups. Pre-approved trips are usually low frequency trips such as special events. Community Vanpools pay the full cost of mileage. CONNECTIONS Transportation Partners & Ben Franklin Transit Passenger Connections Tri-Cities Airport Grapeline service of Walla Walla Fixed route service to most schools Battelle and other North Richland business locations Tri-City Trolley: Hermiston & Pendleton Pasco Amtrak and Greyhound Station People for People service to Yakima, Othello, Mesa, Basin City and Connell Connects to Columbia Basin College in Pasco WSU Tri-Cities 16 Park and Ride lots within BFT’s service area Transit Development Plan 2016 – 2021 Page 12
Figure 3: Transit System Map

Transit Development Plan 2016 – 2021   Page 13
Table 2: Major Employers using BFT Vanpool

                                         Major Employers Served by Vanpools
  Bechtel                                        Facility                              Wahluke Schools
  Benton County                                  Energy Northwest                      Walla Walla Penitentiary
  Boise Cascade                                  Hanford Site                          Washington Beef
  Broetje Orchards                               Kadlec Medical Center                 Washington Closure Hanford
  Canoe Ridge Winery                             Mission Support Alliance              Washington River Protection
  Cayuse Technologies                            Portland Gas & Electric –             Solutions
  CH2M Hill                                      Boardman                              Washington State Penitentiary
  Columbia Crest Winery                          Priest Rapids Dam                     W M Bolthouse Farms
  Connell Elementary                             St. Michelle Estate
  Coyote Ridge Correctional                      U.S. Army Corps of Engineers

  FARE STRUCTURE

  The Board of Directors has asked staff to analyze fares every 3 years for any needed changes. BFT
  last restructured fares in June of 2012.

  Table 3: Fare Structure*
Adult and Dial-A-
                                                                     Day Pass            All ages all fixed route      $4.00
      Ride
      Cash                                               $1.50      Trans +Plus        All ages all times and days
   10 Tickets                                           $12.00          Cash                                           $3.00
  Monthly Pass                                          $25.00   10 Premium Tickets                                   $25.00
Premium Dial-A-         Pick-ups and drops beyond
                                                         $2.50     Freedom Pass           All hours & services        $50.00
      Ride                ¾ mile of fixed routes
     Youth              Age 6 through High School                Taxi Feeder/Finley    Less than 4 mile trip length    $1.00
                                                                    Premium Taxi                 Cash or
      Cash                                               $1.00   Feeder: More than 4        Premium Tickets            $3.00
                                                                   mile trip length
   10 Tickets                                            $8.00     Special Events
  Monthly Pass                                          $14.00     Cash per person                                     $1.50
    Summer                                                         Family up to 5
                              2010 application          $25.00                                                         $4.00
     Youth                                                             People
                          Medicare card or DSHS
  Medicare or
                          certificate with approved               Seniors, Reduced     With BFT Picture ID Card        $0.75
   Disabled
                                    codes.
      Cash                                               $0.75    College Stickers     Pricing set contractually
                                                                                       65 years and older Fixed
   10 Tickets                                            $6.00    Senior Citizens                                     Free
                                                                                                 Route
                                                                                       Age 5 and younger Fixed
  Monthly Pass                                          $12.50        Children         Route (up to five children     Free
                                                                                            with one adult)
  *Fare Structure adopted by the Board June 1st 2012.

  Transit Development Plan 2016 – 2021                                                                         Page 14
SECTION 5 BFT ACCOMPLISHMENTS & OBJECTIVES
WASHINGTON TRANSPORTATION PLAN (WTP 2035)
The Washington State Department of Transportation (WSDOT) requires that transit agencies report
their progress towards accomplishing the state’s six statutory transportation policy goals in
RCW 47.04.280. These goals and related objectives are identified in the Washington Transportation
Plan 2035 (WTP 2035).
The Washington Transportation Plan (WTP 2035) is a comprehensive and balanced statewide
transportation plan that establishes a 20-year vision for the development of the statewide
transportation system, from state highways and ferries to sidewalks and bike paths, county roads,
city streets, public transit, air and rail. WTP 2035 identifies significant statewide transportation
issues, and recommends statewide transportation policies and strategies to the legislature and
Governor (RCW 47.01.071(4)). By law, WTP 2035 is required to be consistent with state’s growth
management goals, reflect the priorities of government, and address regional needs, including
multimodal transportation planning.
WTP 2035 is based on the following six transportation policy goals established by the Legislature:
1. Preservation - To maintain, preserve, and extend the life and utility of prior investments in
transportation systems and services.
2. Safety - To provide for and improve the safety and security of transportation customers and
the transportation system.
3. Mobility - To improve the predictable movement of goods and people throughout
Washington State.
4. Environment - To enhance Washington’s quality of life through transportation investments
that promote energy conservation, enhance healthy communities, and protect the
environment.
5. Stewardship - To continuously improve the quality, effectiveness, and efficiency of the
transportation system.
6. Economic Vitality - To promote and develop transportation systems that support, stimulate,
and enhance the movement of people and goods to ensure a prosperous economy.
Page 15BEN FRANKLIN TRANSIT STRAGEIC PLAN
The central theme of the BFT’s Strategic Plan is maximizing outreach to the community and
developing strategic partnerships within our region that will help us reach our objectives and provide
maximum value to our community. By further developing our employees and organization and
through coordination with other agencies, we will continue to address the community’s changing
needs.
Primary Objectives
Address community growth, particularly on the urban fringes.
Maximize coordination with other agencies and organizations, including the community’s
growing healthcare industry.
Implement succession planning, staff development, and measures to address upcoming
attrition.
Secondary Objectives
Address the changing demographics of our community, including reaching out to our
growing Hispanic population regarding employment and transportation needs.
Participate in Economic Development. Assist in the planning, development, and service
provision to the Downtown Entertainment Districts. Including tourism, special events,
convention center, wineries, etc.
Plan for paratransit demographic shifts. Manage increased demand by people with
developmental disabilities, and changing senior needs.
Continue to integrate technological communication with our customers.
Continued pursuit of more environmentally friendly buses and alternative fuels.
2016 Goals and Major Initiatives
Safety First (Fleet / Service)
Comprehensive Service Plan Study
Citizen’s Advisory Committee Review
Succession Planning and Staff Development Training
Transit Technology Implementation
Comprehensive Employee Program Review Facilities Upgrades
Page 162015 ACCOMPLISHMENTS
Staff works to provide excellent transit service by selecting, working on and completing tasks that
support the following core values of the organization. Recent accomplishments include:
Fixed Route Operations
1. More than tripled positive customer service calls over prior year; 131 vs 38
2. Improved relationship with union office as illustrated by a 20% reduction in grievances; 8 vs 10
3. In efforts to meet the diversity of our community and our customer’s needs we were successful
in hiring 3 bilingual operators and have 2 bi‐lingual trainees
4. As a cost saving and efficiency measure, chose not to fill vacant Road Supervisor position
allowing for an IT Analyst position in Administration
5. Completed a total of 5 passenger counts, four of the counts were a week long and one was a
three‐day summer count
Dial-A-Ride
1. Held annual refresher training for 100% of our 75 drivers with an emphasis on safety
2. Provided education and outreach to 15 residential care and rehabilitation facilities
3. Implemented an in‐home accessibility assessment for 11 new passengers that reside in their own
homes and use a wheelchair for mobility
4. Initiated a recertification process for DAR eligible passengers with 10% of the 6,342 customers
recertified so far this year
5. An ADA Coordinator has been appointed and will become ADA Certified by the end of the year
6. Upgraded our system‐wide software map used by scheduling, dispatch and drivers to improve
on-time performance and route efficiencies
7. Completed first time installation of cameras on 40 vehicles in the Tri‐Cities. We are currently
tracking statistics on accidents, incidents and validating customer complaints
General Demand Prosser
1. 1 Held annual operator refresher training for 6 drivers out 7 with emphasis on safety
2. 2 Relocated Prosser office and parking lot
3. 3 Completed first time installation of cameras on 4 new vehicles. We are currently tracking
statistics on accidents, incidents and validating customer complaints
Vanpool
1. Completed Winter Safe Driving Campaign
2. Replaced and trained 1 Vanpool Coordinator and 1 Vanpool Administrative Assistant due to
transfers within the organization
3. Conducted over 38 driver workshops training over 163 new volunteer Vanpool drivers
4. Staff closed 35 Vanpool groups, started 14 new groups and swapped 32 groups to different vans.
This has resulted in a 7.6% or a 21 van decrease in the number of vans in service since the first
of the year
Page 17Maintenance
1. No safety related incidents for 2015
2. Completed Tulip Lane Park and Ride Lot
3. Maintained a "no grievance" working environment
4. Processed 44 new Dial‐A‐Ride vehicles and 11 Gillig coaches
5. Hosted WSTA Maintenance Forum in May of 2015
Human Resources
1. LNI claims filed were down from 22 in 2014 to 10 in 2015, a reduction of 54.5%
2. Decreased the number of workdays lost from 116 in 2014 to 88 in 2015, a decrease of 24%
3. Maloney O’Neill provided Affordable Care Act (ACA) training to 97 Coach Operators and 4 HR
staff and Completed an ACA compliance audit on the company’s benefit plans
4. Bargaining Power, a negotiation software tool, was purchased and installed. 5 Staff were trained
on the software. Data has been entered into the software
5. Contracted with Vivid Learning System (VLS) for web‐based safety and HR related training for
52 non-represented employees. In 2014, 28 participated
Administrative Services
1. Migrated banking services realizing cost savings of 56.8% or about $42,000 and implemented
2. Fleet‐Net Bank Reconciliation function
3. Received zero recommendations from WA State Federal and Financial Audits
4. Filed for and received $584,000 diesel fuel tax refund
5. Commenced BFT Financial Policies review and update
6. Maintained core business practices/integrity throughout Executive Office transitions
Planning & Service Development
1. Completed Phase 1 of the Comprehensive Service Plan Study by selecting a firm
2. Cultivated partnerships and collaborated on projects throughout the community
3. Coordinated a Ground Breaking and a Ribbon Cutting Ceremony for Tulip Lane
4. Represented BFT at over 25 community events
5. Expanded Water Follies Service which included Additional Bus Service, Public Outreach to
Area Hotels, and Implementation of the Volunteer Ambassador Program
Page 18SECTION 6 BUDGET & PLAN ASSUMPTIONS 2016 – 2021
1. Population and Service Area BFT’s Public Transportation Benefit Area (PTBA) is a 616
square mile area located in Benton and Franklin Counties. The area includes all of the cities of
Kennewick, Pasco, Richland, West Richland, Benton City, Prosser and certain unincorporated
areas of Benton and Franklin County. The PTBA contains a population of approximately
246,149 in 2014 (Washington State Financial Management, Forecasting and Research
Division).
2. Sales Tax Revenue is projected at $30,183,712, a 0.47% increase from the 2015 forecast of
$30,042,971. The increase in sales tax revenue reflects consistent economic growth of 3.2%
over the last four years. This is due in part to school bond approvals and regional economic
growth forecasts. 2015 was a fuel rod change-out at the Columbia Generating Station (Energy
Northwest). On average this contributes about $500,000 to $800,000 in additional sales tax
revenues during the months of June and July. Such activity is not scheduled for 2016 thus
reducing the expected amount of sales tax revenue for the year. Of total 2016 sales tax revenue,
87.4% or $26,391,619 is programmed for the Operating budget and 4.0% or $1,216,061 is
programmed for the Capital budget and $2,576,032 or 8.5% will add to reserves.
3. Fares were simplified and increased in June 1, 2012, increasing BFT’s current farebox ratio to
11.7%. BFT’s fare structure is reviewed annually. Fares are expected to remain relatively flat
with no expected significant decrease or increase in 2016, subject to changes pending results of
the Comprehensive Service Plan Study (CSPS).
4. Federal Grants are budgeted in the amount of $7,064,242 and include 5307 and 5339 formula
funding for Federal Fiscal Year 2015. $2,200,000 will be used for Operating and $4,864,242
will be used for Capital.
5. State Grants of $568,030 from the Paratransit Special Needs Grant are budgeted for 2016 and
will be used for Operating Expenses. There are no local match requirements for these funds.
6. Bus Operations increases 5.6% or $609,316 over the FY 2015 budget due to slight increased
costs of labor, expected parts usage for 6 diesel engine replacements, fuel, insurance, and fully
allocating maintenance labor costs to the department. Revenue miles are budgeted at
2,150,876, revenue hours at 132,266 and boardings at 2,759,007.
7. Dial-A-Ride increases 6.2% or $588,701 over the FY 2015 budget due to increased costs of
labor and benefits, insurance, purchased transportation, and fully allocating maintenance labor
costs to the department. Revenue miles are budgeted at 2,038,521, revenue hours at 119,363
and boardings at 364,395. Dial-A-Ride performs all eligibility application processing to
determine service eligibility; roughly 85.0% of eligible applicants are new users of the service.
8. General Demand (Prosser) increases 27.7% or $192,582 from the FY 2015 budget as a result
of increases in labor and benefits, fuel, fully allocating maintenance labor costs, loss of Benton
County maintenance contract and a new operations facility lease adding significant costs, and
insurance. Revenue miles are budgeted at 182,138, revenue hours at 8,131 and boardings at
43,001.
Page 199. Vanpool increases 10.2% or $211,313 over the FY 2015 budget as a result of increased costs
of labor and benefits, fully allocating maintenance labor costs to the department, fuel, and
insurance costs. Revenue miles are budgeted at 3,984,400, revenue hours at 85,427 and
boardings at 814,751.
10. Night Service is capped at $1,750,000, a 13.3% or $204,841 increase from the FY 2015
budget. The increase is due to demand for the services. Revenue miles are budgeted at
501,562, revenue hours at 22,792 and boardings at 81,655.
11. Sunday Service increases 5.9% or $18,085 over the FY 2015 budget as a result of demand.
Revenue miles are budgeted at 93,483, revenue hours at 4,126, and boardings at 17,167.
12. Finley Service is budgeted at $115,000, a 2.9% or $3,293 increase over the FY 2015 budget.
Revenue miles are budgeted at 41,909, revenue hours at 1,415 and boardings at 9,516.
13. Taxi Feeder Service is budgeted at $150,000, a 15.9% or $20,538 increase over the FY 2015
budget, again due to demand for the services. Revenue miles are budgeted at 34,812, revenue
hours at 1,570 and boarding at 13,130.
Page 20SECTION 7 SERVICE PLAN
BFT is currently in the process of performing a Comprehensive Service Plan Study (CSPS) that will
look at all modes of service provided by BFT. Considering the scope of the project and yet to be
determined service changes to the system, there is an uncertain impact on the 2016 budgeted
ridership, miles, and hours.
Facilities and Vehicles will be part of the BFT capital improvements listed in the Program of
Projects (POP). These are timed over the next six years to proceed based upon projected funding
availability and include:
Facilities and all transit centers are slated for upgrades using FTA grant funding.
Security throughout will be enhanced with 5307 FTA funding.
Replacement of vehicles to modernize the existing bus, staff and paratransit fleets will be
programmed with a consistent schedule of annual purchases to maintain a fleet with low
maintenance costs.
Securing property or constructing additional Park and Ride facilities throughout the area, as
property is available and the need is established.
Replacement of shelters, benches and other transit amenities where needed.
Technological Improvements and Passenger Amenities will include:
Improved Communications within BFT.
Improved information systems for BFT riders.
Security enhancements such as cameras on buses and in transit centers.
New bus benches, shelters and signage.
Data collection systems to provide information for service improvements.
Planning studies for inclusion in the next 6 years:
Trolleys
Park and Rides locations and capacity
Continued Technology Upgrades
Page 21SECTION 8 SERVICE PERFORMANCE
Ben Franklin Transit reported the following collision information to the National Transit Database
(NTD) in 2015:
Fixed Route had two bus accidents, involving two injuries in one of the two events, both
classified as major
Van Pool had one accident, involving one injury, classified as major
Dial-A-Ride had one vehicle accident, involving one injury, classified as non-major
No fatalities
BFT was recognized with the Safety Star Award in 2014 by Washington State Transit Insurance
Pool as being consistently a good performer in terms of agency auto losses.
Ben Franklin Transit provided 3,956,125 unlinked passenger trips in 2015 for a total system
ridership decrease of 4.6% over 2014. Vanpool and Fixed Route decreased by 4.1% and 6.1%, the
reduction in ridership can be attributed to lower gas prices and better economic conditions. Unlinked
passenger trips increased for both Dial-A-Ride and contracted taxi services in 2015. Dial-A-Ride
increased by 2.2% and taxi service increased by 4.8%.
The graph below illustrates unlinked passenger trips by mode, and the percentage of total system
unlinked passenger trips they represent. Taxi service is detailed in Table 4 on page 23.
Figure 4: 2015 Unlinked Passenger Trips by Mode*
2015 Unlinked Passenger Trips by Mode
Vanpool
794,579
20%
Taxi Services
117,430
3%
Dial‐A‐Ride
392,058
10%
Fixed Route
2,652,058
67%
*Data source: BFT
Page 22Table 4: Service Types and Levels: Year End 2014 - 2015 calculations*
Annual Annual 2014 2015
Annual Annual Annual Annual
Revenue Revenue Unlinked Unlinked
Service Type Revenue Revenue Diesel Gas
Hours Hours Passenger Passenger
Miles 2014 Miles 2015 Usage Usage
2014 2015 Trips Trips
Bus 2,132,884 2,148,656 131,093 131,933 468,019 0 2,824,121 2,652,058
General
188,895 171,627 8,234 7,733 2,461 23,971 43,046 39,555
Demand
Dial-A-Ride 1,871,118 1,956,574 109,768 116,399 1,373 317,436 340,744 352,503
Night Service 494,013 492,637 22,732 22,648 77,634 79,062
Taxi Feeder 30,276 34,065 1,375 1,517 9,699 11,789
Finley 32,845 37,389 1,151 1,287 9,403 9,931
Sunday 91,885 95,721 4,248 4,230 15,322 16,648
Vanpool 4,033,627 3,804,373 84,232 83,629 4 278,690 828,189 794,579
Total 8,875,543 8,720,960 362,833 366,985 471,857 620,097 4,148,158 3,956,125
Comparison of
-1.5% 1.8% -4.6%
(2014 & 2015)
*Data source BFT
Figure 5: Unlinked Passenger Trips Comparison 2005 - 2015*
Annual System Unlinked Passenger Trips
6,000,000
5,000,000
4,000,000
3,000,000
2,000,000
1,000,000
0
2005 2006 2007 2008 2009 2010 2011 2012 2013 2014 2015
*Data source BFT & National Transit Database
Page 23PROJECTED OPERATING DATA, 2016 – 2021 (IN THOUSANDS)
Table 5: Projected Operating Data 2016 – 2021*
Fixed Routes Services 2016 2017 2018 2019 2020 2021
Revenue vehicle hours 134 136 137 138 140 141
Total vehicle hours 140 142 143 145 146 148
Revenue vehicle miles 2,224 2,247 2,269 2,292 2,315 2,337
Total vehicle miles 2,424 2,448 2,473 2,498 2,523 2,549
Passenger trips 2,931 2,960 2,990 3,019 3,050 3,079
Fatalities 0 0 0 0 0 0
Reportable injuries 0 0 0 0 0 0
Collisions 0 0 0 0 0 0
Diesel fuel consumed (gal) 495 475 480 485 489 494
Gasoline consumed (gal) 0 0 0 0 0 0
Demand Response 2016 2017 2018 2019 2020 2021
Revenue vehicle hours 124 126 128 129 131 133
Total vehicle hours 144 146 148 151 153 155
Revenue vehicle miles 2,244 2,289 2,335 2,381 2,429 2,477
Total vehicle miles 2,550 2,601 2,653 2,706 2,760 2,815
Passenger trips 391 397 403 409 415 421
Fatalities 0 0 0 0 0 0
Reportable injuries 0 0 0 0 0 0
Collisions 0 0 0 0 0 0
Diesel fuel consumed (gal) 4 4 4 4 5 5
Gasoline consumed (gal) 355 350 355 361 366 371
Vanpooling Services 2016 2017 2018 2019 2020 2021
Revenue vehicle hours 92 93 94 95 96 97
Total vehicle hours 92 93 94 95 96 97
Revenue vehicle miles 4,343 4,386 4,430 4,475 4,519 4,564
Total vehicle miles 4,444 4,488 4,533 4,579 4,624 4,669
Passenger trips 90 91 92 93 94 95
Fatalities 0 0 0 0 0 0
Reportable injuries 0 0 0 0 0 0
Collisions 0 0 0 0 0 0
Diesel fuel consumed (gal) 10 0 0 0 0 0
Gasoline consumed (gal) 334 300 303 306 309 312
*Table 5 Forecast does not take into consideration the Comprehensive Service Plan Study BFT is currently conducting.
Once the CSPS is complete, staff will have a better understanding of projected operating data in the 2017 Transit
Development Plan.
*Data source BFT
Page 24PROPOSED SERVICE CHANGES, VEHICLE PURCHASES & FACILITIES
IMPROVEMENTS
Table 6: Proposed Service Changes, Vehicle Purchases and Facilities Improvements 2016 – 2021
2016 Preservation / Improvements
Services Assess and modify services as necessary; Increase taxi feeder and add fixed routes as demand
warrants.
Facilities Maintain, improve, upgrade and expand per service level demands all bus stops, transit centers,
park and rides and administration campuses including but not limited to paving and security.
Operations Facility Energy Audit Upgrades will be implemented.
Vehicles Replace or rebuild existing vehicles, up to 5 transit buses, up to 8 paratransit vehicles, up to 25
vanpool vehicles, and 1 non-revenue support vehicles.
2017 Preservation / Improvements
Services Assess and modify services as necessary; Increase taxi feeder and add fixed routes as demand
warrants.
Facilities Maintain, improve, upgrade and expand per service level demands all bus stops, transit centers,
park and rides and administration campuses including but not limited to paving and security.
Operations Facility Energy Audit Upgrades will be implemented.
Vehicles Replace or rebuild existing vehicles, up to 5 transit buses, up to 8 paratransit vehicles, up to 25
vanpool vehicles, and 1 non-revenue support vehicles.
2018 Preservation / Improvements
Services Assess and modify services as necessary; Increase taxi feeder and add fixed routes as demand
warrants.
Facilities Maintain, improve, upgrade and expand per service level demands all bus stops, transit centers,
park and rides and administration campuses including but not limited to paving and security.
Vehicles Replace or rebuild existing vehicles, up to 5 transit buses, up to 8 paratransit vehicles, up to 31
vanpool vehicles, and 1 non-revenue support vehicles.
2019 Preservation / Improvements
Services Assess and modify services as necessary; Increase taxi feeder and add fixed route as demand
warrants.
Facilities Maintain, improve, upgrade and expand per service level demands all bus stops, transit centers,
park and rides and administration campuses including but not limited to paving and security.
Vehicles Replace or rebuild existing vehicles, up to 5 transit buses, up to 8 paratransit vehicles, up to 31
vanpool vehicles, and 1 non-revenue support vehicles.
2020 Preservation / Improvements
Services Assess and modify services as necessary; Increase taxi feeder and add fixed routes as demand
warrants.
Facilities Maintain, improve, upgrade and expand per service level demands all bus stops, transit centers,
park and rides and administration campuses including but not limited to paving and security.
Vehicles Replace or rebuild existing vehicles, up to 5 transit buses, up to 8 paratransit vehicles, up to 31
vanpool vehicles, and 1 non-revenue support vehicles.
2021 Preservation / Improvements
Services Assess and modify services as necessary; Increase taxi feeder and add fixed routes as demand
warrants.
Facilities Maintain, improve, upgrade and expand per service level demands all bus stops, transit centers,
park and rides and administration campuses including but not limited to paving and security.
Vehicles Replace or rebuild existing vehicles, up to 5 transit buses, up to 8 paratransit vehicles, up to 31
vanpool vehicles, and 1 non-revenue support vehicles.
Page 25SECTION 9 FINANCIAL PLAN 2015 - 2021
Table 7: Financial Forecasting Model 2015 – 2021*
Total 2016‐
Operating 2015 2016 2017 2018 2019 2020 2021 2021
Operating Revenues
Total Sales Tax (Local) $ 30,792,205 $ 30,183,712 $ 30,938,305 $ 31,557,071 $ 32,345,998 $ 32,992,918 $ 33,817,741 $ 191,835,744
Total 'Other' Local (Fares, Contracted Services, Misc $ 5,360,395 $ 4,492,069 $ 4,514,395 $ 4,536,838 $ 4,578,953 $ 4,660,980 $ 4,744,606 $ 27,527,842
Total State Operating $ 193,457 $ 568,030 $ 284,015 $ 284,015 $ 284,015 $ 984,015 $ 984,015 $ 3,388,105
Total Federal Operating $ ‐ $ 2,061,550 $ 3,311,692 $ 3,602,507 $ 3,771,786 $ 4,021,430 $ 4,179,009 $ 20,947,974
Total Operating Revenues (Before Capital Match) $ 36,346,057 $ 37,305,361 $ 39,048,407 $ 39,980,431 $ 40,980,752 $ 42,659,343 $ 43,725,372 $ 243,699,665
Operating Expense
Total Labor $ 21,090,564 $ 22,835,835 $ 23,552,061 $ 24,321,777 $ 25,138,479 $ 25,951,754 $ 26,792,535 $ 148,592,441
Total Non‐Labor $ 9,797,671 $ 11,728,906 $ 11,904,840 $ 12,083,412 $ 12,264,663 $ 12,448,633 $ 12,677,289 $ 73,107,743
CSPS Implementation $ 650,000 $ 2,500,000 $ 2,537,500 $ 2,575,563 $ 3,239,196 $ 3,287,784 $ 14,790,042
Total Operating Expense $ 30,888,235 $ 35,214,741 $ 37,956,901 $ 38,942,689 $ 39,978,705 $ 41,639,583 $ 42,757,607 $ 236,490,227
Operating Revenues Surplus/Deficit $ 5,457,822 $ 2,090,620 $ 1,091,506 $ 1,037,742 $ 1,002,047 $ 1,019,759 $ 967,764 $ 7,209,438
Local Capital Match $ 2,372,983 $ 1,280,061 $ 1,071,333 $ 1,016,721 $ 992,670 $ 948,705 $ 927,937 $ 6,237,427
Operating Surplus/(Deficit) $ 3,084,839 $ 810,559 $ 20,173 $ 21,021 $ 9,377 $ 71,054 $ 39,827 $ 972,011
Total 2016‐
Capital 2015 2016 2017 2018 2019 2020 2021 2021
Capital Revenues $ 11,864,914 $ 5,425,867 $ 5,285,330 $ 5,216,883 $ 4,970,679 $ 4,244,820 $ 4,011,748 $ 29,155,327
Local Capital Match $ 2,372,983 $ 1,280,061 $ 1,071,333 $ 1,016,721 $ 992,670 $ 948,705 $ 927,937 $ 6,237,427
Total Capital Revenues $ 14,237,897 $ 6,705,928 $ 6,356,663 $ 6,233,604 $ 5,963,349 $ 5,193,525 $ 4,939,685 $ 35,392,754
Total Capital Expenses $ 2,709,028 $ 6,080,303 $ 5,049,618 $ 6,401,250 $ 5,802,329 $ 5,803,798 $ 5,639,680 $ 34,776,978
Capital Funds Surplus/(Deficit) $ 9,155,886 $ 625,625 $ 1,307,045 $ (167,646) $ 161,020 $ (610,273) $ (699,995) $ 615,776
Surplus/(Deficit) $ 12,240,725 $ 1,436,184 $ 1,327,218 $ (146,625) $ 170,396 $ (539,218) $ (660,168) $ 1,587,787
Total 2016‐
Reserves 2015 2016 2017 2018 2019 2020 2021 2021
Beginning Reserves $ 20,528,921 $ 32,769,646 $ 34,205,830 $ 35,533,048 $ 35,386,424 $ 35,556,820 $ 35,017,602
Current Year Surplus/(Deficit) $ 12,240,725 $ 1,436,184 $ 1,327,218 $ (146,625) $ 170,396 $ (539,218) $ (660,168)
Subtotal Reserves $ 32,769,646 $ 34,205,830 $ 35,533,048 $ 35,386,424 $ 35,556,820 $ 35,017,602 $ 34,357,433
Restricted ‐ 3 Month Op Reserve $ 7,722,059 $ 8,803,685 $ 9,489,225 $ 9,735,672 $ 9,994,676 $ 10,409,896 $ 10,689,402
Total Surplus (Deficit) Funds $ 25,047,587 $ 25,402,145 $ 26,043,823 $ 25,650,751 $ 25,562,144 $ 24,607,706 $ 23,668,031 $ 23,668,031
*Details of planned expenditures are included in the attached Program of Projects.
Page 26You can also read