The adoption of self-service kiosks in quick-service restaurants
←
→
Page content transcription
If your browser does not render page correctly, please read the page content below
The adoption of self-service kiosks in quick-service restaurants

     Nazi Rastegar1, Joan Flaherty2, Lena Jingen Liang3* and Hwan-suk Chris Choi4
1 School of Hospitality, Food, and Tourism Management, University of Guelph, Guelph, Canada
2 School of Hospitality, Food, and Tourism Management, University of Guelph, Guelph, Canada
3 School of Hospitality, Food, and Tourism Management, University of Guelph, Guelph, Canada. E-mail:

jliang@uoguelph.ca
4 School of Hospitality, Food, and Tourism Management, University of Guelph, Guelph, Canada

* Corresponding author
Abstract
This study investigates factors influencing the customers’ decision to use self-service kiosks in quick service
restaurants. A model incorporating Technology Acceptance Model and Satisfaction Model was developed to
examine the relationships among trust, self-efficacy, perceived ease of use, perceived usefulness, perceived
enjoyment, perceived value, satisfaction and behavioural intention toward using these kiosks. The moderating
impact of age, gender and past self-service kiosks experience was also examined. An online survey that measured
customer perceptions and evaluations of self-service kiosks in McDonald’s garnered 415 responses. Data were
analysed using structural equation modelling and multiple regression analyses. Recommendations address the
importance of clear, accessible information about kiosk operation; visible security measures; and enhanced features
such as menu item nutrient profiles and promotions. These findings and recommendations can be used to promote
self-service kiosk usage, thereby addressing the COVID-19 induced prohibitions against direct service in
restaurants.

Keywords: self-service technology; kiosk; adoption; quick-service restaurant; customer satisfaction, technology
acceptance model

Citation: Rastegar, N., Flaherty, J., Liang, L.L. and Choi, H. C. (2021). The adoption of self-service kiosks in quick-
service restaurants. European Journal of Tourism Research 27, 2709.

                          © 2021 The Author(s)
                          This work is licensed under the Creative Commons Attribution 4.0 International (CC BY 4.0). To
                          view a copy of this license, visit https://creativecommons.org/licenses/by/4.0/

RESEARCH PAPER                                             1
The adoption of self-service kiosks in quick-service restaurants
Introduction
Over the last two decades, hospitality operations have increasingly turned to technology to facilitate
and enhance customer service (Dabholkar & Bagozzi, 2012; Ivanov, Webster, & Berezina, 2017; Buhalis,
Harwood, Bogicevic, Viglia, Beldona, & Hofacker, 2019). Self-service technology (SST), particularly the
kiosk, is one example. Self-service kiosks (SSKs), which enable customers to serve themselves with little
to no help from the service provider, have long been a common feature in certain segments of the
hospitality industry. Airports offer self-service check in and information kiosks; hotels use SSK that
allow their guests to check in/out and access hotel or area information; and some restaurants use SSKs
that enable patrons to customize, place and pay for their orders.
In particular, quick service restaurants (QSRs) have aggressively adopted the SSK in an effort to reduce
labour costs (Beatson, Lee, & Coote, 2007; Wei, Torres, & Hua, 2017); improve service speed and order
accuracy (Kincaid & Baloglu, 2005); and increase sales. This is supported by a recent study, which found
that almost 80% of consumers associate restaurant technology with increased convenience and 70%
with faster, more accurate service (National Restaurant Association, 2017a). Indeed, the promise of a
shorter waiting time (i.e., faster service) appears to influence customers’ decisions to use SSKs
(Kokkinou & Cranage, 2015). In fact, one study found that customers were willing to accept higher prices
by paying, on average, $2.47 USD more at QSRs if it meant faster service (Perutkova, 2009). These factors
suggest the trend toward SSKs is likely to become increasingly important in the hospitality industry
generally, but particularly in the QSR segment – a fact that reinforces the importance of the current
study.
Not all customers, however, share the enthusiasm. Factors which inhibit the use of SSK include concerns
about design and security flaws, whereby a customer may lack confidence in the kiosk instructions
being clear and easy to follow or in the kiosk’s ability to protect sensitive information, such as debit
card passwords (Curran & Meuter, 2005). Consequently, in spite of the fact that 36% of consumers are
more likely to adopt tech options in the restaurant industry than they were two years earlier, almost
half (49%) prefer to interact with employees rather than with an SSK (National Restaurant Association,
2017b). At least one research team, however, suggests that time will render this finding inaccurate. In
their work on future industry trends, Webster and Ivanov (2020) characterize technology-averse
consumers as a relatively small group, confined to the high end of the market. The vast majority of
future consumers, they speculate, will enjoy an automated experience.
In the end, the customers’ decision to embrace or reject an SST depends on their evaluation and
perception of it (Mozeik, Beldona, Cobanoglu, & Poorani, 2009). Understanding the factors that shape
these views holds obvious benefits for the industry, particularly the QSR segment, guiding its
consideration of SSK adoption. It also holds significant benefits in terms of furthering research on
technology in the hospitality industry. Right now, most SST studies in a hospitality context have been
conducted in hotels and airport settings (Kim, Lee, & Law, 2008). Relatively few have been conducted
in QSR settings (Kim, Christodoulidou, & Choo, 2013). Even fewer have studied customer satisfaction
with technology acceptance (Kim et al., 2008). Moreover, most technology adoption studies have
focused on initial adoption rather than repeat use (Fernandes & Pedroso, 2017). In Europe, SSKs were
first introduced by McDonald’s to reduce queues and provide more personalized service to their
customers in 2011 and today almost every McDonald’s offers SSKs. Even though most independent
restaurants in Europe prefer to provide face-to-face service, COVID-19 will speed up the undeniable rise
of contactless usage across Europe. However, no known study has been conducted to examine the
customers’ SSK use experience.
2Rastegar et al. (2021) / European Journal of Tourism Research 27, 2709
To address these gaps, this study develops a conceptual model that investigates the customer’s
perception and evaluation of self-service kiosks in quick service restaurants; identifies factors that
influence the customer’s decision to continue using these kiosks; and explains the relationships among
those factors.
Literature Review
The hospitality and tourism industry has long used technology to revolutionize its services: starting in
the mid-1800s with the advent of train travel to transport tourists, to the current ubiquity of automated
self-service in restaurants, and to a future where robots routinely greet guests, serve food and clean
rooms (Ivanov, 2019). The train’s dominance was subsequently usurped by car and air travel, both of
which have been curtailed by COVID-19. Advances in robotics have the potential to transform industry
customer service, but the routine use of robots is still a vision. In contrast, automated self-service
technologies appear to be experiencing a steep trajectory, particularly in casual dining (Hanks, Line &
Mattila, 2016) and in quick service restaurants (Kim, Christodoulidou, & Choo, 2013).
Self-service technologies in QSRs
Self-service technology in quick service restaurants allows customers more control over their dining
experience and, ideally, more satisfaction. They also offer potential benefits to the operator in terms of
reduced labour costs and increased sales. Some of these recent technologies include mobile ordering,
online coupons, digital menu boards, smartphone apps, and self-service kiosks. These kiosks typically
feature a large touch screen that enables customers to order, customize and pay for menu items, with
little to no employee interaction. Their increasing adoption by Canadian quick service restaurants
represents a movement away from the restaurant industry’s traditional ‘high touch and low tech’ ethos
toward a ‘low touch and high tech’ approach.
Many studies have contributed to the understanding of why customers use SSTs. For instance, Lin and
Hsieh (2006) focused on initial adoption of SST in shopping malls, train/ subway stations. They found
that technology readiness influences users’ perceptions of SST service quality and behavioural
intentions. Liu, Hung, Wang and Wang (2019) also shed lights on consumers’ initial adoption of SST in
the hotel setting. They found that consumers’ travel purposes and unique needs influence their
adoption decisions.
Another trend of SST studies in the hospitality context is that of conducting research in the context of
hotels and airports rather than restaurants (Kim, Lee, & Law, 2008). This is supported by a systematic
literature review conducted by Vakulenko, Hellström and Oghazi (2018), in which within 76 articles
analysed, only 6 were related to food, while 17 were related to hotels or airports (p.512).
Further evidence suggests a relationship between increased sales and non-face-to-face orders with self-
service technology, such as an SSK (Allon, Federgruen, & Pierson, 2011). The kiosk enables customers to
order freely, without the potential embarrassment caused by mispronouncing menu items or the fear
of being judged for their menu choices (Goldfarb, McDevitt, Samila, & Silverman, 2015). At least one
study shows that customers avoid purchasing more complex items, higher calorie items, and items with
difficult-to-pronounce names in front of others (Goldfarb et al., 2015). The option to use an SSK
eliminates these obstacles, encouraging the customer to spend more freely.
Children, adolescents and young adults are among the highest consumers of fast food in Canada (Black
& Billette, 2015). Having grown up with digital technology, these customers tend to be more comfortable
than their older counterparts with self-service – even to the point of actively seeking it out because they
3The adoption of self-service kiosks in quick-service restaurants
see it as convenient and efficient (Sweeney, Danaher, & McColl-Kennedy, 2015). Other segments of the
market that may prefer SSKs are customers with accessibility issues: the hearing impaired; and those
who do not speak the language fluently. For some individuals within these groups, the prospect of a
face-to-face interaction might dissuade them from patronizing the restaurant for fear that they will not
understand the employee or the employee will not understand them.
Labour costs prompt service providers to consider options that allow customers to provide services for
themselves, without the need of paid employees (Shamdasani, Mukherjee, & Malhotra, 2008). While
legislation to raise the minimum wage in Ontario by approximately 30%, from $11.40 in 2017 to $15.00 in
2019 did not pass, the issue of increasing the minimum wage continues to be under public scrutiny. The
potential for an increase is particularly concerning for Canadian QSR employers, since the majority of
minimum wage workers are in the food sector. Therefore, QSR employers are prompted to look even
more closely at SSKs to reduce labour costs.
These factors justify pursuing more knowledge in this area, particularly on what influences QSR
customer adoption of, and satisfaction with, new technology. To that end, this study presents a
conceptual model that combines Davis’s Technology Acceptance Model (1986) with a satisfaction model
(Cronin, Brady, & Hult, 2000). The reasoning behind the development of this conceptual model is
explained below.
Technology Acceptance Model
In order to understand consumers’ acceptance of a new technology, many theoretical approaches (e.g.
theory of reasoned action; theory of planned behaviour; unified theory of acceptance and use of
technology; motivational model) have been proposed. Of these, the technology acceptance model
(TAM) has become the most accepted approach to explain intention to use a certain technology.
Introduced by Davis (1986), TAM predicts whether or not consumers will use a system based on their
motivation, which is influenced by external stimuli, such as the system’s features and capabilities.
Davis hypothesized that one’s attitude toward a technology can be predicted by two factors: perceived
ease of use (PEOU) and perceived usefulness (PU). PEOU refers to “the degree to which an individual
believes that using a particular system would be free of physical and mental effort” (Davis, 1986, p.26).
PU refers to “the degree to which an individual believes that using a particular system would enhance
his or her job performance” (Davis, 1986, p.26). However, although PEOU and PU are the most powerful
predictors of whether one accepts or rejects a system, TAM does not explain the reasons a system is
found useful and easy to use (Venkatesh, 2000). While it identifies PEOU and PU as extrinsic sources
of motivation, it does not consider intrinsic motivation.
Since Davis’s (1986) work, researchers have developed TAM by incorporating additional external and
internal variables. SST characteristics and individual user differences are two main categories of
antecedents that impact the customer’s intention to use SSTs. Of these, trust and self-efficacy have been
cited in many SST studies as critical determinants of user intention (Compeau & Higgins, 1995; Gefen,
Karahanna, & Straub, 2003). However, most of these studies have investigated trust in the online setting
in the hospitality context rather than offline setting, while self-efficacy has been tested as an antecedent
of PEOU in TAM studies. No research to date has tested the role of self-efficacy as an antecedent of
both intrinsic and extrinsic motivations in TAM studies in the restaurant industry.
4Rastegar et al. (2021) / European Journal of Tourism Research 27, 2709
Satisfaction Model
To date, studies have mainly concentrated on identifying factors affecting the customer’s intention to
use SST or not. Few studies have investigated the customer’s evaluation of SSKs in restaurants (Kim et
al., 2013). However, understanding how the customer evaluates these kiosks can help restaurants
enhance customer satisfaction and increase revenue. To clarify the relationship between value,
satisfaction and behavioural intention (BI), Cronin et al. (2000) identified three competing evaluation
models that explain how a customer evaluates the service encounter: value model; satisfaction model;
and indirect model.
In the value model, value is a key construct to understand repeat purchase (Gallarza, Gil-Saura, &
Arteaga-Moreno, 2017). Based on this model (Cronin et al., 2000), there is no direct relationship between
satisfaction and BI. Satisfaction indirectly, through value, affects BI. Customers intend to purchase if
they perceive the product or service as valuable for them. The satisfaction model has been extensively
studied (Angelova, & Zekiri, 2011). According to the satisfaction model (and in direct opposition to the
value model), customer satisfaction is a major determinant that directly affects a customer’s BI. The
indirect model was derived from literature that investigates the relationship between satisfaction and
intention. This model proposed that perceived value has both direct and indirect effect on BI through
satisfaction (Chen, 2008; Liang, Choi, & Joppe, 2018b).
To develop our understanding of customers’ evaluation of SSKs in QSRs, this study borrows from the
indirect model (satisfaction, perceived value, and behavioural intention) (Cronin et al., 2000). It is the
most comprehensive model because it looks at both the direct and indirect impacts, integrating them
into the TAM model. Furthermore, few studies have investigated multiple direct effects between value,
satisfaction, and BI and even fewer have studied these variables simultaneously in the technology
acceptance field to understand whether or not any or both variables (value and satisfaction) directly
influence behavioural intention.
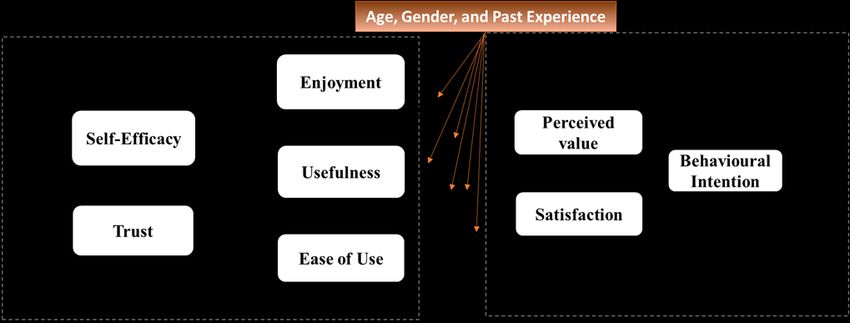
Proposed model and hypotheses development
By combining elements of the TAM and the satisfaction model, the proposed model attempts to better
understand customers’ behavioural intention to adopt a new technology and its antecedents in the
restaurant industry, specifically in the QSR segment. See Figure 1 for details.
Figure 1. Proposed model
5The adoption of self-service kiosks in quick-service restaurants
Perceived enjoyment
Perceived enjoyment (PE) is defined as “the extent to which the activity of using a specific system is
perceived to be enjoyable in its own right, aside from any performance consequences resulting from
system use” (Venkatesh, 2000, p.351). This variable has been widely applied and validated as a key
determinant in customer use of SSTs (Lewis & Loker, 2014; Moon & Kim, 2001; Alalwan, Baabdullah,
Rana, Tamilmani, & Dwivedi, 2018). Therefore, this study examines the role of PE in SSK usage. For the
purpose of this study, perceived enjoyment is defined as the degree to which a person believes that
adoption of an SSK in a QSR is enjoyable. The hypothesis is as follows:
H1: PU has a positive influence on perceived enjoyment.
Self-efficacy as an antecedent in TAM
Maddux and Kleiman (2018) defined self-efficacy as people’s judgment of their ability to perform a
particular behaviour that results in desired outcomes. In a technology context, self-efficacy is defined
as the user’s confidence in their ability to use a technology and achieve favourable outcomes. Studies
have concluded that the more confident consumers feel with their ability to use a technology (i.e., the
greater their self-efficacy), the more likely they are to perceive benefits from that technology (Hartzel,
2003; Compeau & Higgins, 1995). Based on these findings, the hypotheses are as follows:
H2: Self-efficacy has a positive influence on PE.
H3: Self- efficacy has a positive influence on PU.
H4: Self-efficacy has a positive influence on PEOU.
Trust as an antecedent in TAM
Trust is also considered a significant external factor of TAM (Gefen et al., 2003; Kim et al., 2008).
According to Kramer (1999), “trust entails a state of perceived vulnerability or risk that is derived from
an individual’s uncertainty regarding … others on whom they depend” (p. 571). In this study’s context,
“others” refers to the SSKs, whereby QSR customers might question the security of conducting financial
transactions via the kiosk as opposed to face-to-face (Kaushik, Agrawal, & Rahman, 2015).
Many studies have investigated the importance of trust in online shopping settings (Corritore, Kracher,
& Wiedenbeck, 2003; Elbeltagi & Agag, 2016; Koufaris & Hampton-Sosa, 2004). This study examines the
effect of trust in the restaurant industry, an offline setting. A review of the literature uncovered no other
studies that examined the effect of trust on consumer’s PEOU, PU, and PE in using SSKs in QSRs. The
hypotheses are as follows:
H5: Trust positively influences the PE of customers using restaurant kiosks.
H6: Trust positively influences the PU of customers using restaurant kiosks.
H7: Trust positively influences the PEOU of customers using restaurant kiosks.
Perceived value
Perceived value (PV) is one of the most important contributors to customer satisfaction (Prebensen,
Woo, & Uysal, 2014). According to Woodruff (1997), PV is a trade-off between the benefits received and
sacrifices given to obtain the service. Sacrifices include monetary (price) and non-monetary elements
(time and effort) (Cronin et al., 2000). In this study, perceived value results from the QSR customer’s
evaluation of benefits received by using an SSK versus non-monetary “sacrifices” made by using an SSK.
Several studies have demonstrated a significant relationship between PV and PU, PEOU, and PE.
Setterstrom, Pearson and Orwig (2013), found PU and enjoyment to be predictors of PV in web-enabled
6Rastegar et al. (2021) / European Journal of Tourism Research 27, 2709
wireless technology. Wang and Wu (2014) investigated the PV of the iPAD menu and its relationship to
the BI to patronize a restaurant, concluding that both functional factors (i.e. PEOU and PU) and
emotional factors (PE) significantly influence PV. Therefore, the hypotheses are as follows:
H8: PE increases a customer’s perceived value towards SSK in QSRs.
H9: PU increases a customer’s perceived value towards SSK in QSRs.
H10: PEOU increases a customer’s perceived value towards SSK in QSRs.
In addition, a number of hospitality studies have shown that PV has a strong and significant effect on
customer satisfaction (CS) (Chen, Chen, & Chen, 2009; Sweeney & Soutar, 2001). That is, if a customer
perceives and places a high value on a product or service, then their level of satisfaction increases.
Therefore, the hypothesis is as follows:
H11: PV has a direct and positive impact on customer satisfaction.
However, the direct linkage between PV and BI is not clear. Several studies conclude that PV directly
influences BI (Liang, Choi, & Joppe, 2018a; Sweeney, Soutar, & Johnson, 1999), while at least one other
finds that PV indirectly affects BI through CS (Patterson & Spreng, 1997). Shang and Wu (2017) asserted
that PV is an important factor in using SST which positively influences customer’s intention indirectly
through CS. In accordance with these findings, this study suggests the following hypotheses:
H12: PV directly and positively influences customer’s BI towards SSK.
H13: PV indirectly through satisfaction influences customer’s BI towards SSK.
Customer satisfaction
Zeithaml (1988) defined CS as the customer’s evaluation of a product or service in terms of whether it
meets their needs and expectations. Understanding CS is important because it is a fundamental
predictor of the intention to continue information technology (IT) use (Limayem, Hirt, & Cheung,
2007); key indicator of IT success (Bhattacherjee, 2001); and an important IT-dependent variable,
representing the user’s overall feeling about the system (Bhattacherjee & Premkumar, 2004). Research
has shown that if users perceive that a system has improved their productivity and enhanced their job
performance, they tend to have a positive emotional response to that system. That is, a positive
relationship exists between PU and CS (Gelderman, 1998; Hsu & Chiu, 2004; Rai, Lang, & Welker, 2002).
Studies have also confirmed a positive relationship between PEOU and CS (Lin, 2008; Stoel & Lee, 2003).
In addition, a consumer’s positive experience in an enjoyable environment is likely to increase their
level of satisfaction and repurchase intention (Hirschman & Holbrook, 1982). In the hospitality context,
studies have shown that entertainment and perceived enjoyment (PE) has a positive effect on CS and
repurchase intention (Chiu, Fang, & Tseng, 2010). In view of these findings, the hypotheses are as
follows:
H14: PE positively influences customer satisfaction.
H15: PU positively influences customer satisfaction.
H16: PEOU positively influences customer satisfaction.
The positive and strong relationship between CS and BI has been addressed in several studies (Cronin
et al., 2000; Oliver & Swan, 1989). Most of these studies have reported CS as a main determinant of
repurchase intention, which, in turn, affects the company’s revenue. A high level of CS results in a high
7The adoption of self-service kiosks in quick-service restaurants
level of BI and a high level of repurchase and recommendation to others (Anderson & Sullivan, 1993;
Liang, et al., 2018b). Therefore, the hypothesis is as follows:
H17: Customer satisfaction positively and directly influences behavioural intention toward using SSK in
QSR.
Moderating effect of age and gender
To better understand the characteristics of technology users, the roles of age and gender have been
tested in many technology adoption studies (Darian, 1987; Kim, 2016; Kim, Christodoulidou, & Brewer,
2011; Wong, Yap, Turner, & Rexha, 2011). However, the results have been inconsistent. For example,
some studies identified men as more likely than women to use SSTs (Darian,1987; Sim & Koi, 2002),
while others showed no significant differences between men and women in technology adoption in the
hospitality setting (Kim et al., 2011; Wong et al., 2011). One study concluded that younger customers
were more likely to use SSTs (Kim et al, 2011); another found insufficient evidence to support that finding
(Sim & Koi, 2002). This study attempts to add some clarity to these ambiguous findings by examining
the moderating effect of age and gender on technology adoption in QSRs. The hypotheses are as
follows:
H18: Gender moderates the relationship between the three factors of TAM (PE, PEOU and PU) and the
two factors of the satisfaction model (PV and satisfaction).
H19: Age moderates the relationship between the three factors of TAM (PE, PEOU and PU) and the two
factors of the satisfaction model (PV and satisfaction).
Moderating effect of past experience
Previous studies have found that having experience with SSKs positively influences the customers’
intention to use SSKs at airports, car-rental kiosks, ATMs, and QSRs (Kim et al., 2013). Kim et al. (2013)
concluded that past experience with SSKs positively influences customers’ perceptions of their ability
and their extrinsic motivation to use SSKs. Therefore, this study expects that customers who have
experience with kiosks are more likely to use the SSK at QSRs than those without experience. Our
hypothesis is as follows:
H20: Past experience moderates the relationship between the three factors of TAM (PE, PEOU and PU)
and the two factors of the satisfaction model (PV and satisfaction).
Methodology
Study context and sampling
The target population for this study, confirmed through two screening questions, was McDonald’s
customers over the age of 18 who had used its SSK at least once in the last six months. McDonald’s was
chosen because it is one of the biggest chains of QSRs and most of its locations in Canada have adopted
SSKs. According to Henderson (2015), SSKs have been introduced in 70% of McDonald’s restaurants in
Canada, with more expected over the next few years. To examine the model, this study used a
quantitative research approach and developed an online survey to measure participants’ perceptions
and evaluations of SSK in McDonald’s. A pre-test was conducted with 10 graduate students who had
used McDonald’s SSK before the final distribution. This survey was distributed in Winter 2018 through
Amazon Mechanical Turk (M-Turk) online panel, with respondents being given a small monetary
incentive in North America. The decision to use M-Turk was made based on previous studies’ support,
whereby researchers successfully reached a designated population in a relatively short time through
using M-Turk (Hung & Law, 2011).
8Rastegar et al. (2021) / European Journal of Tourism Research 27, 2709
Excluding demographic and past experience questions, this survey consisted of 32 questions and was
assessed on a five-point Likert scale from 1 (strongly agree) to 5 (strongly disagree). Among 619 returned
questionnaires, 415 were usable for data analysis.
Measurement developments
This study explores the main determinants that influence the customer’s decision to use SSKs in the
QSR industry. The measurement items of each construct were chosen because they had shown promise
as being potential determinants based on the findings of previous studies. Specifically, the measurement
items for PU were adopted from Wang and Wu (2014) where PU was tested using five items with
composite reliability 0.86. This scale for PU was selected because it was measured for technology
adoption in the restaurant industry, which fits this study’s context. Measurement items for PEOU and
PE were adopted from Davis et al. (1989) and Davis et al. (1992), respectively. As for trust, four items
were adopted from Kaushik et al. (2015) as they showed a strong composite reliability of 0.92. The
measurement items of self-efficacy were adopted from two studies: Van Beuningen, De Ruyter, Wetzels
and Streukens (2009) and Compeau and Higgins (1995). The former study measured self-efficacy with
five items, with Cronbach alpha ranging from 0.92 to 0.94. Additionally, two items were adopted from
Compeau and Higgins (1995), which are widely used in hospitality studies. Perceived value (PV)is the
result of customer’s evaluation of what benefits they would receive by using SSKs in QSRs against what
they would have to sacrifice. Based on this definition, this study investigates non-monetary PV and
focuses more on the behavioural price dimension, which is adopted from Petrick (2002).
As for the outcome variables, four items from Cronin et al. (2000) were adopted to measure satisfaction,
while three items from the same study were adopted to measure behavioural intention to use SSK.
In summary, the survey questionnaire consisted of three parts: (i) respondent’s past experience with the
SSK; (ii) measurement items for the key study variables (i.e., PU, PEOU, PE, trust, self-efficacy, PV,
satisfaction, and behavioural intention); and (iii) respondent’s socio-demographic characteristics, such
as age, gender and education level. This information allowed us to explore the potential moderating
factors affecting customer adoption of SSKs in QSRs.
Results
Demographics of the respondents
Multiple statistical methods, including both descriptive and inferential statistics, were used to examine
the relationships among the proposed constructs. First, to identify a demographic profile, frequency
analysis was conducted via SPSS 25.0. Among the qualified respondents, 51% of participants were
female. Expectedly, 56% were between the ages of 26-35, indicating a relatively young age group of
participants. The majority (56%) were highly educated, holding a university or higher degree. A
dominance of middle ($36,000 - $61,000) and low ($18,000 - $36,000) participant income was observed,
accounting for 32% and 24% respectively of our respondents (Table 1).
Confirmatory factor analysis
Second, Anderson and Gerbing’s (1988) two-step approach was used to analyse the proposed model: (i)
Confirmatory factor analysis (CFA) for measurement model; and (ii) Structural Equation Model (SEM)
for the structural model. CFA is conducted to test the validity of measurements and to remove
unnecessary items via AMOS 25.0. After running CFA, items with factor loading lower than 0.50 were
eliminated to achieve higher reliability. Twenty-nine items were retained in the model (Table 2).
The CFA results demonstrate satisfactory indices based on Hair, Anderson, Tatham and Black’s (1998)
criteria, which the normed chi-square statistics (χ2 /df) is 2.709, less than the cut-off point of 3. The
9The adoption of self-service kiosks in quick-service restaurants
Root Mean Square Error of Approximation (RMSEA) is 0.064, less than the recommended cut off point
of 0.08. Normed Fit Index (NFI) is 0.90 and Confirmatory Fit Index (CFI) is 0.94. Both are higher than
Hair et al.’s (1998) recommendation of 0.90, indicating that the measurement model achieves
satisfactory fitness.
Table 1. Sociodemographic Profile of Respondents (N=415)
Characteristics Variable n Percentage
Male 210 51%
Gender
Female 204 49%
18-25 35 8%
26-35 200 48%
Age 36-45 101 24%
46-55 48 12%
56+ 29 7%
High school or less 38 9%
College 143 34%
Education
University 153 37%
Graduate 66 16%
Higher than graduate 13 3%
Less than $18,000 29 7%
$18,000 – $36,000 100 24%
$36,001 – $61,000 133 32%
Household Income
$61,001 – $72,000 57 14%
$72,001 – $90,000 42 10%
More than $90,000 50 12%
To assess the reliability and convergent validity of the measurement model, standardized factor loading,
composite reliability (CR) and average variance extracted (AVE) were calculated. As shown in Table 2,
the standardized factor loading of all the items ranges was above the threshold limit of 0.6, ranging
from 0.65 to 0.95 except for the first item of trust (0.57). Nonetheless, this item is appropriate to be kept
in the analysis based on Chen and Tsai’s (2007) suggestion that factor loadings greater than 0.5 are
acceptable for CFA. Moreover, the mean of this item is 4.05 with a standard deviation of 0.35 and
therefore it was not removed. Composite reliability was calculated to assess the reliability of the latent
constructs. CR of the all constructs were higher than the recommended threshold value of 0.70. Also,
as recommended by Fornell and Larcker (1981), AVEs were calculated to evaluate the convergent
validity. As shown in Table 2, all the AVE values exceed the cut-off value of 0.50 (Hair et al., 1998),
indicating a good convergent validity. Furthermore, discriminant validity is evidence if the square root
of AVE for each construct is higher than its correlation with another construct (Fornell & Larcker, 1981).
For example, as shown in Table 3, PEOU and SAT are two constructs with a correlation of 0.543. The
square root of SAT and PEOU is higher than this correlation (0.778, 0.817 respectively), indicating good
discriminant validity. Therefore, most of the constructs achieve discriminant validity except for PV.
Nevertheless, this concern is resolved by a variance inflation factors test, which is discussed further in
the next section.
10Rastegar et al. (2021) / European Journal of Tourism Research 27, 2709
Table 2. The Factor Loading, Reliability, and Validity of Measurement Model
Std.
Items Factor CR AVE
Loading
Trust 0.710 0.562
The security policy for credit card information on this system is clear. 0.570
I feel that it is safe for me to provide my credit card information when I 0.894
use the kiosk.
Ease of Use 0.889 0.667
Learning to use the McDonald’s kiosk is easy. 0.847
I find it easy to use the McDonald’s self-service kiosk. 0.842
The instruction on the kiosk are clear and understandable. 0.797
I could easily become skillful at using the kiosk. 0.778
Usefulness 0.852 0.657
The kiosk provides complete information, such as meal choices and 0.852
prices.
The kiosk provides clear images of the different menu items. 0.827
The kiosk allows me to browse the menu conveniently. 0.750
Perceived Enjoyment 0.930 0.815
The self-service kiosk is fun to use. 0.866
Using the kiosk is an enjoyable experience. 0.955
Using the kiosk is a pleasant experience. 0.885
Self-Efficacy 0.912 0.721
Ordering food via kiosk is a task which I can perform well. 0.841
I have all technical knowledge I need to use a kiosk. 0.843
I am certain I can use the kiosk well. 0.901
I feel confident that my skill at using the kiosk is just as good or even 0.810
better than others who use the kiosk.
Perceived Value 0.845 0.523
Using the kiosk makes my purchase easier. 0.800
Using the self-service kiosk requires little energy to purchase. 0.647
Using the kiosk requires little effort. 0.684
Using the kiosk was a good value for money spent. 0.764
The kiosk lets me get my food in a timely manner. 0.709
Satisfaction 0.860 0.606
I think I did the right thing when I used the kiosk. 0.766
My choice to use the kiosk was a wise one. 0.853
The kiosk offered by McDonald’s exceeds my expectations. 0.699
Overall, I am satisfied with the kiosk at McDonald’s. 0.788
Behavioural Intention 0.890 0.669
I would like to use the kiosk whenever it is available. 0.855
I will recommend the kiosk to my colleagues, friends and/or family. 0.824
I plan to use the McDonald’s kiosk more in the future. 0.858
I am more likely to return to McDonald’s because of the kiosk. 0.729
Note: AVE = Average Variance Extracted; CR = Composite Reliability. Model fit: Chi-square = 937.400, DF = 346, pThe adoption of self-service kiosks in quick-service restaurants Table 3. Results for Correlation matrix and AVEs Variable AVE SAT PEOU BI PV SE TRU PE PU SAT 0.606 0.778 PEOU 0.667 0.543 0.817 BI 0.669 0.851 0.430 0.818 PV 0.523 0.783 0.552 0.755 0.723 SE 0.721 0.507 0.841 0.382 0.488 0.849 TRU 0.562 0.473 0.519 0.397 0.440 0.543 0.750 PE 0.815 0.692 0.594 0.668 0.603 0.545 0.495 0.903 PU 0.657 0.506 0.784 0.376 0.498 0.775 0.537 0.560 0.811 Note: square root of AVE for each construct is shown in bold. PE=Perceived Enjoyment, PU=Perceived Usefulness, PEOU=Perceived Ease of Use, TRU=Trust, SE= Self-Efficacy, PV=Perceived Value, SAT=Satisfaction, BI= Behavioural Intention Structural model analysis To evaluate the structural model, SEM is used to evaluate the relationships among variables, to test hypotheses, and to assess the model fit. All the model fit indices indicated the structural model fit with the data at the acceptable level: χ2/df=2.748, GFI=0.856, NFI=0.90, IFI=0.94, CFI=0.94, and RMSEA=0.065. As shown in Figure 2, perceived usefulness was found to significantly and positively influence enjoyment (ß=0.402, t= 3.32, p
Rastegar et al. (2021) / European Journal of Tourism Research 27, 2709

Table 4. Results for the Structural Model and Hypothesis Tests
                                    Standardized
     Hypothesis                                            t-value                                   Support
                                    coefficient
     H1: PU → PE                    0.402                  3.326***                                  YES
     H2: SE → PE                    0.154                  1.287                                     NO
     H3: SE → PU                    0.259                  1.893*                                    YES
     H4: SE→PEOU                    0.933                  15.129***                                 YES
     H5: TRU→PE                     0.128                  1.957*                                    YES
     H6: TRU→ PU                    0.099                  2.010*                                    YES
     H7: TRU → PEOU                 -0.008                 -0.188                                    NO
     H8: PE → SAT                   0.203                  3.925***                                  YES
     H9: PU→ SAT                    -0.088                 -0.898                                    NO
     H10: PEOU→SAT                  -0.226                 -0.396                                    NO
     H11: PE → PV                   0.553                  8.595***                                  YES
     H12: PU→PV                     -0.008                 -0.054                                    NO
     H13: PEOU → PV                 0.258                  1.954*                                    YES
     H14: PV → SAT                  0.826                  10.824***                                 YES
     H15: PV → BI                   0.148                  -0.848                                    NO
     H16: PV → SAT → BI             0.881                  1.997*                                    YES
     H17: SAT → BI                  0.968                  15.750***                                 YES
Note: PE=Perceived Enjoyment, PU=Perceived Usefulness, PEOU=Perceived Ease of Use,
 TRU=Trust, SE= Self-Efficacy, PV=Perceived Value, SAT=Satisfaction, BI= Behavioural Intention; ***p
The adoption of self-service kiosks in quick-service restaurants
usefulness), multicollinearity issues might exist. Therefore, Variance Inflation Factors (VIF) were
adopted to verify the multicollinearity issues. According to Baguley (2012), when all VIF values ranged
less than the proposed cut off threshold of 5 (Hair, Ringle, & Sarstedt, 2011), the conclusion of no obvious
multicollinearity issue can be made. In this study, the VIF tests suggest all values between 1.418 to 2.960,
demonstrating that no obvious multicollinerarity issues exist.
Moderating effect
According to Steinmetz, Davidov and Schmidt (2011), using regression analysis techniques to determine
the interaction effects between variables has low power due to a lack of control of measurement errors.
Therefore, to test the moderating effects, this study uses the latent interaction modelling ‘constrained’
SEM approaches through Amos 25.0. Three moderators were proposed, including gender, age and past
experience in using SSKs. The following paragraphs describe the detailed analysis for each moderator,
and Table 5 demonstrates an overview for each moderator testing.
To begin, Hypothesis 18 - gender moderates the relationship between the three beliefs in the TAM (PE,
PEOU and PU) and the satisfaction model (PV and satisfaction) - was tested. First, structural parameters
were constrained in each gender group (male, N=217 and female, N=155). Then the moderating effect
was tested by the comparison between constrained model and unconstrained model and the difference
in the two chi-squares was calculated. As shown in Table 5, there are only two significant △χ2 between
unconstrained model and the proposed constraint paths. Therefore, H18 was only partially supported
and gender only moderated the relationships between PE and PV (△χ2=5.334, p=0.05) but not the other
proposed relationships.
Next, the moderating effect of age was tested. The sample was divided into two groups [the younger
groups including age range 18-45 (N=319) and older group including 46-90 (N=54)] based on the
medium split method. Similarly, the moderating effect of this hypotheses was examined using chi-
square differences test between constrained model and unconstrained model. Table 5 shows that there
was no significant difference between the constraint paths and the unconstrained model. Therefore,
H19 was not supported and age did not moderate this relationship.
Finally, Hypothesis 20 - past experience moderates the relationship between the three beliefs in TAM
and satisfaction model - was tested. To do so, median split method was used to divide the sample into
the low-level experience (N=240, used SSKs less than 12 times) and high level experience (N=175, used
SSKs more than 12 times). The result, following the similar analysing procedure, indicates that
moderating effect of past experience on the relationship between the three beliefs in TAM and
satisfaction model was only significant for the path from PE to SAT (△χ2=3.645, p=0.051) but not the
others.
Discussion
Earlier research (Davis, 1989) suggests the need to consider the role of external variables in the TAM.
Therefore, this study examined the external variables of enjoyment, trust, and self-efficacy in an offline
hospitality context: SSK adoption in QSRs. The extended TAM model was tested using a two a step
approach: confirmatory factor analysis (CFA) and structural equation modelling (SEM).
Overall, the findings show that customer satisfaction is the most powerful factor influencing the
customer’s decision to continue using SSKs. The more the customers are satisfied with the kiosk use,
the more likely they are to use kiosk service whenever it is available; and the more likely they are to
recommend their friends and families to use it. This result supports previous studies which have
14Rastegar et al. (2021) / European Journal of Tourism Research 27, 2709
identified satisfaction as the salient factor impacting behavioural intention (Cronin et al., 2000; Oliver
& Swan, 1989).
Table 5. Results for the Moderating Effects for gender, age and past experience
Constrained paths Moderator χ2 df △χ2/△df p Results
Unconstrained model for gender 881.543 224 N/A N/A
PE→PV Female 0.05
886.877 225 5.334** YES
Male
PE→SAT Female 0.12
882.445 225 0.902 NO
Male
Female NO
PEOU→PV 881.748 225 0.205 0.35
Male
Unconstrained model for age 870.346 224 N/A N/A
PE→PV Young
871.705 225 1.359 0.235 NO
Old
PE→SAT Young
871.817 225 1.471 0.201 NO
Old
PEOU→PV Young
870.389 225 0.043 0.673 NO
Old
Unconstrained model for past
861.884 224 N/A N/A
experience
High
PE→PV 862.075 225 0.191 0.25 NO
Low
High
PEOU→PV 862.308 225 0.424 0.18 NO
Low
High
PE→SAT 865.529 225 3.645* 0.051 YES
Low
Note: PE=Perceived Enjoyment, PV=Perceived Value, SAT=Satisfaction, PEOU=Perceived Ease of Use, ***pThe adoption of self-service kiosks in quick-service restaurants
enjoyable and useful. These perceptions strengthen their satisfaction and increase the likelihood of their
recommending the SSK to others.
Previous related studies on trust in the hospitality context were mostly conducted in an online setting
(Corritore et al., 2003; Elbeltagi & Agag, 2016; Koufaris & Hampton-Sosa, 2004). This study confirmed
their results in an offline setting, thereby enriching the research literature on trust and TAM.
This result also provides practical implications. Forty-four percent of the survey participants answered
“disagree” or “neither agree nor disagree” in response to questions about whether they perceived the
system as having strong security safeguards. Therefore, to increase customers’ trust, a clear description
about the SSK’s security safeguards should be visible, and cash payments possible (in addition to credit
and debit card payment options). While trust positively and directly influenced PE and PU, trust had
no significant effect on PEOU. This finding makes sense because customer’s perception of ease of use
was strongly influenced by their confidence level in using the kiosk rather than by their trust.
Notably, the result demonstrated that self-efficacy had a much stronger impact on TAM than trust. This
result suggests that customers are more concerned with their knowledge and ability to use the SSK than
with their trust of the SSK’s security features. One possible explanation may lie in the offline setting of
the SSK. Customers are physically visiting the kiosk in a busy QSR staffed with employees. If a mistake
happens or if they sense a security error, the customer can immediately call for help. This kind of
physical transaction contrasts sharply with the offline setting, where transactions are made in somewhat
of a void, where help is not close at hand. Also, in the offline setting, the process of ordering from the
SSK is public – which may prompt concerns about how others are judging their competence at operating
the SSK. Confidence to complete the task, therefore, plays an important role.
This study result supported the relationship between perceived enjoyment and perceived usefulness.
The result shows that perceived usefulness positively and significantly impacts perceived enjoyment.
This finding is consistent with existing studies that found usefulness to positively influence enjoyment
(Kang & Lee, 2014). However, this relationship has not been explored in the previous TAM studies in
the restaurant setting. This result also suggests the kiosk designer should focus more on enhancing
SSKs’ practical performance features since these lead to enjoyment, which ultimately leads to continued
retention. Furthermore, consistent with previous studies (Davis,1986), perceived ease of use positively
affects perceived usefulness. Perceived usefulness can be viewed as a mediating factor between
perceived ease of use and enjoyment.
Implications and limitations
Two important contribution of this study are its integration of TAM and the satisfaction model to better
understand users’ continued use of SSKs at QSRs; and its examination of the relationship between
intrinsic and extrinsic motivations in the TAM and customer satisfaction components (PV, satisfaction,
and behavioural intention). Previous TAM studies investigated only the direct effect of PU and PEOU
on attitude or behavioural intention (Beatson, Lee, & Coote, 2007; Wei, Torres, & Hua, 2017). In contrast,
this study tested the mediating role of perceived value and satisfaction between PU, PEOU and
behavioural intention. Thus, our model enriches the research literature on TAM, continued intention,
and satisfaction. The findings indicate that the satisfaction model explains the largest proportion of
variance. Intrinsic motivation has a stronger effect on value and satisfaction than extrinsic motivation.
Satisfaction and value both mediate the relationship between enjoyment and behavioural intention. In
other words, customers are more satisfied with an SSK at a QSR if they perceive using a kiosk as fun and
enjoyable. This result is consistent with previous studies. It also extends previous study findings on
16Rastegar et al. (2021) / European Journal of Tourism Research 27, 2709
intrinsic motivation in TAM, especially those that show enjoyment as a salient factor of satisfaction
(Chiu et al., 2010; Hirschman & Holbrook, 1982; Setterstrom et al., 2013). Customers are more likely to
continue using SSKs in QSRs and recommend them to their friends and family if they have enjoyed
using the kiosk. Some ways to help the customer enjoy more fully the kiosk experience include offering
a variety of menu items, enabling customized ordering and providing detailed nutritional profiles about
the menu items (e.g., identifying gluten-free products).
An important and surprising finding of this study is the insignificant relationship between PU-SAT and
PU-PV. This result contradicts that of previous studies which have identified PU as a main antecedent
of user satisfaction when using technology (Gelderman,1998; Hsu & Chiu, 2004; Rai et al., 2002). One
possible explanation for this result is that most survey participants were relatively young (25-36 years
old). For them, technology is so embedded within their lives that the question of its usefulness never
arises. They may simply accept, without consideration, that technology is necessary and useful. In other
words, the question of whether a McDonald’s SSK is useful may not even be a consideration for a
younger age group.
Another result of this study is that perceived ease of use did not have a significant effect on customer
satisfaction. This result is not aligned with the previous studies which indicate PEOU is highly related
to satisfaction. However, this result supports Bruner and Kumar’s (2005) study that found TAM models
that include intrinsic motivation such as perceived enjoyment result in PEOU not having a direct effect
on satisfaction and repurchase intention. Although the customers perceive that the SSK is easy to use
and fast and accurate, this perception does not influence their satisfaction and repurchase intention.
One explanation is that PEOU and PU are now widely perceived as the basic requirements for any new
technology. We expect our technology to be useful and easy to use. Therefore, the fact that a
technology, such as an SSK in a QSR, meets those criteria is not enough for customers to register
satisfaction with that technology. In earlier studies, PU and PEOU could have been relevant factors to
consider when studying technology adoption decision making, but perhaps their relevance is of less
importance in a newer, technology-ubiquitous world.
Additionally, results reveal that perceived ease of use had small but significant positive effects on
perceived value. When customers feel the instructions at an SSK in a QSR are clear and easy to follow,
they are more likely to perceive its value as high. It explains that the number of respondents were
slightly greater for women (51%) than for men. Previous research shows that when it comes to
technology adoption, perceived ease of use is a more salient factor for women than for men (Venkatesh
& Morris, 2000).
Perceived value is strongly and positively related to satisfaction. This result is in line with prior studies
(Anderson et al., 1994; Sweeny & Soutar, 2001). Moreover, while value is significantly related to
satisfaction, the results indicate no significant relationship between perceived value and behavioural
intention. Therefore, the results support that value indirectly, through satisfaction, affects behavioural
intention; and satisfaction strongly and positively affects repurchase intention. A reason could be the
way it was operationalized. Perceived value was operationalized as a unidimensional (behavioural)
value. It is possible that five items of behavioural value inadequately explained a customer’s perception
of value. A user-friendly restaurant kiosk could reduce user effort and enhance perceived value. Offering
different promotions is the other way to encourage repeat kiosk use and therefore enhance customer’s
perceived value.
17The adoption of self-service kiosks in quick-service restaurants
This study found that gender only moderates the relationship from PE to PV and past experience only
moderates the path from PE to SAT. Age has no moderating effect on the model. In other words, there
are no significant differences between young and old age groups in SSK adoption in QSRs. Enjoyment
has a significant impact on value for different genders and also affects customers differently, depending
on their level of SSK experience.
Finally, this study provides an important implication for the European restaurant industry. Compared
to the rest of the developed world, cash has been the most popular payment form in 22 out of 38
European countries (de Best, 2020). Since the COVID-19 pandemic crisis, more and more people worry
about touching cash during the transaction. Also, many essential businesses have installed hygiene
shields to maintain social distancing between frontline staff and their customers. Thus, it is reasonable
to predict the continued rise of self-order kiosks as a way to improve customer service and operating
efficiencies around the globe, including Europe. This study findings show that ease of use has a direct
effect on perceived value and perceived enjoyment significantly influences both value and satisfaction.
It is important to note that the SSK should be easy to use for a complex order (e.g., order customization;
special request) and make nutritional content of food and ingredient information available... Perceived
enjoyment should be considered as an important ingredient for providing a high quality SSK experience.
For example, visual cues (e.g., photos of food and ingredients) help customers place accurate orders
while also promoting upsells. Additional information about the menu items (e.g., home styled,
authentic, locally sourced) and ingredients will also provide customers with a more fun and enjoyable
experience.
Since the COVID-19 pandemic, service technology has become increasingly important. In Europe,
consumers used to have the mentality that SSKs do not belong to casual dining restaurant and bistro
settings but may be useful for quick service restaurants. COVID-19 has clearly exposed the need for
more service automation and accelerated the adoption of SSKs in the restaurant industry. It has also
pressured suppliers to develop SSKs with new functions (e.g., temperature check, touchless and antiviral
film-like shield on touch screen). For these reasons, SSKs may replace human service delivery and
traditional paper menus.
Although this study contributes to the existing TAM literature, there remain some limitations, and some
opportunities for future research. First, the participants were asked to recall their kiosk use in the past
six months, which could have challenged their long-term memory. Future studies should investigate
more recent kiosk use to reduce recall limitation. Second, data were collected from an online panel and
the majority of respondents (81%) were under 45 years old. Therefore, this study may have limited
applicability to older customers (above 45 years old) and to customers with limited computer skills.
Third, the sample of this study was limited to McDonald’s customers in Canada and the United States.
Consequently, caution must be exhibited when generalizing the study results. Fourth, at least one
previous study (Liang et al., 2018b) has suggested trust should be measured from two different
perspectives, while this study measured it from only one perspective. Therefore, future studies might
consider measuring trust in the platform (kiosk) and in users (skills). Finally, considering the
importance of perceived enjoyment, future studies are needed to investigate the concept of fun and
enjoyment through open-ended questions to better understand which aspect of fun affects customer
repurchase intention.
18Rastegar et al. (2021) / European Journal of Tourism Research 27, 2709
References
Alalwan, A. A., Baabdullah, A. M., Rana, N. P., Tamilmani, K., & Dwivedi, Y. K. (2018). Examining
adoption of mobile internet in Saudi Arabia: Extending TAM with perceived enjoyment,
innovativeness and trust. Technology in Society, 55, 100-110.
Allon, G., Federgruen, A., & Pierson, M. (2011). How much is a reduction of your customers' wait worth?
An empirical study of the fast-food drive-thru industry based on structural estimation
methods. Manufacturing & Service Operations Management, 13(4), 489-507.
Anderson, J. C., & Gerbing, D. W. (1988). Structural equation modeling in practice: A review and
recommended two-step approach. Psychological Bulletin, 103(3), 411-423.
Anderson, E. W., & Sullivan, M. W. (1993). The antecedents and consequences of customer satisfaction
for firms. Marketing Science, 12(2), 125-143.
Angelova, B., & Zekiri, J. (2011). Measuring customer satisfaction with service quality using American
Customer Satisfaction Model (ACSI Model). International Journal of Academic Research in Business
and Social Sciences, 1(3), 232-258.
Baguley, T. (2012), Serious Stats: A Guide to Advanced Statistics for the Behavioral Sciences. Macmillan
International Higher Education, London.
Bandura, A. (1977). Self-efficacy: Toward a unifying theory of behavioral change. Psychological Review,
84(2), 191-215.
Beatson, A., Lee, N., & Coote, L. V. (2007). Self-service technology and the service encounter. The Service
Industries Journal, 27(1), 75–89.
Bhattacherjee, A. (2001). Understanding information systems continuance: An expectation-
confirmation model. MIS Quarterly, 351-370.
Bhattacherjee, A., & Premkumar, G. (2004). Understanding changes in belief and attitude toward
information technology usage: A theoretical model and longitudinal test. MIS Quarterly, 28(2),
229-254.
Black, J., & Billette, J. (2015), "Fast food intake in Canada: Differences among Canadians with diverse
demographic, socio-economic and lifestyle characteristics", Canadian Journal of Public Health,
106(2), 52-58.
Bruner II, G. C., & Kumar, A. (2005). Explaining consumer acceptance of handheld Internet
devices", Journal of Business Research, 58(5), 553-558.
Buhalis, D., Harwood, T., Bogicevic, V., Viglia, G., Beldona, S., & Hofacker, C. (2019). Technological
disruptions in services: Lessons from tourism and hospitality. Journal of Service Management.
30(4), 484-506.
Chen, C. F. (2008). Investigating structural relationships between service quality, perceived value,
satisfaction, and behavioral intentions for air passengers: Evidence from Taiwan. Transportation
Research Part A: Policy and Practice, 42(4), 709-717.
Chen, S., Chen, H., & Chen, M. (2009). Determinants of satisfaction and continuance intention towards
self‐service technologies. Industrial Management & Data Systems, 109(9), 1248–1263.
Chen, C. F., & Tsai, D. (2007). How destination image and evaluative factors affect behavioral intentions?
Tourism Management, 28(4), 1115-1122.
Chiu, Y. T., Fang, S. C., & Tseng, C. C. (2010). Early versus potential adopters: Exploring the antecedents
of use intention in the context of retail service innovations. International Journal of Retail &
Distribution Management, 38(6), 443-459.
Compeau, D. R., & Higgins, C. A. (1995). Computer self-efficacy: Development of a measure and initial
test. MIS Quarterly, 19(2), 189-211.
Corritore, C. L., Kracher, B., & Wiedenbeck, S. (2003). On-line trust: Concepts, evolving themes, a
model. International Journal of Human-Computer Studies, 58(6), 737-758.
19You can also read