System Dynamics Modeling of Dockless Bike-Sharing Program Operations: A Case Study of Mobike in Beijing, China - MDPI
←
→
Page content transcription
If your browser does not render page correctly, please read the page content below
sustainability

Article
System Dynamics Modeling of Dockless
Bike-Sharing Program Operations: A Case
Study of Mobike in Beijing, China
Tianjian Yang, Ye Li and Simin Zhou *
 School of Economics and Management, Beijing University of Posts and Telecommunications, Beijing 100876,
 China; frankytj@bupt.edu.cn (T.Y.); ye.li@se11.qmul.ac.uk (Y.L.)
 * Correspondence: zhousimin@bupt.edu.cn

 Received: 9 February 2019; Accepted: 10 March 2019; Published: 16 March 2019

 Abstract: In China, dockless bike-sharing programs (DBSPs) have changed people’s travel modes,
 alleviated urban traffic congestion, and reduced carbon emissions. However, a number of DBSPs
 have experienced financial crises since 2018. This means that research on DBSPs must be considered
 not only in terms of the environment and technology, but also in the operation of the program.
 In this paper, we modeled the DBSP operations in a certain area using a system dynamics simulation
 approach. The main purpose was to explore the dynamics of the program’s operation process
 and evaluate possible improvement strategies for maximizing the revenue of the overall DBSP.
 Specifically, the analysis focused on the economic profits of DBSPs in an environment of competition
 and government regulation. The research findings revealed that the dockless bike-sharing industry
 has great economic profits, but in the current environment, the market needs to be regulated by the
 local government. If a DBSP does not introduce new technologies or find new profit channels, it will
 be difficult to develop sustainably by only relying on riding profits. In addition, we provide a case
 study of Mobike’s operations in Beijing to support these findings and validate the developed model.
 Finally, we discuss Mobike’s possible improvement strategies.

 Keywords: dockless bike-sharing; system dynamics simulation modeling; government regulation;
 competition; sustainable development; Mobike

1. Introduction
      The history of shared bikes can be traced back to the 1960s, and the first “shared” concept bike
was born in Amsterdam, the Netherlands [1]. In recent years, dockless bike-sharing programs (DBSPs)
have developed rapidly, thanks to the characteristics of the mobile Internet so that borrowing and
returning can occur at any time and any place. Bikes can be unlocked and paid for using a smartphone
and then picked up and left anywhere at users’ convenience. DBSPs have spread to hundreds of
cities around the world with more than 200 million users worldwide and more than $4 billion in
financing [2]. The essence of DBSPs is the online to offline bike rental business. Through this program,
urban dwellers can ease the travel problem of “the last mile”, improve the efficiency of urban travel,
and achieve a low-carbon lifestyle. More and more people believe that the development of DBSPs is a
means to facilitate sustainable urban travel and reduce carbon emissions.
      Furthermore, the rapid rise of the DBSP industry cannot be merely attributed to environmental
factors as huge economic profits are also crucial [3]. This can be summarized as follows. (1) A DBSP is
easily supported by the local government and is provided with many conveniences. (2) There is a great
market demand for DBSPs, of which the profits from the user riding are lucrative and the user deposit
collected by the DBSP forms a deposit pool. (3) The public opinion is optimistic to the industry and

Sustainability 2019, 11, 1601; doi:10.3390/su11061601                   www.mdpi.com/journal/sustainability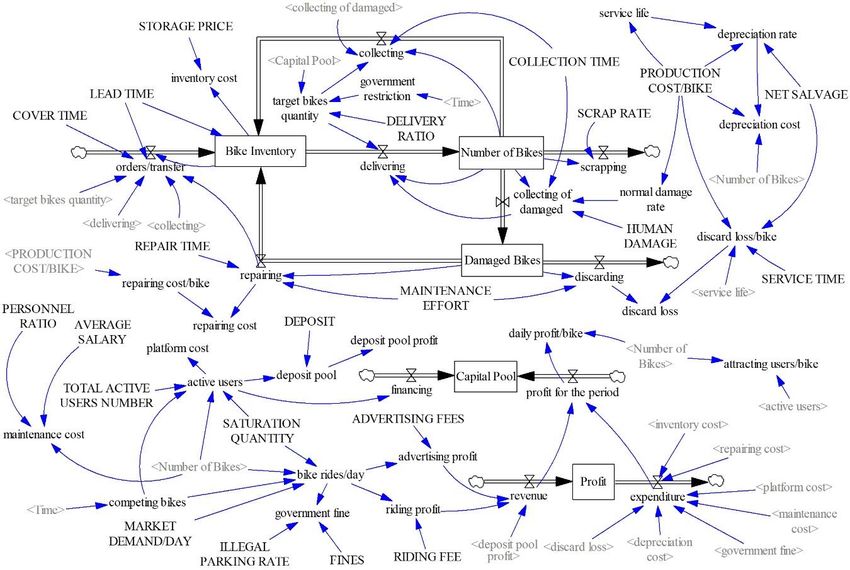
Sustainability 2019, 11, 1601                                                                     2 of 20

therefore can easily obtain financial support. (4) A large amount of the user’s registration information
and daily riding data can be obtained.
      However, a few DBSPs around the world were exposed to financial problems in 2018. People
are gradually losing faith in the DBSP industry. In April, Mobike was acquired by Meituan due to
its debt crisis [4]. In July, Ofo announced the closure of its Australian operations [5]. In August,
Ofo announced its withdrawal from the US Seattle market [6]. In September, Mobike decided to give
up the Manchester market [7]. In December, Ofo fell into a bankruptcy crisis [8]. Faced with the
operating crisis of DBSPs, managers now have to reflect on the existing business and industrial models
and ask: Are there any problems with the existing model and how can it be improved?
      Several authors have conducted research on DBSPs and have focused mainly on big data
and machine learning applications (e.g., the scheduling efficiency of DBSPs [9–11], user travel
forecast [12,13], electronic fence planning [14–16], and changes of travel mode [17,18]); user
behavior [19,20]; environmental benefits [21,22]; and the overall development of the industry [23–25].
Note that these studies add complexity to this field. However, there is a lack of analysis of the DBSP
operations at the system level. In the current social environment and technology, how to sustain the
operation of a DBSP and how to improve the business model has become a common concern of all
DBSPs. In order to better assess the DBSP operations and business model, we needed to analyze this
issue from the perspective of system, which was the reason for conducting this research.
      In this paper, our main objective was to model the main factors that affected the DBSP operations
under the environment of fierce competition and government restriction, and to propose and evaluate
potential effective improvement strategies. The research focused on DBSP operations and sustainment
strategies. To address this objective, a system dynamics (SD) simulation model of the DBSP was
developed [26]. The selection of a SD approach for this study was based on its ability to model complex
systems using visual representation that can be converted into mathematical formulas by software.
Complex systems generally have the characteristics of a complex structure, numerous influencing
factors, delays in system behavior, and parameters that change with time [27]. This simulation approach
enables the modeling of factors, operations processes, and policies to consider in the DBSP operations
as well as the evaluation of effective sustainment strategies aimed at improving the performance of
the system.
      A case study was conducted to validate the developed model for DBSPs and to further support the
findings. The findings obtained from the simulation analysis can be accessed through the case study.
In addition, some of the data and information collected from the DBSP are useful for selecting the
variables and determining the relationships among them. Therefore, we collected as much information
and data as possible of the Mobike DBSP in Beijing. Mobike values the technology development and
its patent application covers multiple core technologies in the bike-sharing field. The number of cities
which have launched this program has exceeded 200 [28].
      The paper is organized as follows. The literature review is introduced in the next section.
In Section 3, the SD simulation model of the DBSPs is developed. In Section 4, the simulation results
of the model are presented. The contribution and implications are described in Section 5. Finally,
our conclusions are given.

2. Literature Review
     The sharing economy was introduced in consumption by Marcus Felson and Joel Spaeth in 1978,
who also proposed the concept of “collaborative consumption” [29], as they believed that the joint
consumption of goods or services was a category of collaborative consumption. In recent years, with the
development of Internet technology, this concept has been further supplemented and developed. The
emergence of the sharing economy will bring huge changes to the current consumption pattern as
the sharing economy has created a “zero marginal cost economy” and brought about new consumers
through overcapacity and shared platforms [30,31].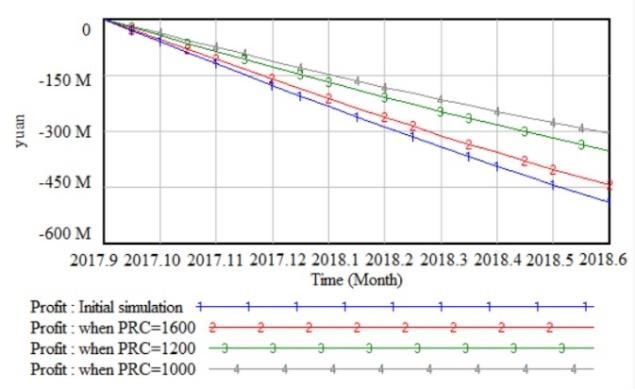
Sustainability 2019, 11, 1601                                                                     3 of 20

     The sharing economy can be considered to be driven by several factors: the development of
information technology and the network society; the increase in the proportion of urbanization;
the expansion of the income gap; and the impact of the financial crisis [32]. The sharing economy
has a certain impact on many industries and has changed traditional business models. More and
more scholars are engaging in research on the sharing economy where some have analyzed the
reasons for the success and failure of some shared platforms from the perspective of business
model profitability, and discussed the pricing strategies, financing models, and crowdfunding
methods of enterprises [33–35]. Demary and Wallsten studied the issue of competition in the sharing
economy [36,37]. Kumar et al. clarified a strategic framework for sharing economic business models
and studied the issue of resource allocation [38]. A study by Plewnia et al. found that a shared
economic system could be described in four dimensions: shared goods or services, market structure,
market orientation, and the industry sector [39]. Hawlitschek et al. studied how blockchain technology
could be applied to the shared economy to solve the trust problem [40]. Zhang et al. analyzed the price
competition problem in the shared economy [41]. All of the above-mentioned research considers the
various problems in the sharing economy from the holistic perspective of operations management.
In contrast, there has been no targeted analysis of the problems of a specific shared economic industry.
However, it has inspired many of the ideas of system construction in this study.
     At the same time, many studies have shown that the sharing economy should be regulated by the
government. Some scholars have analyzed the role of government in the sharing of economic business
models from a macro level [42–44]. Richardson et al. studied how the government changed its role
in traditional business models and shared economic business models [45]. Martin et al. proposed
a democratic platform governance model to regulate programs [46]. Hong et al. compared the
sharing economic policies of 47 cities in the United States and believed that political competition
had a significant impact on the government’s policy of regulating the sharing economy [47]. Ma et
al. analyzed the government regulation model and proposed corresponding improvement strategies
through the DBSP situation in Shanghai [48]. Therefore, the analysis of DBSP from a system perspective
should consider the regulation of government.
     In the study of the operation of a specific sharing economic industry, Bardhi et al. conducted
a case study of the shared transportation program Zipcar. They believe that shared platforms play
an important role in the business model of the sharing economy [49]. Henten et al. studied the
Airbnb pricing strategy and argued that the type of property rights, the number of comments and
location had important implications for shared resources [50]. Phua et al. analyzed customer service,
technical challenges, and customer trust in Airbnb [51]. Li et al. studied the operation strategy of a
dock bike-sharing program based on game theory, and provided an optimal strategy to maximize
the revenue of the program [52,53]. However, few studies have considered the problems of the DBSP
operations from the perspective of system. This paper aims to bridge the research gap and intends to
identify the influence relationships among the variables of a DBSP in order to undertake a comparison
between the reality and the dynamic behavior of the model which represents the whole system.

3. System Modeling
      Maintaining a balance between revenue and expenditure is the key to the sustainable development
of a DBSP in a certain area. Hence, the revenue and expenditure of the DBSP should be fully considered
in this system. The system model description is first given in Section 3.1. Next, the corresponding
relationship between the parameters and variables can be represented by the mathematical equations
in Section 3.2 in order to run various simulations and analyze the dynamic behavior of the system.
The validation process of the obtained model is presented in Section 3.3.

3.1. Model Description
    For the sake of convenience, the main variables used throughout the models are shown in Table 1,
and the rest of the variable descriptions are shown in Table A1 of Appendix A. This study focused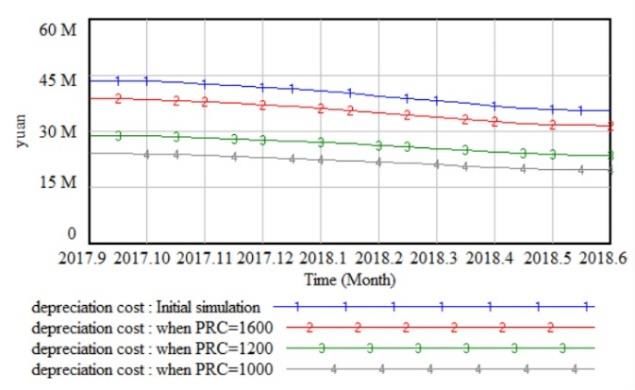
Sustainability 2019, 11, 1601                                                                               4 of 20

on the operation of DBSPs from the perspective of system, ignoring the impact of several additional
factors on some of the variables. As the scope of these factors is too wide, the variables associated
with real-world system dynamics, such as collection time and maintenance effort were considered as
exogenous variables.

                                       Table 1. Nomenclature list.

                Nomenclature
                Level Variable
                Bike Inventory       The amount of bike inventory that is used to supply the market
               Number of Bikes       The total number of bikes the DBSP supplies in a certain area
               Damaged Bikes         The total number of damaged bikes that have been collected
                 Capital Pool        The capital reserve of the DBSP in a certain area
                    Profit           The total profit of the DBSP
                 Rate Variable
                orders/transfer      The number of bikes purchased or transferred
                  delivering         The number of bikes delivered to the market in the period of time
                   collecting        The number of bikes in good condition collected from the market
                  discarding         The number of damaged bikes discarded due to beyond repair
                   scrapping         The number of bikes scrapped due to their service life expiration
            collecting of damaged    The number of damaged bikes collected in the period of time
                   repairing         The number of bikes that have been repaired
             profit for the period   The profit of the DBSP in the period of time
              Auxiliary Variable
                inventory cost       The cost of storing bikes
               maintenance cost      The cost of maintaining bikes
               depreciation cost     The cost of bike depreciation
                  discard loss       The loss of discarding damaged bikes
                 repairing cost      The cost of repairing damaged bikes
                 platform cost       The cost of platform operations
               government fine       The local government fines due to illegal parking of bikes
                  riding profit      The profit from riding bikes
               advertising profit    The profit from various advertisements
              deposit pool profit    The profit from using the deposit pool to invest
                  deposit pool       The total number of deposits paid by all users
               depreciation rate     The depreciation rate of bikes
                bike rides/day       The total number of DBSP bike rides per day in a certain area
                  active users       The number of active users of the DBSP in a certain area
               competing bikes       The total number of bikes competing DBSPs supply
             target bikes quantity   The target number of bikes the DBSP supplies in the period of time
                                     The maximum number of bikes the DBSP supplies under the local
           government restriction
                                     government regulation
             Exogenous Variable
              DELIVERY RATIO         The ratio of the target number of bikes to the maximum number
               NET SALVAGE           The residual value minus the disposal cost after the bike expiration
     TOTAL ACTIVE USERS NUMBER       The total number of active users in a certain area
                                     The ratio of the number of repaired bikes to the total number of
         MAINTENANCE EFFORT
                                     damaged bikes
        PRODUCTION COST/BIKE         The average cost of production per bike
         SATURATION QUANTITY         The saturation quantity of bikes required by users in a certain area
                                     The total number of the market demand bike rides per day in a
         MARKET DEMAND/DAY
                                     certain area

     Several assumptions were made throughout this analysis to simplify and facilitate the modeling
process by helping focus on the most important factors. The assumptions can be summarized as
follows. (1) Since every bike is equipped with GPS, maintenance personnel can collect all damaged
bikes according to the state information of bikes in every period. (2) The competing factors between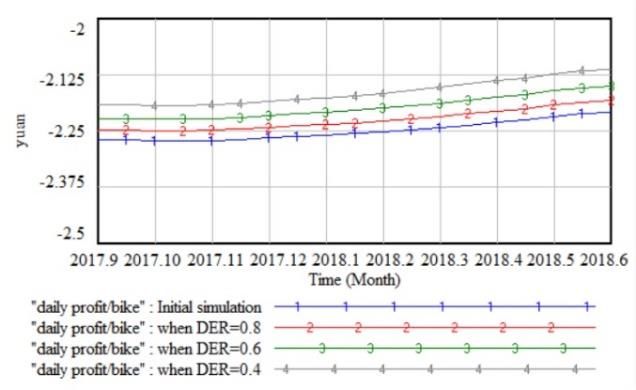
Sustainability 2019, 11, x FOR PEER REVIEW 5 of 20
Sustainability 2019, 11, 1601 5 of 20
Several assumptions were made throughout this analysis to simplify and facilitate the modeling
process by helping focus on the most important factors. The assumptions can be summarized as
the follows. (1) Sinceinclude
DBSPs mainly every bike
the is equipped
number with GPS,
of bikes maintenance
supplied, the ridingpersonnel
fee, thecan collect the
deposit, all damaged
quality of
bikes
bikes, etc.according to the fee
As the riding stateofinformation
each DBSPof inbikes in every
a certain areaperiod. (2) The
is similar, thiscompeting
factor wasfactors between
not considered.
the DBSPs mainly include the number of bikes supplied, the riding fee, the
According to the 2017 Bike-Sharing User Behavior Analysis [54] and 2018 China Bike-Sharing Industry deposit, the quality of
bikes, etc. As the riding fee of each DBSP in a certain area is similar, this factor
Development Analysis Report [55], the most important factor for users is the number of bikes supplied. was not considered.
According to the 2017 Bike-Sharing User Behavior Analysis [54] and 2018 China Bike-Sharing
In addition, most users only register with one DBSP. The number of active users and bike rides of
Industry Development Analysis Report [55], the most important factor for users is the number of
each DBSP can be considered to be determined only by the number of bikes supplied, which was also
bikes supplied. In addition, most users only register with one DBSP. The number of active users and
evidenced in the subsequent case study. (3) The number of bikes delivered in the market in the period
bike rides of each DBSP can be considered to be determined only by the number of bikes supplied,
of time will not exceed the amount of bike inventory, which means that shortage is not allowed (e.g.,
which was also evidenced in the subsequent case study. (3) The number of bikes delivered in the
Yang et al. [56] and Balali et al. [57]).
market in the period of time will not exceed the amount of bike inventory, which means that shortage
isFor
not most
allowedDBSPs,
(e.g.,the
Yangoperation
et al. [56]and
andmaintenance activities of the program in a period of time are
Balali et al. [57]).
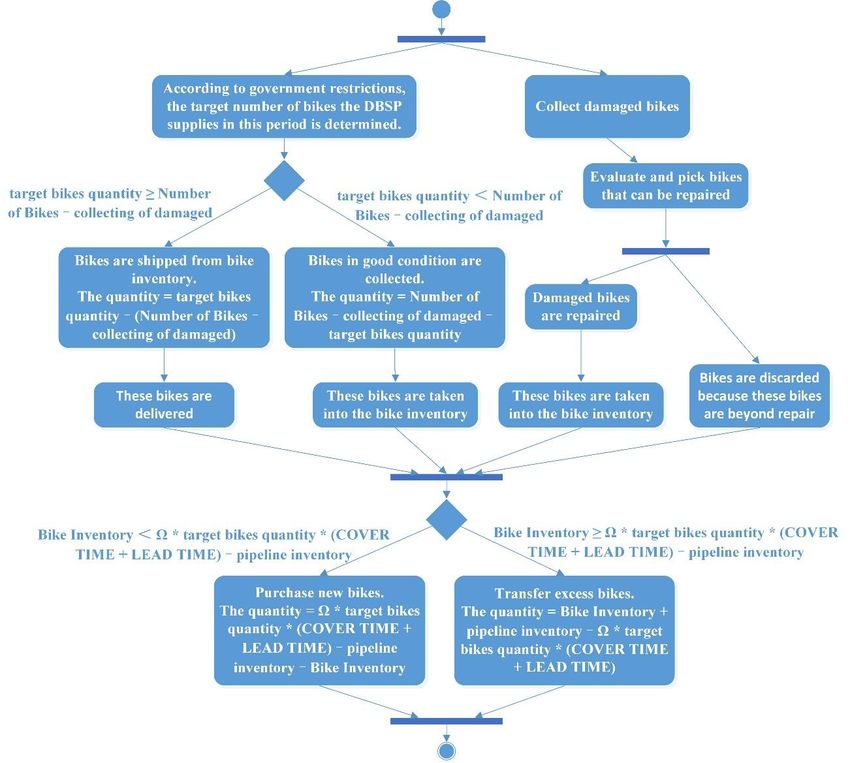
shown in ForFigure
most 1. The DBSP
DBSPs, determines
the operation and the quantity to
maintenance be delivered
activities or collected
of the program in a based
periodonof the
timetarget
are
number
shown in Figure 1. The DBSP determines the quantity to be delivered or collected based on the collects
of bikes the program supplies in a period of time. At the same time, the program target
damaged
numberbikes according
of bikes to the supplies
the program GPS information,
in a periodand repairs
of time. At and discards
the same time,the
theseriously
programdamaged
collects
bikes [58]. Afterward,
damaged the number
bikes according to the of
GPSbikes purchasedand
information, (or repairs
transferred) is determined
and discards by the damaged
the seriously program’s
inventory strategy.
bikes [58]. Without
Afterward, the loss
numberof generality, the traditional
of bikes purchased installation-stock
(or transferred) policy
is determined bywas used in this
the program’s
study [59]. Ω strategy.
inventory is the stock coefficient,
Without loss ofdefined as thethe
generality, ratio of the inventory
traditional to be maintained
installation-stock policy wasto the target
used in
this study
number of bikes[59].inΩthis
is the stock coefficient, defined as the ratio of the inventory to be maintained to the
period.
target number of bikes in this period.
Figure A generic
1. 1. A
Figure generic form
form ofdockless
of the the dockless bike-sharing
bike-sharing program
program (DBSP) (DBSP)
operation andoperation and
maintenance
maintenance activities. activities.
All business and social systems contain a host of assets, which can be viewed as stock or the
accumulation of resources that change according to their physical inflows and outflows [60]. A system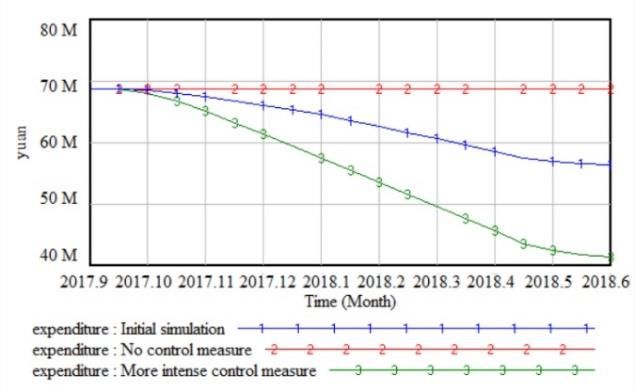
Sustainability
Sustainability 2019,
2019, 11,11, x FOR PEER REVIEW
1601 6 of6 20
of 20
All business and social systems contain a host of assets, which can be viewed as stock or the
accumulation
dynamics of resources
simulation model inthat
the change
form of according
a stock andtoflow
theirdiagram
physical(SFD)
inflows
can and outflows
be created [60]. A
by capturing
thesystem dynamics
stock and simulationofmodel
flow structure in the form
the systems. Theof a stock
SFD of a and
DBSPflow diagram
is shown in(SFD)
Figurecan
2. be
Thecreated by
rectangles
capturing the stock and flow structure of the systems. The SFD of a DBSP is shown
represent level variables showing the cumulative results. The valves represent the rate variablesin Figure 2. The
rectangles
showing the represent level variables
physical flows showing into
of items feeding the cumulative
or depleting.results. The valves
The diagram represent
presents thethe rate
variables
variables
used showing
for modeling thethe physical
DBSP and flows of items
the causal feeding into
relationships or or depleting.
links The diagram presents the
among them.
variables used for modeling the DBSP and the causal relationships or links among them.
Figure 2. The stock and flow diagram (SFD) of the DBSP.
Figure 2. The stock and flow diagram (SFD) of the DBSP.
The model description begins with the DBSP’s operation and maintenance activities. The DBSP
The model description begins with the DBSP's operation and maintenance activities. The DBSP
first
first determinesthe
determines thetarget
targetnumber
number of of bikes
bikes (target bikes quantity)
(target bikes quantity)ininthisthisarea
areabased
basedonon thethe local
local
government restriction. The operation of the DBSP should be carried out
government restriction. The operation of the DBSP should be carried out under government under government regulation
to maintain
regulationtraffic order [48].traffic
to maintain Afterorder
that, considering
[48]. After that
that,the bikes havethat
considering a certain percentage
the bikes have aofcertain
damage
(HUMAN DAMAGE and normal damage rate) in each period,
percentage of damage (HUMAN DAMAGE and normal damage rate) in each period, the DBSP the DBSP determines the number
of determines
bikes delivered and collected
the number of bikes (delivering
delivered and and collecting)
collected to ensure
(delivering andthat the total
collecting) to number
ensure that of the
bikes
thetotal
DBSP supplies
number (Number
of bikes the DBSP of Bikes)
supplies satisfies
(Numberthe of
target
Bikes)bikes quantity
satisfies in thebikes
the target period. At the
quantity same
in the
time, the DBSP
period. At theneeds to spend
same time, COLLECTION
the DBSP TIME
needs to spend to collect all of
COLLECTION the to
TIME damaged
collect allbikes (collecting
of the damaged of
bikes (collecting of damaged).
damaged).
Maintenanceeffort
Maintenance effortisisexpressed
expressedas as the
the proportion
proportion of of repairs
repairsto tothe
thedamaged
damagedbikes. bikes.It It
takes
takesanan
amount of time (REPAIR TIME) and repairing cost for the repair of damaged
amount of time (REPAIR TIME) and repairing cost for the repair of damaged bikes. Several bikes bikes. Several bikes
(discarding)
(discarding) are
are beyondrepair
beyond repairand
andthese
these bikes
bikes will
will be
be discarded.
discarded. The Theloss
losscaused
causedbyby discarding
discarding a a
bike is represented by the discard loss/bike. The higher the production cost
bike is represented by the discard loss/bike. The higher the production cost per bike (PRODUCTION per bike (PRODUCTION
COST/BIKE),the
COST/BIKE), thegreater
greaterthethecost
costof
ofrepair
repair per
per bike
bike (repairing
(repairing cost/bike),
cost/bike),and andthe greater
the greater thethediscard
discard
loss/bike [61]. The discard loss is generated by the NET SALVAGE of a
loss/bike [61]. The discard loss is generated by the NET SALVAGE of a bike, the discarding and bike, the discarding and thethe
discard loss/bike.
discard loss/bike.
The number of bikes in good condition are stored as Bike Inventory. Assume that the
The number of bikes in good condition are stored as Bike Inventory. Assume that the
installation-stock policy is used by the DBSP. In other words, the target Bike Inventory is computed
installation-stock policy is used by the DBSP. In other words, the target Bike Inventory is computed by
by extending the demand forecasts over the LEAD TIME plus the inventory COVER TIME [59]. When
extending the demand forecasts over the LEAD TIME plus the inventory COVER TIME [59]. When the
the sum of the on-hand inventory and the pipeline inventory is lower than the target Bike Inventory,
sum of the on-hand inventory and the pipeline inventory is lower than the target Bike Inventory,
orders need to be issued to ensure that there are enough bikes to be delivered in the next period.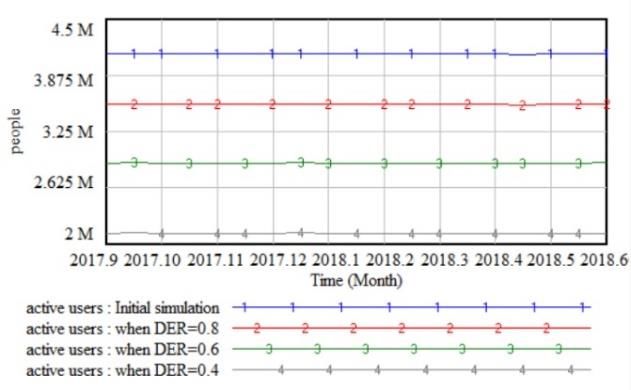
Sustainability 2019, 11, 1601                                                                        7 of 20

When the sum of the on-hand inventory and the pipeline inventory is greater than the target Bike
Inventory, a certain number of excess bikes need to be transferred to other areas. At the same time,
the Bike Inventory leads to the inventory cost, which is influenced by the price of the warehouse
(STORAGE PRICE).
      After that, due to the daily use and maintenance of bikes, several important expenditures will be
incurred. These are the maintenance cost, the government fine, and the depreciation cost. One factor
that affects the maintenance cost is the labor cost. This factor can be expressed as the AVERAGE
SALARY of the maintenance personnel. The ratio between the number of maintenance personnel
required and the total number of bikes the DBSP supplies is the PERSONNEL RATIO. However, due to
traffic disturbance caused by illegal parking, the local government will control this phenomenon in the
area by fining (government fine) the DBSP.
      The life of the bike (service life) is directly related to the production cost per bike (PRODUCTION
COST/BIKE). As the bikes can be considered as fixed assets of the DBSP [62], the depreciation rate of
the bikes is determined by the PRODUCTION COST/BIKE, the service life, and the NET SALVAGE
of the bikes [63]. Then, the depreciation cost of the bike in each period can be generated. The DBSP
scraps the bikes that have reached the end of their service life. The SCRAP RATE is defined as the
percentage of bikes whose service life has expired in the quantity being supplied.
      Next, the DBSP’s revenues are described. In a competitive environment, the DBSP’s market
share can be expressed by the number of active users and the total number of bike rides per day
(bike rides/day) in a certain area. In order to model the competitive activity, the Selten Fair Reward
Combination [64] was applied to obtain these values.

                                        R1   R         Rn
                                           = 2 = ... =                                                  (1)
                                        W1  W2         Wn

In Equation (1), W1 , W2 , . . . , Wn represent the number of bikes (Number of Bikes) supplied by each
DBSP in a certain area. R1 , R2 , . . . , Rn can represent the number of active users or the number of bike
rides/day for each DBSP. If the sum of Number of Bikes for all DBSPs is greater than or equal to
the saturation quantity of bikes required by users (SATURATION QUANTITY) in the area, the sum
of R1 , R2 , . . . , Rn is the total number of active users (TOTAL ACTIVE USERS NUMBER) or the total
number of the market demand bike rides per day (MARKET DEMAND/DAY). Otherwise, the sum
of R1 , R2 , . . . , Rn will be reduced by the ratio of the sum of the Number of Bikes for all DBSPs to the
SATURATION QUANTITY.
      Each active user needs to register and pay a DEPOSIT, which forms a deposit pool. The deposit
pool was used by the DBSP for some financial investment and wealth management activities to obtain
the deposit pool profit. The platform cost increases as the number of active users increases. At the same
time, the number of active users is used as a measure of investment, which is positively correlated to
the financing the DBSP receives. The financing flows into the Capital Pool. The user is required to pay
the RIDING FEE when using the bike, and the DBSP obtains the riding profit. Furthermore, the DBSP
can add some advertising in the application to obtain the advertising profit.
      Finally, the DBSP’s revenue includes deposit pool profit, advertising profit, and riding profit.
The DBSP’s expenditure includes inventory cost, maintenance cost, discard loss, repairing cost,
platform cost, government fine, and depreciation cost. The DBSP’s profit is controlled by revenue and
expenditure, and the Profit is used to measure the program’s overall profitability. The daily profit per
bike (daily profit/bike) and the number of users attracted per bike (attracting users/bike) are used to
observe the average profitability of each bike. The Capital Pool is controlled by financing and the profit
of the DBSP in the period of time (profit for the period). When the Capital Pool collapses, the DBSP
will withdraw from the regional market, which means that the target bikes quantity is equal to zero.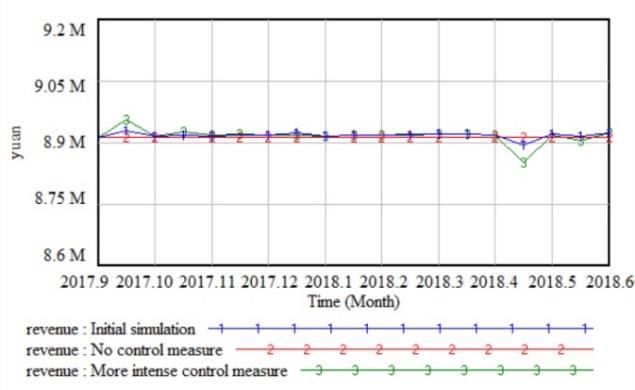
Sustainability 2019, 11, 1601                                                                            8 of 20

3.2. Mathematical Formulation
     The mathematical equations followed the conventions of the software Vensim DSS v5.6a (Ventana
Systems Inc.), which was used to implement our simulation. The main formulas and significant
functional relationships of the SFD are enumerated as follows. The expressions for the rest of the basic
formulas in the model are given in Appendix B.
     The dynamic behavior of the level variables Bike Inventory, Number of Bikes, Damaged Bikes,
Capital Pool, and Profit is represented by a time integral of the net inflows minus the net outflows.
For example, Bike Inventory (BI) is defined by a time integral of the net inflow orders/transfer (o),
collecting (col), and repairing (rep) minus the net outflow delivering (del). Negative values indicate the
opposite direction of flow. The number of bikes purchased or transferred is available for storage in BI
after a period of time from the issue (LEAD TIME (LT)). In order to model this process, the function
DELAY1 was used. This function returns the value of the inputs o delayed by the LT:
                                  Z t
                     BI (t) =           (rep(t) + col (t) + DELAY1(o (t), LT ) − del (t))dt + BI (t0 )      (2)
                                   t0

     A similar equation defines the total number of bikes the DBSP supplies (Number of Bikes (NB)) in
the model. NB is defined by a time integral of the net inflow delivering (del) minus the net outflow
collecting (col), collecting of damaged (cod), and scrapping (scr):
                                           Z t
                                NB(t) =           (del (t) − col (t) − cod(t) − scr (t))dt + NB(t0 )        (3)
                                             t0

     An IF THEN ELSE function is used to define the target bikes quantity (tbq) in the process. When the
Capital Pool (CP) is less than or equal to 0, the DBSP will be forced to withdraw from the market. That
means that the tbq is equal to 0. Otherwise, tbq is equal to the government restriction (gor) multiplied
by the DELIVERY RATIO (DER), 0 < DER < 1, so that the tbq cannot be greater than the gor:

                                tbq(t) = IF THEN ELSE(CP(t) = ( NB(t) − cod(t)), tbq(t) − NB(t) + cod(t), 0)                 (5)

     The repairing (rep) is formulated using Damaged Bikes (DB), MAINTENANCE EFFORT (MAE),
and REPAIR TIME (RET). The DBSP lays down the MAE. The MAE is often determined by a number
of parameters such as the technique of inspecting and repairing damaged bikes [61]. Furthermore,
the DELAY1 function is used due to the time (RET) required to repair the bike:

                                           rep(t) = DELAY1( DB(t) ∗ MAE, RET )                              (6)

     The straight-line depreciation method was applied to compute the depreciation rate (dep).
This method not only considers the bike service life (sel) and PRODUCTION COST/BIKE (PRC),
but also considers the residual value of bike waste recycling and the cleaning costs that must be paid
when it is discarded [63]. The sum of these two values is the bike NET SALVAGE (NES):

                                                                  PRC − NES
                                                       dep(t) =                                             (7)
                                                                  sel (t) ∗ PRC

      Then, the depreciation cost (dco) is formulated using the PRC, Number of Bikes (NB), and dep:

                                                   dco (t) = PRC ∗ dep(t) ∗ NB(t)                           (8)
Sustainability 2019, 11, 1601 9 of 20
The bike rides/day (bir) can be represented as a function of Number of Bikes (NB), competing
bikes (cob), SATURATION QUANTITY (SAQ), and MARKET DEMAND/DAY (MAD). Specifically,
in this case, the Selten Fair Reward Combination [64] is used to more accurately define the bir in the
process. However, only when the sum of the NB of each DBSP is greater than or equal to the SAQ, the
sum of the bir of each DBSP is equal to the MAD. At this time, the market is saturated. This means that
even if the sum of the NB of each DBSP is increasing, the sum of the bir remains the same. Otherwise,
the ratio of the sum of the bir to the MAD is equal to the ratio of the sum of the NB to the SAQ. This is
the reason for introducing the IF THEN ELSE function. In order to make readers understand better,
Equations (9) and (10) were not further simplified:
NB(t) NB(t) NB(t)+cob(t)
bir (t) = IF THEN ELSE(( NB(t) + cob(t)) >= SAQ, NB(t)+cob(t)
∗ MAD, NB(t)+cob(t)
∗ MAD ∗ SAQ ) (9)
A similar function defines the number of active users (acu) of the DBSP. The acu can be formulated
using the NB, cob, SAQ, and TOTAL ACTIVE USERS NUMBER (TAU):
NB(t) NB(t) NB(t)+cob(t)
acu(t) = IF THEN ELSE(( NB(t) + cob(t)) >= SAQ, NB(t)+cob(t)
∗ TAU, NB(t)+cob(t)
∗ TAU ∗ SAQ ) (10)
3.3. Model Validation
A series of tests were used to validate the simulation model before conducting any analysis with
the model. Following the rules proposed by Barlas [65], structure-oriented behavior tests were used to
validate the model, i.e., structural validation was performed using sensitivity analysis. Based on the
result of the sensitivity analysis, we identified that the changes in the dynamic behavior patterns of the
model resulting from changes in the value of particular parameters fairly accurately corresponded to
the available knowledge of real-world systems. Accordingly, the model can be considered suitable
for evaluating the potential improvement strategies of the system through a simulation of scenarios.
These scenarios involve changes in the value of the parameters to which the model’s dynamic behavior
patterns were found to be sensitive in the sensitivity analysis. These parameters were PRODUCTION
COST/BIKE, DELIVERY RATIO, competing bikes, and government restriction.
4. Model Simulation
In order to assess the universality and robustness of the developed generic model, a case study of
a DBSP was adopted in this study. Moreover, we proposed some potential improvement strategies
to make the DBSP sustainable through this case study. The DBSP’s behaviors in an area were given
realistic data for specific exogenous variables. The DBSP employed as a case study was Mobike in
the selected area of Beijing. The reasons for choosing Beijing were as follows: (1) There is fierce
competition in this area where the focus is on business and large-scale investment by each DBSP;
(2) Beijing is the capital of China so the DBSPs are under strict government regulation; and (3) most
of the real data for this area is given. The purpose of simulating this model was to find the rules of
the bike-sharing market that can be applied to many other bike-sharing markets around the world.
The Beijing bike-sharing market description is first given in Section 4.1. Next, the corresponding
different strategies are analyzed and discussed in Section 4.2.
4.1. Situation of the Beijing Bike-Sharing Market
Mobike was founded in 2015. Over the next three years, this DBSP has grown rapidly, and its
total financing amounted to 17.1 billion yuan [66]. However, it relied too much on financing and did
not find a corresponding profit model. This DBSP was acquired by Meituan in April 2018. The total
daily loss was as high as 15.65 million yuan, and the average daily loss per bike was 2.2 yuan [67].
This DBSP entered the Beijing market in September 2016 and its main competitor is Ofo. About 90%
of shared bikes in Beijing are delivered by these two DBSPs [68]. The ratio of Mobike to Ofo bikesSustainability 2019, 11, 1601 10 of 20
delivered is about 0.71. The ratio of active users is about 0.63 [69]. The ratio of monthly bike rides is
about 0.65 [70]. These data support assumption (2) to some extent.
The data collected were mainly regarding the operation of Mobike in Beijing from September
2017 to June 2018. Since the large-scale delivery of shared bikes in Beijing in April 2016, the number of
shared bikes reached 2.35 million in September 2017. The government began to regulate the number of
deliveries of shared bikes by setting a ceiling of 1.91 million for the number of shared bikes [68]. At the
same time, because Meituan applied for listing in June 2018, a large number of Mobike’s operation
data flowed out. All of these factors contributed to the selection of this time period.
In addition, the Beijing government also regulates the DBSPs as follows: (1) The user deposit is
deposited in the designated bank account and the interest generated is not attributed to the DBSP [71];
(2) The ratio of maintenance personnel to the number of deliveries shall not be less than 5‰ [72];
(3) Bike body advertising is prohibited [73]; (4) The government scraps shared bikes that have been in
use for three years [74]; and (5) The government penalizes illegal parking [75].
The parameters required for the model and the source of the initial values came mainly from the
National Information Center, Beijing Statistics Bureau, Beijing Planning Institute, reports from relevant
data agencies, government announcements, and Meituan. This information included a lot of numerical
data associated with Beijing’s bike-sharing market such as the market demand, the saturation quantity
of shared bikes, and other relevant information, which helped this study to develop a comprehensive
and accurate system model. The simulation time was set for nine months and the simulation cycle
was set to 0.5. Moreover, two lookup functions were introduced into the model to formulate the
variables government restriction and the competing bikes, which assumes that the change between
months is linear and the total number of shared bikes supplied by each DBSP is adjusted in the same
proportion. The simulation analysis involved the use of several assumptions related to the values
of the model parameters. The selection of the assumed values corresponded as much as possible to
meaningful concepts in the real world. Nevertheless, these parameter values are not as important as
an understanding of the changes in the behavior of the system under different scenarios. Table A2
presents the initial values of the simulation used in the SD model, which is shown in Appendix C.
4.2. Analysis and Discussion
(1) Factor of government regulation for government restriction (gor) and competing bikes (cob)
In the following simulation, we changed the value of the government regulation factor for the
DBSPs in this situation. The value of government restriction (gor) was set up as per III and V of
Appendix C. The value of competing bikes (cob) was set up as per IV and VI of Appendix C. In other
words, the Beijing government began to regulate the industry in September 2017, and the maximum
number of shared bikes was determined in April 2018. III and IV correspond to the government
not implementing any control measures. V and VI correspond to the government taking more
intense control measures to ensure that the total number of shared bikes in the market is equal to the
SATURATION QUANTITY. We ran the simulation respectively and obtained the results. The curves
of the revenue and expenditure of different values of gor and cob are shown in Figure 3. According
to Figure 3, the revenue of the DBSP remained basically unchanged. However, the expenditure
of the DBSP was 56.3, 68.7, and 41.4 million yuan in June 2018 when the government adopted
different policies.
From the simulation results, we can draw the following implication. For a highly competitive
bike-sharing market, the government cannot allow itself to compete on its own. The government
needs to adopt a series of controls on the market to prevent market efficiency losses. The reason is
that the DBSPs will not generate more market demand even if they deliver more shared bikes after the
number of shared bikes in the market reaches the SATURATION QUANTITY. On the contrary, there
will be additional costs for all DBSPs. It also causes a waste of social resources and traffic safety issues.
The results verified the conclusions of the extant literature [48].implementing any control measures. V and VI correspond to the government taking more intense
control measures to ensure that the total number of shared bikes in the market is equal to the
SATURATION QUANTITY. We ran the simulation respectively and obtained the results. The curves
of the revenue and expenditure of different values of gor and cob are shown in Figure 3. According to
Figure 3, the revenue of the DBSP remained basically unchanged. However, the expenditure of 11
Sustainability 2019, 11, 1601
theof 20
DBSP was 56.3, 68.7, and 41.4 million yuan in June 2018 when the government adopted different
policies.
Sustainability 2019, 11, x FOR PEER REVIEW 11 of 20
From the simulation results, we can draw the following implication. For a highly competitive
bike-sharing market, the (a)government cannot allow itself to compete on(b) its own. The government
needs to adopt a series of controls on the market to prevent market efficiency losses. The reason is
Figure3.3. The simulation
Figure simulationresults
resultsofofthethe
different government
different governmentcontrol measures:
control (a) revenue;
measures: (b)
(a) revenue;
that the DBSPs will not generate more market demand even if they deliver more shared bikes after
(b)expenditure.
expenditure.
the number of shared bikes in the market reaches the SATURATION QUANTITY. On the contrary,
(2)there
Factor will
of be additional costs
PRODUCTION for all DBSPs.
COST/BIKE It also causes a waste of social resources and traffic safety
(PRC)
issues. The results verified the conclusions of the extant literature [48].
In (2)
theFactor
following simulation, we
of PRODUCTION changed(PRC)
COST/BIKE the value of the factor PRODUCTION COST/BIKE
(PRC). TheIn thevalue was set
following as 1600, 1200,
simulation, and 1000.
we changed the The
value reason
of thefor choosing
factor these values
PRODUCTION is that the
COST/BIKE
latest
(PRC). The value was set as 1600, 1200, and 1000. The reason for choosing these values is that thelife
shared bike production cost of Mobike has been reduced to 1000 yuan while the service
and the normal
latest damage
shared bike rate has
production remained
cost of Mobike thehas
same.
beenThis means
reduced that the
to 1000 yuan DBSP’s average
while the shared
service bike
life and
production
the normal cost will gradually
damage decrease. the
rate has remained Again,
same.weThis
ran means
the simulation
that the respectively
DBSP's average andshared
obtainedbikethe
results. The curves
production of the
cost will depreciation
gradually costAgain,
decrease. and Profit
we ranof different
the simulation of PRC areand
valuesrespectively shown in Figure
obtained the 4.
According to Figure 4, the depreciation
results. The curves of the depreciation cost of the DBSP was 35.5, 31.6, 23.6, and 19.6 million yuan in
and Profit of different values of PRC are shown in Figure
4. According
June 2018 whentothe Figure
value4,of
thePRC
depreciation
was 1800,cost of the
1600, DBSP
1200, andwas 35.5,
1000, 31.6, 23.6, and
respectively. The19.6 was −
million
Profit yuan
490.3,
in June
−444.4, 2018 when
−352.9, and − the value
307.0 of PRC
million wasrespectively.
yuan, 1800, 1600, 1200, and 1000, respectively. The Profit was -
490.3, -444.4, -352.9, and -307.0 million yuan, respectively.
(a) (b)
Figure
Figure4.4.The
Thesimulation results
simulation of the
results different
of the values
different of PRC:
values (a) depreciation
of PRC: cost; cost;
(a) depreciation (b) Profit.
(b) Profit.
From
From thethe simulation
simulation results,
results, wedraw
we can can thedraw the following
following implication.
implication. For the
For a DBSP, a DBSP, the
depreciation
depreciation cost of the shared bike is a huge expense. This cost can account
cost of the shared bike is a huge expense. This cost can account for 63% of the total expenditure for 63% of the total
expenditure
each month and each month and
is directly is directlyby
determined determined
PRC. The DBSPby PRC. The DBSP
should should
maintain maintain continuous
continuous research and
development of new materials and techniques for sharing bikes. This allows the DBSPthe
research and development of new materials and techniques for sharing bikes. This allows toDBSP
reduce
to reduce the PRC of the shared bike while maintaining the same quality. At the same time, the DBSP's
the PRC of the shared bike while maintaining the same quality. At the same time, the DBSP’s PRC
PRC should be adapted to the local government's requirements for bike life limitations. For example,
should be adapted to the local government’s requirements for bike life limitations. For example, the
the shared bike life superior limit set by the Beijing government is three years. Excessive PRC can
shared bike life superior limit set by the Beijing government is three years. Excessive PRC can lead to
lead to unnecessary costs. Therefore, the changing values of PRC have important impact effects on
unnecessary costs. Therefore, the changing values of PRC have important impact effects on the Profit.
the Profit.
(3) of
(3) Factor Factor of DELIVERY
DELIVERY RATIORATIO (DER)(DER)
In the following simulation, we changed the value of the factor DELIVERY RATIO (DER). The
In the
value wasfollowing simulation,
set as 0.8, 0.6, and 0.4. The we initial
changed theofvalue
values of variables
the level the factorwereDELIVERY
modified RATIO (DER).
accordingly.
TheInvalue was set as 0.8, 0.6, and 0.4. The initial values of the level variables were modified
other words, the DBSP did not deliver the shared bikes to the market to the greatest extent. We ran accordingly.
In the
other words, therespectively
simulation DBSP did not anddeliver
obtainedthe the
shared bikesEach
results. to theofmarket to the
the daily greatest extent.
profit/bike We ran
values were
theobtained
simulation in each simulation.
respectively andThe curvesthe
obtained of results.
the active
Eachusers anddaily
of the dailyprofit/bike
profit/bikevalues
of different values
were obtained
of DER are shown in Figure 5. According to Figure 5, the active users of the DBSP was 4.1, 3.6, 2.9,
and 2.1 million people in June 2018 when the value of DER was 1, 0.8, 0.6, and 0.4, respectively.
However, the daily profit/bike was -2.20, -2.18, -2.15, and -2.11 yuan, respectively. The more active
users the DBSP has, the lower daily profit/bike the DBSP becomes.
From the simulation results, we can draw the following implication. Even if a DBSP occupies aSustainability 2019, 11, 1601 12 of 20
Sustainability 2019, 11, x FOR PEER REVIEW 12 of 20
in each simulation.
Additionally, The curves
as there ofcompetition
is fierce the active users and
in the daily profit/bike
market, of different
the DBSP's average costvalues of DERinare
will increase
orderintoFigure
shown keep 5.
theAccording
user scaleto growing.
Figure 5,Therefore,
the activethe DBSP
users should
of the DBSP look
wasfor new
4.1, 3.6,profit channels
2.9, and or
2.1 million
reduce expenses to reduce the average cost. For example, the DBSP can take advantage
people in June 2018 when the value of DER was 1, 0.8, 0.6, and 0.4, respectively. However, the daily of this vast
amount ofwas
profit/bike user−data
2.20,combined
−2.18, −with2.15,other
and − services on the
2.11 yuan, platform to The
respectively. generate
morerevenue and apply
active users big
the DBSP
data
has, theand machine
lower learning technologies
daily profit/bike the DBSPin their operations to reduce costs. If the DBSP only pursues
becomes.
the growth of the user scale, it will not make the DBSP sustainable.
(a) (b)
Figure
Figure 5. 5.
TheThe simulationresults
simulation resultsof
ofthe
thedifferent
different values
values of
of DER:
DER: (a)
(a)active
activeusers;
users;(b)
(b)daily
dailyprofit/bike.
profit/bike.
5. From
Contribution and Implications
the simulation results, we can draw the following implication. Even if a DBSP occupies a
sufficient market share, its operating costs will not be significantly reduced and the marginal cost of
5.1. Research
adding Contribution
more active users will not decrease. This is unlike other shared economic industries [30,31].
Additionally, as there is fierce
First, no systematic competition
mechanism has in thedeveloped
been market, the toDBSP’s
evaluate average
DBSPs.cost
Thewill increase in
construction oforder
an
to keep the user
operational scalefor
model growing. Therefore,
DBSPs helps the DBSP
researchers should
explore lookand
current forfuture
new profit
DBSPchannels or reduce
predicaments by
expenses to reduce
simulating variousthefactors.
average cost.
The For also
model example, the DBSP
provides can take
researchers withadvantage
an in-depthof this vast amount
understanding of of
thedata
user government
combined regulation
with otherfactor that contributes
services to prevent
on the platform market efficiency
to generate revenue andlosses. The big
apply simulation
data and
resultslearning
machine can be used to conduct
technologies in further analyses on
their operations the change
to reduce inIfvarious
costs. the DBSPfactors
onlyafter the DBSP
pursues has
the growth
introduced
of the new
user scale, it technology.
will not make Researchers
the DBSP can compare the simulated results for various factors to
sustainable.
evaluate potential improvement strategies [76]. This evaluation method can assist DBSPs in
5. Contribution
evaluating the and Implications
effectiveness of improvement strategies, thus helping them avoid potential crises. The
model of DBSPs constructed by this study could be used as a research basis for researchers carrying
5.1.out
Research
futureContribution
DBSP studies, thereby improving their comprehensiveness. Finally, as the model
combined
First, norelated theories
systematic with practices
mechanism in reality
has been as the main
developed entry point,
to evaluate DBSPs.it could also enhance the
The construction of an
sophistication of the DBSP research field.
operational model for DBSPs helps researchers explore current and future DBSP predicaments by
Second, many DBSP studies have explored the key factors that could affect their performance.
simulating various factors. The model also provides researchers with an in-depth understanding of
However, most of these studies have been single-level approaches exploring the impacts on one
the government regulation factor that contributes to prevent market efficiency losses. The simulation
factor. For example, the difference between of the dockless bike-sharing industry and other shared
results can be used to conduct further analyses on the change in various factors after the DBSP has
economic industries has not been comprehensively examined. To address this gap, the systematic
introduced new technology. Researchers can compare the simulated results for various factors to
DBSP model constructed in this study considered many different levels including the market
evaluate potential improvement strategies [76]. This evaluation method can assist DBSPs in evaluating
competition level, government restriction level, cost and profit computation level, and DBSP
theoperation
effectiveness of These
level. improvement strategies,
levels were thus helping
integrated themthe
to construct avoid potential
model that crises.
coveredThe model
them all. of
DBSPs constructed
Furthermore, thisbytype
this of
study could besystematic
integrated used as a research basis for researchers
model (compared carrying
with single-level out future
studies of
DBSP
influential factors) has the added benefit of considering more important dimensions of DBSPs. Itrelated
studies, thereby improving their comprehensiveness. Finally, as the model combined also
theories withthe
integrates practices in reality
influential as of
factors themore
maindimensions
entry point,that
it could
mightalso enhance
impact theirthe sophistication
performance. of the
Hence,
DBSP
thisresearch field.
simulation approach takes a more extensive perspective on the exploration of the influential
Second,
factors, many
thereby DBSP studies
developing have
a more explored theDBSP
comprehensive key factors
model. that could affect their performance.
However, most of these studies have been single-level approaches exploring the impacts on one factor.
For5.2. Managerial
example, Implicationsbetween of the dockless bike-sharing industry and other shared economic
the difference
industries has not
First, the SDbeen comprehensively
simulation model of examined. To address
DBSPs developed thisstudy
in this gap, the systematic
aimed to bridgeDBSPthe model
gap
constructed in thisand
between theory study considered
practice. many
It started fromdifferent
the pointlevels including
of practice the market
by collecting large competition
amounts of data level,
government restriction level, cost and profit computation level, and DBSP operation level.
and information to gain an understanding of the DBSP operations. We then combined related theories These levels
were integrated
with to construct
DBSP practices the model
to construct that covered
a systematic them all.
DBSP model, the Furthermore,
purpose of whichthiswas
typetoof integrated
establish a
systematic model (compared with single-level studies of influential factors) has the added benefitSustainability 2019, 11, 1601 13 of 20
of considering more important dimensions of DBSPs. It also integrates the influential factors of
more dimensions that might impact their performance. Hence, this simulation approach takes a
more extensive perspective on the exploration of the influential factors, thereby developing a more
comprehensive DBSP model.
5.2. Managerial Implications
First, the SD simulation model of DBSPs developed in this study aimed to bridge the gap between
theory and practice. It started from the point of practice by collecting large amounts of data and
information to gain an understanding of the DBSP operations. We then combined related theories with
DBSP practices to construct a systematic DBSP model, the purpose of which was to establish a set of
management guidelines that could assist DBSP managers and regulators with DBSP implementation.
This information could be used as a basis of implementation, thus enabling DBSP managers and
regulators to obtain management skills and implementation knowledge. It could also guide managers
as they invest resources in the most key factors for improving the performance of the system, which
would allow DBSPs to maintain a balance between revenue and expenditure.
Second, many DBSPs around the world have exposed financial problems. Consequently,
the effective formulation of sustainment strategies in the current social and industry environment is a
focal point of interest for DBSPs. The DBSP system proposed in this study explored the key factors
impacting performance, thus it could assist DBSP managers in focusing their resources on the most
critical factors during implementation, thereby reducing unnecessary investments in blind pursuit
of market share. Therefore, this system can help improve the performance of DBSPs and reduce the
likelihood of ineffective investments.
6. Conclusions
The dockless bike-sharing industry has developed rapidly in recent years. However, issues of
unsustainability have long plagued DBSPs and governments. This study examined the difficulties
experienced by DBSPs in exploring the key factors affecting the sustainable development of the
program. A simulation approach was conducted to model the factors, operations processes, and
policies of DBSPs to assist DBSP managers and regulators in the effective management of DBSPs in
the current social and industry environment. As much data and information as possible of the DBSPs
involved in real-life operation activities were collected to determine the status of the business and
analyze their current condition in an attempt to explore their current predicament and bottleneck [77].
The analyses showed that current DBSP difficulties have three causes: (1) high normal damage and
human damage rate; (2) high production costs; and (3) increased competition due to the rapid influx of
capital. This study was intended to help DBSPs grasp survival opportunities in adverse conditions:
technological innovation can improve performance, look for new profit channels, reduce expenses
to reduce the average cost, and facilitate the creation of new business value. Blind pursuit of market
share is not conducive in enhancing competitive strength.
Therefore, in order to study the operation of DBSPs and evaluate potential improvement strategies,
this study analyzed the key influencing factors that can impact the performance of a DBSP, and
established a SD model for the DBSP. Systems thinking and non-linear logic analysis concepts of
system dynamics were applied to construct the SFD of the DBSPs’ operational difficulties that reflected
the actual situation. This can be used to identify the most effective solution, which could be applied in
combination with policy simulation tests to address the DBSPs’ difficulties and performance issues.
According to the simulation of the model with the case of the Mobike operation in Beijing, we found
that the government needs to intervene in the bike-sharing market to improve the allocation efficiency
of market resources. Allowing free competition in the market will bring adverse results to many
parties. The average cost of production per bike is another influential key factor as many costs are
greatly affected by this factor. Finding new profit channels or reducing expenses is important to make
DBSPs sustainable. This requires the program to continuously introduce new technologies. ThroughYou can also read