Experiences from Battery-Electric Truck Users in Norway - MDPI
←
→
Page content transcription
If your browser does not render page correctly, please read the page content below
Article
Experiences from Battery-Electric Truck Users
in Norway
Inger Beate Hovi *, Daniel R. Pinchasik, Erik Figenbaum and Rebecca J. Thorne
 Institute of Transport Economics, NO-0493 Oslo, Norway; drp@toi.no (D.R.P.); efi@toi.no (E.F.); rth@toi.no (R.J.T.)
 * Correspondence: ibh@toi.no; Tel.: +47-9884-7002

 Received: 11 October 2019; Accepted: 19 December 2019; Published: 22 December 2019

 Abstract: This paper presents experiences from pilot-projects with battery-electric trucks in
 Norway, focusing on purchasing processes, technology, vehicle choices, user experience and various
 performance aspects. Furthermore, we discuss the electrification potential for battery-electric trucks
 and compare their total costs of ownership and associated socio-economic costs with internal
 combustion engine (ICE) trucks for a range of technological maturity scenarios. The results
 show that experiences have generally been positive but tailoring of use patterns is often required.
 Furthermore, at their current maturity level, battery-electric trucks could, to some extent, replace
 typical use of Norwegian ICE trucks, depending on the situation. In terms of costs, we expect
 that battery-electric light distribution trucks will first become competitive with ICE trucks when
 technology reaches mass production.

 Keywords: BEV (battery-electric vehicle); case study; truck; electrification potential; TCO (total cost
 of ownership); ZEV (zero-emission vehicle)

1. Introduction
      Norway’s National Transport Plan for 2018–2029 sets ambitious targets for the introduction of
zero-emission commercial vehicles as a means to fulfil CO2 reduction objectives towards 2030. By 2025,
all new lighter vans are required to be zero-emission vehicles. By 2030, the same applies to all new
heavy vans and 50% of new Heavy Goods Vehicles (HGVs) [1]. Achieving these targets, however,
is not straightforward. The Nordic Council of Ministers [2], for example, finds that given current policy,
Norway (and other Nordic countries) faces sizable emission reduction gaps in freight transport in light
of the 2030 climate objectives, and that major trend changes are needed in the production and adoption
of alternative propulsion systems and lower-carbon fuels.
      Although several manufacturers have announced intentions to start series production in
2019–2020 [3], the market for zero-emission electric trucks (e-trucks) has, to date, largely consisted
of pilot tests, meaning that most trucks with battery-electric powertrains (BE-trucks) are converted
versions of standard diesel trucks. In Norway, the first BE-truck became operative (registered) as late as
September 2016, and when the current study began in April 2018, this had only increased to three trucks.
By July 2019, the Norwegian fleet still counted only 15 e-trucks, all utilizing battery-electric technology,
including heavy vans that are registered as light lorries due to their high battery weight. With these
numbers, freight vehicles lag behind compared to electric vans and buses, for which production stages
are somewhat more mature [3].
      By the autumn of 2019, all e-trucks in Norway are still conversions from diesel trucks and heavy
vans. Volvo seems to be among the first manufacturers opening sales of small-series BE-trucks from
week 42 in 2019, with expected delivery in the first half of 2020, while MAN will be able to deliver a
small handful of BE-trucks to the Norwegian market during late 2019 or the start of 2020. For fuel cell
hydrogen-electric trucks (FCHE-trucks), there still seems to be some way to go before series-produced

World Electric Vehicle Journal 2020, 11, 5; doi:10.3390/wevj11010005                    www.mdpi.com/journal/wevj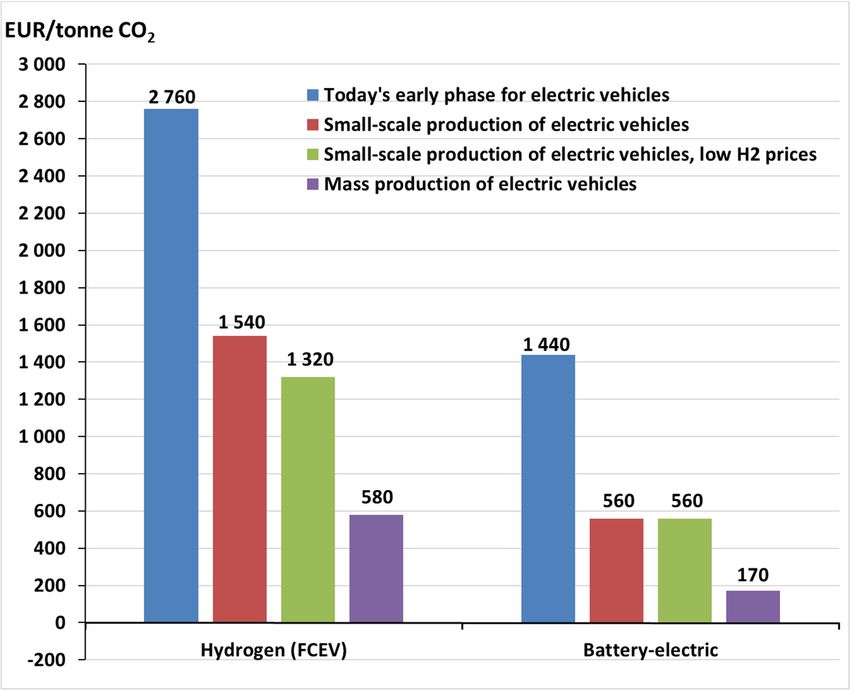
World Electric Vehicle Journal 2020, 11, 5                                                           2 of 21

vehicles reach the market. In the fall of 2019, however, four FCHE-trucks, converted from diesel truck
chassis’, will be phased into operation for a major distributor of groceries in central Norway.
     The aim of the present paper was to identify and present experiences gained by pilots with
BE-trucks in Norway so far. Building on information from pilot users, this work further provides
insights into the potential and costs for electrification in both the near term and longer term. This is
done by (1) looking at how pilot vehicles are used and what adjustments have had to be made in daily
use patterns compared to similar patterns for ICE trucks, (2) analysing user patterns for different vehicle
segments, (3) developing cost models that compare total costs of ownership of BE- (and FCHE-) trucks
versus ICE-trucks in a number of scenarios for technology maturity, and (4) assessing socio-economic
costs of phasing in zero-emission trucks. While the first two analyses thus focus on BE-trucks, in the
latter two, it was possible and insightful to also consider FCHE solutions. Understanding user
experiences and technological and economic barriers and enablers perceived by operators is crucial for
achieving the ambitious uptake of zero-emission vehicles that Norway envisions over the next decade.
Particularly for freight vehicles, there seems to be a knowledge gap regarding these topics.

2. Literature Background
     To date, research on the adoption of e-trucks has been relatively limited compared to what is the
case for passenger cars, and to a lesser extent, buses. This applies both to research on user experiences
and on reasons behind the adoption (by firms) of electric vehicles e.g., [4]. For TCO analyses, there
are also particularly few studies for medium and heavy-duty vehicles [5]. The main reason for this
is that the number of e-trucks is still small and in an early phase. This is caused by prohibitively
high purchase prices compared to ICE-vehicles, and by technological and operational limitations and
uncertainties, such as short driving ranges, operational stability, resale prices, etc. [6–8].
     Although battery-electric heavy-duty vehicles (HDVs) have, to date, reached higher technological
readiness levels than their FCHE counterparts and therefore, dominate pilots [7,9], the small number
of battery-electric HDVs that are currently in use are largely conversions from diesel vehicles [8].
From 2019, however, several manufacturers have started up selected pilots [8].
     When it comes to user experiences, a case study based on interviews of frontrunner companies in
Amsterdam [4] revealed that important factors for adoption are positive social and environmental effects,
as well as strategic considerations. Respondents reported positive experiences using electric vehicles,
but at the same time, technological limitations were identified as adoption barriers. Firms successfully
adopting BE-vehicles also reported having to carry out significant adjustments of e.g., route planning.
Kleiner et al. [7] reported similar findings in an overview of the status for electric logistics: common
experiences across countries are that drivers are generally well-accepting of e-trucks, but that e-trucks
have operational limitations compared to ICE trucks, and that the availability and choice of vehicles
has, to date, been limited. Kleiner et al. [7] also found that few business cases are provided, and that
from these, it becomes clear that specific local characteristics are very important for success (e.g.,
topography, temperature and availability of (financial) incentives).
     With regard to the feasibility of e-trucks in terms of cost competitiveness and technical capabilities,
findings are mixed [8]. On the one hand, there are significant extra costs for investing in e-trucks
compared to those with ICE. In TCO analyses assessing the current situation, these are generally either
calculated by summing cost estimates for different components [10] or based on a small number of
observations. This situation leads to estimates that, thus far, are uncertain and vary widely between
studies. Estimates of capital cost premiums of electric propulsion systems in the future also vary
considerably, particularly for FCHE-trucks [9]. However, there seems to be a consensus that capital cost
premiums compared to conventional vehicles will decrease considerably with larger scales of production,
with BE-trucks remaining cheaper than FCHE-technology, and reaching cost-competitiveness vis-à-vis
ICE at a faster rate e.g., [11–13].
     On the other hand, there are operating costs which, due to longer mileages, are more significant for
TCO of trucks than for passenger cars [9]. Operating costs for electric propulsion tend to be lower than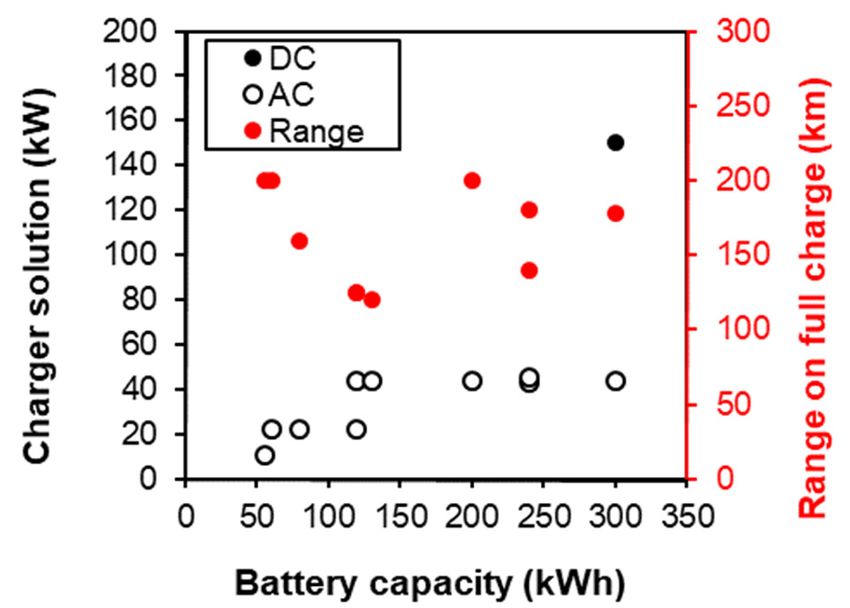
World Electric Vehicle Journal 2020, 11, 5                                                                3 of 21

for diesel vehicles due to, amongst other reasons, higher energy efficiency for electricity and savings
on energy costs and general maintenance [5,6,14]. This emphasizes the idea that high utilization may
be key for recovering the cost premium of investment, and thereby, for the competitiveness of e-trucks.
     Nevertheless, according to Plötz et al. [9], it is this degree of utilization, due to range challenges, that
makes the potential for electrifying heavy freight transport by road controversial. Indeed, technological
barriers stemming from limited driving ranges and long recharging times are lower for trucks with
shorter yearly mileages. This is also the reason why e-trucks are starting to get deployed in urban use
cases. For larger trucks and trucks with high annual mileages, barriers for electrification are larger [15].
     Comparing BE- and FCHE-propulsion, Mulholland et al. [15] found that BE-systems yield higher
energy efficiency but are currently most suitable for shorter-distance driving, due to limited battery
capacity and long recharging times. As a potential motivator for the adoption of FCHE-trucks, compared
to BE-trucks, a selection of German experts identified the longer driving ranges. However, there are
concerns about insufficient fueling infrastructure becoming available [8].
     Overall, it is likely that the operational and economic feasibility of electric HDVs is currently still
highly dependent on characteristics of the specific use case, not least the public policy instruments.

3. Methodology
     The current paper builds on four interrelated analyses: (1) User experiences, (2) Electrification
potential in light of typical user patterns, (3) Models for cost of ownership and comparisons of
decomposed cost levels for different propulsion technologies, and (4) Socio-economic costs of phasing
in zero-emission trucks. The results from the first analysis are presented for different vehicle segments
(light and heavy distribution trucks, tractors for semitrailers, refuse collection vehicles, and to a
lesser extent, vans). A similar analysis for zero-emission buses in Norway was presented at EVS32 in
Lyon [16]. In the other analyses, the presentation of results will focus on light distribution trucks,
which seems to be the vehicle segment with the largest electrification potential in the short term (in
addition to electric vans, which are already a commercial product category).

3.1. User Experiences
      To assess user experiences, we carried out a case study based on semi-structured interviews of
enterprises with experience in operating e-trucks in Norway. Sample selection is based on the list
of projects [17] that have received support from ENOVA (the Norwegian Government Agency for
the transition towards a low-emission society), the Norwegian Public Road Administration’s vehicle
registry Autosys, as of December 2018 [16], and the project list of ‘Klimasats’, which is the Norwegian
Environment Agency’s climate initiative for transitions to low-emission solutions in the public sector.
In addition to truck operators, such as freight forwarders, a number of relevant government/public
policy bodies and manufacturers were also interviewed.
      The interviews were open-ended and conducted as Skype meetings (in Norwegian) with
representatives closely involved in investment or policy decisions of each of the identified
organizations. As preparation, subjects were sent a questionnaire, after which the open-ended
interview questioning allowed them to articulate perceptions freely. To allow clarifications and
correction of any misunderstandings, subjects were sent the interview minutes for comments and
approval. Although specifics varied, interview questions were related to the vehicle purchase process
and supplier, trial experiences (technology choice, design, feedback from owners/drivers/passengers,
energy use, range, vehicle performance, service/maintenance, charging performance and use of existing
fleet), decomposed investment and operation costs, as well as public frameworks and incentives that
could contribute to faster diffusion of zero-emission vehicles into the Norwegian market.

3.2. Electrification Potential Given Typical Vehicle User Patterns
     Given the current state of technology, the most important barriers for the electrification of vehicle
fleets are driving range limitations and long charge times of larger BE-vehicles. These barriers are
World Electric Vehicle Journal 2020, 11, 5 4 of 21
especially relevant for freight transport by road. Compared to buses, freight vehicles generally cover
larger service areas and have less predictable daily driving patterns, which often also complicates
daytime charging. In addition, owners of freight vehicles rely on their vehicles to generate income.
Loss of cargo capacity due to large and heavy batteries or time required for daytime charging translates
directly into higher costs, and may also lead to needs for increased vehicle-km to perform the same
level of services compared to a vehicle with combustion engine.
In our analysis, we look at the Norwegian potential for electrifying freight vehicles, distinguishing
between the near term (with particular focus on how technological limitations such as driving ranges
and engine size relate to current use patterns and requirements) and the longer term (where we focus
more on the influence of different vehicle-dependent obstacles for electrification) given that transport
assignments can be distributed between vehicles with more flexibility.
The main sources for our analysis are base data from both the Norwegian vehicle registry,
Autosys [18] and Statistics Norway’s survey of trucks for 2016 and 2017 [19]. In the latter, samples of
truck operators report all transport assignments for one week, and sample selection is done such that
all weeks of the year are represented. Combining these two sources, we constructed a dataset including
information on amongst others, vehicle category and age, engine power, use of trailer (during reporting
week) and trip length.
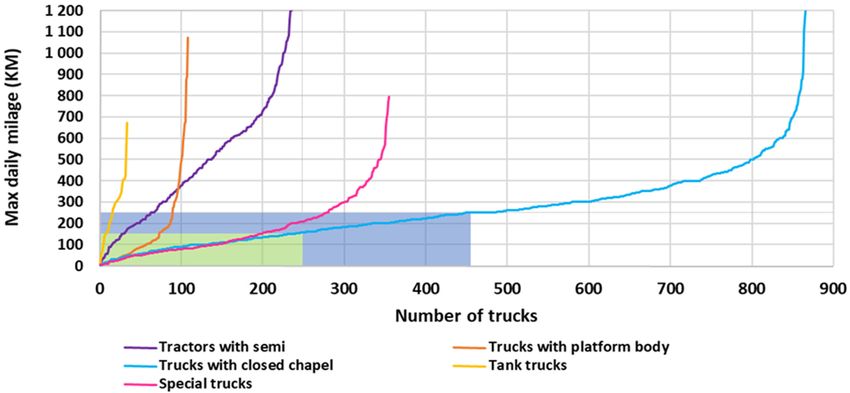
We also aggregated data from trip level to daily mileages, using maximum daily mileages as a
proxy for the minimum driving range that electric vehicle alternatives should have to be suitable for
the user. Using the maximum daily mileages ensures that we take into account day-to-day variations,
which may pose challenges with respect to battery sizing, predictability, and charging requirements
(see, e.g., an analysis of the potential for use of BE-vans by Norwegian Craftsmen in Figenbaum [20]).
In cases where vehicles have two or more daily trips starting from the same postcode (as approximation
for vehicles returning to a base with a charging opportunity), daily mileages were adjusted to reflect
that requirements for driving ranges would be lower.
Furthermore, we set a number of criteria for trucks to be considered as having electrification
potential in the shorter timeframe:
• Maximum daily mileage is shorter than the driving range on a fully charged battery (the latter is
set to a maximum of 150 km based on specifications of and pilot experiences with current electric
alternatives; this also agrees with Anderhofstadt and Spinler [8] who identified upcoming e-trucks
by Daimler and MAN having maximum driving ranges of up to 200 km, which must be derated
somewhat for Norwegian winter driving, and similarly, Volvo’s announced FE Electric-truck)
• Engine power ≤500 HP (according to a major manufacturer interviewed, there are currently
effectively no alternatives to diesel or biodiesel for higher engine powers; this is supported by
none of the current battery-electric trial vehicles having engine powers >500 HP)
• Not requiring the use of a trailer, except tractor units (due to the high engine power required for
driving with heavier trailers and following the above manufacturer’s feedback)
• Trucks up to five years old (i.e., the fleet segment where transport actors and manufacturers
report that requirements for new purchases are set, and taking into account that annual mileages
decrease with vehicle age)
Altogether, this yielded a sample of 6150 trucks with information on static fleet data, daily user
patterns and variations.
3.3. Cost Competitiveness of Electric vs. ICE Operation
To investigate the cost-competitiveness of electric trucks with trucks with ICE, we developed
models for total costs of ownership. Similarly to the core of many existing studies
e.g., [5,13,21,22], we established cost functions that are decomposed into relatively detailed
cost components. We distinguished between technology-dependent costs (which vary between
technologies and are divided further into time-dependent, distance-dependent and maintenance costs),World Electric Vehicle Journal 2020, 11, 5 5 of 21
and technology-independent costs (equal or assumed equal for all technologies). The cost aspects
considered in our model are summarized in Table 1.
Table 1. Overview of main cost aspects considered in the cost-comparison model. All cost comparisons
exclude VAT, since firms can subtract this on incoming goods and services. Exchange rate used: 1 EUR
= 9.8 NOK.
Cost Category Main Aspects Taken into Account
Time-dependent Investment/capital costs (excl. subsidies); Depreciation; Residual values; Discount rate
Energy consumption & cost (base price + any levies); Road toll charges and exemptions
Distance-dependent
(discounts) for zero-emission; Driving distances and mileages
Maintenance and repair General maintenance; Tyre degradation; Washing, etc.
Technology-independent Wage expenses; Admin and insurance costs; Annual weight fee
The starting points for the technology-dependent cost functions are validated base parameters
from a National Freight Model for Norway, hereafter referred to as NFM [23,24]. An advantage of
starting with this model is that the technology-dependent cost functions can later be used for analyses
of different future scenarios using the same model.
With regard to investment/capital costs, we distinguished between ‘reference investment costs’
for the diesel alternative (from the NFM) and investment cost premiums of alternative technologies.
For e-trucks, cost parameters (hereunder investment cost premiums) are based on (confidential)
data collected in the user interviews, updates and refinements of cost parameters from Hovi and
Pinchasik [25], feedback from actors in the Norwegian transport sector, data from Jordbakke et al. [3],
and cost development forecasts e.a. [12]. We found that estimates for cost premiums of converted
heavy-duty trucks are in line with Weken et al. [26]. Subsidies towards cost premiums were not
included in our calculations, as these are granted only in a limited number of cases and because one of
the study’s objectives was to illustrate when alternative propulsion vehicles can be competitive on
their own.
Furthermore, TCO calculations are done considering a depreciation period of 5 years (the typical
leasing period), with depreciation based on the counter-balance principle. Hereby, it is expected that
batteries last at least the entire typical leasing period without requiring replacement, in light of lifetime
estimates spanning between 6.6 and 11 years [5,22,27].
However, due to uncertainty around remaining battery lifetime after the leasing period, and due
to the lack of a second-hand market (in particular for the early-phase market for BE- and FCHE trucks),
the availability of data on resale prices is limited [8,22,28,29] and is set conservatively. For e-trucks, this
entails that we use the same residual value share as for diesel vehicles (using NFM parameters), but with
an additional ‘uncertainty’ discount, depending on the production maturity phases, i.e. discount of
50% under the early market phase scenario, 25% under small-scale series production, and no discount
under mass production. The latter is based on examples from the market for BE-passenger cars which
found that Norwegian leasing firms initially operated with low residual values due to uncertainty,
but that these values have normalized with market maturity [30].
As in most TCO analyses see, e.g., [21,27], or [29] costs and savings occurring at different stages in
the vehicle’s lifetime are discounted to their present value. We used a discount rate of 3.5% (upward
adjustment from the NFM representing commercial cost of leasing).
Regarding distance-dependent costs, energy prices are split into a base price and any applicable
levies, using the same sources as above. For electricity, costs are further split into regular charging,
and a cost premium of 50% per kWh in case of fast charging (representing additional costs of requiring
charging at higher power/effect, e.g., connection upgrades). While we include road toll charges and
their exemptions for zero-emission vehicles, ferry costs and exemptions are not included in the analysis
due to limited data availability and particularly high dependence on use location.World Electric Vehicle Journal 2020, 11, 5 6 of 21
Driving distances and mileages are set to 45,000 km/year for trucks, based on NFM parameters
and adjusted to reflect mileages feasible for BE use cases, i.e., particularly urban/regional
distribution patterns.
Regarding maintenance, we assume that costs for e-trucks are 50% lower than indicated for
ICE trucks by NFM parameters. This is based on conclusions by Huismans [5], and by Zhou [22],
who suggested that maintenance costs for electric trucks are about 30–50% of the level for similar diesel
vehicles, and Jadun [31], who expects savings on maintenance to increase with larger-scale adoption.
Other cost aspects in the table are based on NFM parameters. The annual weight fee is treated as
a technology-independent cost component, because its environmental component is only marginal.
Not presented here are costs related to infrastructure establishment, charging/filling time, any need
for back-up capacity, any decreases in cargo capacity given heavy batteries, and any decrease in
operating hours during the day because of range limitations and/or lack of access to fast charging
throughout the day. These themes are discussed later in our analysis of electrification potentials and
use patterns.
It should also be noted that for BE- and FCHE-trucks, available data on cost premiums and
operation are currently still limited and uncertain in many studies e.g., [5,10,27], amongst others,
because manufacturers are cautious about sharing detailed information. However, data availability is
expected to improve with future adoption, and our flexible model set-up is designed to allow easy
incorporation of new estimates for all parameters.
Based on the inputs above, and given expectations that cost premiums of electric trucks will
decrease materially with technology maturity e.g., [4,12,13], we assessed three scenarios to illustrate
implications for cost-competitiveness: (1) today’s early market phase for BE- and FCHE-trucks, (2)
small-scale series production, both with current and lower hydrogen prices, and (3) mass production.
For today’s early phase, our assumptions on cost premiums of electric vs. ICE vehicles are based
on the sources above. For small-scale series production, we assume that battery-electric vehicles
cost twice as much as corresponding ICE vehicles; hydrogen-electric vehicles three times as much.
Under mass production, battery-electric vehicles are assumed to cost 50% more than ICE vehicles;
hydrogen vehicles about double. The latter is in line with estimates on system cost reductions for MD
trucks at production scales of 100k systems a year [32], page 15, and which imply a cost premium of
ca. 95%. For all scenarios, we present a decomposed analysis to illustrate the role of different cost
components for competitiveness and differences between ICE vehicles and BE- and FCHE-trucks.
For reasons of space, cost decompositions are only presented for light distribution trucks, but reference
is made to equivalent analyses for heavy distribution trucks and tractors for semitrailers. Today’s
retail pump price of hydrogen is 72 NOK/kg excl. VAT (~€ 7.35) [33] can potentially be halved with
self-production (operator interview) or moderate production scale increases [34].
3.4. Socio-Economic Costs of Phasing-in Zero-Emission Technologies
To complement the assessment of cost competitiveness, we carried out an assessment of the
socio-economic costs of phasing in alternative propulsion technologies, i.e., the sum of public and
private costs and benefits. For society as a whole, costs can be expected from the investment premium
of zero-emission vehicles, while benefits stem from savings on fuel/energy costs and general vehicle
maintenance compared to diesel vehicles. In addition, society can expect benefits through reduced
negative external effects (local emissions), for which cost factors are based on Rødseth et al. [35] and
adjustments in Thune-Larsen et al. [36].
In our TCO analysis, road toll and fuel levy exemptions for zero-emission vehicles are treated as a
benefit for the private firm. Because these exemptions simultaneously entail revenue losses for the state,
they are considered neither as a cost or benefit, but as a socio-economic transfer. Following guidelines
from the Norwegian Ministry of Finance, we do, however, include a 20% ‘tax financing cost’ as a
socio-economic cost on this transfer.World Electric Vehicle Journal 2020, 11, 5 7 of 21
Finally, by relating the sum of social-economic costs to the reduction of CO2 -emissions when
replacing an ICE vehicle by a zero-emission truck, we arrived at socio-economic costs per reduced
tonne in CO2 emissions for the different maturity scenarios.
4. Results
4.1. User Experiences
4.1.1. The Trials
A technical summary of the characteristics of early Norwegian trials with e-trucks, and whose
operators formed the core of the interviews, is shown in Table 2. Trials were operated in the South East
of Norway, and were implemented in food distribution, household and business refuse collection and
recycling service segments. The e-trucks operated vary in power and total weight, and were mostly
registered in 2018. All trucks operated five days a week and with expected annual mileages ranging
from 18,000 to 120,000 km, divided into about 250 business days per year, and one to three working
shifts per day.
Table 2. Electric heavy-duty vehicle trials beginning 2017/2018 in Norway, upon which interviews
were based. Source: Autosys [17] and interviews with the operators. a At the time of the interview,
the operator only had experience from a test-vehicle. b Average fleet value. c Actual km/y driven
at time of interview. d For a similar (existing) ICE fleet. e LIB = Lithium ion. f NaNiCl2 = Sodium
nickel chloride.
Variable: A B C Da E F G
Waste Waste
Sector Distri-bution Recycling Manufacturing Waste collection Waste collection
collection collection
Vehicle type Truck (freight) Truck (waste) Truck (waste) Tractor (recycling) Heavy van Truck (waste) Truck (waste)
Dennis
MAN/ DAF/Emoss/ DAF/Emoss/
Manufacturer MAN/Emoss Eagle/PVI MAN/Emoss/Allison Iveco
Emoss/Allison Geesinknorba Geesinknorba
(Renault)
Expected annual
driving distance 50,000 b 18,000 c 80,000 d 120–130,000 30,000 20–26,000 d 16,800 d
(km/y)
Range, full charge
180 140 200 178 160 120–130 100–140
(km)
Number of vehicles
1 2 1 (+1) 2 5 1 1
tested
Registration year 2016 2018 2018 (19) 2018 2018 2018 2018
Total weight (t) 18.6 26.8 28.0 (50.0) 40.0–45.0 5.6 12.0 12.0
Payload (t) 5.5 9.7 18–19 15–20 2.6 3.5 3.5
Length (m) 9.0 9.5 7.8 7.4 7.2 7.0 7.0
Battery technology LIB e LIB LIB LIB Na-NiCl2 f LIB LIB
Battery capacity
240 240 200 (300) 300 80 120 130
(kWh)
Depot charging
2 × 44 44 44 44 22 22 44
(kW)
Opportunity.
150 2 × 150
charging (kW)
Charge time (h) to
5 8 4.5 (to 100%) 4–6 (slow)/0.3 (fast) 8 2–8 3.5
80%
In addition to the vehicles in the table, two operators using BE-light commercial vehicles were
interviewed for comparison. These companies currently do not have regular operations of heavy-duty
e-trucks, but one of them had tested a heavy BE- van for 14 days.
4.1.2. Procurement Process
In the procurement process of the BE-pilot trucks, one important incentive was financial support
from the authorities through a Norwegian Environment Agency municipality support program
(‘Klimasats’), or more commonly, the ENOVA scheme. ENOVA is a government instrument financed
by an energy fund and can provide support for 40–50% of the additional costs of zero-emission
trucks, in addition to the full costs of a charging station, depending on the size of the applicant firm.
Another incentive for electric vehicles are specific requests in public tenders, but it was emphasizedIn the procurement process of the BE-pilot trucks, one important incentive was financial support
from the authorities through a Norwegian Environment Agency municipality support program
(‘Klimasats’), or more commonly, the ENOVA scheme. ENOVA is a government instrument financed
by an energy fund and can provide support for 40–50% of the additional costs of zero-emission trucks,
World
in Electric Vehicle
addition to theJournal 11,a5 charging station, depending on the size of the applicant firm. Another
2020, of
full costs 8 of 21
incentive for electric vehicles are specific requests in public tenders, but it was emphasized that
environmental characteristics must be weighted more than price if a bid in public tenders with e-
that environmental characteristics must be weighted more than price if a bid in public tenders with
trucks should be competitive. Long and sometimes uncertain vehicle delivery time, relative to the
e-trucks should be competitive. Long and sometimes uncertain vehicle delivery time, relative to the
often limited time between tender results and start of contracts, was identified as a potential risk by
often limited time between tender results and start of contracts, was identified as a potential risk
operators. In addition, although it was not difficult for the operators to find potential suppliers, a
by operators. In addition, although it was not difficult for the operators to find potential suppliers,
challenge for the first operator was that the supplier did not have agents in the Norwegian market.
a challenge for the first operator was that the supplier did not have agents in the Norwegian market.
This situation contrasts with the electric LDV operators interviewed who commented that they have
This situation contrasts with the electric LDV operators interviewed who commented that they have a
a framework agreement with all major vehicle suppliers.
framework agreement with all major vehicle suppliers.
4.1.3.
4.1.3. Battery/Charger
Battery/Charger Technology
Technology
Battery
Battery choices
choices forforthe
thetrucks
truckswere
werebased
basedononrequirements
requirements setset
by by
thethe
operating purpose
operating of the
purpose of
vehicles. For the larger trucks in the pilots, battery capacities chosen ranged between
the vehicles. For the larger trucks in the pilots, battery capacities chosen ranged between 200 and 200 and 300
kWh, withwith
300 kWh, a corresponding
a correspondingrange (on full
range charge)
(on full of between
charge) 140 140
of between andand200 200
km.km.
ThisThis
contrasted to the
contrasted to
LDV operators interviewed, where the battery size was smaller (56 kWh).
the LDV operators interviewed, where the battery size was smaller (56 kWh). Lithium-ion batteryLithium-ion battery
technology
technology waswasmostly
mostlychosen,
chosen, while
while the the
heavyheavy
vansvans
from from Ivecosodium
Iveco have have sodium nickel chloride
nickel chloride batteries
batteries of 80 kWh
of 80 kWh installed. installed.
Regarding
Regarding charging
charging technology
technology and and solutions,
solutions, most
most operators
operators charged
charged trucks
trucks overnight
overnight and
and
during lunch breaks at the depot, due to challenges with establishing fast chargers.
during lunch breaks at the depot, due to challenges with establishing fast chargers. Similarly, the LDVSimilarly, the
LDV operators interviewed utilized overnight depot charging. A summary of the
operators interviewed utilized overnight depot charging. A summary of the selected battery capacity selected battery
capacity
(including(including
for vans),for vans), associated
associated range on range on fulland
full charge, charge, andsolution
charger chargerchosen
solutionby chosen by the
the operators,
operators,
is shown inisFigure
shown1.in Figure 1.
Figure 1.
Figure Summary of
1. Summary of the
the battery
battery capacity
capacity (kWh)
(kWh) and
and charging
charging solution
solution (AC
(AC or
or DC,
DC, kW)
kW) used
used by
by the
the
operators. The range on full charge is also shown (in red).
operators. The range on full charge is also shown (in red).
4.1.4. Experience from Operation
4.1.4. Experience from Operation
Operator feedback related to different aspects of trial operation is outlined below. Due to the
Operator feedback related to different aspects of trial operation is outlined below. Due to the
limited number of operators who currently have e-truck experience in Norway and thus, could be
limited number of operators who currently have e-truck experience in Norway and thus, could be
interviewed, feedback is deliberately described only in general terms and not analyzed further.
interviewed, feedback is deliberately described only in general terms and not analyzed further.
Design
4.1.4.1. Design
Although the design of the e-trucks did not convey major issues, some user comments were made
about a lack of the
Although design
focus of the e-trucks
on reducing did not
the specific convey
vehicle major
weight issues,
of the sometouser
chassis, comments
better were
accommodate
made about a lack of focus on reducing the specific vehicle weight of the chassis, to
the associated weight increases due to battery, cooling aggregate, and insulation. Other comments better
encompassed the limited availability of different vehicle size alternatives. In general, much of the
design knowledge for e-trucks has been transferred from buses, with the most important difference
being battery dimensioning due to different possibilities for opportunity charging. This means that
the trucks must carry more energy on board (ideally to cover one shift, or about 200 km per day forWorld Electric Vehicle Journal 2020, 11, 5 9 of 21
distribution). A failure in, e.g., overnight charging, thus becomes critical for truck operations the next
day because of the (often) long charging time.
Owners/Drivers
Despite initial reservations, both managers and drivers were generally pleased with the e-trucks.
Several operators commented that the trucks contribute to a good working environment, and when
working properly, are pleasant and fun to drive. The main challenge, according to operators was
trusting a new technology and overcoming range anxiety. Other specific issues included changes in
driving license requirements (for the heavy vans, due to increased total weight and changes in vehicle
classification), which limited the ability to recruit drivers to those holding such licenses.
In general, the pilottrucks were reported to produce less noise and vibrations than regular ICE
vehicles, although in some cases, mechanical noise became more noticeable. Reduced noise/vibrations
were received positively by owners/drivers, both in terms of a positive impact on the work environment,
but also because operators recognized a potential for operation during night times in densely populated
areas where noise restrictions preclude ICE operation.
Nearly all operators interviewed said that the e-trucks give a positive environmental profile to
their enterprise. Several operators reported high public interest for both customers and media, and that
their client also felt a sense of pride.
Energy Use
According to operators, the energy use of the e-trucks under real-life conditions proved significantly
lower than for ICE vehicles per km (~1–1.5 kWh/km vs. ~3–8 kWh/km with ICE). Operators also
noted that energy used for waste compressors, heating and cooling, if derived directly from the
battery, reduces the driving range for the vehicle. In some cases, this was solved by using an external
HVO-based generator. Issues were also reported due to the lack of soft start functions of cooling units.
Range/Route
Despite the fact that most e-truck trials were intended to directly replace routes of ICE vehicles,
in practice, this has not always been the case. Some vehicles have been put in operation in central areas,
where topographical differences and range requirements are relatively low and where they are most
useful due to low noise and reduction of local emissions. Other operators optimized routes for charging
during pick-ups/deliveries or breaks. However, it was noted that where a fleet has varying daily
driving requirements, the e-trucks are particularly vulnerable to unexpected transport assignments in
the afternoon.
A number of operators further reported that driving ranges did not live up to their expectations,
both in terms of manufacturer/supplier specifications and display readings in the vehicle. This variation
has meant that in some cases, ranges used for planning have had to be significantly adjusted downwards,
and in general, very conservative values for route planning are used. Such issues were also reported
for LDVs, assumed to be due to the number of stops en route coupled with a relatively low driving
speed, cargo loadings, and variable route topography. Range differences between summer/winter have
so far not been apparent, but there has been little experience with operation during cold days as of yet.
Vehicle Performance
Experience with the technical/general performance of the trucks has been mixed. One truck
operator reported major technical issues and extensive vehicle downtime. For LDVs and the refuse
collection trucks, operators were generally happy with technical performance, and most of the issues
reported were relatively minor and attributed to the conversion from diesel to electric powertrains,
and teething problems. Noteworthy general performance comments included mixed experiences with
braking capacity, vehicle traction and engine power. For some (but not all) operators, adjustments
fixed these issues.World Electric Vehicle Journal 2020, 11, 5 10 of 21
Most operators reported reduced freight capacity for the e-trucks compared to the equivalent ICE
vehicles, which, in some cases, was considered by the operator to be a major issue affecting operation.
Reasons for the reduced capacity are the significant battery weight and, in some cases, battery position
in the vehicle.
Charging
The availability and possibility of charging along the routes were found to be highly restrictive
factors by operators. In addition, various technical issues were also reported relating to charging
problems and/or lack of experience. Examples include difficulties with problem diagnostics, charging
restrictions specified by the manufacturer during a ‘run-in’ period before putting the vehicle in
operation, and some issues related to the cold Norwegian winter climate. A number of other more
minor technical issues were mostly resolved quickly.
For BE-LDVs, the operators interviewed mentioned challenging power peaks when charging
many vehicles simultaneously. Challenges also occurred relating to the availability of grid power
when building new terminals, and incentives for the development of charging infrastructure at rented
locations. Some operators called for a form of central coordination for smarter charging for the business
sector, and load distribution/capacity utilization.
Ownership Costs
The interviews provided information on different cost components, such as for the chassis, energy,
maintenance, chargers, and operation. For reasons of confidentiality, these are not explicitly discussed
here, but were an important input for modelling total cost of ownership for different propulsion
systems. In general, however, the interviews suggested that at current cost levels, BE-vehicles had
purchase costs of between ~1.5 and 4 times the cost of corresponding ICE-vehicles, depending on
vehicle classes. Operators agree that BE-vehicles have significantly lower costs of operation than ICE
vehicles. This is particularly due to savings on energy costs and road toll charges; maintenance costs,
too, are reported to be lower than for ICE vehicles. However, the largest maintenance costs usually
occur after 4 to 5 years. Battery changes were not expected to be required during the effective vehicle
lifetime, but it is known that these may be expensive. Overall, due to, e.g., the high purchase costs,
many operators expect that the e-trucks will be more expensive over their lifetime than a corresponding
ICE truck.
4.2. Electrification Potential Given Typical Vehicle User Patterns
4.2.1. Potential for Electrification in the Near Term
The main barriers for the adoption of BE-HDVs in the near term stem from driving range
limitations of battery-electric (pilot) vehicles, limited engine power, and, as a result, limitations to the
possibility to drive with a trailer. To assess the extent of these barriers, we looked at use patterns and
the composition of the Norwegian commercial vehicle fleet.
From an analysis of base data from Autosys and Statistics Norway’s survey of trucks, we found
that the majority of Norway’s commercial vehicle fleet (ca. 75%) consists of trucks of up to five years
old, of which most have engines ≥500 HP and are driven with a trailer. In light of limitations in terms
of power and availability of alternatives to diesel, this suggests that near term electrification of this
segment of trucks is unlikely.
For trucks with enginesconsidered most suitable for electrification) constitute 16.6% of the total fleet, while those using
trailers equate to another 7.5%. For the latter, trailer use often encompasses lighter city trailers, i.e.,
leaving some potential for electrification.
In terms of mileage, we found that newer trucks constitute an even larger share (85%) than in
termsElectric
World of vehicle
Vehicle number. Further,
Journal 2020, 11, 5 over 70% of mileage with newer trucks is carried out with engines
11 of 21
≥500 HP, mostly with a trailer attached. This is noteworthy since it is largely the segment for newer
trucks where user requirements are set. These observations also confirm that based on current use
≥500 HP, mostly with a trailer attached. This is noteworthy since it is largely the segment for newer
patterns, electrification in the near term seems unlikely for a large part of the Norwegian commercial
trucks where user requirements are set. These observations also confirm that based on current use
vehicle fleet.
patterns, electrification in the near term seems unlikely for a large part of the Norwegian commercial
Regarding segments where near-term electrification is most likely, and taking into account also
vehicle fleet.
variations in daily use, we found that trucks with engine powerWorld Electric Vehicle Journal 2020, 11, 5 12 of 21
refuse collection trucks. For the other vehicle categories, maximum daily driving distances exceed
what can currently be supported by battery-electric alternatives.
4.2.2. Potential for Electrification in a Longer Term
In a longer term, firms owning multiple trucks might have some flexibility to redistribute transport
routes between vehicles, e.g., by assigning BE-trucks more to shorter-distance transport of volume
goods. This flexibility is not easy to quantify because the transport industry is very fragmented and
further consists of both hire-transporters (with many small firms) and own-transporters. Although we
do not have data on the share of firms carrying out own transport, in our sample, own-transport
constitutes 27% of trucks but only 18% of mileage. This suggests that on average, own-transport
is carried out with smaller vehicles driving shorter mileages than hire-transport, implying that
own-transport is more suitable for electrification. Own-transport vehicles are also more likely to be
operated from only one terminal and can thus more easily be charged overnight. The fact that vehicles
used for own-transport are, on average, older, however, works in the opposite direction.
Even with route redistribution and more abundant charging opportunities in the longer term,
several challenges for the electrification of trucks remain, in particular relating to engine power, driving
ranges, the trade-off between battery weight and payload, and limitations to the use of trailers.
Most driving is carried out by trucks having an engine power between 500 and 600 HP (53% of trips,
54% of vehicle-km and 66% of tonne-km), while driving with larger engines makes up relatively small
shares. This suggests that if the majority of transport assignments are to be carried out with e-trucks in
Norway, e-trucks with and engine power of up to 600 HP would be have to be available in the market.
With regard to driving ranges, Table 3 illustrates the distribution of daily mileages for newer
trucks, for different engine powers.
Table 3. Distribution of daily mileages for trucks ≤5 years old, for different engine powers. Shares in
total vehicle mileage. Source: Base data of Statistics Norway’s ‘survey of trucks’ for 2016 and 2017 and
Autosys registry. Color-coding indicating good and reasonable potential for electrification with current
technology (green shades), reasonable potential, some potential with extensive charging opportunities
(blue), some potential when higher engine powers become available for battery-electric trucks (yellow),
and less feasible in shorter term (red).
Engine Power Up to 500 km
100–200 km 200–300 km 300–400 km 400–500 km Total
(HP) 100 km and Over
100–199 0.1% 0.1% 0.0% 0.0% 0.0% 0.0% 0.2%
200–299 2.5% 2.2% 1.1% 0.6% 0.2% 0.2% 6.8%
300–399 2.8% 2.8% 1.1% 0.7% 0.2% 0.2% 7.7%
400–499 4.7% 4.4% 2.9% 1.0% 0.6% 2.2% 15.7%
500–599 12.4% 8.3% 6.6% 4.1% 5.3% 17.6% 54.2%
600–699 2.1% 1.1% 0.9% 0.6% 0.8% 2.7% 8.2%
700+ 2.0% 0.9% 0.7% 0.5% 0.7% 2.4% 7.3%
Total 26.6% 19.8% 13.2% 7.5% 7.6% 25.3% 100.0%
The table shows that more than a quarter of all driving with trucks in Norway is carried out by
vehicles with daily mileages of up to 100 km, a fifth by vehicles with daily mileages between 100 and
200 km, and around 13% by vehicles with daily mileages between 200 and 300 km. Although a sizable
share of driving is done with (much) higher daily mileages, this suggests that if batteries of e-trucks
could support a vehicle range of 300 km (alongside engine powers up to 600 HP), this could give a
potential for electrification for a large share of transport.
With regard to the weight of batteries, we looked at mileages driven with and without trailer for
trucks ≤5 years old. Here, we found that for almost 79% of mileage with cargo, it is volume and not
weight that fills up capacity and constitutes the capacity dimensioning factor. This suggests that the
extra weight of batteries might not be as critical as is sometimes assumed. Furthermore, a proposalWorld Electric Vehicle Journal 2020, 11, 5 13 of 21
adopted by the European Parliament in April 2019 opens up for a two-tonne additional total vehicle
weight allowance for zero-emission trucks [37,38]. This corresponds to the weight of about 200 kWh of
batteries, and possibly more in the future, as the energy density of lithium-ion battery cells has been
increasing by around 5–7%/year [39].
Next, we looked at the distribution of total mileage without trailer attached (as it is the vehicle,
not trailer, that is most crucial) by capacity utilization and vehicle’s maximum allowed total weight.
Here, we found that, respectively, three quarters and a fifth of total mileage is driven by vehicles with
maximum total weights between 10 and 20 tonnes and 20 and 30 tonnes. Driving with smaller vehicles
only constitutes a fraction of total mileage. More importantly, for over 80% of total mileage driven
with cargo, at least 20% of the vehicles’ weight capacity is unutilized. Particularly for vehicles with
payloads over 10 tonnes, which constitute most of mileage with cargo, this indicates that there would
often be sufficient ‘weight capacity’ to carry several tonnes of battery.
Finally, we looked at limitations on the use of trailers. Here, we found that 45% of trips are driven
without trailer attached, particularly by trucks with engines between 200 to 600 HP, and of those,
particularly with largest engines in this interval. In terms of mileage, rather than trips, the share of
driving without trailer is only 28%. This indicates that trips without trailer are on average considerably
shorter than trips where trailers are used.
There may be variations in how a vehicle is used over a year that may reduce the potentials
described above. The datasets used only cover 1 week of trucking. A truck that is not fully utilizing
the capacity during this week could potentially be doing it another week of the year. BE-trucks may
thus reduce the flexibility of some operators to take on different transport assignments over the year.
4.3. Cost Competitiveness of Electric vs. ICE Operation
In Section 3.3., we described the development of a model for comparing decomposed ownership
costs of different propulsion technologies. For readability, results from our comparisons are presented
in two tables. Table 4 shows decomposed ownership costs for light distribution trucks based on the
current early stage of technological maturity for BE- and FCHE-alternatives, while Table 5 presents a
similar decomposition for the scenarios with small-scale series production and mass production of
electric vehicles, including a reduction hydrogen fuel prices. For conciseness, several smaller cost
components were aggregated. Components that differ significantly between technologies or that
might be used to create policy incentives, however, are presented separately. Wage costs are shown to
illustrate their magnitude compared to other cost drivers.
Table 4 illustrates that in today’s early stage, ownership costs for light distribution vehicles with
electric propulsion are considerably higher than for ICE-based propulsion systems. Compared to
diesel vehicles (0.95 EUR/km), ownership costs for BE-vehicles (1.48 EUR/km) and FCHE-trucks
(2.23 EUR/km) are, for example, 57% and 136% higher, respectively. Although not shown in further
detail here, our calculations show that these figures are 55%/128% for heavy distribution trucks
and 92%/161% for tractors for semitrailers. Compared to light distribution trucks, differences stem
primarily from differences in investment cost premiums and fuel/energy consumption. It can further
be seen that at 0.93 EUR/km, wage costs are of a similar order of magnitude as vehicle-ownership
costs for light distribution vehicles with ICE. Our estimates on operational costs for both battery- and
hydrogen-electric trucks fall within the ranges identified in a review of different studies by Plötz et
al. [9].
Table 5, in turn, shows that small-scale series production considerably reduces ownership costs for
electric trucks. For FCHE light distribution trucks, per-km costs fall to 1.54 EUR (at current hydrogen
prices), or 1.41 EUR if prices of hydrogen were to fall by half (driven by higher demand and larger-scale
production). Even at these prices, however, ownership costs for FCHE vehicles remain considerably
higher compared to ICE-trucks. For BE-trucks, in turn, ownership costs under small-scale series
production, at 0.98 EUR/km, approach those of diesel trucks at typical mileages.World Electric Vehicle Journal 2020, 11, 5 14 of 21
Table 4. Decomposed ownership costs for light distribution trucks. Base scenario/early stage. Figures in
EUR/km. Costs are based on a period of analysis of 5 years and annual mileages of 45,000 km.
Cost Component Diesel Biodiesel Biogas FCHE BE
Base investment 0.35 0.35 0.35 0.35 0.35
Investment premium - 0.00 0.10 1.46 0.90
Wage costs (incl. social/holiday) 0.93 0.93 0.93 0.93 0.93
General levies 0.00 0.00 0.00 0.00 0.00
Insurance + admin 0.05 0.05 0.05 0.05 0.05
Fuel/energy, excl. Levies 0.14 0.28 0.25 0.25 0.05
CO2 -levy 0.03 - - - -
Road use levy 0.09 - - - -
Premium in case of fast charging - - - - 0.02
Tyres, wash, consumables, etc. 0.08 0.08 0.08 0.08 0.08
General maintenance 0.07 0.07 0.07 0.03 0.03
Road toll 0.14 0.14 0.14 - -
Total incl. wage costs 1.88 1.91 1.96 3.16 2.41
Total excl. wage costs 0.95 0.97 1.03 2.23 1.48
Index incl. wage costs 100% 101% 104% 168% 128%
Index excl. wage costs 100% 103% 109% 236% 157%
Table 5. Decomposed ownership costs for light distribution trucks. For small-scale series production
with current and reduced hydrogen (fuel) prices, and for mass production. Figures in EUR/km.
Costs are based on a period of analysis of 5 years and annual mileages of 45,000 km.
Small-Scale Series Production Mass Production
Cost Component FCHE (Lower FCHE (Lower
Diesel FCHE BE BE
Fuel Price) Fuel Price)
Base investment 0.35 0.35 0.35 0.35 0.35 0.35
Investment premium - 0.77 0.77 0.40 0.35 0.17
Wage costs (incl. social/holiday) 0.93 0.93 0.93 0.93 0.93 0.93
General levies 0.00 0.00 0.00 0.00 0.00 0.00
Insurance + admin 0.05 0.05 0.05 0.05 0.05 0.05
Fuel/energy, excl. Levies 0.14 0.25 0.13 0.05 0.13 0.05
CO2 -levy 0.03 - - - - -
Road use levy 0.09 - - - - -
Premium in case of fast charging - - - 0.02 - 0.02
Tyres, wash, consumables, etc. 0.08 0.08 0.08 0.08 0.08 0.08
General maintenance 0.07 0.03 0.03 0.03 0.03 0.03
Road toll 0.14 - - - - -
Total incl. wage costs 1.88 2.47 2.34 1.91 1.92 1.69
Total excl. wage costs 0.95 1.54 1.41 0.98 0.99 0.76
Index incl. wage costs 100% 131% 125% 102% 102% 90%
Index excl. wage costs 100% 163% 149% 104% 105% 80%
For the scenario with mass production, we found that ownership costs for battery-electric vehicles
fall below those of ICE-vehicles. At this point, FCHE-trucks are still more expensive at annual mileages
of 45,000 km, but may nevertheless have potential in specific use cases, e.g., within long-haul transport,
where BE-operation yields more limitations.
When focusing on individual cost components, we see that capital costs, albeit decreasing with
technological maturity stage, remain the main cost driver for electric trucks in the foreseeable future.
Administration and insurance costs and general levies such as Norway’s annual weight fee, are only
minor costs drivers. Even though the weight fee has an environmental component, this component
plays such a small role that its effects are marginal at most. Costs for washing, consumables, and tyres,
too, are only moderate cost drivers, and not expected to differ between technologies. Costs for generalWorld Electric Vehicle Journal 2020, 11, 5 15 of 21
maintenance, in turn, are expected to be lower for electric vehicles than for ICE, but savings make up a
minor share of TCO.
Looking at energy-related expenses, however, we found considerable differences. For diesel
vehicles, in addition to fuel costs, operators pay a CO2 -levy and road use levy (together equaling
~0.26 EUR/km), while energy costs for biodiesel and biogas vehicles are of a similar order. On top of this
come road toll charges of around 0.14 EUR/km. Energy costs for BE-vehicles, in turn, are much lower,
at under 0.05 EUR/km (or around 0.07 EUR/km with only fast charging). For FCHE-vehicles, energy
costs at current prices are still relatively high, but could fall towards 0.13 EUR/km. These results show
that savings on operation costs for electric vehicles increase with annual mileage, particularly due to
lower energy costs per km, but also due to toll savings and to a lesser extent, savings on maintenance.
Just as distance-dependent costs decrease with increasing annual mileages, capital costs (derived
from the investment base and premium cost) will also decrease with annual driving distances.
To illustrate this, Table 6 summarizes at what annual mileages BE- and FCHE-trucks may become
cost-competitive with corresponding ICE-trucks. Results are presented for light distribution trucks,
heavy distribution trucks, and tractors for semitrailer.
Table 6. Annual mileages (km) at which battery-electric vehicles (utilizing fast charging) are calculated
to achieve cost-parity with other technologies. Rounded to the nearest thousand km.
Early Market Small-Scale Series
Vehicle Size Fuel Technology Mass Production
Phase Production
Diesel 52,000 km 21,000 km
Unrealistically high
Light Distribution Biodiesel 47,000 km 19,000 km
mileages
Trucks Biogas 37,000 km 11,000 km
FCHE Battery-electric always cheaper
Diesel 144,000 km 58,000 km 23,000 km
Heavy Distribution Biodiesel 129,000 km 52,000 km 22,000 km
Trucks Biogas 131,000 km 40,000 km 11,000 km
FCHE Battery-electric always cheaper
Diesel 43,000 km 19,000 km
Unrealistically high
Tractors for Biodiesel 39,000 km 17,000 km
mileages
Semitrailers Biogas 35,000 km 10,000 km
FCHE Battery-electric always cheaper
The table shows that in the current early market phase, e-trucks cannot compete with the costs of
ICE-based vehicles, except for when mileages would be unrealistically high in light of limitations to
the driving range set by current battery technology.
In the scenario assuming small-scale series production, our calculations show that BE-vehicles
become cost competitive compared to diesel vehicles at mileages between 43,000 and 58,000 km.
The reason for BE-light distribution trucks reaching cost-parity versus diesel at lower mileages than
heavy distribution trucks is that the cost premium of investment is relatively high compared to
savings on energy costs. Again, it is important to remember that estimates on cost premium and fuel
consumption are uncertain, and that fuel consumption is affected by load weight and topography.
Data on vehicle usage, e.g., from Statistics Norway’s Survey of Trucks, indicate that such annual
mileages are not unusual for newer diesel-based trucks. Provided that limitations to range, payload
etc., are reduced, e-trucks may thus become a feasible alternative.
Finally, in the scenario assuming mass production, we found that BE-vehicles become
cost-competitive compared to diesel operation starting from annual mileages between 19,000 and
23,000 km, and at even lower mileages compared to biodiesel and biogas vehicles. These findings
indicate that even when advantages such as toll exemptions would be reduced, BE-vehicles may prove
cost-competitive alternatives.You can also read