Economic Development and the Spatial Allocation of Labor: Evidence From Indonesia
←
→
Page content transcription
If your browser does not render page correctly, please read the page content below
Economic Development and the Spatial Allocation
      of Labor: Evidence From Indonesia ∗
                    Gharad Bryan †                         Melanie Morten ‡
               London School of Economics             Stanford University and NBER

                                         February 20, 2015
                        Preliminary - please contact us for most recent version

                                              Abstract
      Nominal wages differ widely across space. Do these differences imply large produc-
      tivity benefits to moving people across space, or are the differences driven by selec-
      tion or amenity differences? To answer this question, we construct a general spatial
      equilibrium framework. Our framework allows us to decompose observed wage dif-
      ferences into four components: i) selection due to comparative advantage, ii) wedges
      due to migration costs, iii) endogenous amenity differences, and iv) endogenous ag-
      glomeration benefits. We show how migration costs can lead to lower aggregate pro-
      ductivity by hindering the movement of labor to where it is most productive. We then
      estimate the model using detailed micro data for Indonesia and the United States.
      Two counterfactuals illustrate the quantitative implications of migration costs on ag-
      gregate productivity. First, we estimate that between 1976 and 2012 migration costs
      declined by 35% in Indonesia; the improved allocation of labor to where it is most
      productive explains approximately 20% of Indonesia’s GDP growth over this period.
      Second, we estimate that migration costs in the United States are 60% smaller than in
      Indonesia; higher costs of labor movement in Indonesia explain 4% of the GDP per-
      capita gap between the United States and Indonesia.

      Keywords: Selection, Internal migration, Indonesia
      JEL Classification: J61, O18, O53, R12, R23

  ∗ We   thank Dave Donaldson, Pete Klenow, Torsten Perrson, and seminar audiences at the Stanford In-
stitute for Theoretical Economics, Paris School of Economics, Namur, Helsinki, and the CEPR/PODER
conference for helpful comments and suggestions. Allan Hsiao provided outstanding research assistance.
Any errors are our own.
    † Email: g.t.bryan@lse.ac.uk
    ‡ Email: memorten@stanford.edu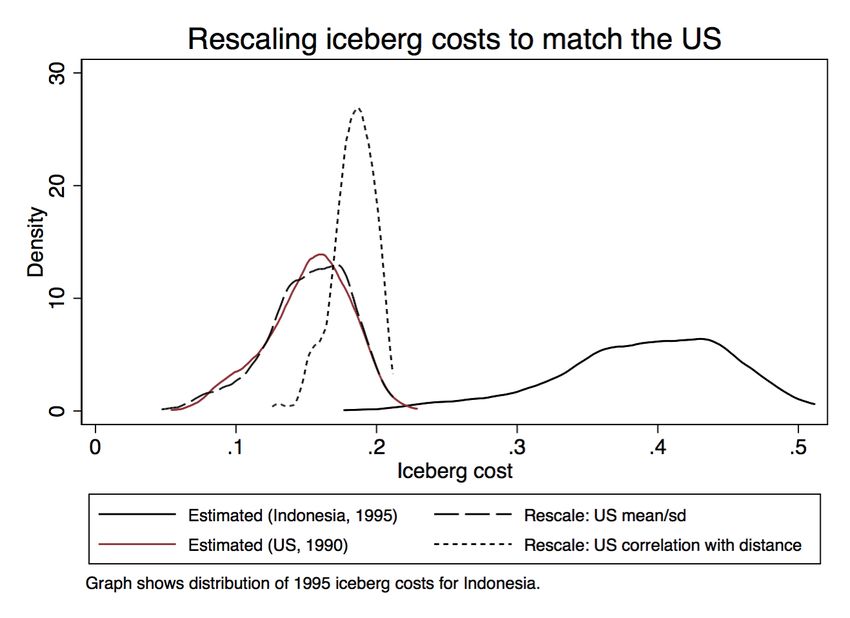
1        Introduction

Within country, nominal wages differ widely across space (Moretti 2011).1 How to inter-
pret these gaps is hotly debated, on one hand it has been argued that spatial wage gaps
represent an unexploited opportunity to increase productivity and encourage relative de-
velopment (e.g. Restuccia et al. 2008) on the other, the gaps may imply no such free lunch,
simply reflecting rational selection of heterogeneous workers (Young, 2013). Determining
which of these explanations is correct – or more importantly quantifying their relative im-
portance – has clear policy implications: should governments focus on improving ways
for people to move to highly productive areas, for example by constructing highways al-
lowing easier migration, or should they instead allocate scare resources on policies that
increase development in low productive areas, such as rural development schemes?
        In this paper we provide a framework to ask whether productivity could be increased
by moving people across space, and if there are such gains, then what causes people to
not move. To do so, we build a model with four key features: i) workers draw location-
specific productivity levels and select where they live and work to maximize utility, ii)
there are costs of migrating, iv) locations offer different (partially endogenously deter-
mined) levels of amenity and, v) locations offer different (partially endogenously deter-
mined) levels of productivity. We show how migration costs can contribute to aggregate
productivity losses by hindering the migration of labor to where it is most productive. We
then estimate the model of labor sorting across space using census data from Indonesia
and the United States. Two counterfactuals illustrate the quantitative effects. First, we
estimate that between 1976 and 2012 migration costs declined by 35% in Indonesia; the
improved allocation of labor to where it is most productive explains approximately 20%
of Indonesia’s GDP growth over this period. Second, we estimate that migration costs in
the United States are 60% smaller than in Indonesia; higher costs of labor movement in
Indonesia explain 4% of the GDP per-capita gap between the United States and Indonesia.
        Our choice to construct a model with a role for both migration costs and unobserved
migrant section is motivated by four, relatively novel, empirical facts that link together
    1
    The data also suggests large differences in real wages, although this is harder to measure. See, for
example, Kanbur and Rapoport (2005).

                                                   1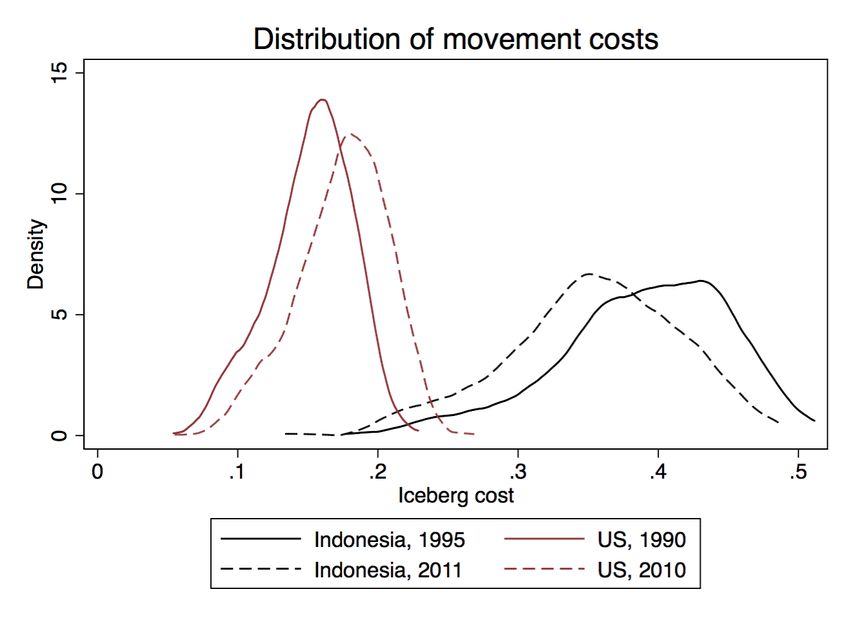
migration, distance and wages. Together, these four facts are consistent with the presence
of both selection as well as barriers to mobility:

  1. Gravity: We show that a gravity relationship holds for migration in Indonesia. That
     is, controlling for origin and destination fixed effects, the log of the proportion of
     migrants from origin g who migrate to destination i is decreasing in the log of the
     distance between i and g.

  2. The further a migrant travels to a destination, the higher their wage: Controlling for a
     destination labor market fixed effect, the log of an individual’s wage is increasing in
     the log of the distance migrated. We see this second fact as consistent with selection
     – the higher the cost of movement, the higher is the compensation required to make
     the move.

  3. The more people from an origin travel to a destination, the lower their wage: Controlling for
     a destination fixed effect, the log of the wage is decreasing in the log of the portion
     of people from origin g that move to destination i. We again take this as consistent
     with selection: in our model higher migration costs from g to i will decrease the
     proportion of people born in g that move to i and these people will tend to have
     higher i specific skill levels.

  4. The distance effect appears to work through the extensive margin of how many people mi-
     grate: Finally, we show that when the proportion of people moving from g to i and
     the distance from g to i are both included in a regression with the log of the wage on
     the left hand side, the importance of distance decreases, while the coefficient on the
     proportion of people moving remains unchanged. We see this as strongly consis-
     tent with a model of selection driven by migration costs: higher costs of movement
     (proxied by physical distance) induce a smaller portion of people to move from g to
     i and these people are more highly selected. Because the cost of movement should
     not directly affect the wage rate, except through selection, it is the proportion of
     people moving that should predict the wage, and not the distance moved.

   The reduced form facts provide evidence consistent with the presence of both selection

                                               2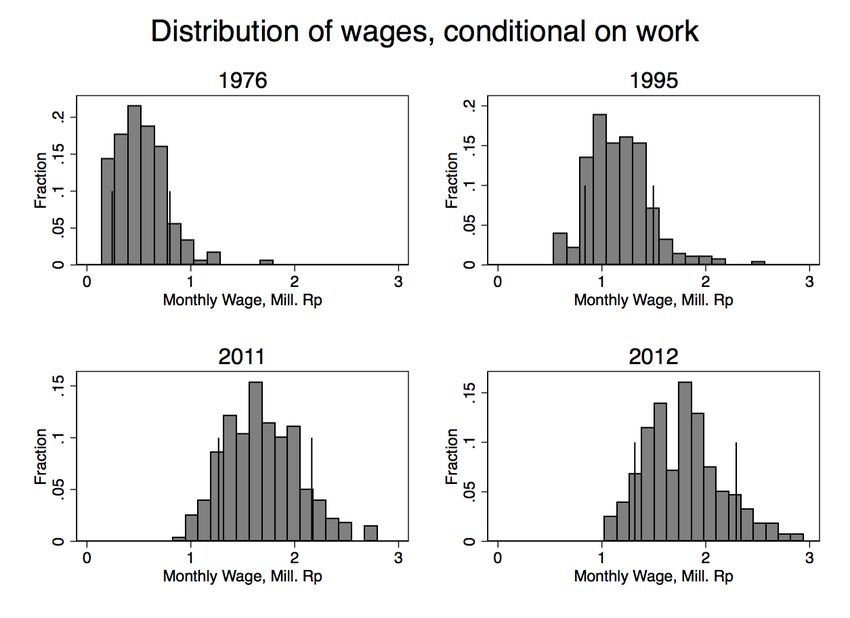
and migration costs, but the magnitude of such effects is not easily interpreted. Neither,
can we provide counterfactual analysis of productivity differences of reducing such costs.
Therefore, in order to quantity the contribution of selection to productivity we construct a
framework with endogenous sorting of labor across space. The model we estimate allows
locations to differ in three ways: first, locations may differ in their inherent productivity
(for example, New York is a port while Atlanta is not); second, locations may differ in the
natural amenity that they offer (for example, Sydney sits on a beautiful natural harbour,
while Melbourne does not); and third, some places may be more costly to move between
(for example, moving between Shanghai and Beijing is probably easy due to the cultural
similarities of the people and the fast train. Moving between Lhasa and Beijing is proba-
bly harder due to both the cultural and physical distance). We then show that all four of
the reduced form facts highlighted above are easily derived from our model.                     2

    Amenity and productivity determine how attractive a location is to live, and move-
ment costs determine how costly it is for a worker to move away from their place of birth
and hence the gain they would need to make a move. We combine this structure with
a model of human capital: each worker is characterized by a productivity level for each
location, drawn from a multivariate Fréchet distribution. Given the costs and benefits
or moving, workers select where they will live and work and this selection process en-
dogenously determines the amount of human capital, and the total number of workers
in each location. Amenity and productivity are also allowed to adjust in response to the
movement of people due to congestion and agglomeration externalities.3 The average
wage of a location is determine by its endogenous productivity level and the amount of
human capital working their, and aggregate GDP per worker is determined by the extent
to which workers are able to move to high productivity locations, and the extent to which
worker movement allows the country to take advantage of agglomeration externalities.
We show how migration costs can cause workers to choose not to move to where they
    2 We have tried to make the list of ways in which locations differ all exogenous. Cultural differences are,

however, potentially endogenous. We discuss this possibility and how to interpret our model in the light
of this problem below.
    3 The model, therefore, distinguishes between inherent productivity and endogenous or current pro-

ductivity as well as between natural amenity and endogenous or current amenity. We use the convention
of always referring to the exogenous parameters as inherent or natural and the endogenous parameters
simply as amenity or productivity.

                                                      3
are most productive; reducing such costs can then improve the allocation of workers and
lead to an increase in productivity.4
We estimate the structural parameters of the model for each of four years for which we
have data – 1976, 1995, 2011 and 2012. . One advantage of our model is that closed forms
are easily computed and so identification is relatively transparent. Roughly, the extent
to which the portion of people from g that move to i reduces the wage at i recovers the
Fréchet parameter characterising the distribution of talent. Both amenities and productiv-
ities affect the migration rate, but in our model, productivity does not affect the wage of
migrants. This follows from a convenient, but perhaps specific, feature of our model: an
increase in productivity in destination i has two effects: first, it raises the wages of those
already live there, and second, it increases the influx of low skill migrants. In our model
these effects exactly offset meaning the wage level identifies amenities. Hence, wage dif-
ferences can be used to infer amenities, and with these measured, migration rates can be
used to infer differences in productivity. Finally, any “wedge” between average wages
for migrants and non-migrants that exists both for migrants from i to g and for migrants
from g to i is, combined with low migration rates between the two location, interpreted as
a migration cost. Our structural estimates give us, for each location in Indonesia: the level
of amenity relative to a benchmark, an absolute measure of productivity, the cost of mi-
gration between each pair of places and the total amount of human capital current living
in each location. These measures can be used to do simple decompositions of the spatial
wage gap, or combined with the full computational model to undertake counterfactual
exercises.
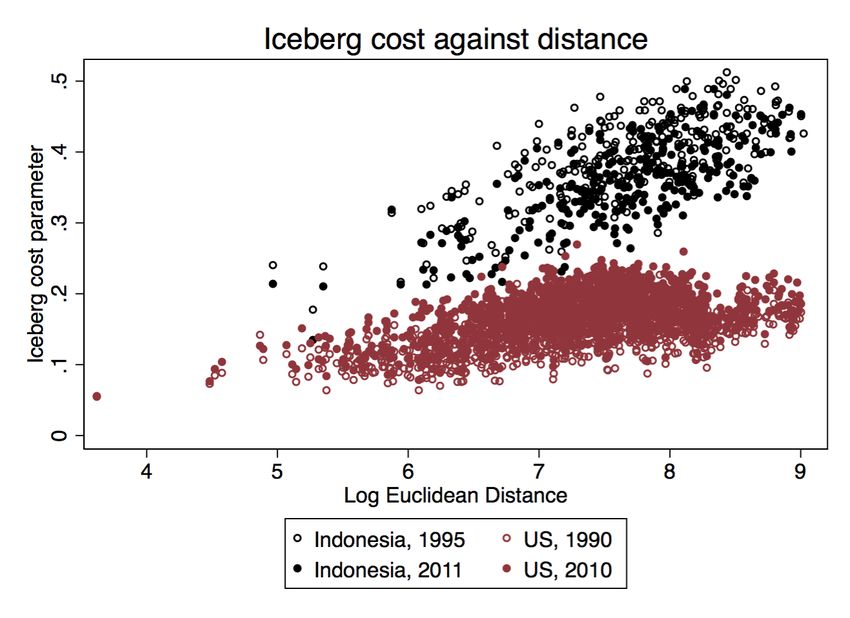
Before making use of our estimates we show that our measures correlate with other
measures available in the data. For example, our amenity measures are negatively cor-
related with measures of air, water, land and noise pollution. Our measures of migra-
tion cost are correlated with physical distance, both measured in straight line and using a
measure of least cost transport cost, as well as with measures of the cultural and language
4 Note, it is possible that reducing migration costs could lower productivity, if many very productive
places have low amenity and reducing movement costs will tend to allocate people to lower productivity,
higher amenity locations. In such a case, a policy of improving amenity in denser areas, or mitigating the
costs of congestion seems a more promising policy approach.
4differences between locations.
Our model can be used to undertake several counterfactual exercises. We consider
several exercises that help to understand the aggregate effects of policies that encourage
reallocation of workers across space. First, because we have four years of data we are
able to understand what portion of GDP growth in Indonesia is caused by greater spatial
integration of the labor market. We estimate that between 1976 and 2012 migration costs
declined by 35% in Indonesia. We re-solve the model using parameters for 1976 imposing
the migration costs from 2012 and find that the improved allocation of labor to where
it is most productive explains approximately 20% of Indonesia’s GDP growth over this
period. Second, we consider what the GDP of Indonesia would be if average migration
costs were the same as we find in the US. We find that migration costs in the United
States are 60% smaller than in Indonesia. We then rescale our estimated migration costs in
Indonesia to match the distribution of migration costs in the United States. This generates
an increase in GDP per capita of 50% in Indonesia, a gap that is equivalent to 4% of the
GDP per-capita gap between the United States and Indonesia.
Relative to the existing literature, we make three main contributions. First, we esti-
mate a model a spatial sorting that allows both selection as well as migration barriers.
A large literature debates the extent to which differences in nominal wages reflect differ-
ences in worker types, versus differences in absolute productivity across space. The dis-
tinction is conceptually important because if the wage distribution is entirely determined
by selection – as argued, for example, by Young (2013) – then there are not productivity
gains to be had by moving people across space – despite difference in average products,
marginal products are equalized across space. We do find a role for selection, consis-
tent with Young (2013) and Lagakos and Waugh (2013). However, we do not find that
selection fully explains the gap. Our research clarifies this line of research by showing
quantitatively that the answer lies somewhere in the middle – part of the productivity
gap is drive by selection, and part by movement costs which prevent arbitrage.
Second, the model that we propose incorporates migration costs. Most of the existing
literature on the spatial distribution of workers, notably that in the economic geography
5and urban economics traditions, assume that labor is freely mobile across space.5 How-
ever, the small literature that incorporates migration costs find them to be substantial. For
example, Kennan and Walker (2011) estimate that the fixed cost of migration for young
men in the US is equivalent to 40% of the average wage. Morten (2013) estimates that the
fixed costs of migration is equivalent to 30% of the mean consumption for rural Indian
migrants, and Morten and Oliveira (2014) find that building roads in Brazil increased mi-
gration between locations, consistent with roads reducing migration costs. Bryan et al.
(2014) show large returns to migration in North Western Bangladesh – a fact that is only
consistent with a (broadly defined) cost of migration – and also directly ask migrants how
much higher wage would be required to compensate for a temporary move. Over a quar-
ter of those asked this question stated that their earnings as a migrant would have to be
more than 150% of their earnings at home.
Third, we address the question of aggregate implications of worker heterogeneity.
Quantitative work on the productivity gains of movement has received much less atten-
tion, and that work that does exist again concentrates on developed countries (Hsieh and
Moretti, 2014) or quantifying the gains of liberalizing international migration (Clemens,
2011; Kennan, 2013). There is also a growing literature that examines the allocation of fac-
tors of production, both in developing and developed countries.This literature, which is
largely quantitate, argues that it is not just factor accumulation that is important in deter-
mining relative development, but how factors are allocated. For example, in their seminal
paper, Hsieh and Klenow (2009) document a large degree of misallocation of capital in In-
dian and Chinese firms relative to a US benchmark, and estimate productivity losses due
to this misallocation in the order of 50%. In a more recent contribution, from which we
draw much of our structure, Hsieh et al. (2013) estimate that 15-20% of factor productivity
in the US between 1960-2000 was due to a reduction in implicit discrimination faced in
the labor market for both blacks and women. With discrimination, group members were
stopped from pursuing their comparative advantage. Our paper shows that cost of mi-
gration may have aggregate implications. A key policy implication is reducing the costs
5 The spatial literature, building on Rosen and Small (1981) and Roback (1982) typically assumes that
migration is, in the long run, costless. The first paper we are aware of to relax this assumption is Topel
(1986).
6of migration, for example by expanding highway access allowing for easier migration
flows, would facilitate the movement to labor to where they are most productive.
And, finally, our paper addresses the issue of spatial equilibrium in a large developing
country. While the question of what causes spatial dispersion has received a great deal
of attention, most this work is in developed countries.6 There are reasons, however, to
think that answers may differ in developing and developed countries. A large literature
in development follows the tradition of Lewis and sees developing countries as having
dualistic labor markets. Part of the process of development is the movement of labor
from traditional to modern sectors. Usually this movement is thought to encompass the
physical movement of labor from rural to more urban areas. This sort of movement, and
any reduction in constraints on labor movement, is captured in our work. Recent work
suggests that any decomposition may differ across countries and depend on the state of
development. For example, Desmet and Rossi-Hansberg (2013) decompose the causes of
spatial diversion in the US and China. They find much greater welfare gains to decreasing
dispersion in China than the US. This potentially reflects the general view that US labor
markets are more tightly integrated than their developing country equivalents.
The remainder of the paper is structured as follows. Section 2 describes the data that
we use and our setting, it also documents the four motivational facts discussed above.
Section 3 outlines the model and we show how the structural parameters can be identified
in Section 4. In this section we also discuss how our model differs from other models of
selection and migration in the literature. Section 5 discusses the fit of the model to the
data and shows the correlation between our structural measures of amenity, productivity,
migration costs and human capital with other accepted measures. We also undertake
quantitive exercises to evaluate the aggregate implications of improving the allocation of
workers. Finally, Section 6 concludes and offers some suggestions for further research.
6 Of course, understanding the rural-urban wage gap has been one of the key questions in development
economics. Estimates of the rural/urban, or agricultural/manufacturing gap are staggering. For example,
Caselli (2005) estimates that differences in productivity between agriculture and manufacturing can explain
up to 40% of cross-country income differentials. More recently, after undertaking a thorough development
accounting exercise using higher quality micro data from household surveys, Gollin et al. (2014) find that
the productivity gap remains at least a factor of two.7
72 Data and Motivational Evidence
This section provides reduced form empirical evidence for the mechanisms in the model.
We estimate the model using micro-level Census and survey data from Indonesia. For
contrast, we replicate the specifications using the micro data from the US. This section
first describes the data, and then carries out reduced form implications from the data
that favors a model in which movement costs reduce the flow of migrants and lead to
selection.
2.1 Census and survey data
The model we outline below provides a micro-foundation for the idea that migration is
costly because it moves people away from their location of birth. While we micro found
this notion using the idea of travel costs required to spend time with family and friends,
it could also capture culture or psychological phenomena. For example, Atkin (2013)
argues that people form a habit of consuming the food available at low cost in their home
town, when they move they consume fewer calories because they continue to purchase
this same food at a higher price. Therefore, to estimate the model we need data that
reveals the location of birth, preferably at a reasonable level of geographic disaggregation,
as well as current earnings data. To understand the time path of migration costs and to
understand the development impact of spatial labor market integration we need data that
covers several time periods.
We construct a rich regional database with these characteristics using individual level
census and survey data from Indonesia. The Indonesia data come from the 1976 and 1995
SUPAS (Intercensal Population Survey) and from the 2011 and 2012 SUSENAS (National
Socioeconomic Survey). While the decennial SUPAS collects data on the place of birth, the
76 and 95 SUPAS are unique in containing earnings data. Both were combined with the
SAKERNAS or labor force survey, with the surveys were fielded at the same time. While
the SUSENAS regularly collects earnings data, the 2011 survey round was the first to col-
lect information on place of birth. All four surveys were sourced from the Indonesian
Ministry of Statistics, and all four have place of birth at the district or regency (kabupaten
8level. We believe that Indonesia is the only country to have earnings and place of birth
at a level smaller than the state available from one survey. For all surveys, we drop the
provinces of Papua and West Papua. We generate a set of regencies which have main-
tained constant geographical boundaries between 1975 and 2010. This primarily involves
merging together regencies that were divided in 2001. This leaves us with a sample of 304
regencies, where the average regency population surveyed in 2011 is 3700 people. Later,
for the structural estimates we aggregate regencies up to the level of province, of which
there are 25. We supplement this census data occasionally with data from the Indonesian
Family Life Survey (IFLS) from 2007. This data has a much smaller sample, but collects
more detailed information on incomes. This allows us to do some robustness checks.
We also construct a comparison dataset for the United States. However, the data are
not as rich: location of birth is only collected at the state level, and not a smaller geo-
graphical level. Nonetheless, we construct samples from the 1990 5% Census sample, and
the 2010 American Community Survey.
Summary stats for the Indonesian and the United States sample are given in Appendix
Tables 1 and 2. We define a migrant as someone who has moved from their region of birth
(either the regency in Indonesia, or the State in the United States). All wage variables are
reported in monthly terms. All financial variables are converted into 2010 values in the lo-
cal currency using a CPI deflator.8 Monthly wages in Indonesia in 1976 were 0.49 million
Rp, approximately $55USD, increasing to 1.81 million Rp in 2012 ($199 USD). Monthly
wages for those who choose to migrate are 25% higher on average than wages of those
who choose not to migrate; some of this is due to positive selection of migrants: the aver-
age migrant in 1976 has 5.3 years of school, compared with 3.3 years for the population;
in 2012 the average migrant has 9.9 years of school, compared with 8 for the population.
Migration rates are between 20-26% of the population.9 For the US, mean monthly wags
are $4,600 in 1990, increasing to $5,100 in 2010. The migration rate (defined as state-level
8 We present wages in month units. However, hours worked are available in both datasets; we have
re-estimated the models using hourly instead of monthly wages are results are robust.
9 In addition, there is considerable heterogeneity between people born in rural and urban locations (not
reported in table): out migration rates from rural areas is 17% in 1976, with approximately half migrating
to a rural destination and half migrating to an urban destination. For those born in an urban area, the
outmigration rate was 50%, with more than 2/3 migrating to another urban area and 1/3 migrating to a
rural area. The same patterns (considerable rural-rural and urban-urban migration) hold across all 4 years.
9moves) is approximately 40%, and migrants have slightly higher years of education and
earning approximately 10% higher than non-migrants.
2.2 Four facts linking migration, selection and costs
Our choice to construct a model with a role for both migration costs and unobserved
migrant section is motivated by four, relatively novel, empirical facts that link together
migration, distance and wages. We believe these facts fairly convincingly show that to
match the data one needs to build a model in which there are costs of moving, and in
which these costs lead to selection, with those paying higher costs requiring a greater
wage premium.
1. Gravity: Intuitively, a model in which costs of migration are important will imply
that, controlling for origin and destination fixed effects, fewer people will migrate
to areas that are more costly. While, as argued above, we wish to take a broad
view of the costs of migration, a simple proxy is distance migrated. We, therefore,
first document that a classic gravity relationship holds for Indonesian data.10 We
estimate
ln πig = αi + γ g + β ln dig + ig
where πig is the portion of people born in origin g who move to destination i, αi and
γ g are origin and destination fixed effects, dig is the euclidean distance between the
centre or regency i and regency g and ig is an error term. We estimate the equation
for the four years of SUPAS/SUSENAS data. The results for the main sample are in
Table 2, and in Appendix Table 3 for the IFLS sample. For all years we see a strong
negative coefficient on log distance migrated, the elasticity of proportion migrat-
ing with respect to distance is between 0.32 and 0.4 depending on the sample and
whether the regressions are run at the regency or province level.
2. The further a migrant travels to a destination, the higher their wage: Controlling for a
destination labor market fixed effect, the log of an individual’s wage is increasing
10 For
a discussion of the gravity equation in migration see, for example, Grogger and Hanson (2011);
Ravenstein (1885).
10in the log of the distance migrated.11 We see this second fact as consistent with
selection – the higher the cost of movement, the higher is the compensation required
to make the move. The gravity relationship is also suggestive of selection: if there
was no heterogeneity in the returns to migration (or the taste for different locations),
then we would expect all people to move to the same place. The fact that we do not
see this suggests that those that are paying higher migration costs are doing so to
increase their utility and part of this is probably an attempt to increase their wage.
If this story is true, then we would expect higher earnings for those that migrate
further. To test whether this is true we estimate
ln wkig = αi + β ln dig + ig
where wkig is the wage of person k in destination i from origin g.12 The results
are presented in Table 3. We see a strong positive coefficient on log distance in all
our data sets: depending on the year the elasticity of wage with respect to distance
varies between 0.03 and 0.05. These results are also robust to looking at different
sub populations - for example those that are self employed.
3. The more people from an origin travel to a destination, the lower their wage: Another im-
plication of the selection story is that the reason that wages are higher for those that
travel further is that those that travel further are more selected. The gravity results
above tell us that this is true – fewer people travel to far away location, suggesting
that they are a more select portion of the population. But if this is what is driving
the wage effect of distance then we should also see that the smaller the proportion
of people from o who move to d then the higher should be the wage. Controlling for
a destination fixed effect, the log of the wage is decreasing in the log of the portion
11 This results is robust to also including an origin fixed effect. The theory does not imply that this fixed
effect should be included, as we discuss below.
12 The model we present below implies that there should be destination fixed effects in this regression.
The results we present here are robust to also including origin fixed effects.
11of people from origin g that move to destination i. That is, we test
ln wkig = αi + β ln πig + kig
We again take this as consistent with selection: in our model higher migration costs
from g to i will decrease the proportion of people born in g that move to i and these
people will tend to have higher i specific skill levels.
4. The distance effect appears to work through the extensive margin of how many people mi-
grate: Further, if selection is the only driver of this result they we should see that,
once we control for the how selected the migrants are (proxied by the proportion
moving) then distance should not affect the wage.13 To test these two implications
the third column of Table 3 presents results from the regression
ln wkig = αi + β ln πig + γ ln dig + kig .
When we include both distance and proportion as predictors of the log wage we
get reasonable support for the hypothesis that the distance effect is driven by se-
lection. For nearly all of our census years the results show that with the two re-
gressors the coefficient on log proportion remains strong and negative, while the
coefficient on log distance decreases, often becoming insignificant. This is broadly
true whether we look at the self-employed or wage earners. The results are some-
what more mixed for this final test when using the IFLS data. One interpretational
caveat is that the correlation between log distance and log proportion is very high
as indicated in the Tables. This may lead to problems interpreting the results. Over-
all, however, we see the evidence as suggestive that much of the distance effect on
wages is driven by the increasing level of selectivity that we see over longer dis-
tances.
13 At this point proportion should be seen as a proxy for the extent of selection and we could use any of a
number of different moments. However, the Fréchet model that we present below implies that proportion
is exactly the right control.
12We see the results from this section as being suggestive of the presence of both se-
lection and migration costs. However, the magnitude of such effects is not easily inter-
preted. Neither, can we provide counterfactual analysis of productivity differences of
reducing such costs. Therefore, in order to quantity the contribution of selection to pro-
ductivity we construct a framework with endogenous sorting of labor across space. We
will show that we can theoretically derive results from the model that will match the four
facts above.
2.2.1 Reduced form facts for the US
The above sets of results show that distance migrated, which we take as a proxy for the
cost incurred to migrate, accentuates the selection effect: migrants who travel further earn
more on average than migrates who don’t travel as far, consistent with our selection story.
To benchmark the results we repeat the analysis for the US, using data constructed from
the American Community Survey. The results for the two specifications are in Appendix
Tables 5 and 6. We find the small qualitative patterns, but with smaller coefficients: dis-
tance migrated still positively predicts wage, and proportion migrating negatively pre-
dicts wage, but there seems to be an additional negative effect of distance over and above
the selection effect through the proportion migration. Note that this does not mean that
there is no selection in migrants in the US; rather, it is consistent with costs of migration
not being as dependent on distance traveled, which is consistent with for example greater
access to infrastructure in the US compared with Indonesia.
The reduced form results are consistent with the mechanisms we explore in the model.
However, to be able to decompose the observed wage differences into selection, wedges,
amenities and agglomeration components, we need to estimate all the parameters in the
model. This is what we turn to next.
3 Model
This section presents our theoretical framework. To capture the joint presence of selec-
tion and mobility constraints we build a model with four key features: i) workers draw
13location-specific productivity levels and select where they live and work to maximize
utility, ii) there are costs of migrating, iv) locations offer different (partially endogenously
determined) levels of amenity and, v) locations offer different (partially endogenously
determined) levels of productivity.
We start by presenting a simple model of location choice with two locations and a
symmetric cost of migration between the two. The simplified model is essentially that
of Lagakos and Waugh (2013) without non-homothetic preferences, and incorporating
migration costs. Throughout it should be emphasised that the migration cost we model
should be thought of as encompassing any cost of moving from the location of birth to
another location. This could include, but is not limited to: transportation costs, credit
constraints, utility costs and psychological costs.14 We use this model to build intuition
for how migration costs decrease country level output and the relevance of our reduced
form tests. We then present our full model which includes multiple locations, a micro
foundation for migration costs and a more complete general equilibrium structure.
3.1 A Simple Rural Urban Example
In order to build intuition for the full model, we present a simple rural-urban selection
model. First, we present the framework without migration costs. We then extend the
simple model to include migration costs and show how this generates aggregate effects
due to the misallocation of labor. Consider two locations, a village (v) and a city (c). The
wage in the city is wc per efficiency unit of labor and the wage in the village is wv per
efficiency unit. There are a measure 1 of individuals in each location, and each individual
receives an iid productivity draw, which determines their labor efficiency if they live in
the village (v ), and if they live in the city (c ). We assume that ∼ Fréchet with parameter
θ. Agents observe their productivity draws and then move to the location that provides
them with the highest income. Therefore, an agent decides to live in the village if
wc
v > c
wv
14 See also, Notowidigdo (2013).
14and decides to live in the city if
wv
c > v .
wc
Given our Fréchet assumption it is easy to show that the fraction of people living in
the city is
wθc
P(c wc > v wv ) = ,
wθc + wθv
and the average productivity of people in location i is
−1/θ 1
E(i ) = πi Γ 1−
θ
where Γ is the gamma function. Finally, once the endogenous selection has occurred, the
ratio of observed (nominal) wages earned by workers in the city and the village is:
wagec
= 1.
wagev
This simple model allows us to demonstrate several of the characteristics that will fol-
low through to our more complete structural model. First, the average quality of workers
in location i is decreasing in the portion of the population that decides to live there (πi ).
This makes sense: conditional on the free movement of labor, the more people living in
location i the less selected are the people in that location. Second the portion of people
that chose to live in location i is increasing in the base wage wi , again this makes intuitive
sense: the gains to living in a particular location are determined by the base wage. Third,
in this model the ratio of average wages do not depend on wc /wv . This is an implication
of our Fréchet assumption. There are two effects at work when the ratio of base wages
wc /wv rises: first, those that are in location c now receive higher relative wages; second,
people from location v move to location c meaning that the average quality of workers
decreases. The Fréchet assumption means that these two effects exactly offset each other.
We believe that this makes the Fréchet assumption a natural benchmark, it also means
that migration costs are easy to identify in the model. We do, however, explore generali-
sations that relax this assumption in our work below. Fourth, this reasoning also implies
that the location with the lowest base wage has the highest average productivity: the only
15people that will stay in the village if it has a low base wage are those that are particularly
well suited to the village.
We now extend this simple model to incorporate a cost of migration and an option to
invest in human capital. Given the Fréchet assumption, the simplest way to add incor-
porate migration costs is as a multiplicative cost of living somewhere other than where
you were born.15 We assume that the cost of moving is τ > 1, with τ = 1 if you do
not move. We provide micro foundations for this approach in the next section and also
explore alternative micro foundations in the Appendix.
Incorporating migration costs, we have that an individual born in location o will mi-
grate to location d if
−i w −i
i wi >
τ
which then implies that the portion of people from location o that choose to move to
location d is
wd θ
τ
πdo = wd θ
.
+ wθ
τ o
This then implies that average productivity in the village is
πvv −1 πvc −1 1
E(v ) = [ πvvθ + πvc θ ]Γ(1 − )
πvv + πvc πcc + πcv θ
so that total economy productivity is
1
[(πvv + πvc ) E(v ) + (πcv + πcc ) E(c )]Γ(1 − ).
θ
This simple model highlights two costs of spatial misallocation, driven by τ:
1. People are in the wrong place: people with a higher d instead live in location o;
2. People are in the less efficient place: suppose that wc > wv then, conditional on
weakly more people being born in the village, there will be too few people living in
the city; and
15 Ahlfeldt et al. (2014) pursue a similar approach for capturing commuting costs.
16In addition to these possibilities, in the richer model presented below, base wages may
depend on the portion of the population living in c through an agglomeration externality.
Migration costs will reduce the degree to which the economy takes advantage of these
externalities.16
3.2 Full model
We now turn to the full model of comparative advantage with a location choice over N
locations. We describe the aggregate production technology; the determination of human
capital and wages; and the determination of utility and migration. We conclude by defin-
ing the GE solution to the model. The model we present here is closely related to the work
of Hsieh et al. (2013) who use the same basic selection model to consider the impact of
discrimination on labor market productivity.
3.2.1 Production
There are a (discrete) set of locations (or migration destinations), i ∈ N. Each location i
produces a differentiated variety of a good. Total economy wide production is given by
! σ
N σ −1
σ −1
σ
Y= ∑ qi
i =1
where qi is the total output of the good produced in location i.17 Output of good i depends
on the amount of human capital in location i according to the function
qi = Ai Hi
where Hi is the total human capital (or effective labor units) available at location i and
Ai = Āi Hiγ
16 Migration costs are effectively a tax on a product that has a marginal social product higher than its
marginal social cost.
17 If σ → ∞ all products are perfect substitutes, so the case in which all location produce the same good
is a limit case of our model.
17is the productivity of location i. In this formulation, Āi can be thought of as the intrinsic
productivity of location i, which is an exogenous parameter. Current productivity, Ai
depends on intrinsic productivity and the total amount of human capital in location i with
γ parameterising the extent of human capital spillovers, or productive agglomeration
externalities.
3.2.2 Human Capital and Wages
Human capital for any individual depends on a destination specific skill hi , which we
assume is drawn from a multivariate Fréchet distribution:
" #1−ρ
N
F (h1 , . . . , h N ) = exp − ∑ hi−θ
i =1
where θ measures the extent of skill dispersion (dispersion increases as θ decreases) and
ρ measures the correlation in skills across locations .18 The interpretation is that each
different location has a different set of required skills.19 There is correlation because some
people may be good at everything and the case in which talent is unidimensional is a
limiting case as ρ → 1.
We assume that labor markets are competitive and that firms are price takers and are
paid pi for each unit. As a consequence, each unit of skill is paid
wi = pi Ai .
meaning that a person living in designation i with skill level hi earns a wage wi hi .
18 Throughout we follow the convention that the first subscript denotes the location of production and
the second subscript the workers origin.
19 The model can be extended to allow for human capital accumulation; this is an additional channel
through which migration costs can affect human capital accumulation. The model with human capital is
presented in Appendix A.
183.2.3 Utility and Labor Sorting
Workers care about three things: the amenity of the location where they live and work, αi ;
total consumption c; and the amount of time they spend at home, t. Amenity in location
d is determined by the number of workers living in the location according to the function
αi = ᾱi Liλ
where Li is the total number of workers living in destination i and λ parameterises the
extent of congestions costs. As with productivity, amenity is endogenous and composed
of an exogenous element – natural productivity ᾱ – and a congestion costs which depends
on the exogenous variable Li .
Individuals do not internalise their impact on amenity, and utility of an individual
born in location (or origin) g and living in destination i is given by
Uig = αi cβ t1−β .
Individuals choose t̂ (the amount of time away from work) to maximise utility subject to
t̂ ≤ T,
c = wh( T − t̂),
and
t = t̂(1 − τ )
where T is the total time endowment, w the hourly wage per unit of skill and τ is the
number of hours required to return home from the location of work.20 This maximisation
problem leads to the solution
t̂∗ = (1 − β) T,
20 We think of this as follows: individuals must go home multiple times, for example every weekend. If
the individual lives far from home, then they will spend a portion 1 − τ of their weekend at home. We,
therefore, have that τii = 0 for all i.
19implying that a constant portion of time is spent at work, regardless of τ. This is conve-
nient as it implies all workers work the same number of hours, so we can interpret wi hi
as the hourly wage.
Total consumption for an individual does not depend on whether they are from, and
is given by
c = whβT.
So, total utility for someone from o migrating to d is
β
1 1−β
Uig = wi β(αi T ) β (1 − β)(1 − τig ) β
hi ≡ (w̄ig h g )β . (1)
With this background, known results regarding the Fréchet distribution imply the fol-
lowing facts.21 First, let πig be the portion of people from origin o that choose to work in
designation d. We have
w̃θig
πig = (2)
∑sN=1 w̃θsg
1
where w̃ig = wi (αi (1 − τig )1−β ) β . Equation (2) is the key sorting equation and it asserts
that sorting depends on relative returns, relative amenities and relative transport costs.
Second, we can use this characterisation to determine the average quality of workers
from g working in i by noting that
1 θ1 1
E(hig | choose i ) = Γ 1− . (3)
πig θ (1 − ρ)
This equation implies that the more people from location g that move to location i, the
lower is the average skill. This is intuitive as it implies that there is less selection. Finally,
we can work out the average wage in a particular location, first note that the average
wage of someone from location i living in location g is
1 θ1 1
wageig = wi E(hi | choosei ) = wi Γ 1− . (4)
πig θ (1 − ρ)
21 See, for example, Hsieh et al. (2013)
20We can further simplify to
1
θ
∑s w̃θsg 1
wageig = Γ 1− . (5)
θ
(αi (1 − τig )(1−β) ) β θ (1 − ρ)
This gives the result that the average wage does not depend directly on the base wage
wi . Intuitively there are two forces at work: first, when the base wage rises it increase
the wage for those that are currently in that location, which tends to increase the average
wage; second, it also increases the number of migrants, and these migrants will, on aver-
age, be of lower skill than those that had already migrated, which tends to decrease the
average wage at the destination. A priori it is hard to predict which force will dominate.
The Fréchet model implies that these forces exactly offset to leaving the average wage
unchanged. We think this is a reasonable starting point for a model, and will see what the
data says below.
3.2.4 Deriving the reduced form facts
Before closing the production side of the model, we show that the four reduced form facts
are easily derived from this model of labor sorting.
1. Gravity: taking logs of the migration decision (Equation 2) yields:
θ (1 − η) θ (1 − β)(1 − η)
log(πig ) = θ log(wi ) + log(αi ) + log(1 − τig ) − log ∑ w̃θsg
β β s
θ (1−η)
The first two terms, θ log(wi ) + log(αi ) are common to a destination labor
β
market, so can be controlled for by a destination fixed effect. The last term, log ∑s w̃θsg
is common across all migrants, so can be controlled for by an origin fixed effect.
2. Wage at destination depends on distance travelled: taking logs of the wage equation
(Equation 4) yields:
−(1 − β)
1 1
log(wageig ) = log(γ ) − log αi + log(1 − τig ) + log ∑ w̃θsg
β β θ (1 − η) s
21The first two terms are common to the destination labor market, so can be controlled
for by a destination fixed effect. The last term is common across individuals from
the same origin, so the prediction is that the further you travel (i.e. the larger is τig )
the higher the wage at destination.
3. Share of people migrating negatively predicts wage at destination:
1 1
log(wageig ) = log(γ ) + log(wi ) − log(πig )
1−η θ (1 − η)
Here, the first two terms are common across the destination, so can be controlled for
with a destination fixed effect. The prediction is a negative coefficient for the share
of population migrating.
3.2.5 Aggregate Demand and The GE Solution to the Model
Above we have discussed the decisions of workers and firms in each location. The model
is completed by assuming that a representative firm purchases goods from each location
to solve ! σ
N σ −1
σ −1
max ∑ qi σ
− pi qi .
qi
i =1
Solving this problem yields the requirement that
1
Y σ
pi = (6)
qi
indicating that the price is a decreasing function of the total supply from each location.
A general equilibrium is then a set of prices pi , base wages wi and an allocation of
workers and skills across apace Hi and Li such that labor and goods markets clear. Intu-
itively, wages determine how many people move to each location, which in turn deter-
mines productivity and output. This in turn determines prices according to equation (6).
Formally, an equilibrium consists of: prices pi ; base wages wi ; labor supply Li and human
capital Hi , such that:
1. Consumers maximize utility
222. Producers maximize profit
3. Labor markets clear
4. Goods markets clear
This definition gives rise to the following equilibrium conditions:
w̃θig
πig = (7)
∑sN=1 w̃θsg
wi = pi Āi Hiγ +1
1
Y σ
pi =
qi
Hi = ∑ L̂ j πig E(hig | chooses i)
j
Li = ∑ L̂ j πig
j
We take this model of comparative advantage and endogenous selection to the empir-
ical setting of Indonesia, to quantify the aggregate effects of labor misallocation.
4 Identification of model parameters
After constructing the model, we now show how we can identify the parameters that
define the model. One advantage of our model is that closed forms are easily computed
and so identification is relatively transparent. Roughly, the extent to which the portion of
people from g that move to i reduces the wage at i recovers the Fréchet parameter charac-
terising the distribution of talent. Both amenities and productivities affect the migration
rate, but in our model, productivity does not affect the wage of migrants. This follows
from a convenient, but perhaps specific, feature of our model: an increase in productiv-
ity in destination i has two effects: first, it raises the wages of those already live there,
and second, it increases the influx of low skill migrants. In our model these effects ex-
actly offset meaning the wage level identifies amenities. Hence, wage differences can be
23used to infer amenities, and with these measured, migration rates can be used to infer
differences in productivity. Finally, any “wedge” between average wages for migrants
and non-migrants that exists both for migrants from i to g and for migrants from g to i
is, combined with low migration rates between the two location, interpreted as a migra-
tion cost. Our structural estimates give us, for each location in Indonesia: the level of
amenity relative to a benchmark, an absolute measure of productivity, the cost of migra-
tion between each pair of places and the total amount of human capital current living in
each location. These measures can be used to do simple decompositions of the spatial
wage gap, or combined with the full computational model to undertake counterfactual
exercises.
We estimate the underlying parameters determining amenities (α), productivity (A),
migration costs (τ) and the spread and correlation of talent (θ, ρ). We set the parame-
ters determining amenity and productivity spillovers (λ, γ), share of consumption in the
utility function (β), elasticity of substitution (σ) exogenously. In addition, we set time al-
location to 1 (L), and assume that mean of the Frechet distribution is normalized to 1 (Ti j ).
We are only able to identify amenities to scale; further we assume that migration costs are
N ( N −1)
symmetric and that own-migration costs are zero. This leaves us with 2 + 2N + 1
parameters to estimate. Table 1 summarizes the parameters and their meaning in the
model.
4.1 Identification of model parameters
Our model of spatial sorting yields the following three equations that determine the spa-
tial sorting equilibrium:
(1−η)
θ
(1−β)(1−η)
β
wiαi (1 − τig ) β
πig = θ (8)
(1−η)
(1−β)(1−η)
β
∑s wsαs (1 − τsg ) β
1 −1
wageig = γwi1−η πig(1−η)θ (9)
24 η
ηβ 1−η
where γ = 1−η+ηβ Γ 1 − θ(1−η1)(1−ρ) is a constant determining the Frechet dis-
tribution. Substituting Equation 8 into Equation 9 yields
−1 −(1−β)
αi β (1 − τig ) β
wageig = γ −1 (10)
θ θ (1−η)
∑s w̃sg
Equations 8, 9 and 10 together identify the migration costs, comparative advantage
parameter, productivities and relative amenities determining the spatial equilibrium. We
now show how these equations can be used to identify each of the structural parameters
in the model.
4.1.1 Frechet parameter
From Equation 9 we have:
1 1
log(wageig ) = log γ + log wi − log(πig )
1−η θ (1 − η)
| {z }
Destination fixed effect
That is, after controlling for the average utility in the destination with a destination
fixed effect, the elasticity of the average wage with respect to the proportion of migrants
identifies the Frechet parameter θ. This channel operates through the selection margin:
the larger the share of migrants, the lower the average quality, and so the lower the bi-
lateral wage. How responsive the wage is to an increased inflow of migrants is deter-
mined by the spread of talent: intuitively, if people are more similar, then θ is high, so the
marginal migrant is not very less skilled than the previous migrant, and so they earn a
wage that is close to the previous migrant. However, if the talent dispersion is large, then
the marginal migrant is much less skilled than the previous, and so their wage is lower.
4.1.2 Migration costs
In the model, migration costs accentuate the selection margin. Migration costs introduce
a wedge between migrants and non-migrants in the destination: the migrants that have
25chosen to pay the migration cost and move have a higher unobserved quality, and there-
fore earn a higher wage in the destination than non-migrants. We use this to identify
the costs of migration. To see this explicitly, use equation 12. The difference between the
home and away wage, for both migrants and non-migrants, identifies the cost of moving
between two locations, assuming that migration costs are symmetric and own-migration
costs are zero:22
πig w θ (1 − η) α θ (1 − β)(1 − η)
log = θ log i + log i + log(1 − τig )
π gg wg β αg β
π gi w θ (1 − η) α θ (1 − β)(1 − η)
log = −θ log i − log i + log(1 − τig )
πii wg β αg β
Adding these two equations,
πig π gi θ (1 − β)(1 − η)
log =2 log(1 − τig )
π gg πii β
4.1.3 Amenities
Amenities make a location more attractive for workers. Amenities are not a productive
asset of a location. In the model, amenities have two effects: they make a location more
attractive, hence increase the migration rate, and as a result they lower the observed wage
because they cause more in-migration and therefore bring in lower-skilled migrants who
earn a lower wage.
We identify amenities as the difference between home and away wages for both mi-
grants and non-migrants. To see this, use equation 14:
wageig 1 α (1 − β)
log = − log i − log(1 − τig )
wagegg β αg β
wagegi 1 α (1 − β)
log = − log i − log(1 − τig )
wageii β αg β
22 Migration costs can also be identified the same way from 14.
26Subtracting these two equations,
wageig wageii 1 α
log = −2 log i
wagegi wagegg β αg
This equation identifies the relative amenities between any two locations. Because
amenities are unobserved, we do not have any more information to pin down the levels
of amenities. For this reason, we make a normalization that α1 = 1.
The identification of amenities relies on one property of the Frechet distribution: once
the choice probabilities are substituted into the wage level, as in Equation 10, the wage in
location i cancels out. This is a particular feature of the Frechet distribution: an increase
in the wage in location i would increase migration rates, but the incoming migrants are
lower quality. Under the Frechet distribution these two effects exactly offset, so as a result
the wage does not appear directly. This is a strong assumption, but seems a reasonable
starting point.
4.1.4 Productivities
The productivity of a location is identified using the observed wages and the observed
migration flows: a higher wage attracts more migrants, and a higher productivity trans-
lates into higher wages. From Equation 13 we have
1 1
log(wageig ) = log(γ ) + log(wi ) − log(πig )
1−η θ (1 − η)
η
ηβ 1−η
where γ = 1−η+ηβ Γ 1 − θ(1−η1)(1−ρ) is a constant determining the Frechet dis-
tribution. Once we identify ρ (see below), then we can identify wi in levels from the above
equation.
4.1.5 Separating absolute advantage from comparative advantage
Using properties of the Frechet distribution, we can derive:
27You can also read


