Control of increased sedimentation on orogenic fold-and-thrust belt structure - insights into the evolution of the Western Alps
←
→
Page content transcription
If your browser does not render page correctly, please read the page content below
Solid Earth, 10, 391–404, 2019
https://doi.org/10.5194/se-10-391-2019
© Author(s) 2019. This work is distributed under
the Creative Commons Attribution 4.0 License.

Control of increased sedimentation on orogenic fold-and-thrust belt
structure – insights into the evolution of the Western Alps
Zoltán Erdős1,2,a , Ritske S. Huismans1 , and Peter van der Beek2
1 Department of Earth Sciences, University of Bergen, Bergen, Norway
2 ISTerre,Université Grenoble Alpes, Grenoble, France
a now at: Department of Geophysics and Space Science, Eötvös Loránd University, Budapest, Hungary

Correspondence: Zoltán Erdős (zoltan-erdos@caesar.elte.hu)

Received: 19 November 2018 – Discussion started: 23 November 2018
Revised: 20 February 2019 – Accepted: 28 February 2019 – Published: 13 March 2019

Abstract. We use two-dimensional thermomechanical mod-            1   Introduction
els to investigate the potential role of rapid filling of fore-
land basins in the development of orogenic foreland fold-         The effects of surface processes on orogenic evolution have
and-thrust belts. We focus on the extensively studied exam-       been intensively studied over the last 3 decades (e.g., Whip-
ple of the Western European Alps, where a sudden increase         ple, 2009). Numerous studies have shown that erosion can
in foreland sedimentation rate during the mid-Oligocene is        strongly influence the growth of orogenic hinterland re-
well documented. Our model results indicate that such an in-      gions, with high erosion rates localizing deformation and
crease in sedimentation rate will temporarily disrupt the for-    creating a lower, narrower orogenic wedge (Beaumont et
mation of an otherwise regular, outward-propagating base-         al., 1992; Braun and Yamato, 2010; Konstantinovskaia and
ment thrust-sheet sequence. The frontal basement thrust ac-       Malavieille, 2005; Koons, 1990; Stolar et al., 2006; Willett,
tive at the time of a sudden increase in sedimentation rate       1999).
remains active for a longer time and accommodates more               Both numerical and analog models also point towards a
shortening than the previous thrusts. As the propagation of       strong control exerted by syn-orogenic deposition on the
deformation into the foreland fold-and-thrust belt is strongly    structural development of orogenic forelands, as sedimenta-
connected to basement deformation, this transient phase ap-       tion rates affect the length of both thin- and thick-skinned
pears as a period of slow migration of the distal edge of fore-   foreland thrust sheets, as well as the amount of displacement
land deformation. The predicted pattern of foreland-basin         taken up by individual faults (Adam et al., 2004; Bonnet
and basement thrust-front propagation is strikingly similar       et al., 2007; Duerto and McClay, 2009; Erdős et al., 2015;
to that observed in the North Alpine Foreland Basin and pro-      Fillon et al., 2012; Malavieille, 2010; Mugnier et al., 1997;
vides an explanation for the coeval mid-Oligocene filling of      Simpson, 2006a, b; Stockmal et al., 2007; Storti and McClay,
the Swiss Molasse Basin, due to increased sediment input          1995). In particular, it has been shown experimentally that
from the Alpine orogen, and a marked decrease in thrust-          higher rates of syn-orogenic sedimentation result in longer
front propagation rate. We also compare our results to pre-       thin-skinned thrust sheets as well as longer basement thrust
dictions from critical-taper theory, and we conclude that they    sheets under the foreland fold-and-thrust belt (e.g., Erdős et
are broadly consistent even though critical-taper theory can-     al., 2015; Fillon et al., 2012). However, direct comparison of
not be used to predict the timing and location of the forma-      model predictions with observations from natural case stud-
tion of new basement thrusts when sedimentation is included.      ies (e.g., Fillon et al., 2013) remains scarce.
The evolution scenario explored here is common in orogenic           The North Alpine Foreland Basin of France and Switzer-
foreland basins; hence, our results have broad implications       land developed in response to continental collision in the
for orogenic belts other than the Western Alps.                   Alps during early Tertiary time (Dewey et al., 1973; Home-
                                                                  wood et al., 1986; Pfiffner, 1986). The stratigraphic infill of
                                                                  this foreland basin has been well documented (e.g., Sinclair,

Published by Copernicus Publications on behalf of the European Geosciences Union.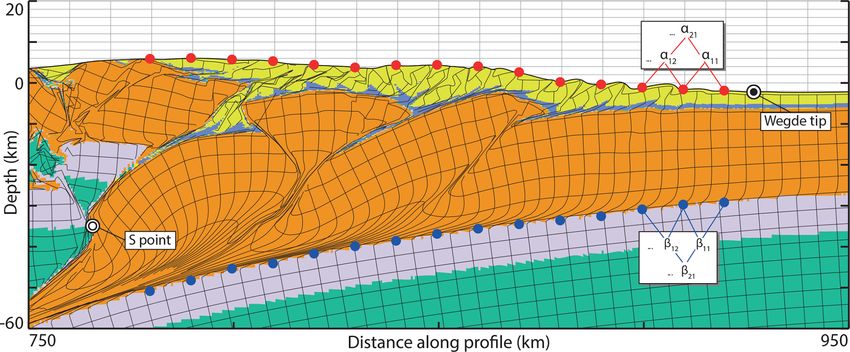
392                         Z. Erdős et al.: Control of increased sedimentation on orogenic fold-and-thrust belt structure

1997; Berger et al., 2005; Kuhlemann and Kempf, 2002; Wil-        the crystalline crust by a 1 km thick weak layer representing
lett and Schlunegger, 2010, and references therein) and con-      a décollement horizon (e.g., an evaporite or shale layer). In
sists of two major stages: a Paleocene to mid-Oligocene deep      order to include self-consistent inherited extensional weak-
marine (flysch) stage and a mid-Oligocene to late Miocene         ness zones, the model is first extended, before the velocity
shallow marine and continental (molasse) stage (Fig. 1).          boundary conditions are inverted to create a contractional
   During the first stage, exhumation rates of the orogenic       regime (e.g., Erdős, 2014; Jammes and Huismans, 2012).
hinterland and deposition rates in the foreland basin were           The surface-process model includes an elevation-
low; hence, the basin remained underfilled (Allen et al.,         dependent erosion algorithm as well as a sedimentation rule
1991; Burkhard and Sommaruga, 1998; Sinclair and Allen,           that fills topography up to a reference base level at each
1992). At the onset of the second stage, both erosion rates       time step. Both the erosion and sedimentation algorithms
in the Alps and deposition rates in the foreland basin in-        are simple and do not conserve mass; however, the resulting
creased (Schlunegger et al., 1997; Schlunegger and Norton,        basin-fill geometries are consistent with observations from
2015; Sinclair and Allen, 1992), creating an overfilled fore-     natural foreland-basin systems (DeCelles and Giles, 1996).
land basin. The transition from an underfilled to an overfilled      The model experiments presented here have sufficiently
state coincided with a marked decrease in thrust-front ad-        high resolution (500 m horizontally and 200 m vertically in
vance rate (Sinclair and Allen, 1992), but links between the      the upper-crustal domain) to bridge the large range of scales
two have remained speculative.                                    from the entire collisional orogen to the fold-and-thrust belt
   Here, we use numerical models that build on our pre-           and the interaction with syn-orogenic deposition.
vious work (Erdős et al., 2015, 2014) to test how an in-            The initial parameters (crustal setup, convergence veloc-
crease in sedimentation rate affects mountain-belt and fore-      ity) have been chosen to match conditions likely applica-
land fold-and-thrust belt evolution. In earlier work (Erdős et   ble for the Alpine orogenic system. The major difference
al., 2015) we showed how our model predictions were con-          is that the model does not include seafloor spreading or
sistent with minimum-work theory. Here, we quantitatively         a lag between breakup and the onset of inversion. The
compare our models to critical-taper theory in order to as-       sedimentation–erosion algorithms have been parameterized
sess the predictions of this simple but widely used theorem,      to represent moderate rates for both processes (see Supple-
when including a more complex and realistic rheology. Our         ment 1).
main aim is to explore the potential causal relationship be-
tween a sudden increase in sediment influx and the temporary
slowing of thrust-front propagation, as observed in the North     3     Model results
Alpine Foreland Basin. Such a sediment accumulation sce-
nario is common in foreland basins (e.g., Allen and Home-         We present three model experiments that demonstrate the re-
wood, 1986); hence, the demonstration of a causal relation-       sponse of crustal deformation to sudden temporal changes
ship should have a significant impact on our understanding of     in syn-orogenic sedimentation. For Model 1, neither erosion
not just the North Alpine Foreland, but also the development      nor sedimentation is included (Fig. 3a–d). In Model 2, a sim-
of similar orogenic systems around the world.                     ple elevation-dependent erosion model is applied together
                                                                  with fixed base-level sedimentation (Erdős et al., 2015): dur-
                                                                  ing each model time step, basins are filled with sediments
2   Numerical method                                              to a prescribed base level (Fig. 3e–g). Model 3 is identical
                                                                  in setup to Model 2, but sedimentation is initiated 10 Myr
We explore the potential links between syn-tectonic sed-          earlier and the base level of sedimentation is increased dur-
imentation and orogen structure through the use of 2-D            ing the experiment (15 Myr after initiation) to mimic the
arbitrary Lagrangian–Eulerian thermomechanical modeling           transition from an underfilled to an overfilled foreland basin
(Erdős, 2014; Thieulot, 2011) coupled to a simple surface-       (Fig. 3h–i; see also animations in the Supplement) as ob-
process algorithm. The numerical experimental setup is very       served in the Western Alps (e.g., Sinclair and Allen, 1992).
similar to the one used in our previous studies (Erdős et al.,
2015, 2014) and is explained in detail in the Supplement.         3.1    Model 1
   The thermomechanical model consists of strain-
weakening frictional plastic materials that allow for the         During the 15 Myr of initial extension, a broad, approxi-
localization of deformation (e.g., Huismans et al., 2005).        mately 200 km wide asymmetric rift basin is formed in the
Our experiments use a four-layer crust–mantle rheology            center of the model domain, consisting of a number of rotated
in which the upper and lower crust as well as the upper           crustal blocks with mantle material reaching the surface at
lithospheric mantle undergo frictional plastic deformation,       two different locations approximately 50 km apart (Fig. 3a).
while the middle crust and lower lithospheric mantle exhibit      This is followed by a 15 Myr long inversion period culmi-
power-law viscous creep (Fig. 2). A 3 km thick pre-orogenic       nating in subduction initiation and the formation of an up-
sediment package at the top of the model is separated from        lifted central block (keystone structure) with a distinct inter-

Solid Earth, 10, 391–404, 2019                                                              www.solid-earth.net/10/391/2019/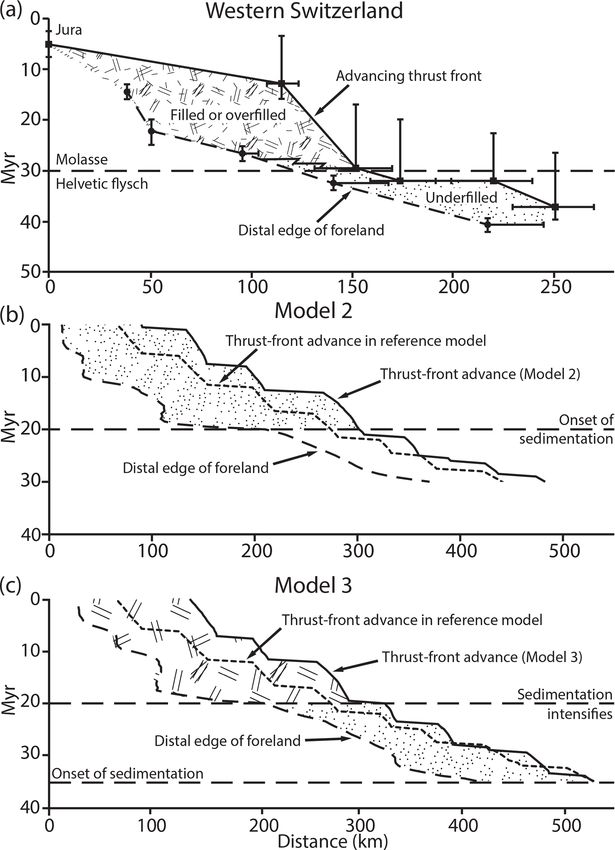
Z. Erdős et al.: Control of increased sedimentation on orogenic fold-and-thrust belt structure                                           393

Figure 1. Cross section and geological map of the Western Alps, redrawn after Schmid and Kissling (2000) and Schmid et al. (2017), with
the inset showing the section interpretation of Roure (2008) along part of the same deep seismic section. SL indicates the location of the
Sesia–Lanzo zone.

Figure 2. (a) Model geometry showing layer thicknesses (including a close-up of the crust), the position and size of the weak seed (pink
square), the lateral velocity boundary conditions (black arrows along the sides of the box; note the ± sign), and the initial strength and
temperature profiles of the models. The material properties corresponding to each layer (including the syn-tectonic sediments) are presented
in Table 1. (b) Frictional plastic strain softening is achieved through a linear decrease in φeff from 15 to 2◦ with a simultaneous decrease in
C from 20 to 4 MPa. (c) Legend for materials shown in (a).

nal structure consisting of a number of inverted normal faults               In the third phase of Model 1, deformation migrates into
around a core of uplifted lower-crustal and lithospheric man-             the subducting plate, building up the pro-wedge (using the
tle material (see Movie 1 in the Supplement).                             terminology as defined by Willett et al., 1993) initially
                                                                          through the formation of a crustal-scale pop-up structure,

www.solid-earth.net/10/391/2019/                                                                          Solid Earth, 10, 391–404, 2019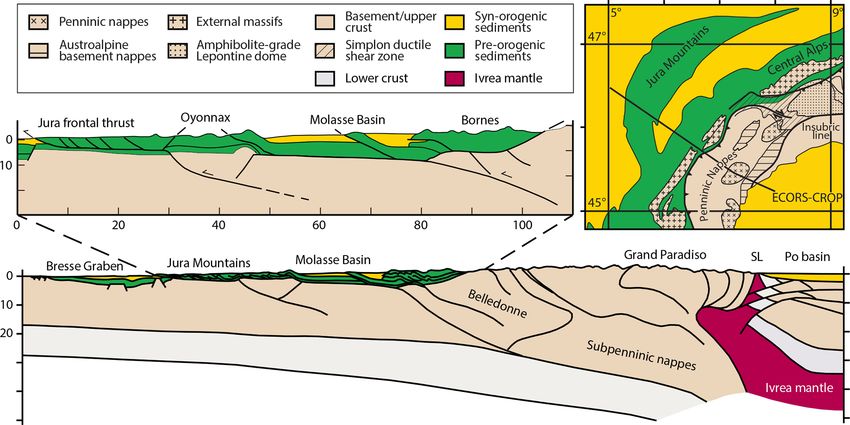
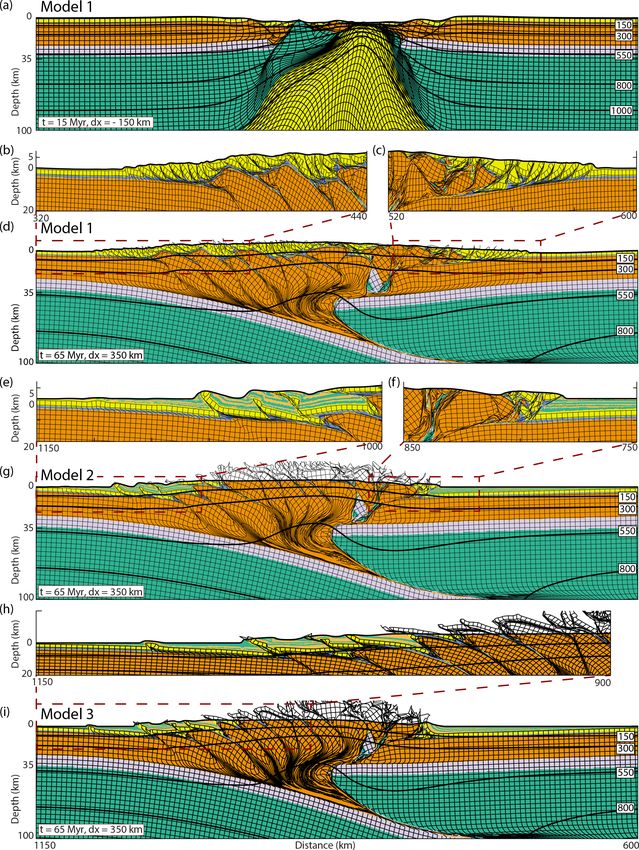
394                           Z. Erdős et al.: Control of increased sedimentation on orogenic fold-and-thrust belt structure

Figure 3. Model results. The material coloring scheme is identical to that used in Fig. 2. All models are run for 65 Myr: 15 Myr (150 km)
extension followed by 50 Myr (500 km) contraction for a total net contraction of 350 km. The horizontal scale for panels (a), (d), and (g) is
the same as that of panel (i). (a–d) Model 1 with no surface processes, showing deformed Lagrangian mesh and isotherms after (a) 15 Myr
(1x = −150 km) and (d) 65 Myr (1x = 350 km). Panels (b) and (c) are extracts from panel (d) showing the small-scale deformation patterns
in the foreland fold-and-thrust belts. (e–g) Model 2 including a simple surface-process algorithm filling up accommodation space until a base
level of −500 m, showing deformed Lagrangian mesh and isotherms after 65 Myr (1x = 350 km). Panels (e) and (f) are extracts from
panel (g) showing the small-scale deformation patterns in the foreland fold-and-thrust belts. (h–i) Model 3 including a simple surface-
process algorithm with the sedimentation base level changing from −500 to 0 m at t = 45 Myr. Panels show deformed Lagrangian mesh
and isotherms after 65 Myr (1x = 350 km). (h) An extract from (i) showing the small-scale deformation patterns in the pro-wedge foreland
fold-and-thrust belt. Note that the polarity of subduction is randomly oriented for each model. For ease of comparison we flipped Models 2
and 3 to show them in the orientation that is conventional for the Alpine cross sections.

Solid Earth, 10, 391–404, 2019                                                                       www.solid-earth.net/10/391/2019/
Z. Erdős et al.: Control of increased sedimentation on orogenic fold-and-thrust belt structure                                         395

Table 1. Mechanical and thermal parameters used in the models for each material.

        Units                                  Salt           Upper crust +         Lower                Mantle       Sublithospheric
                                                      precollision sediment          crust          lithosphere               mantle
        Mechanical parameters
        Thickness (km)                            1                  21 + 3            10                   90                   480
        Reference density (kg m−3 )           2300                    2800                                3360                  3300
        Friction angle (◦ )                       –                                     15–2◦
        Cohesion (Pa)                             –                                  2.107 –4.106
        Flow law                                               Wet quartz                           Dry olivine           Wet olivine
        Reference                                      Gleason and Tullis (1995)                     Karato and Wu (1993)
        Scaling factor                            1                         1         100                    1                     1
        A (Pa−n s−1 )                                        8.574 × 10⁻²⁸                   2.4168 × 10⁻¹⁵           1.393 × 10⁻¹⁴
        Q (J mol−1 )                                         222.815 × 10³                      540.41 × 10³           429.83 × 10³
        n                                                          4                                     3.5                      3
        V (m3 mol−1 )                             0             3.1 × 10⁻⁶      3.1 × 10⁻⁶          25 × 10−6             15 × 10−6
        R (J mol−1 ◦ C−1 )                                                          8.3144
        Thermal parameters
        Heat capacity (m2 K−1 s−2 )                              803.57                                      681.82
        Thermal conductivity (W m−1 K−1 )                                            2.25
        Thermal expansion (K−1 )                              3.1 × 10⁻⁵                                          0
        Heat productivity (µW m−3 )                           0.8 × 10⁻⁶                                          0

and then primarily through an outward-propagating sequence            on both sides of the orogen, with more intense thin-skinned
of basement thrust sheets (Fig. 3d) with an average thrust-           deformation on the pro-side. The sequence of outward-
sheet length of 52 km. We use the term basement thrust sheet          propagating basement thrust sheets in the pro-wedge is dis-
when referring to thrust sheets that cut the crystalline base-        rupted as deformation remains localized on the active frontal
ment (upper crust). Superposed on this sequence, and of-              basement thrust for 8 Myr, instead of the 4 Myr observed in
ten spatially slightly ahead of it, the pre-orogenic sediments        Model 1, before stepping out below the foreland basin 13 km
are also deformed, creating a complex thin-skinned fold-and-          farther than in Model 1 (Fig. 3e–g; Movie 2 in the Supple-
thrust belt (Fig. 3b–c; for an extensive description of the in-       ment).
teraction of thin-skinned and thick-skinned deformation, see             The effect can be well illustrated by comparing the length
Erdős et al., 2015). Deformation in the retro-side of the oro-       and displacement of basement thrust sheets around the time
gen (defined to be the part of the wedge situated on the over-        of the onset of sedimentation (Fig. 4). Prior to the onset of
riding plate) remains comparatively subdued throughout the            sedimentation, Thrust A accumulated 6 km of displacement
model but the initially uplifted central block, which includes        before Thrust B created a new, 45 km long basement thrust
a lower-crustal–mantle lithospheric core, is transported more         sheet (Fig. 4a). After the onset of sedimentation, Thrust B re-
than 50 km onto the overriding plate.                                 mained active for about 8 Myr and accumulated 24 km of dis-
                                                                      placement before Thrust C created a new, 83 km long thrust
3.2   Model 2, with erosion and sedimentation                         sheet in the footwall of Thrust B (Fig. 4b).
                                                                         As the model progresses further, upper-crustal blocks in
The surface-process algorithms in Models 2 and 3 are acti-            the internal parts of the orogen that were initially covered
vated at 45 and 35 Myr (model time), respectively. Conse-             with pre-orogenic sediments are deeply eroded, reaching the
quently, all presented models exhibit the same behavior dur-          surface and bringing the lower-crustal–mantle lithospheric
ing the first two phases described above.                             core of the central block to shallow depths. A small sliver of
  Following the initiation of erosion and sedimentation at            mantle lithospheric material eventually reaches the surface
45 Myr in Model 2, sediment-loaded foreland basins form               along a back-thrust (Fig. 3f).

www.solid-earth.net/10/391/2019/                                                                       Solid Earth, 10, 391–404, 2019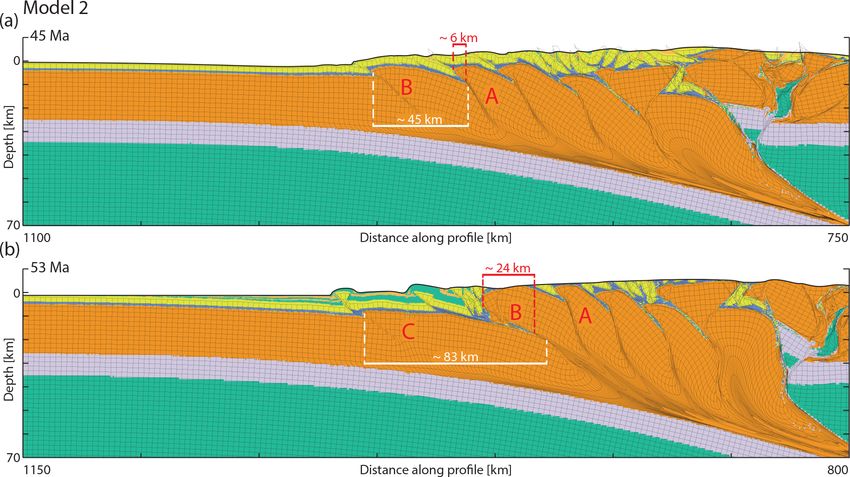
396 Z. Erdős et al.: Control of increased sedimentation on orogenic fold-and-thrust belt structure
Figure 4. The evolution of Model 2 around the time of the onset of sedimentation (and erosion). The material coloring scheme is identical
to that used in Fig. 2. (a) Model 2 at 45 Myr (1x = 150 km), just before the onset of sedimentation. White marks show the length of the
active external basement thrust sheet (thrusting along Thrust B). The length is measured using the VISU Grid (black grid advected with the
materials in the model); we counted the number of undeformed cells in the top row in the basement between the old and the new frontal
thrust. Red marks show the amount of displacement along the last abandoned thrust (Thrust A). (b) Model 2 at 53 Myr (1x = 230 km) at the
time of the initiation of the first basement thrust sheet after the onset of sedimentation. White marks show the length of the active external
basement thrust sheet (thrusting along Thrust C). Red marks show the amount of displacement along the just-abandoned thrust (Thrust B
corresponding to Thrust B in Fig. 4a). Further towards the orogenic hinterland the steepened Thrust A is shown (corresponding to Thrust A
in Fig. 4a).
We recorded maximum sedimentation rates for 2 Myr in- sedimentation rate in the foreland basin (from an average of
tervals (see the alternating orange and green layers of syn- 0.45 to 1.1 km Myr−1 at the location of the frontal thrust).
tectonic sediments in Fig. 3e–i) throughout the model. Af- Subsequently, the maximum sedimentation rate quickly de-
ter an initial peak of 2.7 km Myr−1 between 45 and 46 Ma, creases to its previous (average) value.
when the entire available accommodation space is filled up As observed in Model 2, the initiation of sedimentation
to the prescribed base level, the maximum sedimentation alters the architecture of the orogenic foreland by creating
rates in the pro-foreland basin stabilize around an average longer basement thrust sheets. Similarly, a sudden increase
of 0.45 km Myr−1 . in the sedimentation rate in Model 3 also results in a change
in the foreland development. Again, this can be well illus-
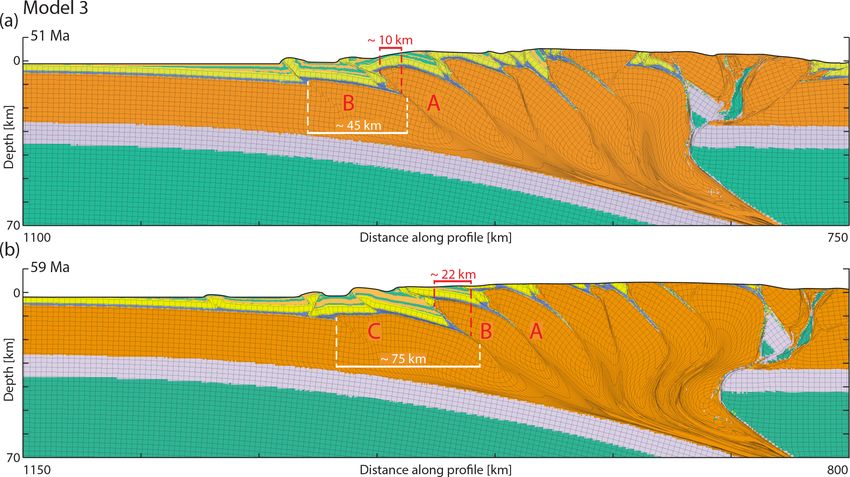
3.3 Model 3, with erosion and intensifying trated by looking at the deformation pattern around the time
sedimentation of increase in sedimentation rate (Fig. 5). Prior to the in-
crease in sedimentation rate, Thrust A accumulated 10 km
The evolution of Model 3 is very similar to that of Model 2, of displacement before Thrust B created a new, 45 km long
even though sedimentation and erosion start 10 Myr earlier. basement thrust sheet (Fig. 5a). After the increase in sedi-
Significant differences can only be seen between the pro- mentation rate, Thrust B remained active for about 8 Myr and
foreland basins, after the base level of sedimentation is raised accumulated 22 km of displacement before Thrust C created
(simulated here by an increase in the sedimentation base level a new, 75 km long thrust sheet in the footwall of Thrust B
over a 0.5 Myr period) to mimic the transition from an un- (Fig. 5b).
derfilled to an overfilled foreland basin (Fig. 3h–i; Movie 3 The subsequent basement thrust-sheet sequence consists
in the Supplement). The base-level change results in a tem- of longer thrust sheets (on average 45 km instead of the pre-
porary (approximately 2 Myr long) increase in the maximum vious 40 km) that are active for longer times (on average 6.5
Solid Earth, 10, 391–404, 2019 www.solid-earth.net/10/391/2019/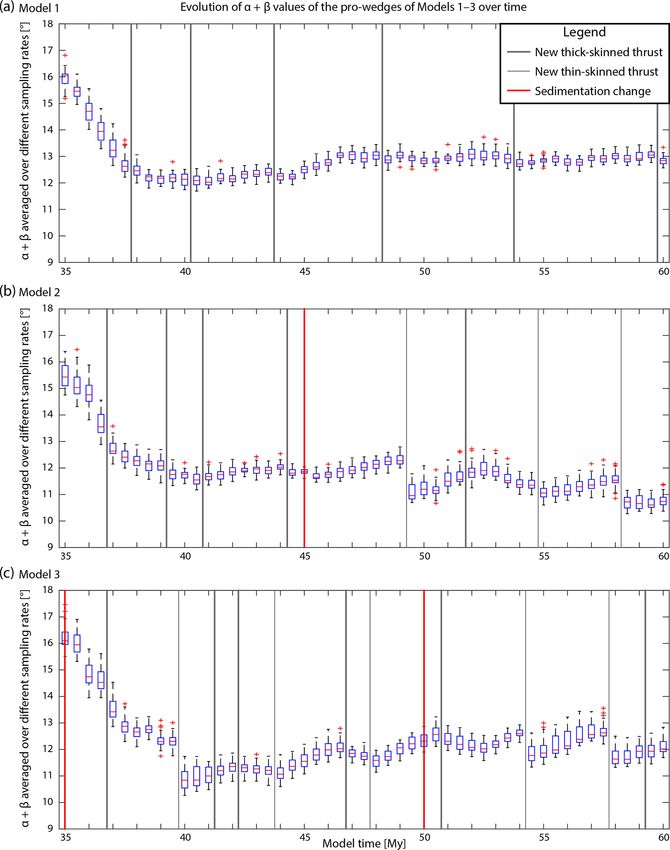
Z. Erdős et al.: Control of increased sedimentation on orogenic fold-and-thrust belt structure                                 397

instead of 4 Myr) compared with the model behavior before              Due to the complexity of the surface topography (and to a
the increase in sedimentation rate (Fig. 3h–i; Movie 3 in the       lesser extent the basal décollement), representing the entire
Supplement).                                                        wedge with a single α–β pair is notoriously difficult. In this
                                                                    study, we calculated multiple sets of α and β values along the
                                                                    wedge using a range of different sampling intervals for every
4   Comparison with critical-taper theory                           time slice of the model (e.g., Fig. 6). Subsequently we calcu-
                                                                    lated the mean α and β values for each sampling interval and
We attempt to explain the observed behavior of our mod-             visualized the resulting mean of these sampling intervals us-
els at the scale of the entire wedge in terms of critical-taper     ing box plots (see Fig. 7). This analysis allows us to identify
theory (Chapple, 1978; Dahlen, 1990; Davis et al., 1983).           temporal trends that are persistent through a range of charac-
According to this theory, a wedge will evolve towards a crit-       teristic length scales. We tested over 100 different sampling
ical state characterized by being at the verge of brittle failure   intervals from 2.5 to 100 km and decided to use a subset of 41
both internally and at its base. As a consequence, equilib-         of these, ranging from 10 to 30 km, to create the plots for this
rium is reflected by a self-similarly growing wedge with a          study. Note that the trends described here were also present
stable surface slope (α) and detachment dip (β) (Davis et al.,      at the higher and lower ends of the sampling scale.
1983); such a wedge should react instantaneously to changes            For brevity, we only discuss the implications of the above
in stress regime. Lateral variations in the structure and sur-      detailed critical-taper analysis. The individual α, β, and α+β
face slope of European Alpine foreland have been explained          vs. model time plots and their detailed interpretations can be
using critical-taper theory (von Hagke et al., 2014, and ref-       found in the Supplement, along with a detailed description
erences therein). However, this purely brittle continuum-           of Models 1.1 and 2.1. Generally, the models without sedi-
mechanical theory has limited applicability to our model due        mentation conform to the predictions of critical-taper theory.
to the presence of viscous plastic deformation and strain-          After an initial mountain-building phase, α + β stabilizes at
weakening materials (Buiter, 2012; Simpson, 2011). Simp-            a roughly stable level and is only slightly perturbed around
son (2011) argued that an elastic–plastic wedge is often well       individual basement thrusting events (see Fig. 7a). Erosion
below the critical stress threshold locally. Hence, we explore      slightly increases α and reduces β, keeping α + β at a con-
here whether the large-scale deformation of our model oro-          stant value. The increase in α is a result of the development of
gens exhibits a behavior that is consistent with critical-taper     a narrower and steeper wedge with a narrower foreland basin.
theory predictions.                                                 Conversely, the decrease in β is partly due to decreased topo-
   When we consider a brittle Coulomb wedge, a sudden in-           graphic loading: models with erosion do not produce topog-
crease in sedimentation rate will result in the filling up of       raphy higher than 6 km, while models without erosion can
the previously unfilled (or underfilled) foreland basin, reduc-     grow topography as high as 8 km.
ing α significantly while moderately increasing β due to the           When sedimentation is included in the models, the behav-
loading of the basin. Critical-taper theory predicts that such      ior is considerably more complex and the importance of the
a sudden change in the taper angles, without a simultaneous         initiation of new thin-skinned frontal thrusts becomes more
modification of the mechanical properties of the wedge or the       pronounced (Fig. 7b and c). As the orogenic foreland – and
basal detachment, should drive the wedge towards a subcriti-        hence the wedge itself – grows wider, the crustal load exerted
cal state. Subsequently, the wedge needs to deform (thicken)        by the orogen grows as well. The loading increases β until
internally to increase its taper angle until it reaches critical    the deformation moves to a new frontal thrust, further widen-
state once again (see also Willett and Schlunegger, 2010).          ing the wedge and incorporating a previously undeformed,
   We analyze five models to assess whether our pro-wedges          gently dipping basement, which instantaneously reduces β.
replicate the above predictions of critical-taper theory. In or-    These cycles in β are superimposed on top of a long-term
der to isolate the potentially tangled effects of erosion and       decreasing trend, likely resulting from the wedge becoming
sedimentation, we include in this analysis a model with ero-        larger, warmer, and easier to deform over time. In the mean-
sion but no sedimentation (Model 1.1) and one with sedimen-         time, the wide and low-relief orogenic foreland thrust belts
tation but no erosion (Model 2.1). We define the wedge as the       generally decrease α to very low (0.5–2◦ ) values.
zone between the surface trace of the frontal (thin-skinned)           The observed cyclic behavior, in which the deformation
thrust and the lower-crustal indenter of the overriding plate       periodically migrates to a new frontal thrust, is similar to
(denoted S point in Fig. 6). The basal slope β is calculated        the “punctuated thrust deformation” described by Hoth et
using the top of the lower crust as a reference horizon. We         al. (2007) and Naylor and Sinclair (2007), whereby the posi-
acknowledge that these definitions are arbitrary and in some        tion of the deformation front fluctuates as successive thrusts
cases at odds with assumptions of critical-taper theory (i.e.,      are gradually incorporated into the wedge. This discrete,
the top of the lower crust separates the ductile middle crust       punctuated behavior causes the wedge to oscillate around
and the brittle lower crust), but these definitions allow for a     a critical-taper value rather than staying in complete equi-
consistent derivation of α and β values for each time slice in      librium through time. Here we have shown, moreover, how
every model.

www.solid-earth.net/10/391/2019/                                                                 Solid Earth, 10, 391–404, 2019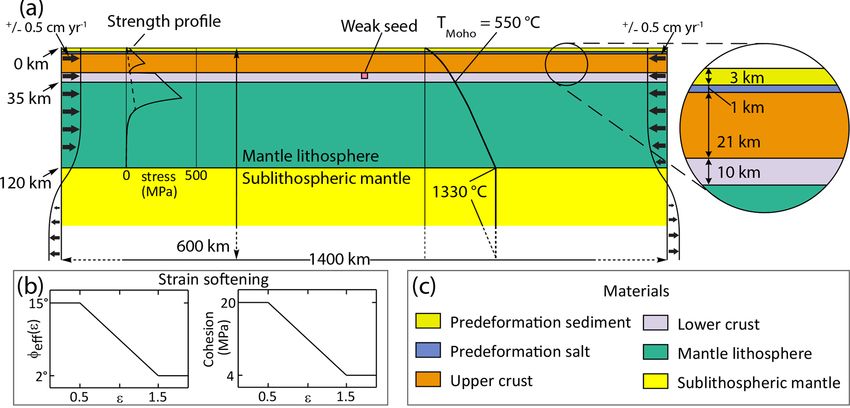
398                           Z. Erdős et al.: Control of increased sedimentation on orogenic fold-and-thrust belt structure

Figure 5. The evolution of Model 3 around the time of increase in sedimentation rate. The material coloring scheme is identical to that
used in Fig. 2. (a) Model 3 at 51 Myr (1x = 210 km), the time of increase in sedimentation rate. White marks show the length of the active
external basement thrust sheet (thrusting along Thrust B). The length calculation method is the same as in Fig. 4. Red marks show the
amount of displacement along the last abandoned thrust (Thrust A). (b) Model 3 at 59 Myr (1x = 290 km) at the time of the initiation of
the first basement thrust sheet after the increase in sedimentation rate. White marks show the length of the active external basement thrust
sheet (thrusting along Thrust C). Red marks show the amount of displacement along the just-abandoned thrust (Thrust B corresponding to
Thrust B in a). Further towards the orogenic hinterlands the steepening Thrust A is shown (corresponding to Thrust A in a).

erosion and sedimentation influence this behavior consistent            thick-skinned thrusts on top of the décollement. Our ther-
with the predictions of critical-taper theory.                          momechanical models are therefore in agreement with the
   We have created animations showing the temporal and                  analytical results shown by Willett and Schlunegger (2010).
spatial (along-profile) variations of α, β, an arbitrary metric
of the shallow strain rate, and the topography for Models 1
and 2 (see Movies 6 to 9 in the Supplement). Our aim with               5   Discussion
this exercise was to establish whether the changes in topog-
raphy (α, β) are driven by strain-rate changes or the other             The first-order evolution of all three presented models is sim-
way around. A key observation here is that the evolution of             ilar, regardless of the imposed erosion–sedimentation sce-
α in Model 1 (and to a lesser extent in Model 2) shows a par-           nario. First, an asymmetric rift is formed with a wider and a
ticular pattern: a new thrust is activated after α of the region        narrower passive margin consisting of rotated upper-crustal
around the active fault reaches ∼ 10◦ . After the new thrust            fault blocks on either side of an upwelling sublithospheric
is activated, this high α rapidly decays. This suggests that            mantle. This rifting phase is followed immediately by the in-
α ≈ 10◦ can locally be seen as a critical value, which trig-            version of the large normal faults. After full inversion, a cen-
gers the formation of a new frontal thrust. This new thrust is          tral keystone structure is uplifted, with a crustal-scale thrust
generally activated close to the tip of the active thin-skinned         on either side of it. As the rift was asymmetric, the keystone
deformation front.                                                      structure and its base are also asymmetric. The subduction
   When sedimentation is included (Model 2), the high-α                 interface is consistently formed in the basement of the ini-
regions are more persistent. We argue that, since the sedi-             tially wider passive margin. After the polarity of subduction
ments are stifling the foreland basin, there is significantly less      is established, a new basement thrust is formed in the sub-
room for thin-skinned deformation that would otherwise cre-             ducting pro-wedge lithosphere on average every 3.1 Myr (in
ate a gentler slope around the surface trace of the basement            the case of Model 1) in an outward-propagating sequence.
thrusts. This results in negative-α basins sliding between              As the initial model setup is completely symmetrical, the ori-

Solid Earth, 10, 391–404, 2019                                                                      www.solid-earth.net/10/391/2019/
Z. Erdős et al.: Control of increased sedimentation on orogenic fold-and-thrust belt structure                                                  399

Figure 6. Example of α and β sampling routine. S point: internal limit of the wedge considered for critical-taper analysis, located at the tip
of the lower-crustal indenter of the overriding plate. Wedge tip: the outer tip of the wedge considered for critical-taper analysis, located at the
tip of the orogenic deformation zone. Red dots: elevation sampling points along the wedge for a given sampling interval. For each sampling
interval, α is first calculated for every adjacent point (e.g., α11 , α12 ) before we calculate the mean (α1 ) of these local, individual α values for
the entire wedge. The process is then repeated for all sampling intervals (e.g., α21 ). Blue dots: depth sampling points along the wedge for a
given sampling interval. β is calculated in the same manner as α (described above).

entation of the initial asymmetric rift and, through that, the               Upon initiation (or increase) of sedimentation in the foreland
polarity of the subduction are decided randomly. The main                    basin, the work required to create a new basement thrust is
differences between the models are the position and timing                   suddenly increased as the sediments effectively expand the
of thrust activations.                                                       thickness of the rock column overlying the mid-crustal weak
   The step-like migration of the deformation front and, to                  zone (Erdős et al., 2015). This increased resistance against
a lesser extent, the distal edge of the foreland are present                 the formation of a new basement thrust breaks the previous
throughout all our model experiments, but are enhanced                       cyclic behavior and delays the propagation of the basement
when a change in the sedimentation history occurs. In                        deformation front into the foreland basin.
Model 2, the distal edge of the foreland basin advances
rapidly after the onset of sedimentation, while the basement
                                                                             5.1    Comparison with the Alps
deformation front remains stationary (Fig. 8b). After this
transitional period, lasting about 2 Myr, a new propagation
order is established with longer basement thrust sheets (on                  The models presented here capture a number of first-order
average 46 instead of 40 km) that stay active for longer times               features of the Western European Alps (Schmid and Kissling,
(on average 7 instead of 4.5 Myr). In Model 3, two such tran-                2000; Schmid et al., 2017) (Fig. 1), including the follow-
sitional periods can be observed (Fig. 8c): one at the onset of              ing: (a) a major step in Moho depth between the Euro-
sedimentation (35 Ma; see caption) and one at the increase                   pean and Adriatic (or Apulian) plates; (b) strong decoupling
in sedimentation rate (20 Ma; see caption). During this latter               between the upper and lower crust, with the lower crust
transition, the distal edge of the foreland basin rapidly ad-                under-thrusting and subducting with the mantle lithosphere;
vances again (approximately 150 km in 2.5 Myr), while the                    (c) stacking of basement thrust sheets in the central part of
outermost basement thrust remains active for 4 Myr longer                    the orogen; (d) shallow emplacement of lithospheric mantle
than the previous frontal thrusts (7.5 Myr instead of the pre-               material in the retro-wedge, with a sliver of mantle mate-
vious 3.5 Myr).                                                              rial reaching the surface (Fig. 3f, g, i), loosely resembling
   In general, the location of a newly initiated in-sequence                 the Ivrea body and Sesia–Lanzo zone, respectively; and (e) a
basement thrust corresponds to the point at which the total                  generally asymmetric orogen with deformation stepping out
work needed to slide on the viscous mid-crustal weak zone                    much further on the pro-side than on the retro-side. The pres-
and to break through the upper crust is lower than the work                  ence of a weak décollement below the pre-orogenic succes-
needed to maintain deformation on the existing thrust front                  sion in this model is also characteristic of the western Alpine
(Erdős et al., 2015; Fillon et al., 2012; Hardy et al., 1998).              foreland and allows for the coexistence of thin-skinned and
                                                                             thick-skinned tectonics (see, e.g., Erdős et al., 2015), a fea-

www.solid-earth.net/10/391/2019/                                                                               Solid Earth, 10, 391–404, 2019
400 Z. Erdős et al.: Control of increased sedimentation on orogenic fold-and-thrust belt structure Figure 7. Plots of α + β vs. model time for Models 1 (a), 2 (b), and 3 (c). For each time slice, the α and β values were determined using a range of sampling intervals. The box plots present the average α + β, α, and β values of these individual sampling intervals calculated for the entire wedge. On each box, the central mark is the median, the edges of the box are the 25th and 75th percentiles, and the whiskers extend to the most extreme data points considered not to be outliers. The outliers are plotted individually. ture that is much less prominent in the Eastern Alps, where tively ruptured, creating two small separate ocean basins that the décollement is absent (Schmid et al., 2004). mimic the pre-orogenic presence of the Piemont–Ligurian The initial extensional phase allows for the creation and Valais basins in the Alpine domain (Stampfli et al., of physically self-consistent inherited structural weakness 2001). It must be pointed out that running the models fur- zones, as observed in most orogens. After extending the ther in extensional mode in this setup is not viable because model for 15 Myr, the continental lithosphere has effec- there is no built-in mechanism for the creation of oceanic Solid Earth, 10, 391–404, 2019 www.solid-earth.net/10/391/2019/
Z. Erdős et al.: Control of increased sedimentation on orogenic fold-and-thrust belt structure                                   401

                                                                       the increasing relief and changing climate in the Alpine hin-
                                                                       terland (Schlunegger et al., 1997; Schlunegger and Norton,
                                                                       2015), was a significant factor in the mid-Oligocene stalling
                                                                       of thrust-front advance observed in the western section of
                                                                       the North Alpine Foreland. Note that this behavior is not ob-
                                                                       served further east along the foreland where the amount of
                                                                       orogen-perpendicular shortening is less and the decoupling
                                                                       salt layer is absent from the foreland basin (Schmid et al.,
                                                                       2004). This could well limit the distance to which the thin-
                                                                       skinned deformation of the foreland fold-and-thrust belt can
                                                                       reach.
                                                                          The shortening rates, timing of orogenesis, and transi-
                                                                       tion from an underfilled to an overfilled basin in the case
                                                                       of Model 3 are based on observations in the northern fore-
                                                                       land of the Western Alps. The timescales of thrust and basin
                                                                       evolution of the models are comparable to those of the west-
                                                                       ern Alpine system. The jump in thrust-front position is of the
                                                                       order of 100 km both in the model and nature, but the stag-
                                                                       nation in the Alps lasted about twice as long as observed in
                                                                       the models.
                                                                          We also note that the stepwise behavior shown by Sinclair
                                                                       (1997) is present in our models even if there is no change in
                                                                       the deposition scenario applied. However, we argue that an
                                                                       increase in the amount of material deposited in the foreland
                                                                       basin will necessary result in stalling of the basement thrust-
                                                                       front propagation, while it will also allow for the distal edge
                                                                       of the foreland basin to migrate further onto the downgoing
                                                                       plate.
Figure 8. Thrust-front propagation and sediment onlap on the distal
edge of the foreland basin vs. time (a) in the Western Alps (redrawn
after Sinclair, 1997) (b) derived from Model 2 and (c) derived from
                                                                       5.2   Implications for other mountain belts
Model 3. The thin dashed line in (b) and (c) shows the thrust-front
propagation pattern of Model 1. Note that in (b) and (c) the time      An early synthetic stratigraphic model of foreland-basin de-
axis of the models is reversed from Myr (forward model time) to        velopment (Flemings and Jordan, 1989) showed that periph-
Ma (time before “present”) to fit the original axis of the Western     eral orogenic foreland basins have a tendency to evolve from
Alps.
                                                                       an underfilled into an overfilled state. Numerous studies fo-
                                                                       cusing on the stratigraphic infill of natural foreland basins
                                                                       (e.g., Allen et al., 1991; DeCelles and Burden, 1992; Quinlan
lithosphere. The effects of a thermal relaxation phase were            and Beaumont, 1984) have demonstrated the merits of this
not explored either, as potentially important mechanisms like          model. Moreover, as the internal part of the orogen grows,
strain healing are not yet implemented in the model.                   more surface area reaches higher elevations, resulting in a
   The basement under the pro-foreland basin is rather                 potential increase in erosion rates and, consequently, sedi-
smooth, dipping on average 3◦ towards the orogen at the                ment flux into the foreland basin (Simpson, 2006a, b; Sin-
time slice captured in Fig. 4b (which corresponds best to the          clair et al., 2005). Hence, the orogenic foreland-basin evo-
present state of the North Alpine Foreland Basin). This value          lution scenario described in this study should be applica-
is in good agreement with those inferred from the interpre-            ble to a wide range of orogens around the globe. A prime
tation of seismic reflection lines (Burkhard and Sommaruga,            example may be the southern Pyrenean (pro-)foreland fold-
1998; Sommaruga, 1999).                                                and-thrust belt, where a middle Eocene increase in sedimen-
   The increase in sedimentation in Models 2 and 3 links               tation rate was accompanied by stalling of the thrust front
basement thrust-front propagation and the onlap of sediments           (Sinclair et al., 2005). Based on their stratigraphic models,
onto the foreland, as observed in the North Alpine Foreland            Flemings and Jordan (1989) proposed that changes in the
Basin (e.g., Sinclair, 1997; Fig. 5). Both deposition scenarios        rate of thrust loading, climate, or source-rock lithology (all
lead to longer frontal basement thrusts that remain active for         present in their models through surface-process transport co-
a longer period before a new basement thrust is formed. This           efficients) can cause the shift from underfilled to overfilled
suggests that increased sedimentation, which resulted from             basins. Our model results imply that there is a strong feed-

www.solid-earth.net/10/391/2019/                                                                    Solid Earth, 10, 391–404, 2019
402 Z. Erdős et al.: Control of increased sedimentation on orogenic fold-and-thrust belt structure
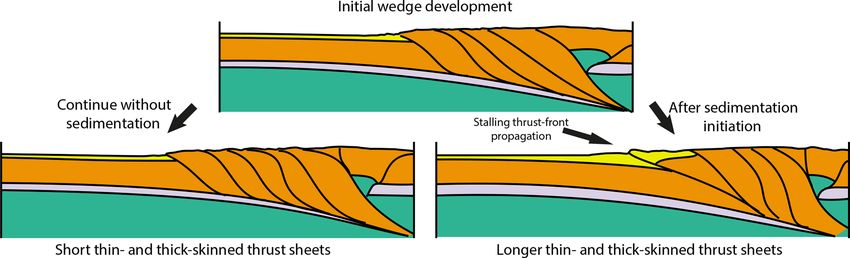
Figure 9. Conceptual figure showing the difference between the evolution of a mountain belt with and without intensive late-stage sedimen-
tation. The cartoons are generalizations of our model results, depicting them after the same amount of convergence.
back between these potential controls and the state of the al., 2018f); β, shallow strain rate, and topographic evolu-
basin fill. tion of Model 1 (https://doi.org/10.5446/38578; Erdős et al.,
2018h); α, shallow strain rate, and topographic evolution of
Model 2 (https://doi.org/10.5446/38577; Erdős et al., 2018g);
β, shallow strain rate, and topographic evolution of Model 2
6 Conclusions
(https://doi.org/10.5446/38579; Erdős et al., 2018i).
The thermomechanical models presented here provide first-
order insights into the intricate relationship between chang-
Supplement. The supplement related to this article is available
ing sedimentation rates and deformation patterns in orogenic online at: https://doi.org/10.5194/se-10-391-2019-supplement.
forelands (Fig. 9). Our models show that a sudden increase
in sedimentation rate disrupts thrust-front and foreland-basin
propagation patterns. The outermost basement thrust remains Author contributions. ZE and RSH designed the experimental
active for a significantly longer time and accumulates more setup. ZE ran the model experiments and all three authors con-
deformation than previous thrusts developed during periods tributed to the interpretation of the results. ZE prepared the paper
of lower sediment input, before deformation steps out again with contributions from both coauthors.
under the sediment-loaded foreland basin. After determining
α and β values for each model and examining their evolution
over time, we conclude that they are broadly consistent with Competing interests. The authors declare that they have no conflict
predictions from critical-taper theory, despite the more com- of interest.
plex and realistic rheology included in our models. However,
when sedimentation is included, critical-taper theory cannot
be used to predict the timing and location of the formation of Acknowledgements. We thank Fritz Schlunegger for his construc-
new basement thrusts. tive comments at an early stage of this project and Stefan Schmid for
The results are in good agreement with observations from providing the latest version of the Alpine cross section assembled
by his group. We also thank Mary Ford and Christoph von Hagke
the Western Alps and the North Alpine Foreland Basin,
for their constructive feedback on a previous version of this paper.
where deformation remained relatively stable for an extended
period of time after the foreland basin shifted from an under-
filled to a filled–overfilled state. They should also be appli- Review statement. This paper was edited by Bernhard Grasemann
cable to other orogens around the globe. and reviewed by Xiaodong Yang and one anonymous referee.
Data availability. The data sets for this article are available as
video supplements in the Supplement and via the following DOIs:
evolution of Model 1 (https://doi.org/10.5446/38571; Erdős et al.,
2018a); evolution of Model 2 (https://doi.org/10.5446/38572; Erdős References
et al., 2018b); evolution of Model 3 (https://doi.org/10.5446/38576;
Erdős et al., 2018c); evolution of Model 1.1 Adam, J., Klaeschen, D., Kukowski, N., and Flueh, E.:
(https://doi.org/10.5446/38573; Erdős et al., 2018d); evo- Upward delamination of Cascadia Basin sediment in-
lution of Model 2.1 (https://doi.org/10.5446/38574; Erdős fill with landward frontal accretion thrusting caused by
et al., 2018e); α, shallow strain rate, and topographic evo- rapid glacial age material flux, Tectonics, 23, TC3009,
lution of Model 1 (https://doi.org/10.5446/38575; Erdős et https://doi.org/10.1029/2002TC001475, 2004.
Solid Earth, 10, 391–404, 2019 www.solid-earth.net/10/391/2019/Z. Erdős et al.: Control of increased sedimentation on orogenic fold-and-thrust belt structure 403 Allen, P. A. and Homewood, P.: Foreland Basins, International As- of mountain belts, J. Geophys. Res.-Sol. Ea., 120, 5362–5377, sociation of Sedimentologists, Special Publication no. 8, Black- https://doi.org/10.1002/2014jb011785, 2015. well Scientific Publications, Oxford, 1986. Erdős, Z., Huismans, R. S., and van der Beek, P.: Evolution of Allen, P. A., Crampton, S. L., and Sinclair, H. D.: The inception Model 1, https://doi.org/10.5446/38571, 2018a. and early evolution of the North Alpine Foreland Basin, Switzer- Erdős, Z., Huismans, R. S., and van der Beek, P.: Evolution of land, Basin Res., 3, 143–163, https://doi.org/10.1111/j.1365- Model 2, https://doi.org/10.5446/38572, 2018b. 2117.1991.tb00124.x, 1991. Erdős, Z., Huismans, R. S., and van der Beek, P.: Evolution of Beaumont, C., Fullsack, P., and Hamilton, J.: Erosional control of Model 3, https://doi.org/10.5446/38576, 2018c. active compressional orogens, in: Thrust Tectonics, edited by: Erdős, Z., Huismans, R. S., and van der Beek, P.: Evolution of McClay, K. R., Chapman & Hall, London, 1–18, 1992. Model 1.1, https://doi.org/10.5446/38573, 2018d. Berger, J.-P., Reichenbacher, B., Becker, D., Grimm, M., Grimm, Erdős, Z., Huismans, R. S., and van der Beek, P.: Evolution of K., Picot, L., Storni, A., Pirkenseer, C., and Schaefer, A.: Eocene- Model 2.1, https://doi.org/10.5446/38574, 2018e. Pliocene time scale and stratigraphy of the Upper Rhine Graben Erdős, Z., Huismans, R. S., and van der Beek, P.: Model 1: α- (URG) and the Swiss Molasse Basin (SMB), Int. J. Earth Sci., Topography-Strain rate, https://doi.org/10.5446/38575, 2018f. 94, 711–731, 2005. Erdős, Z., Huismans, R. S., and van der Beek, P.: Model 2: α- Bonnet, C., Malavieille, J., and Mosar, J.: Interactions between tec- Topography-Strain rate, https://doi.org/10.5446/38577, 2018g. tonics, erosion, and sedimentation during the recent evolution of Erdős, Z., Huismans, R. S., and van der Beek, P.: Model 1: β- the Alpine orogen: Analogue modeling insights, Tectonics, 26, Topography-Strain rate, https://doi.org/10.5446/38578, 2018h. TC6016, https://doi.org/10.1029/2006tc002048, 2007. Erdős, Z., Huismans, R. S., and van der Beek, P.: Model 2: β- Braun, J. and Yamato, P.: Structural evolution of a three- Topography-Strain rate, https://doi.org/10.5446/38579, 2018i. dimensional, finite-width crustal wedge, Tectonophysics, 484, Fillon, C., Huismans, R. S., and van der Beek, P.: Syntectonic sed- 181–192, https://doi.org/10.1016/j.tecto.2009.08.032, 2010. imentation effects on the growth of fold-and-thrust belts, Geol- Buiter, S. J. H.: A review of brittle compressional ogy, 41, 83–86, https://doi.org/10.1130/g33531.1, 2012. wedge models, Tectonophysics, 530–531, 1–17, Fillon, C., Huismans, R. S., van der Beek, P., and Muñoz, J. A.: Syn- https://doi.org/10.1016/j.tecto.2011.12.018, 2012. tectonic sedimentation controls on the evolution of the southern Burkhard, M. and Sommaruga, A.: Evolution of the western Swiss Pyrenean fold-and-thrust belt: Inferences from coupled tectonic- Molasse basin: structural relations with the Alps and the Jura surface processes models, J. Geophys. Res.-Sol. Ea., 118, 5665– belt, Geological Society, London, Special Publications, 134, 5680, https://doi.org/10.1002/jgrb.50368, 2013. 279–298, 1998. Flemings, P. B. and Jordan, T. E.: A synthetic stratigraphic model Chapple, W. M.: Mechanics of thin-skinned fold-and-thrust belts, of foreland basin development, J. Geophys. Res., 94, 3851–3866, Geol. Soc. Am. Bull., 89, 1189–1198, 1978. 1989. Dahlen, F. A.: Critical taper model of fold-and-thrust belts and ac- Gleason, G. C. and Tullis, J.: A Flow Law for Dislocation Creep cretionary wedges, Annu. Rev. Earth Pl. Sc., 18, 55–99, 1990. of Quartz Aggregates Determined with the Molten-Salt Cell, Davis, D., Suppe, J., and Dahlen, F. A.: Mechanics of fold-and- Tectonophysics, 247, 1–23, 1995. thrust belts and accretionary wedges, J. Geophys. Res., 88, 1153– Hardy, S., Duncan, C., Masek, J., and Brown, D.: Minimum work, 1172, 1983. fault activity and the growth of critical wedges in fold and thrust DeCelles, P. and Burden, E. T.: Non-marine sedimentation in the belts, Basin Res., 10, 365–373, 1998. overfilled part of the Jurassic-Cretaceous Cordilleran foreland Homewood, P., Allen, P. A., and Williams, G. D.: Dynamics of the basin: Morrison and Cloverly Formations, central Wyoming, Molasse Basin of western Switzerland, Int. As. Sed., 8, 199–217, USA, Basin Res., 4, 291–313, 1992. 1986. DeCelles, P. G. and Giles, K. A.: Foreland basin systems, Basin Hoth, S., Hoffmann-Rothe, A., and Kukowski, N.: Frontal ac- Res., 8, 105–123, 1996. cretion: An internal clock for bivergent wedge deforma- Dewey, J. F., Pitman, W. C., Ryan, W. B. F., and Bonnin, J.: Plate tion and surface uplift, J. Geophys. Res., 112, B06408, tectonics and the evolution of the Alpine system, Geol. Soc. Am. https://doi.org/10.1029/2006jb004357, 2007. Bull., 84, 3137–3180, 1973. Huismans, R. S., Buiter, S. J. H., and Beaumont, C.: Effect of Duerto, L. and McClay, K.: The role of syntectonic sedi- plastic-viscous layering and strain softening on mode selection mentation in the evolution of doubly vergent thrust wedges during lithospheric extension, J. Geophys. Res., 110, B02406, and foreland folds, Mar. Petrol. Geol., 26, 1051–1069, https://doi.org/10.1029/2004jb003114, 2005. https://doi.org/10.1016/j.marpetgeo.2008.07.004, 2009. Jammes, S. and Huismans, R. S.: Structural styles of moun- Erdős, Z.: Coupled surface process and tectonic modelling of tain building: Controls of lithospheric rheologic stratification extension-inversion tectonics in the Pyrenees, PhD Thesis, Uni- and extensional inheritance, J. Geophys. Res., 111, B10403, versity of Bergen, Norway, ISBN 978-82-308-2829-8, 2014. https://doi.org/10.1029/2012jb009376, 2012. Erdős, Z., Huismans, R. S., van der Beek, P., and Thieulot, C.: Ex- Karato, S. and Wu, P.: Rheology of the upper mantle: a synthesis, tensional inheritance and surface processes as controlling factors Science, 260, 771–778, 1993. of mountain belt structure, J. Geophys. Res.-Sol. Ea., 119, 9042– Konstantinovskaia, E. and Malavieille, J.: Erosion and ex- 9061, https://doi.org/10.1002/2014jb011408, 2014. humation in accretionary orogens: Experimental and geolog- Erdős, Z., Huismans, R. S., and van der Beek, P.: First-order ical approaches, Geochem. Geophys. Geosyst., 6, Q02006, control of syntectonic sedimentation on crustal-scale structure https://doi.org/10.1029/2004gc000794, 2005. www.solid-earth.net/10/391/2019/ Solid Earth, 10, 391–404, 2019
404                            Z. Erdős et al.: Control of increased sedimentation on orogenic fold-and-thrust belt structure

Koons, P. O.: Two-sided orogen: Collision and erosion from the           Simpson, G. D. H.: Mechanics of non-critical fold–thrust belts
   sand box to the Southern Alps, New Zealand, Geology, 18, 679–            based on finite element models, Tectonophysics, 499, 142–155,
   682, 1990.                                                               https://doi.org/10.1016/j.tecto.2011.01.004, 2011.
Kuhlemann, J. and Kempf, O.: Post-Eocene evolution of the                Sinclair, H. D.: Tectonostratigraphic model for underfilled periph-
   North Alpine Foreland Basin and its response to Alpine tecton-           eral foreland basins: An Alpine perspective, Geol. Soc. Am.
   ics, Sediment. Geol., 152, 45–78, https://doi.org/10.1016/S0037-         Bull., 109, 324–346, 1997.
   0738(01)00285-8, 2002.                                                Sinclair, H. D. and Allen, P. A.: Vertical versus horizontal motions
Malavieille, J.: Impact of erosion, sedimentation, and structural           in the Alpine orogenic wedge: stratigraphic response in the fore-
   heritage on the structure and kinematics of orogenic wedges:             land basin, Basin Res., 4, 215–232, 1992.
   Analog models and case studies, GSA Today, 20, 4–10,                  Sinclair, H. D., Gibson, M., Naylor, M., and Morris, R. G.: Asym-
   https://doi.org/10.1130/gsatg48a.1, 2010.                                metric growth of the Pyrenees revealed through measurement
Mugnier, J. L., Baby, P., Colletta, B., Vinour, P., Bale, P., and           and modeling of orogenic fluxes, Am. J. Sci., 305, 369–406,
   Leturmy, P.: Thrust geometry controlled by erosion and sedimen-          https://doi.org/10.2475/ajs.305.5.369, 2005.
   tation: A view from analogue models, Geology, 25, 427–430,            Sommaruga, A.: Decollement tectonics in the Jura fore-
   1997.                                                                    land fold-and-thrust belt, Mar. Petrol. Geol., 16, 111–134,
Naylor, M. and Sinclair, H. D.: Punctuated thrust deformation in the        https://doi.org/10.1016/S0264-8172(98)00068-3, 1999.
   context of doubly vergent thrust wedges: Implications for the lo-     Stampfli, G., Mosar, J., Favre, P., Pillevuit, A., and Vannay, J. C.:
   calization of uplift and exhumation, Geology, 35, 559–562, 2007.         Permo-Mesozoic evolution of the western Tethys realm: the Neo-
Pfiffner, O. A.: Evolution of the north Alpine foreland basin in the        Tethys East Mediterranean Basin connection, in: Peri-Tethys
   Central Alps, Int. As. Sed., 8, 219–228, 1986.                           Memoir 6: Peri-Tethyan Rift/Wrench Basins and Passive Mar-
Quinlan, G. M. and Beaumont, C.: Appalachian thrusting, litho-              gins, edited by: Ziegler, P. A., Mémoire du Musée National
   spheric flexure, and the Paleozoic stratigraphy of the Eastern In-       d’Histoire Naturelle, Paris, 51–108, 2001.
   terior of North America, Can. J. Earth Sci., 21, 973–996, 1984.       Stockmal, G. S., Beaumont, C., Nguyen, M., and Lee, B.:
Roure, F.: Foreland and Hinterland basins: what con-                        Mechanics of thin-skinned fold-and-thrust belts: Insights
   trols their evolution?, Swiss J. Geosci., 101, 5–29,                     from numerical models, Geol. S. Am. S., 433, 63–98,
   https://doi.org/10.1007/s00015-008-1285-x, 2008.                         https://doi.org/10.1130/2007.2433(04), 2007.
Schlunegger, F. and Norton, K. P.: Climate vs. tectonics: the            Stolar, D. B., Willett, S. D., and Roe, G. H.: Climatic and tec-
   competing roles of Late Oligocene warming and Alpine                     tonic forcing of a critical orogen, Geol. S. Am. S., 398, 241–250,
   orogenesis in constructing alluvial megafan sequences in                 https://doi.org/10.1130/2006.2398(14), 2006.
   the North Alpine foreland basin, Basin Res., 27, 230–245,             Storti, F. and McClay, K.: Influence of syntectonic sedimentation on
   https://doi.org/10.1111/bre.12070, 2015.                                 thrust wedges in analog models, Geology, 23, 999–1002, 1995.
Schlunegger, F., Jordan, T. E., and Klaper, E. M.: Controls of ero-      Thieulot, C.: FANTOM: Two- and three-dimensional numer-
   sional denudation in the orogen on foreland basin evolution: The         ical modelling of creeping flows for the solution of ge-
   Oligocene central Swiss Molasse Basin as an example, Tecton-             ological problems. Phys. Earth Planet. In., 188, 47–68,
   ics, 16, 823–840, 1997.                                                  https://doi.org/10.1016/j.pepi.2011.06.011, 2011.
Schmid, S. M. and Kissling, E.: The arc of the western Alps in the       von Hagke, C., Oncken, O., and Evseev, S.: Critical taper
   light of geophysical data on deep crustal structure, Tectonics, 19,      analysis reveals lithological control of variations in detach-
   62–85, https://doi.org/10.1029/1999tc900057, 2000.                       ment strength: An analysis of the Alpine basal detachment
Schmid, S. M., Fugenschuh, B., Kissling, E., and Schuster, R.: Tec-         (Swiss Alps), Geochem. Geophys. Geosyst., 15, 176–191,
   tonic map and overall architecture of the Alpine orogen, Eclo-           https://doi.org/10.1002/2013gc005018, 2014.
   gae Geol. Helv., 97, 93–117, https://doi.org/10.1007/s00015-          Whipple, K. X.: The influence of climate on the tectonic
   004-1113-x, 2004.                                                        evolution of mountain belts, Nat. Geosci., 2, 97–104,
Schmid, S. M., Kissling, E., Diehl, T., van Hinsbergen, D. J. J.,           https://doi.org/10.1038/ngeo413, 2009.
   and Molli, G.: Ivrea mantle wedge, arc of the Western Alps,           Willett, S. D.: Orogeny and orography: The effects of erosion on the
   and kinematic evolution of the Alps–Apennines orogenic system,           structure of mountain belts, J. Geophys. Res., 104, 28957–28981,
   Swiss J. Geosci., 110, 581–612, https://doi.org/10.1007/s00015-          1999.
   016-0237-0, 2017.                                                     Willett, S. D. and Schlunegger, F.: The last phase of deposition
Simpson, G. D. H.: How and to what extent does the emergence                in the Swiss Molasse Basin: from foredeep to negative-alpha
   of orogens above sea level influence their tectonic develop-             basin, Basin Res., 22, 623–639, https://doi.org/10.1111/j.1365-
   ment?, Terra Nova, 18, 447–451, https://doi.org/10.1111/j.1365-          2117.2009.00435.x, 2010.
   3121.2006.00711.x, 2006a.                                             Willett, S., Beaumont, C., and Fullsack, P.: Mechanical model for
Simpson, G. D. H.: Modelling interactions between fold-thrust               the tectonics of doubly vergent compressional orogens, Geology,
   belt deformation, foreland flexure and surface mass trans-               21, 371–374, 1993.
   port, Basin Res., 18, 125–143, https://doi.org/10.1111/j.1365-
   2117.2006.00287.x, 2006b.

Solid Earth, 10, 391–404, 2019                                                                       www.solid-earth.net/10/391/2019/
You can also read


