Low frequency seismic source investigation in volcanic environment: the Mt. Vesuvius atypical case - ADGEO
←
→
Page content transcription
If your browser does not render page correctly, please read the page content below
Adv. Geosci., 52, 29–39, 2020
https://doi.org/10.5194/adgeo-52-29-2020
© Author(s) 2020. This work is distributed under
the Creative Commons Attribution 4.0 License.

Low frequency seismic source investigation in volcanic environment:
the Mt. Vesuvius atypical case
Simona Petrosino and Paola Cusano
Istituto Nazionale di Geofisica e Vulcanologia, Sezione di Napoli – Osservatorio Vesuviano, Naples, Italy

Correspondence: Paola Cusano (paola.cusano@ingv.it)

Received: 26 March 2020 – Revised: 20 May 2020 – Accepted: 19 May 2020 – Published: 10 June 2020

Abstract. We present a detailed analysis of the low fre-           Nutt, 2005; Neuberg et al., 2000; Chouet and Matoza, 2013,
quency seismicity occurred at Mt. Vesuvius in the time range       and references therein).
2003–2018. This kind of seismicity is atypical for the vol-           Volcano-Tectonic (VT) earthquakes are similar to tectonic
cano and poorly studied, therefore we characterized it in          earthquakes, with clear and impulsive P and S onsets and
terms of spectral analysis, waveform cross-correlation, lo-        high frequency content. They result from brittle shear failure
cation and polarization properties. The different decay pat-       in the volcano edifice, with double-couple source mechanism
terns of the spectra, the existence of both earthquake fami-       (Chouet and Matoza, 2013, and references therein).
lies as well as single events, the relatively wide seismogenic        Low frequency events such as Long Period (LP), Very
volume inferred from the locations and polarization features,      Long Period (VLP) and tremor also exist and are usually as-
indicate that the events are caused by distinct source mecha-      sociated with fluid-driven processes. In particular LP events
nisms: slow brittle failure in dry rocks and resonance of fluid-   are generated by resonance in fluid-filled conduits triggered
filled cracks. On these basis, we classified the earthquakes as    by rapid pressure disturbance; their waveforms usually show
Low Frequency (LF) and Long Period (LP). Despite the dif-          emergent P arrivals, no clear S-phase and lack in high fre-
ferences between the two classes, both the event types are         quency. The LP codas often have an oscillatory pattern that
ascribable to the dynamics of the deep hydrothermal reser-         can be interpreted in terms of the fluid-driven crack model
voir which induces variations of the fluid pore pressure in        (Chouet and Matoza, 2013, and references therein). Accord-
the medium. The fluid amount involved in the generation            ing to that model, the resonance is caused by a crack wave
process, as well as the physical-chemical properties of the        generated in response to the interaction between the fluid
surrounding rocks are the essential factors that control the       and the crack walls, and trapped inside the crack itself.
occurrence of a mechanism rather than the other.                   Other possible source mechanisms involve phenomena of
                                                                   harmonic vibrations of cylindrical conduits (Neuberg et al.,
                                                                   2000), non-linear flow induced oscillations (Julian, 1994),
                                                                   self-sustained oscillations of vibrating structures generated
1   Introduction                                                   by low-dimensional non-linear dynamical systems (De Lauro
                                                                   et al., 2008; De Lauro et al., 2012; Capuano et al., 2016).
Understanding the origin of the volcanic signals and the           Several volcanic processes can produce the excitation mech-
physical processes that generate them is one of the most im-       anisms of LPs, e.g. magmatic fragmentation and degassing,
portant goal in volcano seismology. In fact, the knowledge of      self-sustained oscillations within magma flow channels, lava
the source mechanisms which act at depth represents a pow-         dome growth, brine and steam exsolvation from a magma
erful tool for the assessment of the dynamical state of a vol-     storage, deep and shallow hydrothermal activity (Chouet and
cano. Earthquakes occurring in volcanic areas show a large         Matoza, 2013, and references therein).
variety of waveforms and are characterized by a broad range           Finally, hybrid events are a mixing between LP and VT
of frequencies. They are generally classified on the basis of      features: they are characterized by high frequency onsets
the waveform shapes and the frequency content, which are           and low frequency codas, suggesting complex combinations
indicative of different kinds of source mechanisms (e.g., Mc-

Published by Copernicus Publications on behalf of the European Geosciences Union.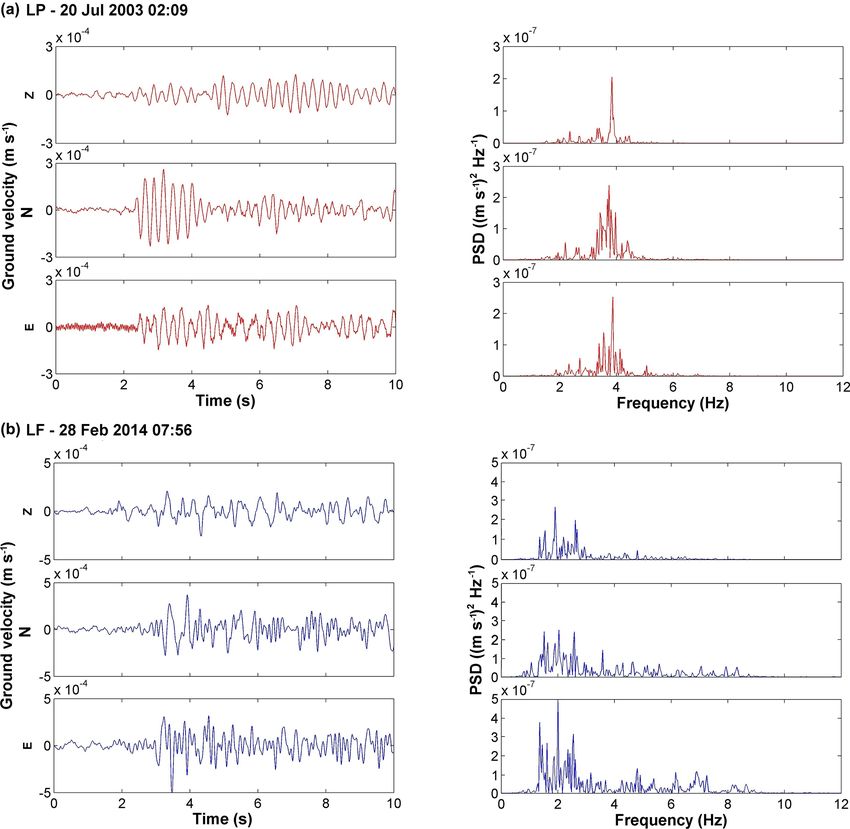
30                      S. Petrosino and P. Cusano: Low frequency seismic source investigation in volcanic environment

of source mechanisms (elastic failure, fluid oscillations) in-    highlight the possible existence of other types of events (e.g.
volved in their generation.                                       LP, LF), besides the well known VT seismicity, associated
   Recently, a class of low frequency earthquakes (hereinafter    with Mt. Vesuvius dynamics.
referred to as LF) different from the traditional LP events
has been recognised in volcanic areas such as Mt. Etna, Tur-
rialba and Mt. St. Helens (Harrington and Brodsky, 2007;          2   Geological and geophysical background
Bean et al., 2014; Harrington et al., 2015; Eyre et al., 2015).
The LFs often have identifiable P and S wave arrivals, and        Mt. Vesuvius is a composite stratovolcano, 1281 m high and
their source mechanisms follow scaling laws similar to those      10 km wide, which belongs to the Somma-Vesuvius volcanic
of tectonic earthquakes. Such characteristics suggest that not    complex, located in the Piana Campana, southern Italy. At
only fluid/solid interactions, which often strongly affect the    regional scale, there are two main fault systems: the NE-
volcano dynamics (De Lauro et al., 2018; Ricco et al., 2019;      SW striking faults and those with a NW-SE direction (Pi-
Cusano et al., 2020), but also brittle failures can generate      ochi et al., 2005, and references therein). In addition, the
seismic signals with low frequency content (Harrington and        Somma caldera and the southern and western flanks of Mt.
Benson, 2011; Bean et al., 2014). With this regard, laboratory    Vesuvius are crossed by eruptive fissures, aligned in the E–
experiments have shown that, signals associated with defor-       W and N–S directions, which coincide with the main local
mation of dry volcanic rock samples, follow the magnitude-        fault strikes. Due to the dynamics of the Adriatic slab, the
corner frequency scaling law (M0 ∝ fc−3 ) for brittle failure     compressive tectonics controls the volcanism of the Somma-
in an elastic medium with constant stress drop (Harring-          Vesuvius system (Piochi et al., 2005, and references therein).
ton and Benson, 2011). On the contrary, events occurring          Mt. Vesuvius produced at least 4 Plinian eruptions in the last
under wet conditions are not characterized by any simple          20 kyr: Pomici di Base (18–20 kyr), Mercato (8.0 kyr), Avel-
scaling relationship. Such results imply that the scaling law     lino (3.9 kyr), and Pompei (79 AD). These main episodes
M0 ∝ fc−3 for volcanic events could exclude fluid-flow as         have been alternated by sub-Plinian eruptions, minor strom-
signal source, while a deviation from this relationship would     bolian and effusive activity, and quiescent periods. The last
be related to fluid involvement. In this framework, new mod-      eruptive phase ended in 1944 with a violent strombolian
els have been developed to explain the LF events. Using nu-       eruption. At the present time, the volcano shows a weak
merical waveform simulations, Bean et al. (2014) propose          volcanic-hydrothermal activity in the crater area, with diffuse
that shallow LFs may be caused by slow, quasi-brittle, low-       CO2 degassing and low-temperature fumarolic emissions,
stress-drop rupture of unconsolidated volcanic material in the    and low energy seismicity (Chiodini et al., 2001; D’Auria
upper edifice, with no direct fluid involvement. Other possi-     et al., 2014). These phenomena could be mainly linked to the
ble source mechanisms have been invoked to explain deep           circulation of hydrothermal fluids inside the volcanic system.
and intermediate depth LFs, such as brittle failure of melt       Chiodini et al. (2001) and Del Pezzo et al. (2013) hypothe-
with a solid-like mechanical behaviour because close to the       size the presence of a deep reservoir at depths of about 2.5–
ductile-brittle transition (Chouet and Matoza, 2013), or slow     5.0 km b.s.l., within the carbonate sequence, in correspon-
ruptures induced by increases of fluid pore pressure into a       dence of the crater area. This hydrothermal system likely
highly fractured region (Greenfield et al., 2019).                results from the interaction of NaCl solutions or halite sat-
   Besides source processes, path and site effects can also       urated brines with deep magmatic fluids. Indeed, the tomo-
yield to LF waveforms. In fact, evidences from field data         graphic investigation by Auger et al. (2001) evidence the
collected in volcanic areas, suggest that the spectral con-       presence of a melting zone at a depth of about 8 km b.s.l.
tent of these events is compatible with scattering mechanisms        Since 70s’, the Mt. Vesuvius seismicity has been mainly
of higher-frequency waves and trapping of lower frequency         composed of VT earthquakes, typically characterized by
waves in shallow attenuating layers (Bean et al., 2008; Tepp      clear P and S wave arrivals caused by shear failure mecha-
et al., 2016). Similarly, the absence of high frequency energy    nisms (Bianco et al., 1998; Madonia et al., 2008; D’Auria
in the seismic arrivals may be attributed to strong attenuation   et al., 2014). The VT energy mostly concentrates over high
(low quality factor Q) in the crust, so that high frequencies     frequency values, from 5–6 up to 20–22 Hz (Cusano et al.,
are damped (Soosalu et al., 2010; Coté et al., 2010). As a        2013a; La Rocca and Galluzzo, 2016). The studies of the
conclusion, the LFs can be the result of the complexity of        seismicity recorded since 1999, when one of the most rel-
source mechanisms and attenuation properties.                     evant seismic crisis occurred, identify two distinct seismo-
   In this paper we systematically investigate an ensemble        genic volumes (Fig. 1): one with hypocenters located within
of uncommon earthquakes that show different characteris-          the volcanic edifice, above the sea level, and the other with
tics with respect to the VTs frequently recorded at Mt. Vesu-     hypocenters below the crater, at depths between 1–6 km (Cu-
vius. We will define the main features of the atypical seis-      sano et al., 2013b; D’Auria et al., 2014). The seismicity
micity through a detailed analysis of the spectral properties,    within the shallow volume is characterized by low magnitude
waveform similarities, location and polarization properties.      values (duration magnitude, MD ≤ 2.8) and quite stationary
Results will allow us to infer the source mechanisms and to       strain release. The deeper seismicity shows magnitudes up to

Adv. Geosci., 52, 29–39, 2020                                                      https://doi.org/10.5194/adgeo-52-29-2020
S. Petrosino and P. Cusano: Low frequency seismic source investigation in volcanic environment 31
3.6 (9 October 1999), occurs preferentially in seismic crisis 3.1 Spectral features
and results from the stress field given by the superposition of
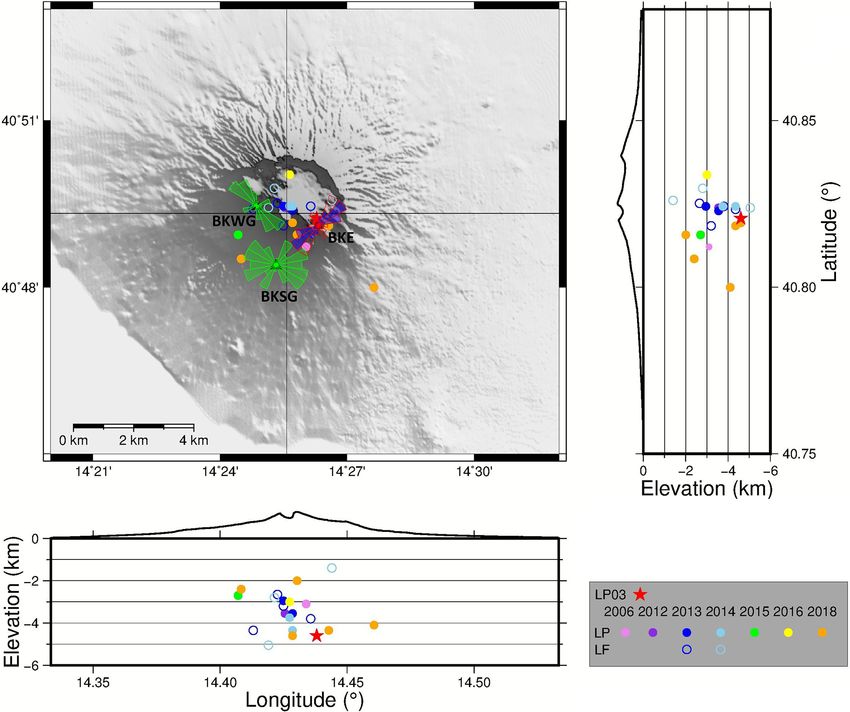
the regional field and local perturbations induced by density The spectral analysis was made on data recorded by the
and rigidity variations at kilometric scales. The presence of three-component BKE station. Two examples of waveforms
fluids, within the hydrothermal system of Mt. Vesuvius, plays (left) and spectra (right, Power Spectral Density, PSD) are
a fundamental role in modulating the occurrence of earth- shown in Fig. 2. Panel (a) reports the seismograms and the
quakes (Saccorotti et al., 2002; Madonia et al., 2008; Cusano PSD for LP03, while panel (b) shows the traces and the
et al., 2013a, b). After the 1999–2000 crisis, the seismicity of PSD for a signal recorded on 28 February 2014, 07:56 UTC,
Mt. Vesuvius has been characterized by a stationary pattern, which was classified as LF earthquake by La Rocca and Gal-
consisting mainly in the occurrence of low-magnitude earth- luzzo (2016).
quakes within the shallow volume (Cusano et al., 2013b). In order to identify the frequency bands involved in the
A careful analysis of the seismicity recorded in the last energy release process, we calculated the frequency thresh-
15 years has revealed some peculiar earthquakes with a lower olds above (FTa ) and below (FTb ) which the 95 % of the
frequency content compared with that of the typical VTs of cumulative spectral energy (averaged on the three compo-
Mt. Vesuvius. The first observation of such event is reported nents of motion) is released. Moreover, we estimated the cor-
in Bianco et al. (2005) who evidenced the occurrence on ner frequency fc from the intersection of the low and high
20 July 2003, 02:09 UTC, of a quasi-monochromatic earth- frequency asymptotes of the envelope of the displacement
quake, with a main spectral peak in the 3–4 Hz band, depth spectrum, which was calculated following the procedure de-
around 4 km b.s.l. and emergent onsets. Array and polariza- scribed in Eyre et al. (2015). An alternative estimate of fc
tion analysis (Bianco et al., 2005) supported the hypothesis was further obtained by the fitting the amplitude A of the
that the event is likely a LP volcanic earthquake (hereinafter displacement spectrum to the ω−γ model (e.g., Abercrom-
referred to as LP03). On the basis of the spectral content, the bie, 1995):
coda decay and the simultaneously perturbations in the deep
1
fluid system (Federico et al., 2013; Cusano et al., 2013b), Cu- A= γ (1)
f
sano et al. (2013a) confirmed the LP nature of LP03. After- 1+ fc
wards, La Rocca and Galluzzo (2016) found 23 earthquakes
occurred in the time range 2012–2016 and classified them where f is the frequency, fc is the corner frequency, and γ
as deep LF earthquakes possibly due to brittle ruptures. In is the coefficient controlling the rate of the high frequency
the same paper, the authors also identified some episodes of decay. In this case, we also obtain the estimate of 0 , the
non-eruptive tremor that they interpreted as a sequence of low-frequency amplitude spectral level, (which is a proxy of
low frequency shear failures. the magnitude, being 0 proportional to the seismic moment
M0 , as in Abercrombie, 1995) and γ . The two approaches
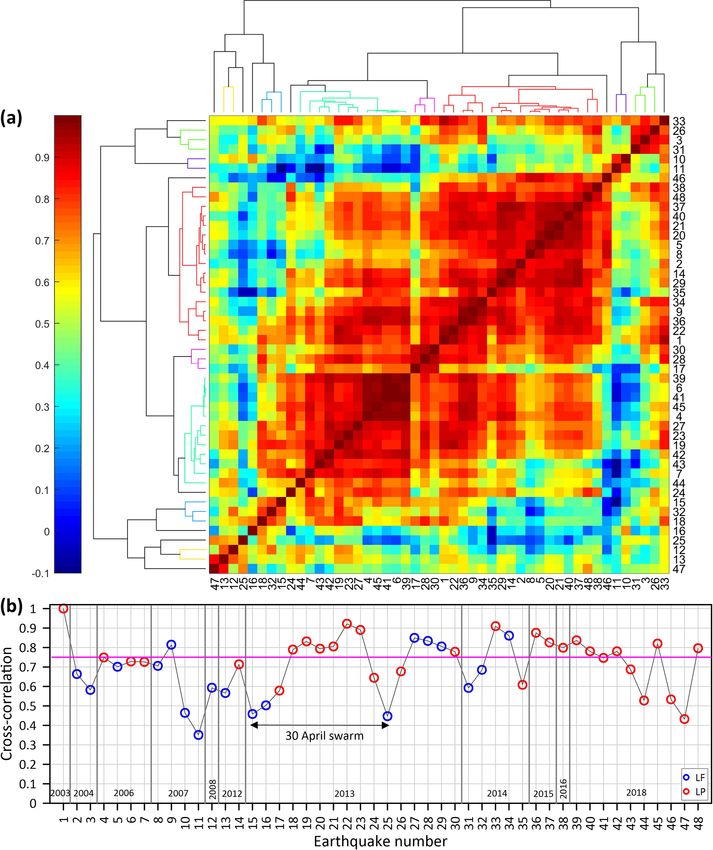
give similar fc values. The distribution of the frequency
3 Data Analysis thresholds, FTa and FTb , and of the corner frequencies fc
are shown in Fig. 3: the most part of the energy is released in
We analysed a dataset of 48 earthquakes occurred in 2003–
the 1–7 Hz frequency band, with fc ranging between 2 and
2018 and characterized by a low frequency spectral content
6 Hz, while for the ordinary VT seismicity of Mt. Vesuvius,
(< 6 Hz, see Fig. 2). Data have been recorded by the per-
the observed values of FTa and FTb are 4 and 15 Hz, and the
manent and mobile seismic networks of INGV-Osservatorio
typical corner frequencies are in the range 10–12 Hz (Gal-
Vesuviano (see Orazi et al., 2013; and La Rocca and Gal-
luzzo et el., 2004).
luzzo, 2015, for details). In particular we used BKE (Fig. 1),
Source spectra of some low frequency signals (earth-
a three-component, short period (1 Hz) permanent station,
quakes and tremor) have been analysed by La Rocca and
which is one of the first seismometers that has been installed
Galluzzo (2016) who found a f −3 high frequency spectral
at Mt. Vesuvius, so it recorded all the events of our cata-
decay, thus congruent with the ω-cube source model. On the
logue. This station has the best signal-to-noise ratio of both
basis of their results, the authors proposed that the low fre-
the two networks. We also used BKWG and BKSG (Fig. 1),
quency events are related to low stress drop shear failures
three-component, broadband (60 s) mobile stations, that pro-
occurring at depth where the rock stiffness decreases. Such
vide high quality data. The dataset is composed of isolated
a behaviour would imply a M0 ∝ fc−3 scaling (or equiva-
events, one swarm (on 30 April 2013) and some short se-
lently 0 ∝ fc−3 , Harrington et al., 2015) as shown in many
quences consisting of few events (up to 5–6), which occurred
studies (Harrington and Brodsky, 2007; Harrington and Ben-
in 2014, 2016 and 2018.
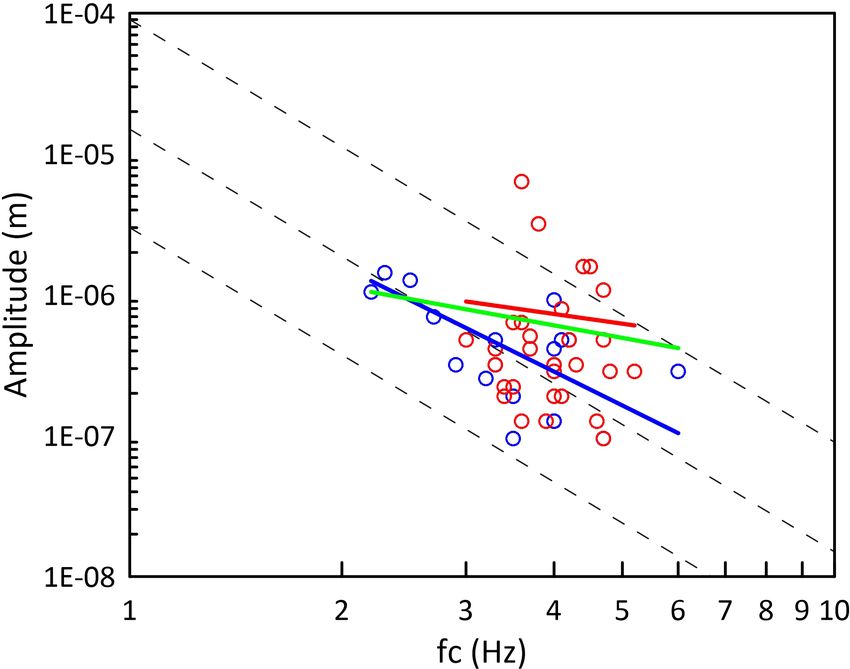
son, 2011; Horton et al., 2008; Eyre et al., 2015). To ver-
ify if this hypothesis is also compatible with the earthquakes
of our dataset, we investigated the scaling law of the low-
frequency spectral level 0 as a function of the corner fre-
quency (Fig. 4). Apparently there is no clear relationship
https://doi.org/10.5194/adgeo-52-29-2020 Adv. Geosci., 52, 29–39, 2020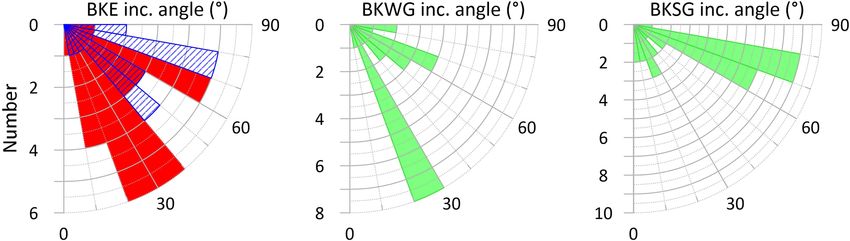
32                        S. Petrosino and P. Cusano: Low frequency seismic source investigation in volcanic environment

Figure 1. Locations of the typical VTs (purple circles) of Mt. Vesuvius for the time range 2003–2018, plotted on the horizontal plane
(upper-left), and the EW (lower-left) and NS (right) sections. The shown locations are the high quality hypocenters (RMS < 0.07) obtained
by NLLoc software (Lomax et al., 2000). The permanent (black triangles) and mobile (blue triangles) seismic stations of INGV-OV are
represented.

between the low-frequency displacement amplitude and the               group with higher γ (> γT ; red circles) is characterized by a
corner frequency of the events: the best fit line (green) has a        gradient of 0.7, thus deviating from the typical scaling law of
gradient of 1 rather than 3 as expected for earthquakes gen-           the LFs.
erated by dry brittle fracture, with a small correlation coeffi-          The above observations seem to point out the existence
cient R due to the large dispersion of the data. However, for          of two classes of events which follow different scaling laws,
our dataset the fit of the displacement amplitude spectrum to          possibly indicative of distinct source mechanisms. The class
Eq. (1) provides γ values ranging from 2.5 up to 5. This indi-         with spectral decay γ ≤ γT , similar to the LF-type events
cates that a part of the events are compatible with the ω-cube         analysed by La Rocca and Galluzzo (2016), is characterized
source model, while another part has a high frequency decay            by an earthquake-like scaling law, compatible with a slow
significantly steeper, suggesting an even stronger depletion           brittle rupture source. The other class, which deviates from
of the frequency content (Horton et al., 2008).                        the typical decay law expected for the brittle failure model,
   A finer analysis was performed by separating the earth-             follows a scaling law analogous to that found for ruptures in
quakes with ω-cube source spectra, from the others. The dis-           wet rocks (Harrington et al., 2011) and would be compati-
tinction was made on the basis of the values of the spectral           ble with a resonance-like mechanism, as that hypothesized
fall-off coefficient: considering the standard deviation σ as-         by Cusano et al. (2013a) for LP03. Indeed, as the slopes of
sociated with the estimates of γ , we fixed a threshold value          the high frequency fall-off define a continuum between 2.5
γT = 3 + 2σ , in order to include the 95 % of the events fol-          and 5, the value of γT should not to be considered as a sharp
lowing the ω-cube source model. The scaling laws were then             boundary but, more likely, as smooth transition between the
reappraised for the two subsets of data. From Fig. 4, we see           two classes.
that the group with γ ≤ γT (blue circles) has a gradient of
2.6 (and R equal to 0.77, high degree of correlation) which            3.2   Waveform cross-correlation
is very close to the 0 ∝ fc−3 scaling observed for LF vol-
canic earthquakes, so implying that the fc−3 relationship is           We performed a hierarchical clustering on the correlation co-
consistent with this group of events. On the other hand, the           efficients among the waveforms recorded by BKE station,

Adv. Geosci., 52, 29–39, 2020                                                            https://doi.org/10.5194/adgeo-52-29-2020
S. Petrosino and P. Cusano: Low frequency seismic source investigation in volcanic environment                                     33

Figure 2. Examples of waveforms and spectra of the selected earthquakes. The three components of BKE (left) and the corresponding PSD
(right) are reported, for LP03 in panel (a) (red) and for the LF earthquake occurred on 28 February 2014 in panel (b) (blue).

                                                                     in order to identify the earthquake families. The best re-
                                                                     sults were obtained for the NS component, by selecting 6 s
                                                                     of signal starting from 1 s preceding the P wave onset and
                                                                     filtering in the band 2.5–4.5 Hz. The correlation matrix cal-
                                                                     culated on these samples, was rearranged according to the
                                                                     cluster distance calculated by the hierarchical clustering al-
                                                                     gorithm. As a measure of distance, we used Dij = 1 − Cij ,
                                                                     where Cij is the correlation coefficient between the ith and
                                                                     j th earthquakes (Greenfield et al., 2019), so that the event
                                                                     pairs with high cross-correlation are grouped together. Con-
                                                                     sidering a correlation threshold of 0.75, the algorithm sepa-
                                                                     rates the earthquakes in two clusters (the most numerous in-
                                                                     cluding LP03) which contain the 60 % of the entire dataset,
                                                                     plus other groups of two or isolated events (Fig. 5a). The two
                                                                     clusters are mainly composed by earthquakes classified as LP
                                                                     (after the spectral analysis, Sect. 3.1). As example, in Fig. 5b,
Figure 3. Distribution of the corner frequencies fc , and the fre-
quency thresholds FTa and FTb above and below which the 95 % of
                                                                     we report the maximum of the cross-correlation function cal-
the cumulative spectral energy is released.                          culated between LP03 and each seismic event of the dataset:
                                                                     note that at a correlation threshold of 0.75, most earthquakes
                                                                     with wavefoms similar to LP03 are LP types. Instead, the

https://doi.org/10.5194/adgeo-52-29-2020                                                            Adv. Geosci., 52, 29–39, 2020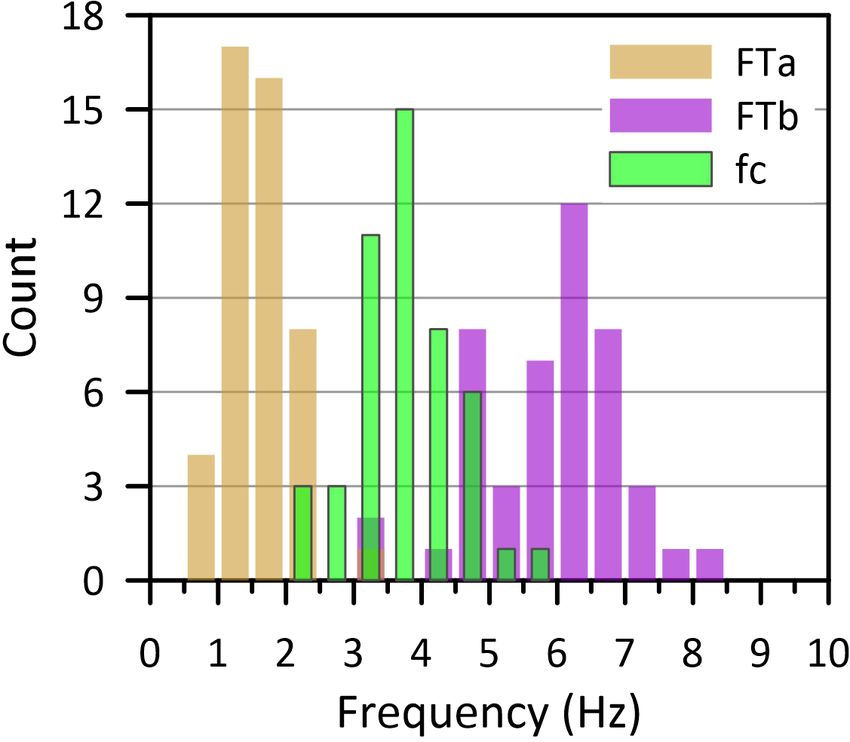
34                          S. Petrosino and P. Cusano: Low frequency seismic source investigation in volcanic environment

                                                                          and BKSG. Through the diagonalization of the covariance
                                                                          matrix, we estimated:
                                                                           1. The rectilinearity, defined as RL = 1 − λ22λ
                                                                                                                         +λ3
                                                                                                                          1
                                                                                                                             with λ1 >
                                                                              λ2 > λ3 the eigenvalues of the covariance matrix. RL
                                                                              takes values between 0 (pure spherical motion) and 1
                                                                              (pure rectilinear motion).
                                                                           2. The azimuth of the polarization vector, defined as the
                                                                              angle between the projection on the horizontal plane of
                                                                              the polarization vector and north, measured clockwise.
                                                                              It spans the interval 0–180◦ , with an ambiguity of 180◦ .
                                                                           3. The incidence angle between the polarization vector
                                                                              and the vertical axis. It ranges from 0◦ (vertical inci-
                                                                              dence/polarization) to 90◦ (horizontal polarization).
                                                                          For P waves, the orientation of the polarization vector is coin-
                                                                          cident with the direction of motion. In this case, the azimuth,
Figure 4. Relationship between the low-frequency level of the am-         in combination with high rectilinearity values, indicates the
plitude spectrum, 0 , and corner frequency fc . The data set has         incoming direction of the wavefront.
been divided in two groups according to the γ value of the spec-             For the polarization analysis, we selected a 0.9 s-long time
tral decay: blue circles for γ ≤ γT ; red circles for γ > γT . The best
                                                                          window starting from the P wave onset and filtered the wave-
fit lines correspond to the entire data (green) and to the two sub-
                                                                          forms using a bandpass acausal Butterworth filter in the 2.5–
groups (blue and red); their slopes are 1, 2.6 and 0.7, respectively.
                                                                          4.5 Hz frequency band. The polarization parameters were es-
The black dashed lines indicate the theoretical slope ∼ fc−3 .
                                                                          timated using a sliding time window with length equal to the
                                                                          maximum investigated period and overlap of 50 %. Finally,
single and paired events are mostly LFs. The existence of                 results associated with highly linearly polarized body waves
families, at least among the LPs, may indicate similarities               were extracted by taking those values of azimuth and inci-
among the source mechanisms. On the contrary, as suggested                dence angle corresponding to RL higher than 0.7.
by Greenfield et al. (2019), the lack of similarities among LF               The azimuth distributions of the polarization vector are
waveforms indicates either that those earthquakes are located             represented by the rose plots of Fig. 6. For BKE, we dis-
across a relatively wide region, or that they do not share com-           tinguished the two subsets associated with the event types
mon mechanisms.                                                           (LF and LP) previously identified by the spectral analysis
                                                                          (Sect. 3.1). The LFs have azimuthal directions (blue shaded
3.3   Earthquake location                                                 sectors in Fig. 6) mostly collimated along the SW-NE direc-
                                                                          tion, while the LP azimuths (red shaded sectors in Fig. 6)
We attempted to locate the 48 earthquakes of our dataset                  point to a wider area (southwards and towards the crater).
by using NLLoc software (3D probabilistic non-linear al-                     Overall, the dominant average azimuthal orientation is the
gorithm, Lomax et al., 2000), taking into account that the                WSW-ENE direction. For BKWG and BKSG stations we did
results could be affected by a large uncertainty due to the               not classified the events because they recorded fewer sig-
intrinsic difficulty to precisely pick the emergent onset of              nals compared with BKE, due to their more recent instal-
low frequency body waves, often masked by the background                  lation (October 2008) as well as to a lower signal-to-noise
seismic noise. We located 22 earthquakes using the criterion              ratio. Nevertheless, for those two stations we still considered
of a minimum of four pickings that had to include at least                the polarization properties of the available signals, specifi-
one S phase reading. The hypocentral depths are in the range              cally at BKWG the dominant direction is SSE–NNW, while
1.4–5.1 km b.s.l., and the hypocentres do not cluster along the           BKSG shows a more spread distribution with azimuth rang-
crater axis, but they are characterized by a certain degree of            ing from ESE–WNW to WSW–ENE (green shaded sectors
spatial spreading (Fig. 6), even for the 2013 swarm.                      in Fig. 6). Regarding the incidence angles, at BKE they ap-
                                                                          pear spread in the 10–90◦ range. The LFs have shallower
3.4   Polarization pattern                                                incidence, mostly between 40–80◦ , while the LPs have the
                                                                          maximum concentration around 20–40◦ . At BKWG the most
The spatial constrains on the earthquake source can be ob-                part of the incidence angles are in the range of 20–30◦ , while
tained by the analysis of the polarization properties of the              at BKSG mainly shallower patterns (60–80◦ ) are observed
first pulses. Thus, we applied the covariance matrix method               (Fig. 7). The azimuth and incident angle patterns are both
(Montalbetti and Kanasewich, 1970) to the three-component                 compatible with the earthquake spatial distribution. In addi-
seismograms of the earthquakes recorded at BKE, BKWG                      tion, the differences in the polarization features at BKE for

Adv. Geosci., 52, 29–39, 2020                                                               https://doi.org/10.5194/adgeo-52-29-2020
S. Petrosino and P. Cusano: Low frequency seismic source investigation in volcanic environment 35
Figure 5. (a) Correlation matrix ordered according to the hierarchical clustering: each earthquake is indicated by a number assigned in a
chronological order (LP03 = 1). The coloured branches of the dendrogram (hierarchical cluster tree) correspond to correlation values greater
than 0.75; their height is a measure of the correlation between two events or clusters. (b) Cross correlation with LP03. Vertical grey lines
mark the different years. The threshold of 0.75 for the maximum of the cross-correlation function is marked by the horizontal magenta line.
The events are classified into LF (blue circles) and LP (red circles) according to the γ value of the high frequency spectral decay.
LF and LP types are fully consistent with the existence of is spatially diffuse, with no particular tendency to cluster in
two distinct classes. the crater area and along its axis. This seismicity does not be-
long to the shallow (< 1 km) seismogenic volume of the VTs,
but occurs at depths between 1.4 and 5.1 km b.s.l. Overall,
4 Discussion and conclusions waveforms are poorly correlated indicating a certain number
of possible source mechanisms. Coherently, the source spec-
We analysed the atypical seismicity occurred at Mt. Vesuvius trum analysis reveals that earthquakes follow two different
during 15 years, from 2003 to 2018. This seismicity has pe- scaling laws, which are diagnostic of the underlying mechan-
culiar characteristics that makes it distinguishable from the ics and can help to identify distinct failure modes (Peng and
ordinary VTs. The most distinctive feature is the low fre- Gomberg, 2010). On these basis, we classified the analysed
quency spectral content (< 6 Hz). In addition, although the events into LF and LP types, whose origin is associated with
area south to the crater appears more active, the seismicity different processes.
https://doi.org/10.5194/adgeo-52-29-2020 Adv. Geosci., 52, 29–39, 202036 S. Petrosino and P. Cusano: Low frequency seismic source investigation in volcanic environment Figure 6. Hypocentral locations of the analysed earthquakes: LFs and LPs are represented by open and full circles, respectively. The rose plots of the polarization azimuth are superimposed to the seismic stations used for the analysis: for BKE the blue and red sectors are associated with the distribution of LFs and LPs, respectively. Red star indicates the location of LP03. For the other locations, the colorscale is from violet to orange in chronological order. Figure 7. Distributions of the incidence angles of the polarization vector for the stations BKE, BKWG and BKSG. For BKE, the blue and red sectors are associated with the distribution of LFs and LPs, respectively. To support these inferences, we should look at the infor- extension of about 4 km. In particular, the seismic tomogra- mation available for the geological structure of Mt. Vesu- phy evidences a clear low P wave velocity and an S wave vius. Geophysical and geochemical investigations (Chiodini total-Q anomaly located in the same zone, which could be et al., 2001; Caliro et al., 2011; Del Pezzo and Bianco, 2013; due to the relatively high temperature fluids of the Mt. Vesu- Del Pezzo et al., 2013) evidence the complexity of the struc- vius hydrothermal system. Geochemical studies indicate that ture underneath the volcano in terms of seismic wave veloc- this hydrothermal system results from the interaction of a ity and attenuation anomalies. The first 3 km b.s.l. are char- high temperature (∼ 450◦ ) NaCl brines reservoir (located be- acterized by low-velocity volumes associated with high at- tween 2 and 5 km b.s.l.) and deep magmatic fluids, which tenuation patches. The degree of heterogeneity in the distri- episodically reach the bottom volume of the reservoir itself bution of the velocity and attenuation (Q) values increases (Chiodini et al., 2001; Caliro et al., 2011). As inferred from in the volume centred around the crater axis, with a lateral the analysis of the fumarole discharge located in the crater, Adv. Geosci., 52, 29–39, 2020 https://doi.org/10.5194/adgeo-52-29-2020
S. Petrosino and P. Cusano: Low frequency seismic source investigation in volcanic environment                                        37

deep fluids mainly consist of H2 O and CO2 . A similar sce-         according to the polarization incidence angle distributions of
nario has been considered in a recent study (Greenfield et          the two classes of events, it seems more likely that dry rup-
al., 2019), that proposes a possible mechanism for the LF           ture phenomena occur at shallower depths with respect to the
seismicity at intermediate depth occurring at the Bora-Tullu        resonance of fluid-filled cracks at deeper depths. This sug-
Moye volcano, attributing these signals to the movement of          gests that beneath the volcanic edifice there are some regions
volatiles (predominantly H2 O/CO2 mixtures) into a highly           where the local boundary conditions would favour one mech-
fractured medium. The high temperature fluids, flowing from         anism rather the other.
a deep source of magmatic origin, would increase the fluid             The lack of families among the LF earthquakes could re-
pore pressure, thus causing brittle failure at low velocity rup-    flect the variety of the orientations of the faults, whose fail-
ture and low stress drop, and consequently producing earth-         ures produce diverse waveforms. On the other hand, few
quakes with low-frequency content. This mechanism is simi-          crack-like structures seem to generate LP signals, consider-
lar to that occurring beneath the subduction zones (Peng and        ing that there is a certain degree of similarities among the LP
Gomberg, 2010), where slow-slip phenomena of faults can             waveforms. From these observations, we infer that there is a
occur due to the high lithostatic loading which increases the       range of seismogenic structures which can undergo to brittle
pore pressure. Such a model can be applied to hydrothermal          failure and crack resonance. The seismogenic volumes, cor-
fluids under particular temperature and pressure conditions,        responding to the earthquake spatial distribution, are com-
to explain the origin of the LF events as in other environ-         patible with the locations of the major velocity/attenuation
ments (Greenfield et al., 2019).                                    anomalies inferred from tomographic studies (Del Pezzo et
   On the other hand, the main role of the Mt. Vesuvius hy-         al., 2013).
drothermal reservoir in generating the LP03 event has been             To summarize, we infer that at Mt. Vesuvius, LF-type and
highlighted by Cusano et al. (2013a). They hypothesize a            LP-type waveforms morph into each other in relation to the
source mechanism consisting in a sudden pressure drop in the        rock physical state and mechanical properties, as well as the
NaCl brine reservoir (at the hypocentral depth) which trig-         location and depth of the source region. As a result, the more
gers the eigen-oscillations of a fluid-filled crack. This pertur-   is the fluid content in the focal volume, the more the earth-
bation in the deep fluid system, in coincidence with the LP03       quakes will have LP features; on the contrary the fracturing
occurrence, is also evidenced by anomalies in the ground-           of dry low-stiffness rock will likely generate LF earthquakes.
water chemistry in some wells and springs of the southern           In addition it appears that, depending on the time period, LPs
sector (Federico et al., 2013) and by composition changes in        outnumber LFs or vice versa (see Fig. 5): it is likely that the
the magmatic volatiles of the crater rim fumaroles (Caliro et       activation of different source mechanisms could be modu-
al., 2011).                                                         lated by the temporal evolution of the dynamical state of the
   Taking into account the above mentioned studies, we can          volcano. In fact, the modulation of the seismic activity on
interpret in a unique framework both LF and LP seismicity as        certain time scales is often linked to changes occurring in the
the response of an episodic pressurization/depressurization         volcanic systems (Horton et al., 2008; De Lauro et al., 2012;
of the NaCl brine reservoir, which releases fluids and              Petrosino et al., 2018).
volatiles (mainly H2 O/CO2 mixtures) in the highly fractured           This work represents a first step for a better comprehen-
surrounding rocks, increasing the fluid pore pressure. As a         sion of the phenomena that drive the occurrence of uncon-
consequence, two either possible triggering mechanisms for          ventional seismicity of Mt. Vesuvius. A larger dataset pro-
the seismicity can occur: (a) brittle fracture of dry rocks un-     vided by further data acquisition and using innovative detec-
der particular condition (e.g. depth, rock stiffness) that can      tion techniques (Capuano et al., 2017), would contribute in
support slow failure at low stress drop; and (b) resonance of       validating our findings more robustly. In this perspective, fu-
pre-existing fluid-filled cracks. The first mechanism would         ture efforts should be addressed towards a full assessment of
yield to LF-type seismicity, with no direct fluid involvement       the mechanisms triggering this kind of seismicity which is
(no fluid presence in the fracture); the second one is asso-        strictly related to the deep dynamics of the volcano.
ciated with LP-type seismicity and interaction processes be-
tween cracks and fluids (presence of fluid in the fracture).
This hypothesis is consistent with the location of the atypical     Data availability. Data are available on request from the authors.
seismicity. The epicentres and polarization azimuths corre-         For data analysis, we wrote a number of Matlab scripts (http://www.
spond to the crater area and southwards, matching the loca-         mathworks.com; last access: November 2019).
tion of the southern hydrological circuit mainly influenced
by the deep water and geothermal brines. In addition, the
hypocentral depths are compatible with the location of the          Author contributions. PC and SP conceived the original idea of the
                                                                    present research, analysed and validated the data, elaborated the in-
NaCl hydrothermal reservoir.
                                                                    terpretations of the results. Both the authors contributed in writing
   At a finer level, the location of the source seems to influ-     and reviewing the manuscript.
ence the generation mechanisms because the focal volumes
of the LFs and LPs could be different on spatial scale. Indeed,

https://doi.org/10.5194/adgeo-52-29-2020                                                             Adv. Geosci., 52, 29–39, 2020
38 S. Petrosino and P. Cusano: Low frequency seismic source investigation in volcanic environment
Competing interests. The authors declare that they have no conflict Capuano, P., De Lauro, E., De Martino, S., and Falanga, M.: De-
of interest. tailed investigation of long-period activity at Campi Flegrei by
convolutive independent component analysis, Phys. Earth Planet.
In., 253, 48–57, https://doi.org/10.1016/j.pepi.2016.02.003,
Special issue statement. This article is part of the special issue 2016.
“Understanding volcanic processes through geophysical and vol- Capuano, P., De Lauro, E., De Martino, S., Falanga, M., and Pet-
canological data investigations: some case studies from Italian sites rosino, S.: Convolutive independent component analysis for pro-
(EGU2019 GMPV5.11 session, COV10 S01.11session)”. It is not cessing massive datasets: a case study at Campi Flegrei (Italy),
associated with a conference. Nat. Hazards, 86, 417–429, https://doi.org/10.1007/s11069-016-
2545-0, 2017.
Chiodini, G., Marini, L., and Russo, M.; Geochemical evidence for
Acknowledgements. The authors wish to thank Danilo Galluzzo the existence of high-temperature hydrothermal brines at Vesu-
(INGV-OV) and Luca D’Auria (Instituto Volcanológico de Ca- vio volcano, Italy, Geochim. Cosmoch. Ac., 65, 2129–2147,
narias) for the fruitful discussions. Francesca Di Luccio and an https://doi.org/10.1016/S0016-7037(01)00583-X 2001.
anonymous referee are greatly acknowledged for their useful com- Chouet, B. A. and Matoza, R. S.: A multi-decadal view of
ments which contributed to improve this manuscript. The analyses seismic methods for detecting precursors of magma move-
performed in this paper have been carried out with the INGV-OV ment and eruption, J. Volcanol. Geoth. Res., 252, 108–175,
monitoring data, in the framework of the Agreement (Annex A) https://doi.org/10.1016/j.jvolgeores.2012.11.013, 2013.
between the Italian Civil Protection Department (DPC) and INGV. Coté, D. M., Belachew, M., Quillen, A. C., Ebinger, C. J.,
Figures 1 and 6 have been drawn by using the software Generic Keir, D., Ayele, A., and Wright, T.: Low-frequency hy-
Mapping Tools (Wessel and Smith, 1998). Earthquake location has brid earthquakes near a magma chamber in Afar: quanti-
been done using the software NLLoc, available at the web site fying path effects, B. Seismol. Soc. Am., 100, 1892–1903,
http://alomax.free.fr/nlloc (last access: November 2019). https://doi.org/10.1785/0120090111, 2010.
Cusano, P., Petrosino, S., Bianco, F., and Del Pezzo, E.:
The first Long Period earthquake detected in the back-
ground seismicity at Mt. Vesuvius, Ann. Geophys., 56, S0440,
Review statement. This paper was edited by Mariarosaria Falanga
https://doi.org/10.4401/ag-6447.S0440, 2013a.
and reviewed by Francesca Di Luccio and one anonymous referee.
Cusano, P., Petrosino, S., Madonia, P., and Federico, C.: Seis-
mic activity and thermal regime of low temperature fumaroles
at Mt. Vesuvius in 2004-2011: distinguishing among seismic,
References volcanic and hydrological signals, Ann. Geophys., 56, S0441,
https://doi.org/10.4401/ag-6446, 2013b.
Abercrombie, R. E.: Earthquake source scaling relation- Cusano, P., Petrosino, S., De Lauro, E., and Falanga, M.:
ships from -1 to 5ML using seismograms recorded at The whisper of the hydrothermal seismic noise at Is-
2.5-km depth, J. Geophys. Res., 100, 24015–24036, chia Island, J. Volcanol. Geoth. Res., 389, 106693,
https://doi.org/10.1029/95JB02397, 1995. https://doi.org/10.1016/j.jvolgeores.2019.106693, 2020.
Auger, E., Gasparini, P., Virieux, J., and Zollo, A.: Seismic evidence D’Auria, L., Massa, B., and De Matteo, A.: The stress field
of an extended magmatic sill under Mt. Vesuvius, Science, 294, beneath a quiescent stratovolcano: The case of Mount
1510–1512, https://doi.org/10.1126/science.1064893, 2001. Vesuvius, J. Geophys. Res.-Sol. Ea., 119, 1181–1199,
Bianco, F., Castellano, M., Milano, G., Ventura, G., and Vilardo, https://doi.org/10.1002/2013JB010792, 2014.
G.: The Somma–Vesuvius stress field induced by regional tec- De Lauro, E., De Martino, S., Del Pezzo, E., Falanga, M., Palo,
tonics: evidences from seismological and mesostructural data, J. M., and Scarpa, R.: Model for high-frequency Strombolian
Volcanol. Geoth. Res., 82, 199–218, 1998. tremor inferred by wavefield decomposition and reconstruction
Bianco, F., Cusano, P., Petrosino, S., Castellano, M., Buonocunto, of asymptotic dynamics, J. Geophys. Res.-Sol. Ea., 113, B02302,
C., Capello, M., and Del Pezzo, E.: Small-aperture array for seis- https://doi.org/10.1029/2006JB004838, 2008.
mic monitoring of Mt. Vesuvius, Seismol. Res. Lett., 76, 344– De Lauro, E., Falanga, M., and Petrosino, S.: Study on the long
355, https://doi.org/10.1785/gssrl.76.3.344, 2005. period source mechanism at Campi Flegrei (Italy) by a mul-
Bean, C., Lokmer, I., and O’Brien, G.: Influence of near- tiparametric analysis, Phys. Earth Planet. In., 206–207, 16–30,
surface volcanic structure on long-period seismic sig- https://doi.org/10.1016/j.pepi.2012.06.006, 2012.
nals and on moment tensor inversions: Simulated exam- De Lauro, E., Petrosino, S., Ricco, C., Aquino, I., and Falanga, M.:
ples from Mount Etna, J. Geophys. Res., 113, B08308, Medium and long period ground oscillatory pattern inferred by
https://doi.org/10.1029/2007JB005468, 2008. borehole tiltmetric data: New perspectives for the Campi Fle-
Bean, C. J., De Barros, L., Lokmer, I., Métaxian, J. P., O’Brien, G., grei caldera crustal dynamics, Earth Planet. Sc. Lett., 504, 21–29,
and Murphy, S.: Long-period seismicity in the shallow volcanic https://doi.org/10.1016/j.epsl.2018.09.039, 2018.
edifice formed from slow-rupture earthquakes, Nat. Geosci., 7, Del Pezzo, E. and Bianco, F.: Inside Mt. Vesuvius: a new method to
71–75, https://doi.org/10.1038/ngeo2027, 2014. look at the seismic (velocity and attenuation) tomographic imag-
Caliro, S., Chiodini, G., Avino, R., Minopoli, C., and Bocchino, B.: ing, Ann. Geophys, 56, S0443, https://doi.org/10.4401/ag-6449,
Long time-series of chemical and isotopic compositions of Vesu- 2013.
vius fumaroles: evidence for deep and shallow processes, Ann.
Geophys, 54, 137–149, https://doi.org/10.4401/ag-5034, 2011.
Adv. Geosci., 52, 29–39, 2020 https://doi.org/10.5194/adgeo-52-29-2020S. Petrosino and P. Cusano: Low frequency seismic source investigation in volcanic environment 39 Del Pezzo, E., Chiodini, G., Caliro, S., Bianco, F., and Avino, Madonia, P., Federico, C., Cusano, P., Petrosino, S., Aiuppa, A., R.: New insights into Mt. Vesuvius hydrothermal system and and Gurrieri, S.: Crustal dynamics of Mount Vesuvius from 1998 its dynamic based on a critical review of seismic tomog- to 2005: Effects on seismicity and fluid circulation, J. Geophys. raphy and geochemical features, Ann. Geophys., 56, S0444, Res., 113, B05206, https://doi.org/10.1029/2007JB005210, https://doi.org/10.4401/ag-6450, 2013. 2008. Eyre, T. S., Bean, C. J., De Barros, L., Martini, F., Lokmer, I., McNutt, S. R.: Volcanic seismology, Annu. Rev. Earth Pl. Sc., 32, Mora, M. M.,. Pacheco, J. F., and Soto, G. J.: A brittle fail- 461–491, 2005. ure model for long-period seismic events recorded at Turri- Montalbetti, J. F. and Kanasewich, E. R.: Enhancement of teleseis- alba Volcano, Costa Rica, J. Geophys. Res., 120, 1452–1472, mic body phases with a polarization filter, Geophys. J. Int., 21, https://doi.org/10.1002/2014JB011108, 2015. 119–129, https://doi.org/10.1111/j.1365-246X.1970.tb01771.x, Federico, C., Madonia, P., Cusano, P., and Petrosino, S.: Groundwa- 1970. ter geochemistry of the Mt. Vesuvius area: implications for vol- Neuberg, J., Luckett, R., Baptie, B., and Olsen, K.: Mod- cano surveillance and relationship with hydrological and seismic els of tremor and low-frequency earthquake swarms signals, Ann. Geophys., 56, S0447, https://doi.org/10.4401/ag- on Montserrat, J. Volcanol. Geoth. Res., 101, 83–104, 6453, 2013. https://doi.org/10.1016/S0377-0273(00)00169-4, 2000. Galluzzo, D., Del Pezzo, E., La Rocca, M., and Petrosino, S.: Peak Orazi, M., D’Auria, L., Tramelli, A., Buonocunto, C., Capello, ground acceleration produced by local earthquakes in volcanic M., Caputo, A., De Cesare, W., Giudicepietro, F., Mar- areas of Campi Flegrei and Mt. Vesuvius, Ann. Geophys., 47, tini, M., Peluso, R., and Scarpato, G.: The seismic moni- 1377–1389, https://doi.org/10.4401/ag-4401, 2004. toring network of Mt. Vesuvius, Ann. Geophys., 56, S0450, Greenfield, T., Keir, D., Kendall, J. M., and Ayele, https://doi.org/10.4401/ag-6456, 2013. A.: Low-frequency earthquakes beneath Tullu Moye Peng, Z. and Gomberg, J.: An integrated perspective of the con- volcano, Ethiopia, reveal fluid pulses from shallow tinuum between earthquakes and slow-slip phenomena, Nat. magma chamber, Earth Planet. Sc. Lett., 526, 115782, Geosci., 3, 599–607, https://doi.org/10.1038/ngeo940, 2010. https://doi.org/10.1016/j.epsl.2019.115782, 2019. Petrosino, S., Cusano, P., and Madonia, P.: Tidal and hy- Harrington, R. M. and Benson, P. M.:. Analysis of labora- drological periodicities of seismicity reveal new risk sce- tory simulations of volcanic hybrid earthquakes using em- narios at Campi Flegrei caldera, Sci. Rep., 8, 13808, pirical Green’s functions, J. Geophys. Res., 116, B11303, https://doi.org/10.1038/s41598-018-31760-4, 2018. https://doi.org/10.1029/2011JB008373, 2011. Piochi, M., Bruno, P. P., and De Astis, G.: Relative roles of rift- Harrington, R. M. and Brodsky, E. E.: Volcanic hybrid earthquakes ing tectonics and magma ascent processes: Inferences from geo- that are brittle-failure events, Geophys. Res. Lett., 34, L06308, physical, structural, volcanological, and geochemical data for https://doi.org/10.1029/2006GL028714, 2007. the Neapolitan volcanic region (southern Italy), Geochem. Geo- Harrington, R. M., Kwiatek, G., and Moran, S. C.: Self- phy. Geosy., 6, Q07005, https://doi.org/10.1029/2004GC000885, similar rupture implied by scaling properties of volcanic earth- 2005. quakes occurring during the 2004–2008 eruption of Mount Saccorotti, G., Ventura, G., and Vilardo, G.: Seismic swarms St. Helens, Washington, J. Geophys. Res., 120, 4966–4982, related to diffusive processes: The case of Somma- https://doi.org/10.1002/2014JB011744, 2015. Vesuvius volcano, Italy, Geophysics, 67, 199–203, Horton, S., Norris, R. D., and Moran, S.: Broadband characteris- https://doi.org/10.1190/1.1451551, 2002. tics of earthquakes recorded during a dome-building eruption at Ricco, C., Petrosino, S., Aquino, I., Del Gaudio, C., and Falanga, Mount St. Helens, Washington, between October 2004 and May M.: Some Investigations on a Possible Relationship between 2005, in: A Volcano Rekindled: The Renewed Eruption of Mount Ground Deformation and Seismic Activity at Campi Flegrei and St. Helens, 2004–2006, 97–110, U.S. Geological Survey Profes- Ischia Volcanic Areas (Southern Italy), Geosciences, 9, 222, sional Paper 1750, 2008. https://doi.org/10.3390/geosciences9050222, 2019. Julian, B. R.: Volcanic tremor: nonlinear excitation Soosalu, H., Key, J., White, R. S., Knox, C., Einarsson, P., and by fluid flow, J. Geophys. Res., 99, 11859–11877, Jakobsdóttir, S. S: Lower-crustal earthquakes caused by magma https://doi.org/10.1029/93JB03129, 1994. movement beneath Askja volcano on the north Iceland rift, B. La Rocca, M. and Galluzzo, D.: Seismic monitoring of Campi Fle- Volcanol., 72, 55–62, https://doi.org/10.1007/s00445-009-0297- grei and Mt. Vesuvius by stand alone instruments, Ann. Geo- 3, 2010. phys., 58, S0544, https://doi.org/10.4401/ag-6748, 2015. Tepp, G., Ebinger, C. J., and Yun, S. H.: Spectral analysis of dike- La Rocca, M. and Galluzzo, D.: Volcanic tremor at Mt Vesu- induced earthquakes in Afar, Ethiopia, J. Geophys. Res., 121, vius associated with low frequency shear failures, Earth Planet. 2560–2574, https://doi.org/10.1002/2015JB012658, 2016. Sc. Lett., 442, 32–38, https://doi.org/10.1016/j.epsl.2016.02.048, Wessel, P. and Smith, W. H. F.: New, improved version of the 2016. generic mapping tools released, EOS Trans AGU, 79, p. 579, Lomax, A., Virieux, J., Volant, P., and Berge, C.: Probabilistic 1998. earthquake location in 3D and layered models: Introduction of a Metropolis-Gibbs method and comparison with linear locations, in: Advances in Seismic Event Location, edited by: Thurber, C. H. and Rabinowitz, N., 101–134, Kluwer, 2000. https://doi.org/10.5194/adgeo-52-29-2020 Adv. Geosci., 52, 29–39, 2020
You can also read