The drivers of vine-plant root microbiota endosphere composition include both abiotic and plant-specific factors
←
→
Page content transcription
If your browser does not render page correctly, please read the page content below
Received: 12 February 2021 y Accepted: 26 August 2021 y Published: 16 September 2021
DOI:10.20870/oeno-one.2021.55.3.4616

The drivers of vine-plant root microbiota endosphere
composition include both abiotic and plant-specific factors

    Marine Biget1,4*, Cendrine Mony1, Marc Aubry2, Olivier Jambon1, Achim Quaiser1, Véronique Chable3,
    Sabrina Pernet4 and Philippe Vandenkoornhuyse1
    1
      Université de Rennes 1, CNRS, ECOBIO (Ecosystèmes, biodiversité, évolution) -
      UMR 6553, F-35000 Rennes, France
    2
      Université de Rennes 1, CNRS, - UMS 3343 OSUR, F-35000 Rennes, France
    3
      Laboratory INRAE UMR BAGAP INRA Centre Bretagne-Normandie, France
    4
      Château Palmer, lieu-dit Issan, Margaux, France

    *corresponding author: marine.biget@univ-rennes1.fr
     Associate editor: Isabelle Masneuf-Pomarède

    abstract
Microorganisms associated with plants are determinant for their fitness, but also in the case of vine grapes, for the
quality and quantity of the wine. Plant microbiota is, however highly variable in space despite deterministic recruitment
from the soil reservoir. Therefore, understanding the drivers that shape this microbiota is a key issue. Most studies
that have analysed microorganisms associated with vines have been conducted at large scales (e.g., over 100 km)
and have analysed the bulk soil and the rhizosphere. In this study, we focused on the root-microbiota endosphere,
the most intimate fraction of microorganisms associated with plants. We sampled vine roots in 37 fields distributed
throughout a vineyard to investigate drivers shaping the grapevine microbiota at the α- (i.e., within-field) and
γ- (i.e., between‑field) diversity scales. We demonstrated that vine endospheric microbiota differed according to
both the edaphic and plant-specific parameters including cultivar type and age. This work supports the idea of an
existing microbial terroir occurring within a domain and offers a new perspective for winemakers to include the
microbial terroir in their management practices.
    keywords

root microbiota, endosphere, vineyard, environmental factors, plant-specific factors, small scales

        Supplementary data can be downloaded through: https://oeno-one.eu/article/view/4616

OENO One 2021, 3, 299-315                                         © 2021 International Viticulture and Enology Society - IVES 299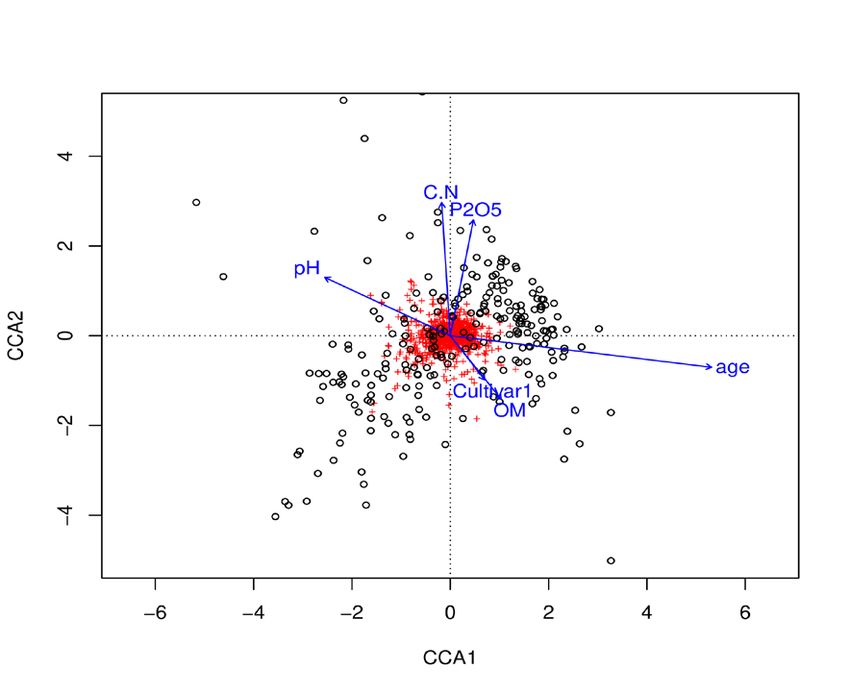
Marine Biget et al.

                      INTRODUCTION                                soil properties producing variations of fungal and
                                                                  bacterial communities within a single vineyard
Microorganism-plant interactions are the                          (Liang et al., 2019). Despite the use of similar
basis of fertility ecosystem services (e.g.,                      practices and of a very limited number of vine
van der Heijden et al., 2008). Indeed,                            genotypes, soil microbial communities near the
microorganisms associated with their host                         vine plants were strongly heterogeneous, and
plant (i.e., plant microbiota) affect not only                    was only partly explained by soil characteristics
plant mineral and hydric nutrition but also                       (Liang et al., 2019). Because endophytes are
plant health, by improving plant resistance                       recruited in the soil microbiota, this local-scale
to drought and pathogenic attacks (e.g.,                          patchiness of the soil microbiota likely shapes the
Rolli et al., 2015; Vandenkoornhuyse et al., 2015;                microbial composition of the individual vines.
Compant et al., 2019). Microbiota can then deeply
affect the fitness of plants. In the case of grapevines,          However, despite its tremendous importance,
microorganism composition has been shown to                       the root-endospheric microbiota has been
not only influence plant growth and development                   widely overlooked to date in vineyards, and
but also the quality and the quantity of the                      most agricultural crops. At the vineyard scale,
resulting wine, for instance by shaping the volatile              non‑random variations in the endophytic bacterial
compound profiles in grapes (Knight et al., 2015;                 and fungal communities are likely explained by
Belda et al., 2017). Microorganisms are                           the heterogeneous patterns of soil components.
recruited from the soil microbial reservoir by                    Indeed, microbial recruitment to form the root-
the plant to form the rhizosphere from which                      endospheric microbiota is mainly shaped by the
a fraction of the microorganisms can colonise                     soil reservoir, which can differ depending on
the inner part of the plant (i.e., the endosphere)                changes in the physical-chemical properties of the
(Vandenkoornhuyse et al., 2015). This process                     soil (Plassart et al., 2019). Soil organic carbon,
has been suggested to be mainly determinist                       pH, the C/N ratio and phosphorus contents
(Morrison-Whittle         and      Goddard,      2015).           are the main factors that have a significant
Microorganism distribution is still highly variable               influence on bacterial and fungal consortia in soil
from one place to the other and understanding the                 microbial reservoirs in vineyards described so far
drivers of microorganism variability is, therefore,               (Zarraonaindia et al., 2015; Liang et al., 2019),
a key issue for wine production. So far, drivers                  along       with      grape-surface       microbiota
shaping microbial distribution in vineyards                       (Bokulich et al., 2014). In addition, because the
have been analysed using the biogeography                         recruitment of endophytic bacterial and fungal
framework (sensu MacArthur & Wilson, 1967).                       communities is plant-dependent, these assemblages
Analyses have thus focused on large geographical                  are likely shaped by plant-specific factors such
scales of more than 100 km, in continental                        as grape type (cultivar type), growing seasons,
and inter-regional studies. These studies have                    the age of the vine and the rootstock genotype
analysed different plant compartments (root,                      (Zarraonaindia et al., 2015; Novello et al., 2017;
leaf, grape) and soil types (Bokulich et al., 2014;               Marasco et al., 2018; Berlanas et al., 2019). In
Knight et al., 2015; Oliveira et al., 2018), and only             addition to the strong economic interest linked
a very small number examined vine microbiota                      to vine plant culture, vine plants offer the ideal
at smaller geographic scales. For instance,                       plant model to study the rules of microbiota
Miura et al., (2017) demonstrated differences in                  assembly because vines are highly genetically
the grape and leaf microbiota among six Chilean                   homogeneous perennial plants. Differences in the
vineyards located 35 km apart. Differences in                     cultivar microbiota can be assumed to be linked to
fungal grape microbiota were shown to depend on                   a genotype effect and the preferential associations
the geographical distance between them following                  of microorganisms with a particular host genotype
a distance-decay relationship, validating the                     due to both passive barriers to colonization
biogeography hypothesis (Miura et al., 2017).                     and active recruitment by the plants, especially
Knight et al., (2020) investigated soil microbiota at             through root exudates (Dennis et al., 2010).
a smaller scale, in four different vineyards situated             Recruitment may also vary over time depending
within a 2-km radius. They observed geographic                    on microbial succession processes and plant
differences among fungal communities driven by                    requirements during their different developmental
local environmental heterogeneity, whereas they                   stages or to face and buffer different kinds of stress
found no specific pattern when they analysed                      (Bulgarelli et al., 2013; Vives-Peris et al., 2020).
fermentative yeasts (Knight et al., 2020). A                      First, microbial communities are hypothesised
recent study provided the first evidence of local                 to depend on the composition of the first

300 © 2021 International Viticulture and Enology Society - IVES                                 OENO One 2021, 3, 299-315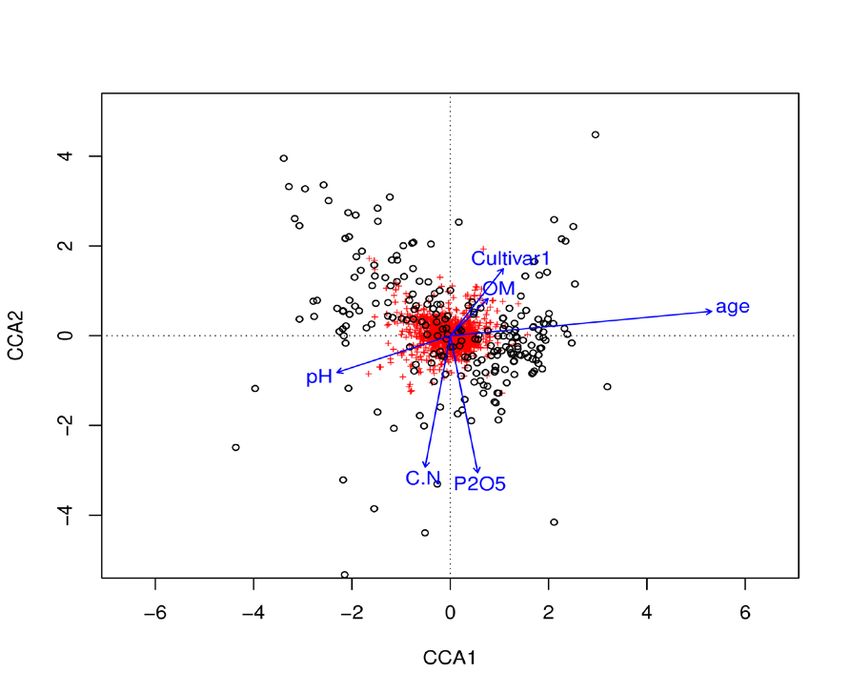
species to colonise (priority effect) (Werner and                       homogeneous, and practices are similar across
Kiers, 2015) while preferential selection by the                        fields. We hypothesised that the composition of
plants can actively occur later (host preference)                       both the bacterial- and fungal-root-endosphere is
(Vandenkoornhuyse et al., 2002). Changes in the                         determined by abiotic and plant-specific factors
plant microbiota over time are expected to depend                       (i.e., the cultivar and the age of the plants).
on the seasonal dynamics (Davison et al., 2011)                         To address these hypotheses, we analysed
but also throughout plant development (i.e.,                            variations in the bacterial and fungal composition
interannual changes related to ageing). Roots are                       of vine plants (i) at the scale of the vineyard
therefore organs of prime importance for the study                      (γ-diversity scale) and (ii) within a single
of microorganisms associated with the vine as                           field (α-diversity scale). We analysed root
they form an ecological filter and act as a reservoir                   endosphere derived SSU rRNA gene amplicon
of specialised microorganisms for the other plant                       fragments (bacteria and fungi) from 296 samples
compartments (Vandenkoornhuyse et al., 2015;                            recovered from 37 fields within a single vineyard
Martínez-Diz et al., 2019).                                             (Experimental design, Figure 1).

To advance our understanding of the factors                                    MATERIALS AND METHODS
driving microorganisms assembly, we analysed                            1. Study site and field selection
the effect of abiotic variables and plant-specific
factors on the endophytic microbiota associated                         We analysed the root microbiota in individual vine
with vine roots. To this end, we worked in a                            plants collected in a single 66-ha vineyard located
vineyard domain located in Margaux (France)                             in Margaux (protected designation of origin; “AOP”
where the bedrock and soils are assumed to be                           in French “Appellation d’Origine Protégée”)

 (A)                                                                                             Fields selected
                                                                                                 Vine plants sampled
                                                                                                 5 soil subsamples pooled

 Entire vineyard
       37 fields
across the vineyard

 (B)                                                                         (C)

                        γ-scale                                               pH
                                                                                   C/N
                                                                                      OM
                                                                                           ...                       Abiotic *
                                                                                                                        &
                                                                                                               Plant-specific factors

                                                                                                               pH, C/N ratio, OM, P2O5
                                                                                                                    cultivar, age
                                  α-scale
                                            8 plants sampled
                                                 per field
  Bacterial & Fungal
         communities                                                                                       *The abiotic values of a field have
                                                                                                            been obtained by pooling 5 soil
                                                                                                             subsamples across a field and
                                                                                                             analysing it as a single sample

FIGURE 1. Presentation of the experimental design.
(A) Scheme of the vineyard and distribution of the 37 sampled fields.
(B) Plan showing the location of the 8 plants sampled in each of the 37 fields. The α-scale corresponds to the individual scale
(one vine plant); the γ-scale represents the group of individuals at the field scale. The bacterial and fungal microbiota in each sample
were identified using mass sequencing of amplified SSU rRNA gene fragments.
(C) Environmental factor data obtained from the vine-makers dataset to test their effect on the bacterial and fungal communities at
both α- and γ-scales. The abiotic values have been obtained by analysing a pool of 5 soil subsamples of a field.

OENO One 2021, 3, 299-315                                                © 2021 International Viticulture and Enology Society - IVES 301
Marine Biget et al.

in France (45°2’12.73 “N; 0°40’9.84 “O) in                        3. Root sampling and DNA extraction
June 2018. The region is characterised by a
temperate climate with an average temperature of                  We sampled 296 vine roots in June 2018 at the
                                                                  vine flowering stage, a period of very active
14.2 °C (min: 1.6 °C; max: 36.3 °C) and cumulative
                                                                  vegetative growth. Roots were collected with a
annual precipitation of 934mm. This vineyard
                                                                  spade near the stem, to obtain a homogeneous
has been managed with biodynamic practices for                    root stage at a depth of from 5 to 20 cm.
several years and is actively engaged in practising               The roots were removed manually using gloves,
sustainable viticulture. We sampled 37 fields                     placed in individual hermetic bags and stored in
with a balanced number of fields with either                      cooled boxes. The roots were then thoroughly
Cabernet‑Sauvignon or Merlot cultivars, and that                  washed first with tap water and then with a
included all the different ages of the vines in the               5 ‰ TritonTM X100 solution for 10 minutes.
vineyard. The range of the ages of vine plants were               They were rinsed several times using sterile ultra-
between 3 and 80 years old (Table S1) and the                     pure water, placed in sterile micro-tubes and stored
two studied cultivars included the same number                    at -80 °C until DNA extraction. The total root
of fields per range of ages. In each field, eight                 DNA was extracted at the GENTYANE platform
equidistant vine plants were selected to cover the                (Clermont‑Ferrand, France) using magnetic bead
field variability (mean field area 0.79 +/- 0.36 ha)              technology (sbeadexTM) on an oKtopureTM LGC
all of the same age and genotype (Figure1).                       Genomics automat. After the sample’s mechanical
                                                                  grinding, nucleic acids were captured with the
2. Characteristics of the environmental                           sbeadex™ magnetics particles. After washing
variables                                                         steps to remove impurities the nucleic acid
                                                                  was eluted in the Beadex elution buffer. DNA
Each field was characterised by abiotic factors                   concentration was measured using Hoechst 33258
linked to soil conditions, biotic factors linked to the           reagent and a TECAN Infinite® 1000 instrument.
type of cultivar (Cabernet-Sauvignon and Merlot),                 DNA extracts were then stored at -20 °C until
and the age of the vine. In all 37 fields, abiotic                amplicon processing.
factors were measured including the C/N ratio,
organic matter content (OM), pH and P2O5 (g/kg)                   4. Molecular work
(Figure 1, Table S1). These edaphic parameters                    All the 296 extracted DNAs were normalised
were selected because they are known to potentially               at 10 ng/µl using TE 0.1X to ensure the use
impact the soil microorganisms and thus possibly                  of similar DNA concentrations for all the
the plant recruitable microorganism reservoir                     PCRs. The fungal community in vine roots
(e.g., Santoyo et al., 2017). The analyses were                   was analysed by amplifying an 18S rRNA gene
conducted on 37 soils samples collected at a depth                fragment with the specific fungal primers NS22b
of 25 cm. These soil samples were composed of a                   (5′-AATTAAGCAGACAAATCACT-3′) and SSU817
mix of five soil sub-samples per field representing               (5′-TTAGCATGGAATAATRRAATAGGA-3′).
different areas of a field. All the measurements                  The bacterial community was analysed from
were performed by Auréa AgroSciences                              PCR amplification of a 16S rRNA gene fragment
(Ardon, France) under the request of the wine-                    (V5-V7 16S regions) using the bacterial primers
makers for other vineyard management purposes.                    799F (5′-AACMGGATTAGATACCCKG-3′) and
We compared these measures through time                           1223R        (5′-CCATTGTAGTACGTGTGTA-3′).
(i.e., through years, with measures not performed                 These primers were chosen because they do not
at the same period of the year) and found very                    amplify plant DNA and allow, in silico, the best
                                                                  bacterial sequence recruitment from both Sylva
similar values (e.g., highest range of variation in
                                                                  and GreenGenes databases compared to the other
pH within a given field of 0.2). It can be suggested
                                                                  commonly used primer sets (unpublished in
homogeneity. Thus, we used these edaphic values                   silico benchmark analysis). Both specific primers
per parcel as an environmental proxy for the 8                    were customised to include sample tags and
sampled plants within a parcel. Within a given                    Illumina® adaptors. To ensure a normalised PCR
field, we thus concluded the homogeneity of                       mix and avoid contamination, Illustra™PuReTaq
edaphic parameters. To satisfy the assumption                     Ready‑to-go beads (GE Healhcare®) were used
of independence among variables, we checked                       for all the amplifications. The two primer sets and
that these variables were not correlated (i.e.,                   the PCR conditions associated with the specific
Pearson’s tests showed that none of the correlation               target are detailed in Vannier et al., (2018). PCR
estimates were above 0.7) (Dormann et al., 2013).                 products were cleaned with AMpureXP magnetic

302 © 2021 International Viticulture and Enology Society - IVES                                OENO One 2021, 3, 299-315
beads (Agencourt®) using an Agilent Bravo                 Finally, the taxonomic affiliations were
Automated liquid handling platform (Agilent®)             determined using Silva132 16S rRNA for bacteria
and quantified with a Quant-iT PicoGreen™                 (Quast et al., 2012) and Phymyco-DB databases
dsDNA Assay Kit to allow normalization at                 for fungi (Mahé et al., 2012).
the same concentration. Library preparation
and sequencing were performed at the Human                The stringent parameters applied in the FROGS
and Environmental Genomics Platform (HEG                  pipeline resulted in the production of data
                                                          matrices containing 2,778,222 reads for bacteria
platform, Rennes, France). Briefly, a second PCR
                                                          and 1,549,109 reads for fungi. Rarefaction curves
using the Smartchip-Real-Time PCR machine
                                                          were generated using R (version 3.6.1) with the
(Takara) performed multiplex tagging (up to               function ‘rrarefy’ in the vegan 2.5-6 package.
384 amplicons in one-step PCR), the resulting             To perform subsequent statistical analysis,
tagged-amplicon pool was purified (AMpureXP,              we normalised the number of reads for each
Agencourt®) and quantified using Kapa Library             bacterial and fungal dataset. Based on graphical
Quantification Kit-Illumina® on an LC480                  observations (rarefaction curves), we normalised
LightCycler qPCR machine (Roche®). The library            to the same number of reads for bacteria and fungi
was sequenced on an Illumina MiSeq instrument             to 4264 and 1447 reads per sample respectively
(PE-2x250 cycles).                                        (Figure S1). Samples with fewer reads were
                                                          removed from the dataset resulting in 34 fields
5. Sequence trimming and clustering
                                                          for bacterial datasets and 36 fields for fungal
The base-calling step was performed on the                datasets (i.e., a field being removed when more
MiSeq instrument with CASAVA v1.8 software                than 50 % of the samples did not satisfy the
(Illumina). Sequence data trimming consisted of           sequencing depth). The final matrices containing
removing primers and deleting reads containing            1051 bacterial and 158 fungal sequence-clusters
unidentified bases using Cutadapt software.               were finally used for the statistical analyses. We
As we mixed fungal and bacterial amplicons,               calculated sequence-cluster richness and the
we processed the fastq files to separate the              diversity index (Simpson’s evenness) using the
two types of reads based on their specific DNA            R ‘vegan’ package (Table S2) at two spatial scales:
                                                          the vineyard level (γ-diversity scale) and the
sequence (homemade script–EcogenO platform)
                                                          within-field level (α-diversity scale). Measures at
and then analysed them separately. These good-
                                                          the γ-scale were calculated using the total number
quality sequences were then processed with the
                                                          of sequence-clusters and the mean number of
FROGS pipeline (Escudié et al., 2018) using               reads. For all the statistical analyses, we decided
the standard protocol for bacterial reads and             to work at the phylum level because a large part
after a particular pre-processing step for fungi          of the sequence-clusters observed were unknown
(Kozich et al., 2013). The FROGS pipeline                 at the species level and a large proportion of them
notably includes SWARM as a clustering strategy,          are unknown at higher taxonomic levels. We
which enables analysis of reads without using             checked for the redundancy of diversity indices
the standard identity threshold of classical OTUs         (Richness and Simpson indices) by making sure
(97 %), and rather to produce what we call herein         their correlation (Pearson’s test) was below 0.70
‘sequence-clusters’. In comparison to the ASV             (Dormann et al., 2013). None of the estimates
method (Callahan et al., 2017), this clustering           were higher than 0.70, except the correlation
strategy and the subsequent filtering (see below)         estimate (0.75) between the sequence-cluster
have the advantage to limit the over-estimation of        richness of δ-Proteobacteria and the Simpson
sample richness (Escudié et al., 2018) induced for        index of γ-Proteobacteria.
instance by a multicopies artefact. The following
steps were performed as recommended by                    6. Statistical analyses
Escudié et al., 2018. Briefly, these steps consisted
                                                          We analysed the effect of environmental factors
of using a specific algorithm for de-noising and a        on microbiota structure with a combination of
chimera removal process followed by a stringent           multivariate analysis (Canonical correspondence
filter to avoid artificial sequence-clusters. To ensure   analysis–CCA) and univariate models.
high quality and stringent analysis, only sequences
present in three different samples (i.e., at least in     Canonical correspondence analysis (CCA)
1 % of the samples) were retained and included in         was used to explore whether the microbial
the sequence-clusters. Reads were filtered using          sequence-cluster composition (i.e., bacterial
the quality of the affiliations with a threshold of at    and fungal microbiota composition) depended
least 95 % coverage and 95 % identity (BLAST).            on plant‑specific factors or abiotic variables.

OENO One 2021, 3, 299-315                                  © 2021 International Viticulture and Enology Society - IVES 303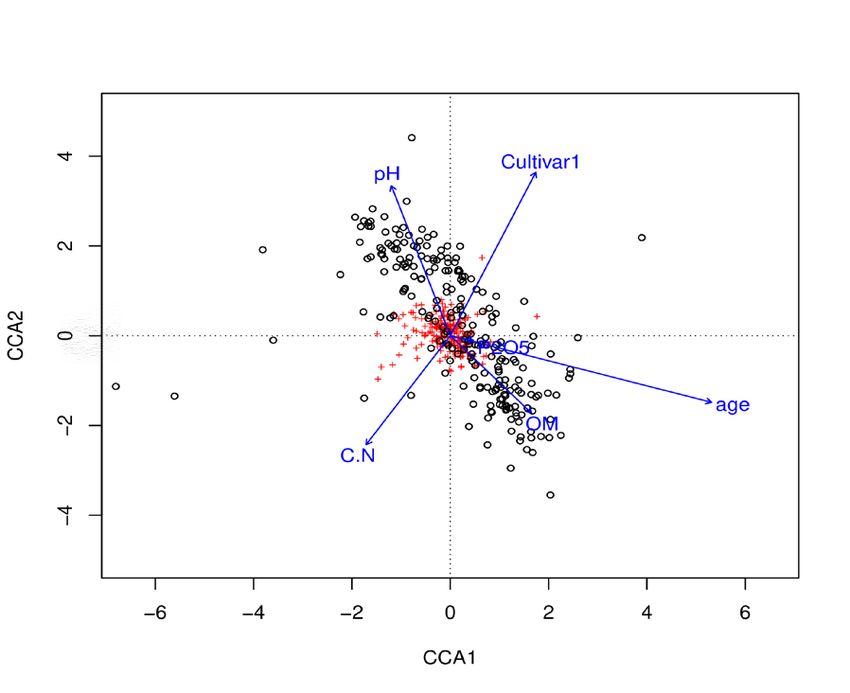
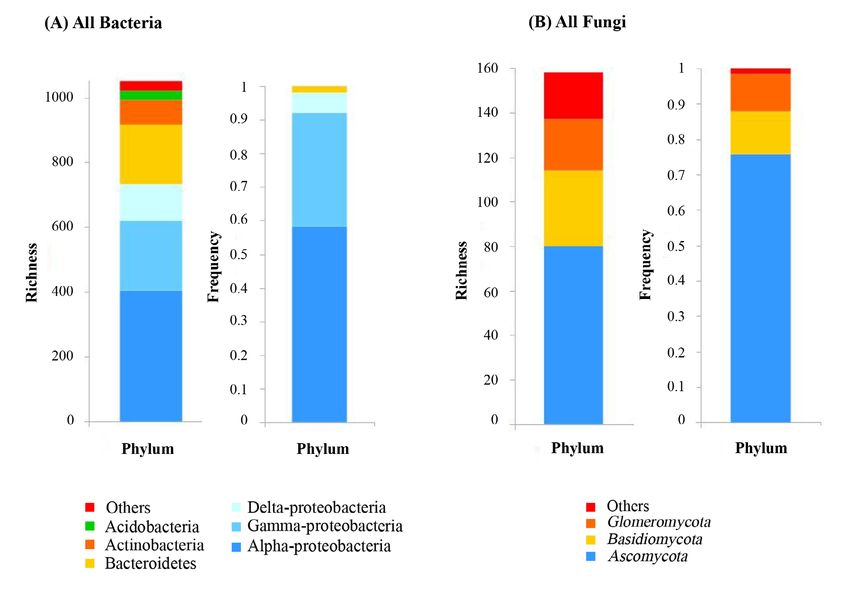
Marine Biget et al.

Separate analyses were performed for “all bacteria/                 Bacterial and fungal sequence-cluster composition
fungi” communities, i.e., the entire pools of both                  of the fields was assessed using the normalised
microbial communities, and the subsequent                           number of reads for sequence-clusters. The
phyla separately. We coupled the matrix of the                      significance of the independent variables in the
sequence-cluster composition under the constraint                   CCA structure was tested using permutational
of the plant-specific/abiotic variables matrix (age,                multivariate analysis of variance (PERMANOVA)
cultivar, pH, C/N ratio, organic matter (OM),                       with 999 permutations. These analyses were
P2O5). Plant genotypes (i.e., rootstock genotype                    performed using the ‘vegan’ package.
and scion genotype) sampled within a field were
identical, but rootstock genotype varied among                      We used respectively linear (γ-diversity scale)
fields. However, the rootstock genotype was                         and linear mixed models (α-diversity scale)
unknown for some of the parcels independently of                    to analyse the effect of abiotic factors (pH,
the age of the parcel. Therefore, we did not include                C/N ratio, OM and P2O5) and plant-specific factors
rootstock genotype in the analyses. Furthermore,                    (age and cultivar) on sequence-cluster richness and
we tested the rootstock effect on the partial data set              evenness for both fungi and bacteria. For the α-scale
and found no detectable effect on the microbiota                    analysis, we considered ‘field’ as a random effect.
(i.e., p > 0.05). Rootstock variations were thus                    All the models (α- and γ-scale) were
considered herein as a background noise expected                    performed       using      a      model-averaging
of the same range across age categories.                            method (Burnham and Anderson, 2002).

FIGURE 2. Description of the microbial communities at vineyard scale.
Sequence-cluster richness and relative abundance of the root endospheric bacterial (A) and fungal (B) microbiota of the vine plant
at the phylum level.
(A) N= 34 fields. The «others» group contains phyla with limited number of sequence-clusters (10 or fewer sequence-
clusters): Chlamydiae, Chloroflexi, Dependentiae, Fibrobacteres, Firmicutes, Gemmatimonadetes, Nitrospirae, Spirochaetes,
Verrucomicrobia. Three representative sub-phyla of Proteobacteria, Alpha-proteobacteria, Gamma-proteobacteria and
Delta-proteobacteria are represented to provide the required level of information.
(B) N=36 fields. The «others» group contains phyla with a limited number of sequence-clusters (less than 10 sequence-clusters):
Chytridiomycota, Zygomycota, Multi-affiliation.

304 © 2021 International Viticulture and Enology Society - IVES                                        OENO One 2021, 3, 299-315
The       model‑averaging       method     enables      2. Drivers of the bacterial community in vine
the calculation of better estimates (i.e.,              roots at both α- and γ-diversity scales
higher mathematical accuracy) as well as
more reliable confidence intervals than                 We used canonical correspondence analysis
standard methods like model selection                   (CCAs) to test for potential shifts in bacterial
(Fletcher, 2018). All possible models (combination      community compositions depending on the factors
of explanatory variables) were generated and            tested. At the α-scale, we recorded significant
ranked using the Akaike information criterion           effects of vine age, cultivar, and pH on the bacterial
corrected for small sample sizes (AICc). We             microbiota composition for the “all bacteria’’
produced full-model averaged estimates of               community and all subsequent phyla (Figures
each independent variable across the most               3A and S2A). The impact of OM, C/N ratio, and
parsimonious models (ΔAICc < 2) and visually            P2O5 on bacterial composition depended on the
checked the normality of the residuals. We              phylum considered (Figures 3A and S2A). The
considered independent variables to be significant      composition of α-Proteobacteria, δ-Proteobacteria,
if their 95 % confidence intervals did not overlap      Actinobacteria and Acidobacteria communities
with zero (Burnham and Anderson., 2002).                was significantly influenced by all the factors
Finally, we calculated the proportion of variance       tested (i.e., vine age, cultivar, pH, C/N, OM and
(adjusted R2 for the γ-scale and marginal R2,           P2O5) (Figures 3A and S2A). The composition of
conditional R2 for the α-scale) of the most             Proteobacteria, γ-Proteobacteria and Bacteroidetes
parsimonious model (ΔAICc = 0) as the                   was significantly affected by the OM, the C/N
values did not significantly differ from the            ratio and the P2O5 concentration respectively as
values of the averaged models (Nakagawa and             well as the other factors shared by all the phylum
Schielzeth, 2013).                                      (vine age, cultivar and the pH) (Figure 3A). At
                                                        the γ-diversity scale, we found no significant
All statistical analyses were performed using           relationship between the tested factors and
R.3.6.2 (R Core Team). Linear mixed models,             bacterial composition, except for Actinobacteria
model averaging and associated R² were calculated       that depended on the age of the vine (Figure S2B).
using the following packages: ‘lmerTest’, ‘lme4’,
‘nmle’, ‘car’, ‘MuMIn’ and ‘AICcmodavg’.                We used linear mixed models and calculated
                                                        the full-model averaged estimates of each
                      RESULTS                           independent variable to test whether abiotic and
1. Composition of the vine root endospheric             plant-specific factors impacted bacterial richness
microbiota                                              and evenness. Unexpectedly, the effects of abiotic
                                                        and plant-specific factors on bacterial-microbiota
Sequencing depths of both fungal and bacterial          colonizing vine-roots varied depending on the
microbiota colonizing vine roots were sufficient        taxa. The sequence-cluster richness of the bacteria
to limit sequence-cluster subsampling (Figure           microbiota (“all bacteria”) and Proteobacteria
S1). At the vineyard scale (i.e., the total microbial   were positively related with soil pH and OM at
pool), the bacterial community in the root              the α-diversity scale (Table 1A; Figure S3A). The
endosphere was dominated by the Proteobacteria          sequence-cluster richness of the γ-proteobacteria
phylum (733 sequence- clusters representing             increased with higher soil OM content (Table 1A;
72 % of the sequences in terms of relative              Figure S3A). Conversely, the sequence-cluster
abundance) (Figure 2). Within Proteobacteria,           richness of the Actinobacteria and Acidobacteria
α-, γ- and δ-Proteobacteria classes accounted           were only impacted by plant-specific factors
for 404 (43 % of the sequences), 215 (25 % of           (Table 1A; Figure S3A). Indeed, the sequence-
the sequences) and 114 (4 % of the sequences)           cluster richness of the Actinobacteria was higher
sequence-clusters respectively. The Bacteroidetes       in the Cabernet-Sauvignon cultivar than in
phylum represented 184 (12 % of the sequences)          Merlot and the sequence-cluster richness of the
of the sequence-clusters. The vine-root microbiota      Acidobacteria increased with the age of the vine
contained 158 fungal sequence-clusters mainly           plants (Table 1A; Figure S3A). Interestingly,
composed of Ascomycota (80 sequence-clusters,           at the γ-scale, the sequence-cluster richness of
76 % of the sequences in term of relative               almost all the bacterial taxa found to be significant
abundance), Basidiomycota (34 sequence-clusters,        (“all bacteria”, Proteobacteria, α-Proteobacteria
12 % of the sequences), and Glomeromycota               and Acidobacteria) was positively related with
(23 sequence-clusters, 10 % of the sequences)           soil P2O5 content and independent of all other
(Figure 2).                                             factors (Table 1C).

OENO One 2021, 3, 299-315                                © 2021 International Viticulture and Enology Society - IVES 305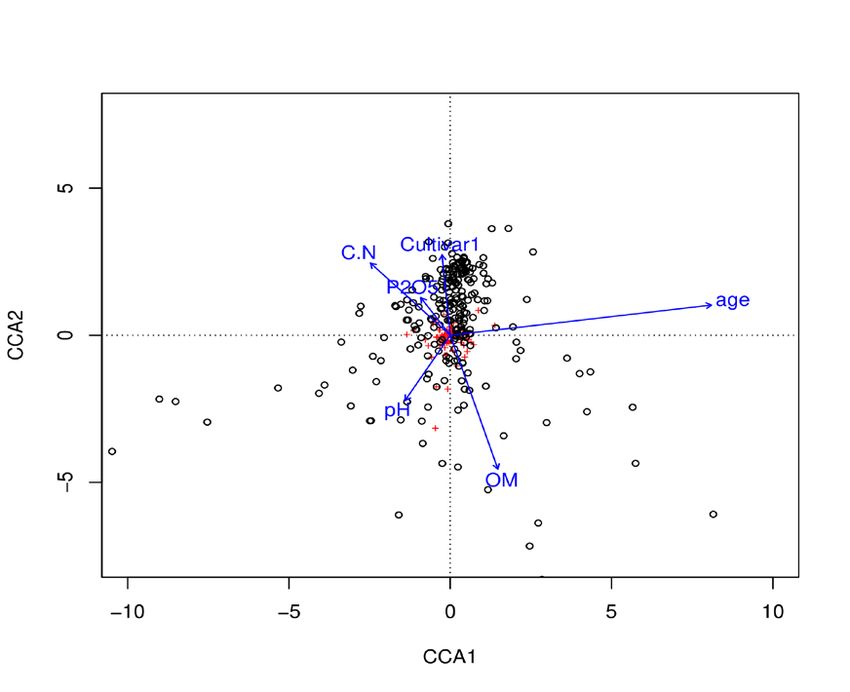
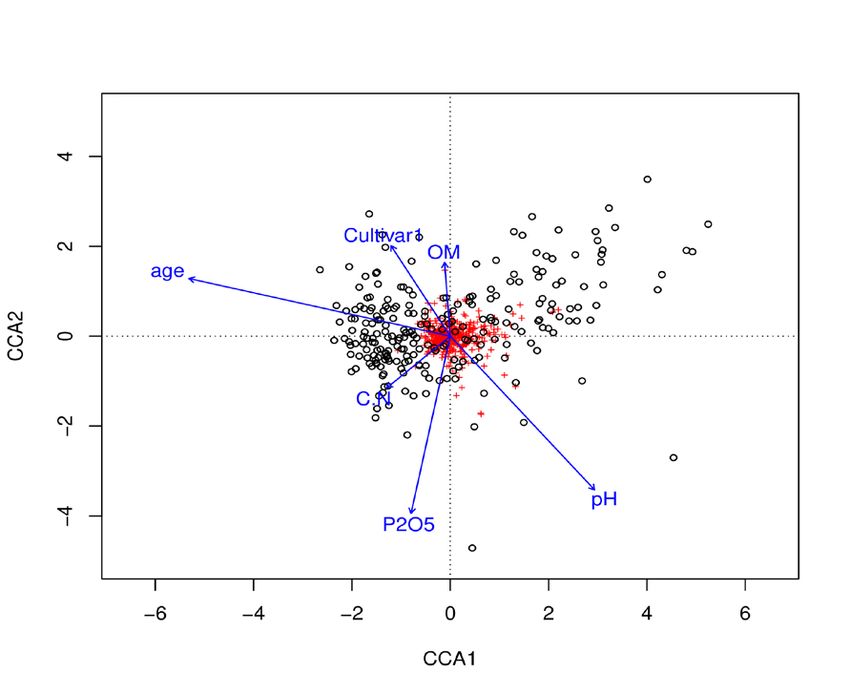
(A) Bacteria CCA (sequence-clusterTable~pH+C/N+OM+P2O5+Age+Cultivar)
(i) All bacteria (ii) Proteobacteria (iii) Alpha-proteobacteria
ANOVA Chisq F p-value ANOVA Chisq F p-value ANOVA Chisq F p-value
Model 0.28 1.72 0.001*** Model 0.26 1.85 0.001*** Model 0.20 2.12 0.001***
Marine Biget et al.
R2=0.043 R2=0.046 R2=0.052
Cultivar
Cultivar pH OM
Age
Age
Age
pH Cultivar C/N
OM
pH
P2O5
Factors pH Age Cultivar pH OM Age Cultivar pH C/N OM P2O5 Age Cultivar
306 © 2021 International Viticulture and Enology Society - IVES
F-value (p) 1.35* 3.06*** 1.64*** 1.52* 1.52* 3.23*** 1.68*** 1.66* 2.09* 1.93* 1.69* 3.42*** 1.94***
(iv) Gamma-proteobacteria (v) Delta-proteobacteria (vi) Bacteroidetes
ANOVA Chisq F p-value ANOVA Chisq F p-value ANOVA Chisq F p-value
Model 0.30 2.05 0.001*** Model 0.44 2.69 0.001*** Model 0.39 1.99 0.001***
R2=0.051 R2=0.065 R2=0.049
P2O5
pH Cultivar
pH Cultivar
P2O5
C/N
Age
Age
OM
Age Age
C/N
Cultivar
pH C/N Age Cultivar
pH C/N OM P2O5 Age Cultivar pH P2O5 Age Cultivar
F-value (p) 1.84** 1.95* 3.89*** 2.00**
1.86** 1.91* 3.08*** 2.44** 5.03*** 1.80** 1.35* 2.04* 3.67*** 2.15***
OENO One 2021, 3, 299-315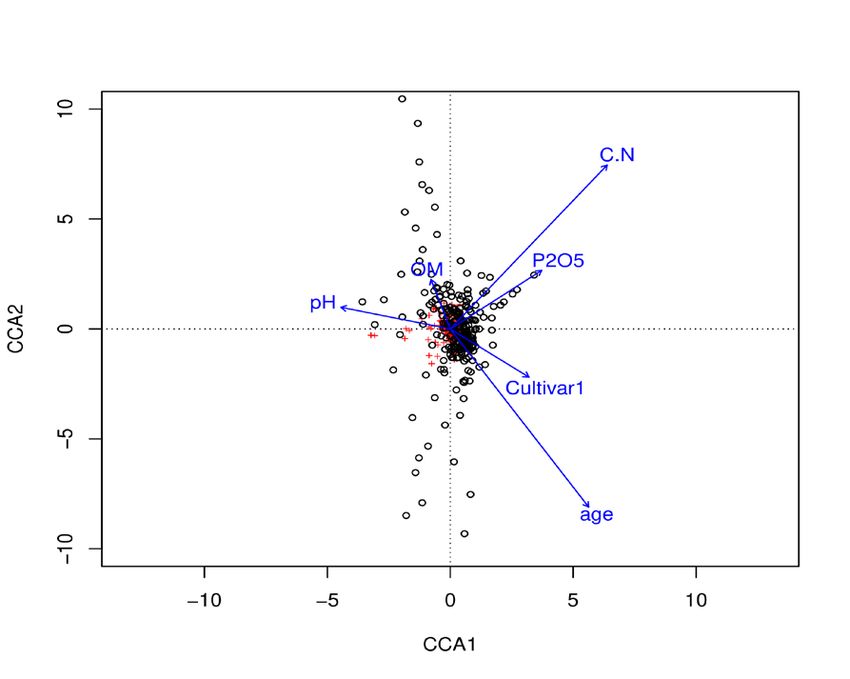
(B) Fungi CCA (sequence-clusterTable~pH+C/N+OM+P2O5+Age+Cultivar)
(i) All fungi (ii) Ascomycota (iii) Basidiomycota
ANOVA Chisq F p-value ANOVA Chisq F p-value ANOVA Chisq F p-value
Model 0.21 1.92 0.001*** Model 0.09 1.27 0.05* Model 0.28 2.87 0.001***
2 2
R =0.045 R =0.03 R2=0.066
C/N
OENO One 2021, 3, 299-315
C/N
Age
pH
OM
Cultivar
P2 O 5
Age pH
Factors pH C/N Age Cultivar Age pH C/N OM P2O5
F-value (p) 1.50* 3.12*** 2.75*** 1.47* 2.86*** 2.25* 6.01** 4.44*** 2.16*
*
(iv) Glomeromycota
ANOVA Chisq F p-value
Model 0.38 6.55 0.001*** FIGURE 3. Effect of abiotic and plant-specific factors on the composition
R2=0.14 Cultivar of the endospheric (A) bacterial and (B) fungal communities inhabiting the
vine plant roots at the α-scale.
C/N
Percentages of explained deviance and significance were calculated using ANOVA-like
permutation tests with canonical correspondence analysis (CCA). Only major bacterial phyla
pH are represented (A) on the figure. All fungal phyla are represented (B). ANOVA tables show
the significance for the CCA model.
P2O5
Factors tested: age of the vine plant, cultivar (Merlot or Cabernet-Sauvignon), OM (Organic
Age Matter), C/N ration (carbon/nitrogen ratio), pH and P2O5. Factors which significantly
influence the microbial composition are reported on tables.
Values are given (F-value) for the «all bacteria» / «all fungi» communities and the associated
phyla when the explained deviance is significant (*, P < 0.05; **, P < 0.01; ***, P < 0.001).
Black dots represent the samples and red crosses represent sequence-clusters.
pH C/N P2O5 Age Cultivar
F-value (p) 5.0*** 13.65*** 4.46 ** 7.40 *** 7.71***
© 2021 International Viticulture and Enology Society - IVES 307Marine Biget et al.
TABLE 1. Summary of the models calculated by model averaging that explain bacterial and fungal
sequence-cluster richness and evenness at two scales of diversity analysis.
Alpha scale pH C/N ratio OM
(A) Richness Inter E Z CI E Z CI E Z CI
All Bacteria 194.95 15.56 2.34* 2.5/28.6 17.87 3.36 *** 7.4/28.2
Proteobacteria 134.86 12.32 2.2* 1.3/23.3 14.17 3.12 ** 5.4/22.9
Gamma-proteobacteria 47.01 4.92 3.52 *** 2.2/7.7
Actinobacteria 17.03
Acidobacteria 4.89
All Fungi 37.00
Ascomycota 18.90
(B) Evenness
Actinobacteria 0.75
Gamma scale pH C/N ratio OM
(C) Richness Inter E Z CI E Z CI E Z CI
All Bacteria 657.46
Proteobacteria 465.37
Alpha-proteobacteria 271.42
Acidobacteria 13.44
Ascomycota 47.05
Glomeromycota 13.18
(D) Evenness
Alpha-proteobacteria 0.97 -0.0026 2.3* -0.005/-0.0005 0.007 2.07* 0.0004/0.014
Actinobacteria 0.83
Acidobacteria 0.74
Models are based on variables of abiotic factors (pH, C/N ratio, OM and P2O5) and plant-specific factors (age and cultivar)
(A) Richness of the bacteria and fungi at the α-scale - (B) Evenness of the bacteria and fungi at the α-scale
(C) Richness of the bacteria and fungi at the γ-scale - (D) Evenness of the bacteria and fungi at the γ-scale
The table summarizes the model-averaged estimates (E), value «z-score» (Z) when significant *, P < 0.05; **, P < 0.01; ***, P <
0.001; and 95 % confidence interval (CI) of the independent variable(s) according to the AICc framework. Confidence intervals
that did not encompass zero are in bold.
R2m and R2c describe the α-scale and adjusted-R2 the γ-scale and were calculated for the best model.
(Table 1 continues on next page).
308 © 2021 International Viticulture and Enology Society - IVES OENO One 2021, 3, 299-315(Table 1 continued from previous page).
Alpha scale P 2O 5 Age Cultivar Model
(A) Richness E Z CI E Z CI E Z CI R2m (R2c)
All Bacteria 0.082 (0.13)
Proteobacteria 0.088 (0.17)
Gamma-proteobacteria 0.085 (0.15)
Actinobacteria -3.07 2.48* -5.5/-0.6 0.13 (0.24)
Acidobacteria 0.057 3.11 ** 0.02/0.09 0.10 (0.33)
All Fungi 4.52 3.14 ** 1.7/7.3 0.057 (0.15)
Ascomycota 3.59 4.47 *** 2.0/5.2 0.13 (0.19)
(B) Evenness
Actinobacteria -0.003 3.69 *** -0.005/-0.001 0.17 (0.34)
Gamma scale P2O5 Age Cultivar Model
(C) Richness E Z CI E Z CI E Z CI Adjusted R2
All Bacteria 304.13 2.31* 46.4/561.8 0.136
Proteobacteria 224.56 2.42* 42.4/406.7 0.157
Alpha-proteobacteria 124.04 2.30* 18.2/229.9 0.134
Acidobacteria 0.09 2.04* 0.003/0.18 0.102
Ascomycota 4.72 2.21* 0.54/8.89 0.107
Glomeromycota -0.061 2.32* -0.11/-0.009 0.118
(D) Evenness
Alpha-proteobacteria 0.153
Actinobacteria -0.003 2.46* -0.0045/-0.0005 0.219
Acidobacteria 0.0021 2.35* 0.0004/0.004 0.142
OENO One 2021, 3, 299-315 © 2021 International Viticulture and Enology Society - IVES 309Marine Biget et al.
Considering evenness at both α- and γ-scales, The effects of abiotic and plant-specific factors on
we only observed few significant effects of fungal richness and evenness varied depending on
environmental factors on the bacterial communities the phylum considered. At the α-diversity scale, the
and age was the only plant-specific factor altering sequence-cluster richness of the fungal microbiota
the evenness of the bacterial communities (“all fungi”) community was related to the cultivar
(Table 1B, Table 1D). Indeed, α-Proteobacteria alone and was higher in the Merlot cultivar
communities were more equitable with a high soil (Table 1A; Figure S3B). This was mostly due to
OM content but were less diverse with a higher changes in the Ascomycota community, which was
C/N ratio at the γ-scale (Table 1D). Actinobacteria the only fungal phylum influenced by the factors
communities were more equitable in old vine we tested (Table 1A; Figure S3B). At the γ-scale,
plants but were dominated by certain sequence- the sequence-cluster richness of the Ascomycota
clusters in young individuals at both α- and γ-scales also responded to the cultivar and was higher in
(Table 1B, Table 1D; Figure S3A). Acidobacteria Merlot than in Cabernet-Sauvignon (Table 1C;
displayed higher equitability with increasing ages Figure S3B). Interestingly, at the γ-scale, the
of the vine plants at both the γ-scales (Table 1D). Glomeromycota richness decreased with the age
of the vine plants (Table 1C). Considering fungal
To summarise the bacterial results, we found that evenness at both scales, no significant effects of
soil pH caused shifts within the “all bacteria” either soil or plant-specific factors were found.
community as well as enrichment of the microbial
To summarise the fungal results, we found that
pool whereas the age of the vine plants and the
the fungal community was richer in Merlot and
cultivar influenced the composition but not the
the composition of fungi differed in Merlot and
richness of the “all bacteria” community (Figure
Cabernet-Sauvignon, whereas the C/N ratio and
3A and Table 1A). At the phylum level, significant
the vine age affected the composition of the entire
effects of the soil pH and the soil OM, as well as fungal community (“all fungi”) but did not change
the cultivar and the age of vine plants resulted sequence-cluster richness (Figure 3B; S2B and
in shifts of communities linked with either Table 1A). At the phylum level, either the abiotic or
enrichment (Proteobacteria) or impoverishment the plant-specific factors were involved in changes
(Actinobacteria, Acidobacteria) of the bacterial in the fungal communities but did not alter their
communities (Figures 3A; 2SA and Table 1A). richness (Figure 3B; S2B and Table 1A).
Considering the other phyla, the impacts of the
tested factors on microbial community structure DISCUSSION
caused shifts within the communities but no
1. Endospheric root microbial communities
change in the bacterial richness (Figure 3A and
Table 1A). In this study, we analysed the vine root-endosphere
composition by characterizing both bacterial and
3. Drivers of the fungal community in vine
fungal communities. The root endosphere mostly
roots at both α- and γ-diversity scales originates from the soil reservoir after passive
At the α-diversity scale, we found significant or active recruitment (Bulgarelli et al., 2012;
effects of the pH, C/N ratio, vine age, and cultivar Vandenkoornhuyse et al., 2015) and because of the
on the “all fungi” community composition significant impact of the root endosphere on plant
(Figure 3B). Basidiomycota composition was also health and growth, the endospheric microbiota
influenced by the concentration of OM and P2O5 in may be key to better define the microbial terroir
the soil (Figure 3B). Changes in the composition of vineyards.
of the Glomeromycota community were caused by This analysis of the vine root endosphere microbiota
the following factors: pH, C/N ratio, P2O5, age of was performed at the level of a single domain
the vine and cultivar (Figure 3B). At the γ-diversity at Margaux (France) to ensure homogeneous
scale, both the C/N ratio and the age of the vine viticulture across the sampled plots. Elsewhere
significantly explained the fungal composition the gravelly sandy soils are known to be similar
in the roots of the “all fungi” community (Figure among parcels with no elevation and limited
S2B). We also demonstrated important effects physico-chemical variations. From the sampled
of the pH, the C/N ratio, the age of the vine and roots, a total of 1051 bacterial and 158 fungal
the cultivar on the Glomeromycota community sequence-clusters composed the vine-root
composition in vine roots (38.46 % significantly endospheric microbiota in this study. The
explained deviance; Figure S2B). composition of the root endospheric microbiota in
310 © 2021 International Viticulture and Enology Society - IVES OENO One 2021, 3, 299-315the vine plants (i.e., Proteobacteria and Ascomycota and possible patchiness in the P2O5 bioavailability.
as the major phyla) was comparable in size to other Another example of such a relationship detected at
studies analysing roots endospheres of different the γ-scale but not at the α-scale was a reduction
types of plants as maize (Gomes et al., 2018), agave in Glomeromycota richness in older individual
(Coleman-Derr et al., 2016), herbaceous plants vines compared to that in younger ones. This
(Glechoma hederacea) (Vannier et al., 2018) may be due to higher convergence in species
and vine plants (e.g., for review Liu et al., 2019). composition among mature individuals in a given
In vine plants, a recent study compared the field (i.e., lower beta-diversity), leading to lower
bacterial and fungal microbiota of different total species richness at the field scale. This
bio-compartments and similarly as herein, convergence among individuals might be the result
demonstrated that the composition of the roots of a stronger influence of a host-preference effect
microbiota was dominated by the same two main in more mature individuals than in younger ones.
phyla, Proteobacteria and Ascomycota (Deyett and Bulgarelli et al., (2013) defined the root microbiota
Rolshausen, 2020; Liu and Howell, 2020). This as a succession of dynamic processes combining
observation of selective filtering leading to a high primary colonization of microbes from the soil/
proportion of Proteobacteria and Ascomycota in rhizosphere to the roots and subsequent host
the plant microbiota endosphere has been recently recruitment of proper microorganisms depending
explained by both plant-microbiome co-evolution on host requirements (Bulgarelli et al., 2013). Our
and niche adaptation (Trivedi et al., 2020). results suggest that both mechanisms – priority
effect and host-preference – are likely to be
2. Multi-scale spatial heterogeneity of plant inversely related and to depend on the stage of
microbiota succession of the microbial assemblage in relation
Our multi-scale sampling design enabled us to to the development of the host plant.
demonstrate marked spatial heterogeneity in plant 3. Bacterial- and fungal-root endosphere
microbiota at the plant individual scale (α-scale) composition shaped by environmental factors
and the scale of a group of individuals in the field
(γ-scale). As hypothesised, this variability was Confirming our hypotheses, environmental factors
explained by changes in environmental factors were seen to shape bacterial and fungi communities
including abiotic factors, but also in plant-specific through changes in the sequence-cluster identity
factors. and to a lesser extent, by modifying their richness
and/or relative evenness.
Because the global γ-diversity scale corresponds
to the sum of α-diversity + β-diversity (i.e., A pattern shared by the two taxonomic groups was
β-diversity measuring the difference between the strong effect of pH. pH is widely recognised
individuals), low β-diversity (i.e., γ-diversity ~ as an important driver of microbial communities,
α-diversity) could lead to similar responses to notably because it can act on microbial enzyme
environmental factors at both α- and γ- scales, activity or can regulate the ionization balance
while strong β-diversity could lead to divergent in the soil, thereby affecting the accessibility of
responses between the α- and γ-diversity scales. nutrients for microorganisms (Burns et al., 2015;
It should be noted that differences in the detected Liang et al., 2019; Pacifico et al., 2019). Most
statistical signal could also result from differences relationships between P2O5, C/N and OM and
in the statistical power of the analysis between root endosphere microbial communities differed
the α- and γ-diversity scales, i.e., sampling units between bacteria and fungi but also within each
are 8-fold higher at the α-scale than at the γ-scale. group, suggesting fine adjustments of microbiota
Most of the relationships we detected differed at composition depending on these factors. For
both diversity scales, for instance, the effects of the instance, the “all fungi” community was particularly
pH and OM on “all bacteria” community richness affected by the C/N ratio whereas the “all bacteria”
and the cultivar on the “all fungi” community community appeared unaffected by this factor. As
richness were significant at α-scale but not at the C/N ratio is usually considered as a key proxy
γ-scale. Reciprocally, a few relationships were for nutrient accessibility (Zhang and Elser, 2017),
detected at the γ-scale but not at the α-scale, for changes in soil C/N ratio likely impact fungal
example, an increase in bacterial richness with an biosynthesis processes as well as food-seeking
increase in soil P2O5. P2O5 concentration may thus strategies (Cleveland and Liptzin, 2007). At a finer
be heterogeneous particularly at a very fine scale and scale of taxonomy, we showed a stronger effect
hence affect local microbial richness. Furthermore, of the C/N ratio on the Glomeromycota compared
we cannot exclude the existence of spatial variation to the effect on the Basidiomycota community.
OENO One 2021, 3, 299-315 © 2021 International Viticulture and Enology Society - IVES 311Marine Biget et al.
All the members of Glomeromycota are involved processes involved in the colonization of roots by
in arbuscular mycorrhization and are thus very microorganisms over the vine’s lifetime (Chang
important microorganisms known to supply their and Turner, 2019). However, we cannot exclude an
host plants with mineral nutrients and water and indirect effect of the history of management of the
to improve host-plant resistance to different kinds individual vine plants on these natural processes.
of stress (e.g., Smith and Read, 2009), as already Rootstock genotype plays a role in shaping and
demonstrated in vine plants (Nicolás et al., 2015; recruiting the endophytic microbial communities
Trouvelot et al., 2015). In exchange for these of the vine plants (D’Amico et al., 2018;
services, Glomeromycota receive carbon Marasco et al., 2018). However, this age-related
synthesised by their host (e.g., Smith and Read, effect on the root endospheric microbiota could
2009; Johnson, 2010). If the C/N ratio decreases not be statistically linked to a rootstock genotype
(the N content is higher) in some cases, the vine effect (see methods) and a plant-maturity related
plants would have easier and more direct access niche differentiation is more likely.
to nitrogen and this would directly impact the
Glomeromycota community. Therefore, as 5. Toward a microbial terroir at the vineyard
suggested by our results, the Glomeromycota scale
community is more likely to be affected by The idea of an existing microbial terroir in
changes in the C/N ratio than other components of vineyards is gradually growing
the fungal microbiota communities. (Gilbert et al., 2014; van Leeuwen et al., 2018).
4. Vine plants shaped their own bacterial and Our results reveal new dimensions of the spatial
fungal root endosphere microbiota profile of microbial communities in vineyards
at the level of field in a highly homogeneous
We also demonstrated a general influence of winegrower’s domain in terms of soil bedrock and
cultivar and age on microbial composition but not soil type (smaller geographic scale). This work is
necessarily an effect on richness. This suggests pivotal in that it demonstrates in vine plants that the
that these parameters induce a shift in sequence- endospheric microbiota differs according to both
cluster composition rather than affecting the the environment and plant-specific parameters
number of species recruited. This shift may result including cultivar and the age of the vine. If these
from ecological and biological mechanisms. new small-scale dimensions are confirmed by
Like Glomeromycota, which show no host-plant subsequent analyses (i.e., seasonal variability)
specificity, it can be assumed that most members and if these observed microbial variations are
of the vine microbiota are not specific to their consistent with impacts on grapevine phenotypes,
host. They are associated with a given host due to our work could offer wine-makers the opportunity
host-plant filtration of colonisers. to include this dimension in their production with
the use of spatial maps of this microbial terroir.
In agreement with this interpretation, different Because variations in microbial communities
authors have reported filtering effects of the exist at the level of a single vineyard and in
roots (e.g., Bulgarelli et al., 2012) depending nearby locations, it is reasonable to suggest that
on the type of plant and/or plant genotype understanding the complex interactions between
(Zarraonaindia et al., 2015; Marasco et al., 2018; bacteria, fungi and the vine plants could help
Martínez-Diz et al., 2019) involved in the vine-growers adapt their management practices
recruitment of microorganisms. The analysis and finally intensify the specificity of a vine and
of grape and soil samples from three different enhance the final product.
cultivars showed that some bacterial sequence-
clusters were specific to a particular cultivar Acknowledgements: This work was supported
(Mezzasalma et al., 2018). Berlanas et al., (2019) by the “Agence Nationale de la Recherche
analysed microbiota in mature and young et de la Technologie” (ANRT) through an
vineyards by focusing on the rhizosphere industrial CIFRE agreement between Château
compartment and reported that, instead of a Palmer, Château Latour, Sovivins, Pépinière
clear distinction between microbial communities de Salettes and the University of Rennes 1
in young and mature vineyards, differences (Agreement N° 2017/1579). We are grateful
were rather due to many different factors that to the GENTYANE (http://gentyane.clermont.
included rootstock genotype. To our knowledge, inra.fr/) and, within ANAEE-France research
our results also emphasised for the first time, a infrastructure, the EcogenO platform (https://
strong age effect of the vine on its root endosphere ecogeno.univ-rennes1.fr/?[en]) for help with DNA
microbiota. This may be linked to a succession of extraction and amplicon sequencing, respectively.
312 © 2021 International Viticulture and Enology Society - IVES OENO One 2021, 3, 299-315We are also grateful to the Genotoul platform Bulgarelli, D., Schlaeppi, K., Spaepen, S.,
Toulouse Midi-Pyrénées (https://www.genotoul.fr/) van Themaat, E. V. L., & Schulze-Lefert, P. (2013).
for access to their bioinformatics pipeline and Structure and Functions of the Bacterial Microbiota
storage facilities. We would like to acknowledge of Plants. Annual Review of Plant Biology,
all the trainees and people at Château Palmer 64(1), 807-838. https://doi.org/10.1146/annurev-
arplant-050312-120106
for their help during the sampling campaign,
especially Sylvain Fries who helped design the Burnham, K.P., & Anderson, D.R (2002). Model
experiment and select the vine plants. We are also Selection and Multimodel Inference: A Practical
grateful to Sophie Michon-Coudouel, Romain Information-Theoretic Approach. Springer-Verlag.
Causse-Verdines and July Hémon for molecular Burns, K. N., Kluepfel, D. A., Strauss, S. L.,
analysis and to Léa Uroy and Lucie Lecoq for Bokulich, N. A., Cantu, D., & Steenwerth, K. L. (2015).
helpful advice on statistics. Vineyard soil bacterial diversity and composition
revealed by 16S rRNA genes: Differentiation by
Data Accessibility: cological data are available geographic features. Soil Biology and Biochemistry, 91,
on Figshare on 10.6084/m9.figshare.12453602. 232-247. https://doi.org/10.1016/j.soilbio.2015.09.002
Sequence data are available at European Chang, C. C., & Turner, B. L. (2019). Ecological
Nucleotide Archive (ENA) under accession succession in a changing world. Journal of Ecology,
number PRJEB39327. 107(2), 503-509. https://doi.org/10.1111/1365-
2745.13132
Authors contribution / Conflict of Interest: Cleveland, C. C., & Liptzin, D. (2007). C:N:P
MB, CM, SP, VC and PV conceived the project stoichiometry in soil : Is there a “Redfield ratio” for the
and PV, CM and MB set up the methodology of microbial biomass? Biogeochemistry, 85(3), 235-252.
the study. MB, CM, OJ, AQ, and PV conducted https://doi.org/10.1007/s10533-007-9132-0
the sampling. MB conducted lab experiments Coleman-Derr, D., Desgarennes, D., Fonseca‑Garcia, C.,
and sequence analysis with the help of PV. MA Gross, S., Clingenpeel, S., Woyke, T., … Tringe, S. G.
performed specific data analyses (homemade script (2016). Plant compartment and biogeography affect
- EcogenO platform). MB and CM performed the microbiome composition in cultivated and native
statistical analyses and MB wrote the first draft of Agave species. New Phytologist, 209(2), 798-811.
the paper. All the authors gave their final approval https://doi.org/10.1111/nph.13697
for publication. Compant, S., Samad, A., Faist, H., & Sessitsch, A.
(2019). A review on the plant microbiome: Ecology,
REFERENCES functions, and emerging trends in microbial application.
Belda, I., Zarraonaindia, I., Perisin, M., Palacios, A., Journal of Advanced Research, 19, 29-37. https://doi.
& Acedo, A. (2017). From Vineyard Soil to Wine org/10.1016/j.jare.2019.03.004
Fermentation: Microbiome Approximations to Explain D’Amico, F., Candela, M., Turroni, S., Biagi, E.,
the “terroir” Concept. Frontiers in Microbiology, 8, Brigidi, P., Bega, A., … Rampelli, S. (2018). The
821. https://doi.org/10.3389/fmicb.2017.00821 Rootstock Regulates Microbiome Diversity in Root and
Berlanas, C., Berbegal, M., Elena, G., Laidani, M., Rhizosphere Compartments of Vitis vinifera Cultivar
Cibriain, J. F., Sagües, A., & Gramaje, D. (2019). Lambrusco. Frontiers in Microbiology, 9, 2240.
The Fungal and Bacterial Rhizosphere Microbiome https://doi.org/10.3389/fmicb.2018.02240
Associated With Grapevine Rootstock Genotypes Davison, J., Öpik, M., Daniell, T. J., Moora, M.,
in Mature and Young Vineyards. Frontiers in & Zobel, M. (2011). Arbuscular mycorrhizal
Microbiology, 10, 1142. https://doi.org/10.3389/ fungal communities in plant roots are not random
fmicb.2019.01142 assemblages: Selectivity in AMF-plant associations.
Bokulich, N. A., Thorngate, J. H., Richardson, P. M., FEMS Microbiology Ecology, 78(1), 103-115.
& Mills, D. A. (2014). PNAS Plus: From the Cover: https://doi.org/10.1111/j.1574-6941.2011.01103.x
Microbial biogeography of wine grapes is conditioned Dennis, P. G., Miller, A. J., & Hirsch, P. R. (2010).
by cultivar, vintage, and climate. Proceedings of the Are root exudates more important than other sources
National Academy of Sciences, 111(1), E139-E148. of rhizodeposits in structuring rhizosphere bacterial
https://doi.org/10.1073/pnas.1317377110 communities?: Root exudates and rhizosphere
Bulgarelli, D., Rott, M., Schlaeppi, K., bacteria. FEMS Microbiology Ecology, 72(3), 313-327.
Ver Loren van Themaat, E., Ahmadinejad, N., https://doi.org/10.1111/j.1574-6941.2010.00860.x
Assenza, F., … Schulze-Lefert, P. (2012). Revealing Deyett, E., & Rolshausen, P. E. (2020).
structure and assembly cues for Arabidopsis root- Endophytic microbial assemblage in grapevine.
inhabiting bacterial microbiota. Nature, 488(7409), 91- FEMS Microbiology Ecology, 96(5), fiaa053.
95. https://doi.org/10.1038/nature11336 https://doi.org/10.1093/femsec/fiaa053
OENO One 2021, 3, 299-315 © 2021 International Viticulture and Enology Society - IVES 313Marine Biget et al.
Dormann, C. F., Elith, J., Bacher, S., Buchmann, C., in Microbiology, 10, 2679. https://doi.org/10.3389/
Carl, G., Carré, G., … Lautenbach, S. (2013). fmicb.2019.02679
Collinearity: A review of methods to deal with it MacArthur, R.H., and Wilson, E.O., (1967). The theory
and a simulation study evaluating their performance.
of island biogeography. Princeton university Press.
Ecography, 36(1), 27-46. https://doi.org/10.1111/
j.1600-0587.2012.07348.x Mahé, S., Duhamel, M., Le Calvez, T., Guillot, L.,
Sarbu, L., Bretaudeau, A., … Vandenkoornhuyse, P.
Escudié, F., Auer, L., Bernard, M., Mariadassou, M.,
Cauquil, L., Vidal, K., … Pascal, G. (2018). (2012). PHYMYCO-DB: A Curated Database for
FROGS: Find, Rapidly, OTUs with Galaxy Solution. Analyses of Fungal Diversity and Evolution. PLoS
Bioinformatics, 34(8), 1287-1294. https://doi. ONE, 7(9), e43117. https://doi.org/10.1371/journal.
org/10.1093/bioinformatics/btx791 pone.0043117
Fletcher, D. (2018). Model Averaging. Berlin, Marasco, R., Rolli, E., Fusi, M., Michoud, G., &
Heidelberg: Springer Berlin Heidelberg. https://doi. Daffonchio, D. (2018). Grapevine rootstocks shape
org/10.1007/978-3-662-58541-2 underground bacterial microbiome and networking but
not potential functionality. Microbiome, 6(1), 3. https://
Gilbert, J. A., van der Lelie, D., & Zarraonaindia, I. doi.org/10.1186/s40168-017-0391-2
(2014). Microbial terroir for wine grapes. Proceedings
of the National Academy of Sciences, 111(1), 5-6. Martínez-Diz, M. del P., Andrés-Sodupe, M.,
https://doi.org/10.1073/pnas.1320471110 Bujanda, R., Díaz-Losada, E., Eichmeier, A., &
Gramaje, D. (2019). Soil-plant compartments affect
Gomes, E. A., Lana, U. G. P., Quensen, J. F., de Sousa, S. M.,
fungal microbiome diversity and composition in
Oliveira, C. A., Guo, J., … Tiedje, J. M. (2018).
grapevine. Fungal Ecology, 41, 234-244. https://doi.
Root-Associated Microbiome of Maize Genotypes with
org/10.1016/j.funeco.2019.07.003
Contrasting Phosphorus Use Efficiency. Phytobiomes
Journal, 2(3), 129-137. https://doi.org/10.1094/ Mezzasalma, V., Sandionigi, A., Guzzetti, L.,
PBIOMES-03-18-0012-R Galimberti, A., Grando, M. S., Tardaguila, J., &
Johnson, N. C. (2010). Resource stoichiometry Labra, M. (2018). Geographical and Cultivar Features
elucidates the structure and function of arbuscular Differentiate Grape Microbiota in Northern Italy and
mycorrhizas across scales: Tansley review. New Spain Vineyards. Frontiers in Microbiology, 9, 946.
Phytologist, 185(3), 631-647. https://doi.org/10.1111/ https://doi.org/10.3389/fmicb.2018.00946
j.1469-8137.2009.03110.x Miura, T., Sánchez, R., Castañeda, L. E., Godoy, K.,
Knight, S. J., Karon, O., & Goddard, M. R. (2020). & Barbosa, O. (2017). Is microbial terroir related to
Small scale fungal community differentiation in a geographic distance between vineyards?: Microbial
vineyard system. Food Microbiology, 87, 103358. terroir related to geographic distance. Environmental
https://doi.org/10.1016/j.fm.2019.103358 Microbiology Reports, 9(6), 742-749. https://doi.
org/10.1111/1758-2229.12589
Knight, S., Klaere, S., Fedrizzi, B., & Goddard, M. R.
(2015). Regional microbial signatures positively Morrison-Whittle, P., & Goddard, M. R. (2015).
correlate with differential wine phenotypes: Evidence Quantifying the relative roles of selective and
for a microbial aspect to terroir. Scientific Reports, 5(1), neutral processes in defining eukaryotic microbial
14233. https://doi.org/10.1038/srep14233 communities. The ISME Journal, 9(9), 2003-2011.
Kozich, J. J., Westcott, S. L., Baxter, N. T., https://doi.org/10.1038/ismej.2015.18
Highlander, S. K., & Schloss, P. D. (2013). Development Nakagawa, S., & Schielzeth, H. (2013). A general and
of a Dual-Index Sequencing Strategy and Curation simple method for obtaining R 2 from generalized
Pipeline for Analyzing Amplicon Sequence Data on linear mixed-effects models. Methods in Ecology and
the MiSeq Illumina Sequencing Platform. Applied Evolution, 4(2), 133-142. https://doi.org/10.1111/
and Environmental Microbiology, 79(17), 5112-5120. j.2041-210x.2012.00261.x
https://doi.org/10.1128/AEM.01043-13
Nicolás, E., Maestre-Valero, J. F., Alarcón, J. J.,
Liang, H., Wang, X., Yan, J., & Luo, L. (2019). Pedrero, F., Vicente-Sánchez, J., Bernabé, A., …
Characterizing the Intra-Vineyard Variation of Soil Fernández, F. (2015). Effectiveness and persistence
Bacterial and Fungal Communities. Frontiers in of arbuscular mycorrhizal fungi on the physiology,
Microbiology, 10, 1239. https://doi.org/10.3389/ nutrient uptake and yield of Crimson seedless grapevine.
fmicb.2019.01239 The Journal of Agricultural Science, 153(6), 1084-
Liu, D., & Howell, K. (2020). Community succession of 1096. https://doi.org/10.1017/S002185961400080X
the grapevine fungal microbiome in the annual growth Novello, G., Gamalero, E., Bona, E., Boatti, L.,
cycle. Environmental Microbiology, 1462-2920.15172. Mignone, F., Massa, N., … Berta, G. (2017). The
https://doi.org/10.1111/1462-2920.15172 Rhizosphere Bacterial Microbiota of Vitis vinifera
Liu, D., Zhang, P., Chen, D., & Howell, K. (2019). From cv. Pinot Noir in an Integrated Pest Management
the Vineyard to the Winery: How Microbial Ecology Vineyard. Frontiers in Microbiology, 8, 1528. https://
Drives Regional Distinctiveness of Wine. Frontiers doi.org/10.3389/fmicb.2017.01528
314 © 2021 International Viticulture and Enology Society - IVES OENO One 2021, 3, 299-315You can also read