Differential effects of sodium chloride and monosodium glutamate on kidney of adult and aging mice
←
→
Page content transcription
If your browser does not render page correctly, please read the page content below
www.nature.com/scientificreports
OPEN Differential effects of sodium
chloride and monosodium
glutamate on kidney of adult
and aging mice
Michele Celestino1, Valeria Balmaceda Valdez1, Paola Brun1, Ignazio Castagliuolo1 &
Carla Mucignat‑Caretta 1,2*
Monosodium Glutamate (MSG) is used as flavour enhancer, with potential beneficial effects due
to its nutritional value. Given the decline in kidney functions during aging, we investigated the
impact of MSG voluntary intake on the kidney of male mice, aged 6 or 18 months. For 2 months,
they freely consumed water (control group), sodium chloride (0.3% NaCl) or MSG (1% MSG) in
addition to standard diet. Young animals consuming sodium chloride presented signs of proteinuria,
hyperfiltration, enhanced expression and excretion of Aquaporin 2 and initial degenerative reactions
suggestive of fibrosis, while MSG-consuming mice were similar to controls. In old mice, aging-related
effects including proteinuria and increased renal corpuscle volume were observed in all groups. At
an advanced age, MSG caused no adverse effects on the kidney compared to controls, despite the
presence of a sodium moiety, similar to sodium chloride. These data show that prolonged MSG intake
in mice has less impact on kidney compared to sodium chloride, that already in young animals induced
some effects on kidney, possibly related to hypertension.
Monosodium glutamate (MSG) is a water-soluble salt of glutamate, a non-essential amino acid, normally synthe-
sized in the body and prevalent in food proteins. MSG is mostly known for its flavour enhancement properties
and is commonly added to Oriental food, canned vegetables, soups and processed meat. This compound is able
to elicit the same sensory molecular mechanisms of the “Umami” taste e xperience1. Actually, the human body
is not able to distinguish between glutamate naturally present in food and added one, since they are exactly the
same molecules2. Given the significance as a building block of proteins and the quantitatively high daily inges-
tion of glutamate as protein constituent, free MSG and/or Umami intake has relevant potential properties for
health promotion, by improving palatability and hence food intake, that could be useful in some pathological or
age-related states3. Even during healthy aging, some deficits in nutrition may lead to age-related anorexia and/or
sarcopenia. Different studies show that stimulation of Umami taste promotes salivation, taste function, appetite
and weight gain, helping the overall health in elderly p eople4–7. Different studies and clinical trials have failed
to identify a relationship between the consumption of MSG and possible negative effects8. Careful investigation
of scientific literature by different food safety agencies resulted in declarations that consider MSG as safe (for
USA: https://www.fda.gov/food/food-additives-petitions/questions-and-answers-monosodium-glutamate-msg;
for Europe: https://www.efsa.europa.eu/en/efsajournal/pub/4910, see also9).
In the present study, we explored the effects of dietary supplementation with MSG for 2 months on CD1
male mice, in comparison to sodium chloride (NaCl) or water, focussing on kidney morphology and function.
Two different age groups were chosen to explore the effect of NaCl or MSG supplementation, on young adult
or old mice, in order to observe possible deleterious effects of MSG or NaCl on elderly mice. Starting at 4 or
16 months of age, mice were fed for 2 months with maintenance diet and water ad libitum, with free access to
another bottle containing either MSG (1%), NaCl (0.3%) or water as a control. Sodium chloride supplementation
was administered for its known negative impact on h ealth10, to control for the effect of sodium intake which
takes part also with MSG. We focused on mouse kidneys histology and proteinuria, observed at two ages, as a
consequence of voluntary MSG or NaCl intake.
1
Department of Molecular Medicine, University of Padova, 35131 Padua, Italy. 2Biostructures and Biosystems
National Institute, 00136 Rome, Italy. *email: carla.mucignat@unipd.it
Scientific Reports | (2021) 11:481 | https://doi.org/10.1038/s41598-020-80048-z 1
Vol.:(0123456789)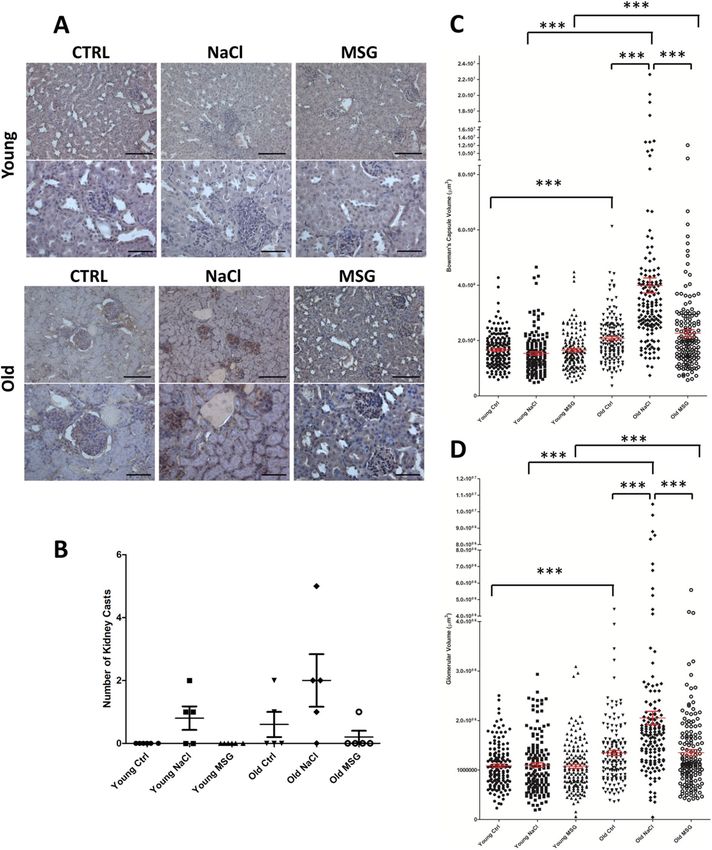
www.nature.com/scientificreports/
Figure 1. Albuminuria in male mice at the end of treatment. Albumin excretion was evaluated with silver
staining. Urinary samples obtained from 6 and 18 months old mice, whose diet was supplemented for 2 months
with water, sodium chloride or MSG (Ctrl, NaCl and MSG, respectively), were examined. N = 8 (young Ctrl), 7
(young NaCl), 8 (young MSG), 5 (old Ctrl), 6 (old NaCl), 7 (old MSG). Mann–Whitney test **p < 0.01.
Results
Albuminuria appears with NaCl supplementation without changing water intake. Initially,
albumin was quantified in urine in order to evaluate a possible kidney damage. Albumin levels measured at the
end of the 2 months treatment indicated that aging, as expected, induced a slight non-significant increase in
albumin excretion. However, in young NaCl group, excretion of albumin was significantly higher if compared
to control animals (Fig. 1 and Supplementary Fig. 1A); a similar trend was also present when the percentage of
total proteins in urine was analysed. Interestingly, MSG did not cause an increase in albumin excretion in urine
(Supplementary Fig. 1B,C). No differences were detected in the kidney weight among treatments (Fig. 2A), apart
from the physiological increase in old compared to young mice. Next, we evaluated water intake at the end of
the supplementation period, without finding significant differences (Fig. 2B). Regarding the substance intake
(i.e. water for control mice, NaCl for NaCl and MSG for MSG mice, respectively) no statistically significant dif-
ferences were apparent (Fig. 2C). Also, body weight and heart weight, normalized to body weight did not differ
(Fig. 2D,E).
Glomerular volume increases upon NaCl addition. Renal histopathology of the glomerular and tubu-
lointerstitial areas revealed the presence of intratubular casts with different morphology and size in some groups
of mice (Fig. 3A, black arrow). Casts were not present in young control and MSG groups (Fig. 3B). Moreover, an
increase in cellular proliferation within the renal tissue (Fig. 3A, black star) was also observed in some animals.
Morphometric measurements on PAS images11 showed a significant expansion of the glomerular and the Bow-
man’s capsule volume with a ging12, with an additional significant increase in old NaCl group, compared to age-
matched groups (Fig. 3C,D, Supplementary Fig. 2). Interestingly, NaCl-supplemented mice presented a larger
glomerular volume already at young age, suggesting that sodium chloride may induce some hypertensive effects
on young and old mice while MSG did not.
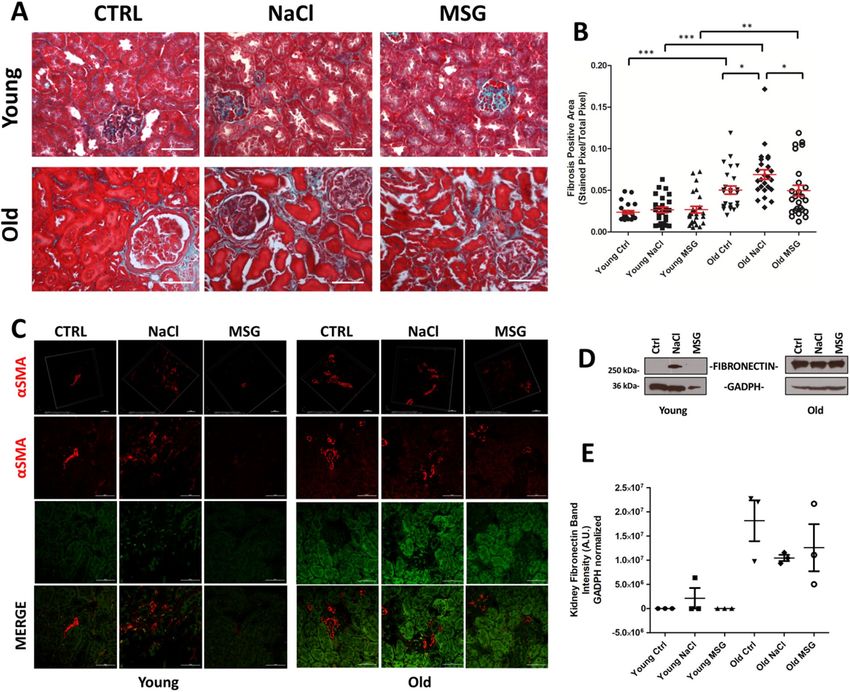
Fibrosis is already apparent in young NaCl mice. Histopathological PAS analysis of kidney sections
revealed thickening of the basal membrane in some animals. Using Gomori trichrome stain, increased collagen
deposition was shown in old mice, independently from the treatment (Fig. 4A). However, when the amount of
fibrosis within the tissue was examined, an increase in positive area was observed in old control and NaCl groups
compared to young mice, while MSG-supplemented old mice did not differ from their young counterparts
(Fig. 4B).
To confirm this, we analysed the distribution of α-Smooth Muscle Actin (αSMA) to assess expansion of myofi-
broblast cells, that represent the major contributors of collagen I and III within the t issues13–15. In our samples,
αSMA increased in aging mice and, surprisingly, also in NaCl young group (Fig. 4C). Also fibronectin (Fig. 4D,E),
rocess16, apparently increased within the kidney parenchyma. PAS staining
which is involved in the fibrogenesis p
revealed also some areas with increased number of cells, independently from age or treatments (Fig. 3A, black
star). Together, these data suggest that fibrosis may be already apparent in young NaCl-supplemented mice and
is even more evident in old controls and NaCl groups. Noticeably, this was not observed in MSG-supplemented
mice at both ages.
Aquaporin 2 expression in kidney and its urinary excretion are increased in young NaCl‑sup‑
plemented mice. Since both NaCl and MSG intake could increase water consumption, we evaluated the
Scientific Reports | (2021) 11:481 | https://doi.org/10.1038/s41598-020-80048-z 2
Vol:.(1234567890)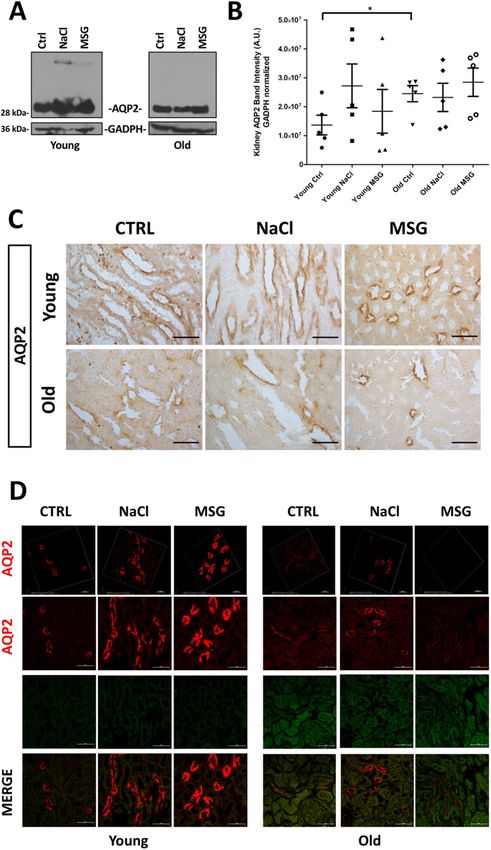
www.nature.com/scientificreports/
Figure 2. Kidney weight and water/substance intake measurements. (A) Ratio of total kidney (left plus right)
weight to body weight in 6 months (young) or 18 months (old) old mice groups. An increase in kidney weight
was associated with aging in each treatment group (n = 21 in each group. t test: *p < 0.05, **p < 0.01, ***p < 0.001).
(B, C) Water (B) and (C) substance (Water, NaCl and MSG respectively) consumption normalized by total
mouse weight within a cage. (D) Body weight at the end of treatment. (E) Heart weight normalized to body
weight (mg/g) at the end of treatment.
expression of the inducible Aquaporin 2 (AQP2) water channel17. Firstly, AQP2 was detected in urine because
AQP2 excretion changes in response to antidiuretic hormone (ADH)18 on a salty diet19. As shown in Fig. 5A,
Aquaporin 2 excretion was significantly higher in young NaCl group, compared to the controls (Fig. 5B). On the
other hand, MSG did not impact AQP2 excretion in urine. Also, an increased release was observed with aging.
Lastly, AQP2 expression was investigated in kidney tissues (Fig. 6A). Semiquantitative Western blot analysis
rocess20,21,
(Fig. 6B) showed a slightly increased expression in young NaCl group and, accordingly with the aging p
a decrease in all old mice. Next, we evaluated also the localization of AQP2 within the kidney (Fig. 6C,D). As
expected, Aquaporin 2 was present in the collecting ducts22 and exhibited a reduced expression in old animals
(Supplementary Fig. 3A,B). In our setting, inducible water channel AQP2 decreased in old mice, independently
Scientific Reports | (2021) 11:481 | https://doi.org/10.1038/s41598-020-80048-z 3
Vol.:(0123456789)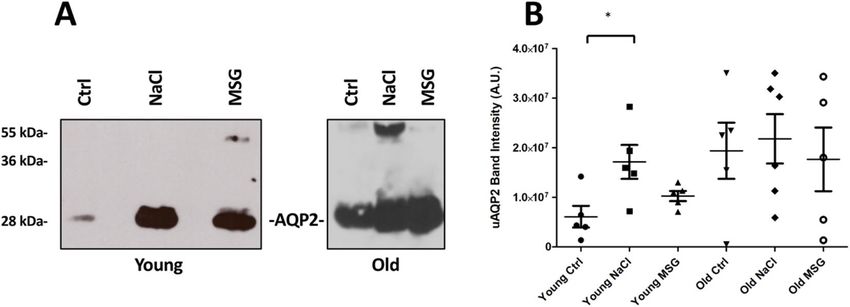
www.nature.com/scientificreports/

                                           Figure 3.  Effect of diet in association with age on renal phenotype. (A) Kidney PAS staining was performed
                                           on 5 male mice randomly selected within each group. Black arrow points to proteinaceous casts and black stars
                                           areas mark increased cellular proliferation, respectively. (B) Mean number of casts in each group (n = 5 mice/
                                           group), no casts were detected in young control and MSG groups. In old mice, NaCl versus MSG group Mann–
                                           Whitney U = 3.50, p = 0.056. (C, D) Bowman’s Capsule volume (C) and Glomerular volume (D) morphometric
                                           measures were performed in PAS-stained tissues. N = 150 glomeruli from 5 mice in each group. t test, *p < 0.05,
                                           **p < 0.01, ***p < 0.001.

          Scientific Reports |   (2021) 11:481 |               https://doi.org/10.1038/s41598-020-80048-z                                                    4

Vol:.(1234567890)
www.nature.com/scientificreports/
Figure 4. Evidence of kidney fibrosis evaluated with histology staining, αSMA labelling and fibronectin
deposition. (A) Representative Gomori trichrome renal staining (× 40). (B) The dot plot analysed the fibrosis
intensity in function of age and treatment (n = 25 sections from 5 mice in each group, t test *p < 0.05, **p < 0.01).
(C) Immunofluorescence showing the presence of αSMA in the kidney. The green channel, unmarked, display
the background and shows the morphology of the tissue. Scale bar, 50 µm. The panels in the first row represent
the 3D reconstruction of the bidimensional images (scale bar 20 µm). (D) Fibronectin deposition in the kidney,
a representative Western blot is shown. (E) Analysis of fibronectin deposition, as a proportion of fibronectin
normalized to GAPDH (A.U. arbitrary units, n = 3/group). No fibronectin was detected in young control and
MSG mice.
from the treatment. Furthermore, in young mice NaCl supplementation increased both the kidney expression and
urine excretion of this protein, possibly reflecting perturbation of the AQP2 balance in response to initial damage.
Discussion
Glutamate accounts for twenty to forty percent of animal and vegetal protein weight, respectively. Within our
body, one fourth of the dietary intake of amino acids belongs to the glutamate family, including glutamine,
proline, histidine, arginine and ornithine besides glutamate itself23. Kidneys have a crucial role in regulating
body homeostasis and disposal of waste substances, including amino acid metabolites. During aging their func-
tion may be impaired, leading to Chronic Kidney Disease (CKD), that is a major health issue for its impact on
cardiovascular health24,25. Various glutamate receptors are present in this organ and may modulate its f unction26
through changes in the function of renal v asculature27, which is also sensitive to variations of sodium chloride
dietary intake28. Morphological changes including proliferation of mesangial cells may be observed after high-
dose MSG injections in adult rats29. A single injection of MSG may increase lipid peroxidation in the kidney
in less than 1 hour30, while prolonged high-dose oral MSG administration may induce congestion and tubular
swelling, besides altering antioxidant system31, thus priming kidney for oxidative damage. However, other labo-
ratories reported no apparent changes in renal morphology after MSG administration in drinking water, despite
increasing water intake32. If high-dose MSG is provided in drinking water, kidney stones have been detected in
Scientific Reports | (2021) 11:481 | https://doi.org/10.1038/s41598-020-80048-z 5
Vol.:(0123456789)www.nature.com/scientificreports/
Figure 5. Analysis of AQP2 excretion in male mice urine. (A) Urine was collected from mice supplemented
with water (control, Ctrl), NaCl (NaCl) or MSG (MSG) at two different end point time (young and old, 6 and
18 months respectively). A typical immunoblot with urinary samples is shown. Two bands can be seen, the top
being glycosylated and the bottom non-glycosylated AQP2. (B) Summary of quantitative data (n = 6 in Old
NaCl group, 5 in all other groups) obtained from immunoblot analysis with relative statistical analysis (t test,
**p < 0.01).
some cases33: however, in this work, no access to plain water was allowed to MSG rats. This may explain why
we did not observe stones in our MSG mice, which freely accessed both plain water and solutions. Increase in
oxidative stress markers is confirmed also by proteomic analysis: also, in this case MSG rats had access only
to MSG-poised drinking water, without access to plain water, a condition which hardly can be seen in real
life34. The effect of either MSG or NaCl added to food and water was also compared: both treatments induced
hypertension, while only MSG evoked hyperfiltration followed by sodium, potassium and water reabsorption,
with the involvement of NMDA r eceptors35. In this model, no increase in lipid peroxidation was observed, but
fibrosis was present36. Despite being relevant part of our diet, several studies in the literature refer to the effects
of injection of a high dose glutamate in neonatal rodents, which results in increased body weight, fat deposition,
decreased motor activity, and secretion of growth hormone in the r at37. All these effects could culminate with
induction of o besity38 and, ultimately, with d iabetes39,40. Apparently, dose, duration and way of administration
impact the effect of MSG on kidney.
To study the effect of MSG in physiological conditions, in the present work we compared the effects of volun-
tary sodium chloride or MSG dietary intake for 2 months in healthy CD1 male mice maintained with balanced
diet, at two different ages, corresponding to human adult and initial third age. While blood pressure would be
an interesting variable to study, it is quite hard to obtain in living mice, because tail cuff impedes free movement,
while permanently implanted catheters or implanted telemetry are invasive and stressful manipulations. In our
experimental setup, we aimed at studying mouse intake in a rather quiet condition, to avoid the effect of stress
hormone on the kidney and on the cardiovascular system, which in turn influence kidney function. For the same
reason metabolic cages were not used: in order to link data from single mice, collection of urine from a single
animal should be performed while avoiding the stress of putting mice, a social species, in chronic isolation.
Compared to other mouse strains, CD1 mice are a good model for metabolic studies, e.g. fatty acid trafficking,
in various o rgans41,42. Initially, we detected an increase in albuminuria after NaCl supplementation, more evident
in young mice, while in MSG-supplemented mice values were similar to controls. Albuminuria is a fallout of
high NaCl intake in humans as w ell43 and is a major determinant of kidney fibrosis and end-stage renal f ailure44.
In our animal model supplemented with 1% MSG, the relative kidney and body weights remained unaltered
during 2 months. Similar results were found in NaCl-supplemented mice, in which kidneys/body weight ratio
was unaffected. Prolonged high sodium chloride diet on rats did not alter the kidney/body weight ratio used
as an index of renal hypertrophy45 whereas it may cause hyperphagia in mice and humans without changes in
weight, due to a hypercatabolic state associated to loss in the abdominal fat46. The mice groups that had free
access to 0.3% NaCl solution showed similar liquid intake to the control animals. Under the present conditions,
which include voluntary ingestion of the substance, at a lower dosage compared to other studies and in the
presence also of plain water, no apparent changes were detected in kidney morphology of MSG-supplemented
mice. NaCl-supplemented mice occasionally presented casts already at young age, and in old individuals they
were more numerous. Actually, casts may be present in aging kidneys per se. Also, in rats and humans NaCl may
induce alteration in the kidney architecture including casts and fi brosis47.
In the present study, we did not detect apparent changes in kidney morphology in MSG mice upon free access
to MSG. In line with our results, other laboratories reported no alteration in renal morphology after MSG admin-
istration in drinking w ater48. Also, an extensive re-evaluation of glutamate intake effects on the kidney revealed
only an increase in organ weight at high dosages, without any histopathological fi nding9. In our experimental
setting, with free access to water, we did not observe the presence of stones in the kidney tissues analyzed. It must
be emphasized that feeding only with MSG-poised drinking water, without access to plain water, is a condition
which hardly can be seen in real life. Furthermore, our old NaCl group also showed alterations in morphometric
analysis of the renal corpuscle, with a larger Bowman capsule and glomerular volume, that is often linked to
Scientific Reports | (2021) 11:481 | https://doi.org/10.1038/s41598-020-80048-z 6
Vol:.(1234567890)www.nature.com/scientificreports/
Figure 6. AQP2 expression and localization in kidney tissue. (A) Western blot analysis showing the effects of
dietary supplementation and age on the expression of AQP2. (B) AQP2 relative intensity analysis performed
on WB (A.U. arbitrary units, n = 5). Representative immunohistochemistry (C) and immunofluorescence
(D) showing the tissue distribution of AQP2 in collecting ducts. The green channel, unmarked, displays the
background and shows the morphology of the tissue. Scale bar: 50 µm. The panels in the first row represent the
3D reconstruction of AQP2 bidimensional image series (scale bar: 20 µm).
Scientific Reports | (2021) 11:481 | https://doi.org/10.1038/s41598-020-80048-z 7
Vol.:(0123456789)www.nature.com/scientificreports/
hyperfiltration49. The impact of NaCl on kidney structure is both direct and indirect, through a general increase
in systemic blood pressure50. Moreover, aging per se may induce glomerulosclerosis and interstitial fibrosis, that
is indirectly supported by the increase of Ki67 m arker51. Noticeably, the CD1 mice strain is particularly prone
brosis52. Accordingly, our old mice showed fibrosis compared to young, in particular the NaCl group.
to renal fi
Noteworthy, MSG-supplemented old mice did not differ from young, which were similar to young controls.
One of the most plastic features of kidney is its ability to reabsorb water according to body needs. Aquapor-
ins are post-transcriptionally downregulated in aging rat k idneys53, accounting for a decreased ability of aging
kidneys to concentrate urine. AQP2 expression in the kidney is upregulated by water d eprivation53,54 and also
55,56
by protein load , but neither in young nor in old MSG groups we detected an increase in this protein, if com-
pared to age-matched controls. AQP2 urinary (uAQP2) excretion reflects short-term changes in vasopressin
release, being both suppressed by water load and increased by sodium chloride administration, hence uAQP2
represents a marker for collecting duct responses to vasopressin57. Surprisingly, we did not detect significant
changes, except for an increase in urinary excretion of AQP2 in NaCl young group, compared to controls. Fur-
thermore, we did not observe any significant variation in MSG-supplemented mice. Lastly, sodium chloride
ingestion implies that both sodium and chloride ions may act inside the body: indeed, hyperchloremia is asso-
ciated to renal vasoconstriction that decreases the glomerular filtration rate, due to the autoregulatory tubule-
glomerular feedback control m echanism58. Moreover, chloride is a modulator of transtubular transport via the
sodium chloride cotransporter, functionally coupled to potassium fl ux59. Extracellular chloride may also activate
a molecular switch on collagen IV which promotes scaffolding outside the cells, thus impairing kidney tissue
architecture and ultimately its f unction60. Chloride channels in vascular smooth muscle cells, either activated by
volume like ClC-3 or by calcium like TMEM16A, are involved in hypertension genesis61–63, like the electroneutral
sodium–potassium-chloride cotransporters, that sense intracellular chloride in vascular smooth muscle cells
and neurons (NKCC1) and in the renal tubular fluid (NKCC2)64. Notably, chloride gradient is the main driv-
ing force for NKCC2 activation in the thick ascending limb, thus affecting ion trafficking across the epithelial
membrane65. Also, deregulation of claudins affect paracellular Cl– transport causing h ypertension66. Thus, the
deleterious effect detected in NaCl supplemented mice are possibly linked to both sodium and chloride ions.
Conclusion
The increase in glomerular volume, in fibrosis and in water channels point to a possible enhancement in arterial
blood pressure in mice whose diet was supplemented with sodium chloride. These changes were not apparent in
mice supplemented with monosodium glutamate. Given that the intake of sodium was similar in both groups, it
is tentative to speculate on the deleterious role of chlorine ions ingestion. Actually, signs of damage were appar-
ent in young animals, indicating that they were already prone to the negative effects of NaCl. Mice exposed to
MSG in our more ecological setting did not face these problems, confirming a safe use of dietary MSG in both
young and old age.
Methods
Animal experiments. The experiments conformed to the European law on animal experiments (2010/63/
EU) and were authorized by University of Padova Ethical Committee (OPBA) and the Italian Ministry of Health
(permission number 102/2016PR). Male CD1 mice, 4 (Young) or 16 (Old) months old, were kept under con-
trolled environmental conditions (temperature: 23 °C, humidity: 60%, lights on: 6:00–18:00). During the experi-
ment, animals had free access to diet and tap water; an additional bottle was added to each cage, containing
either water (Control), 0.3% w/w sodium chloride in water (NaCl, Sigma-Aldrich Milan, Italy) or 1% w/w mon-
osodium glutamate in water (MSG, Ajinomoto Co.) for 2 months. Concentration of MSG solution was chosen
to mimic human daily ingestion67 assuming a regular drinking activity, and mice preference tests68, while NaCl
concentration was chosen to be equimolar in sodium to MSG solution and attractive to mice. During the last
2 weeks of treatment, food and water consumption was determined. At the end of treatment, mice were anesthe-
tized with halothane and sacrificed by cervical dislocation. The right kidney was removed, weighted and fixed
in 4% formaldehyde, dehydrated, and embedded in paraffin. The left kidney and the heart were weighted and
immediately frozen in liquid nitrogen for proteins extraction.
Urine samples and tissue preparation. All urine samples were collected at the end of the 2-month treat-
ment, leaving mice alone for 1 h in a plastic cage without bedding. Urine was collected immediately after release,
centrifuged for 10 min at 13,000 rpm and the supernatants aliquoted and stored at – 80 °C for subsequent analysis.
Frozen kidney tissue was grossly minced and resuspended in a ratio 1:5 of RIPA buffer (Sigma-Aldrich Milan,
Italy) in presence of protease inhibitor cocktail (Sigma-Aldrich Milan, Italy) and dissociated in a tissue glass
Teflon Dounce homogenizer. The mush was then centrifuged for 1 h at 8500 rpm at 4 °C. The supernatant was
collected and quantified for the proteins content with BCA protein assay kit (Pierce, Thermo Fisher Monza, Italy).
Histology. The right kidney was used for histological analyses. The kidneys embedded in paraffin were sec-
tioned (5 μm) and stained with periodic acid-Schiff (PAS) for overall injury or with trichrome Gomori staining
for fibrosis. The images were captured using a Leica microscope (20 × and 40 × objectives). Images were acquired
with the resident software at 2088 × 1550 pixels with a colour digital camera, using a blind method. For PAS
staining, images were subjected to morphometric analysis (see below) and to the count of hyaline casts within
the tissue. Interstitial fibrosis was quantified in Gomori stained sections. Briefly, 5 random 40 × fields of 5 mice/
group were acquired with the same parameters. For each image, green channel was extracted, and the positive
green pixel were counted with Adobe Photoshop. The values obtained were divided to the total pixel area, scatter
plotted and subjected to statistical analysis.
Scientific Reports | (2021) 11:481 | https://doi.org/10.1038/s41598-020-80048-z 8
Vol:.(1234567890)www.nature.com/scientificreports/
Renal corpuscle morphometric analysis. Kidney PAS staining was used according to Sasaki11 for
measuring the Bowman’s capsule area (BA, area of the inner side of the glomerular parietal epithelial cell lay-
ers) and the glomerular area (GA, area of the outer capillary loops of the tuft) using ImageJ s oftware69 (W. S.
Rasband, NIH, Bethesda, MD [http://rsb.info.nih.gov/ij/]). Using the measured BA and GA, the Bowman cap-
sule volume (BVol) and the glomerular capillary volume (GVol) were calculated according to S asaki11, briefly:
BVol = (BA)3/2 × b/d × (f)−3, GVol = (GA)3/2 × b/d × (f)−3, with the following values: b(dimensionless shape coef-
ficient) = 1.38 for spheres, d (size distribution coefficient for adjusting variations in glomerular size) = 1.01, f
(correction factor for paraffin shrinkage) = 0.8511. Thirty random 40 × fields were acquired for every kidney slice
of each of different groups, further divided from the cortex to the medullary zone in three areas: upper, middle
and lower. For each area, 10 glomeruli images (40 × objective) were acquired and measured.
Western blot. Twenty-five µg of kidney proteins or 10 µl of urine were resuspended in the correct amount
of Laemmli Buffer (65.8 mM Tris–HCl pH 6.8, 26.3% w/v glycerol, 2.1% SDS, 0.01% bromophenol blue and
355 mM 2-mercaptoethanol) and run on a 10% polyacrylamide gel. For urinary albumin analysis, the gel was
silver stained (methods: see below). Otherwise, proteins were blotted on nitrocellulose membrane (Bio-Rad),
blocked for 1 h with 5% milk in PBS Tween 0.05% and incubated overnight with primary antibodies against:
Aquaporin-2 (AQP2, made in mouse, Santa Cruz Biotechnology, DBA Segrate, Italy, 1:1000 in 5% milk in PBS
Tween 0.05%), GAPDH (made in rabbit, Sigma-Aldrich Milan, Italy, 1:1000 in 5% milk in PBS Tween 0.05% ),
or fibronectin (made in mouse, Sigma-Aldrich Milan, Italy, 1:1000 in 5% milk in PBS Tween 0.05%). The follow-
ing day the membrane was washed with PBS Tween 0.05%, incubated for 2 h with the appropriate horseradish
peroxidase (HRP)-conjugated secondary antibody (mouse or rabbit, Sigma, Milan, Italy, 1:1000 in 5% milk in
PBS Tween 0.05%) and revealed through chemiluminescence (Luminata Classico Western HRP Substrate, Mil-
lipore, Sigma-Aldrich Milan, Italy). GAPDH antibody staining was made after membrane stripping. Briefly, after
developing, membrane was washed with PBS, incubated in gentle agitation with roughly 50 °C stripping solution
(0.2 M glycine, 1% SDS, 10% Tween, pH2.2) for 15 min, followed by washing with PBS and PBS Tween 0.05%.
The membrane was then incubated for 1 h with 5% milk in PBS Tween 0.05%, re-probed overnight with GAPDH
antibody and developed as above. The pixel intensities of the visualized bands were determined by using Image
J software. The tissue expression of AQP2 and fibronectin were obtained by normalizing the pixel intensity with
the one of GAPDH, taking into consideration the appropriate controls.
Urinary albumin silver staining. Urine was loaded in SDS-PAGE, the gel was fixed in 40% ethanol, 10%
acetic acid and 50% water overnight, then washed two times for 3 min in water and placed in 0.02% sodium
thiosulfate solution for 30 min. After washing the gel with water three times for 30 s, gel was incubated for mini-
mum 1 h with 0.4% silver nitrate and 0.1% formalin at 4 °C. Following two washes with water, silver staining was
developed with 3% sodium carbonate and 0.05% formalin for a time depending on the desired intensity of the
staining (5–10 min). The gel was then washed in water, blocked with 5% acetic acid for 5 min and stored at 4 °C
in 1% acetic acid, scanned, and quantified with ImageJ software. The intensity of albumin bands was compared
to the one of a fixed quantity of standard albumin loaded in the same gel.
Immunohistochemistry. Serial 5 µm-thick paraffin sections were cut, collected on polylysine-coated
slides and dried overnight at 37 °C, deparaffinized and rehydrated, quenched for 10 min in 0.3% hydrogen
peroxide and blocked with 1% normal bovine serum albumin (BSA) in PBS for 30 min. and the primary Aqua-
porin-2 antibody (1:100 in 1% BSA-PBS) incubated overnight at 4 °C. After PBS wash, sections were incubated
with anti-mouse horseradish peroxidase (HRP)-conjugated secondary antibody (Sigma, Milan, Italy) 1:100, for
1 h at room temperature and visualized with 0.05% 3,3-diaminobenzidine tetrahydrochloride (Sigma-Aldrich,
Milan, Italy) added with 0.015% hydrogen peroxide for 5–10 min. Sections were then dehydrated, coverslipped
with Eukitt (Sigma-Aldrich, Milan, Italy) and observed with a Leica microscope (40 × objective). Images were
acquired as above (see Histology) with the same settings within each experiment.
Immunofluorescence. After re-hydration, sections obtained as above were treated for antigen retrieval
(10 mM citrate buffer, pH 6.0, 95–100 °C for 10 min). After PBS washing, sections were blocked with 1% normal
bovine serum albumin (BSA) in PBS for 30 min. Subsequently, α-Smooth Muscle Actin-Cy3 conjugated anti-
body (αSMA, Sigma-Aldrich, Milan, Italy) diluted 1:150 in 1% BSA-PBS or the primary AQP2 antibody diluted
1:100 in 1% BSA-PBS was applied overnight at 4 °C. The following day, the samples were washed for 5 min in
PBS, and AQP2 slides were incubated for 2 h with Alexa Fluor 594 anti-mouse secondary antibody (Sigma,
Milan, Italy, 1:200 in 1% BSA-PBS). After PBS washes, sections were coverslipped with a solution of Glycerol-
PBS (70% v/v) and observed with a confocal microscope (Nikon A1), maintaining constant laser acquisition
settings. Three-dimensional analysis was carried on with the Nikon A1 NIS Elements Image software (v. 4.13).
For αSMA images, highly stained vessels were not considered.
Statistical analysis. All the values are presented as the mean ± standard error of the mean (SEM). For
normally distributed samples, determined with Shapiro–Wilks test, two-tailed t Student test analysis was run
between two groups, as indicated in figures. For low represented samples, Mann–Whitney non-parametric tests
were performed (Prism 5; Graphpad Software, San Diego, CA). For categorical variables, chi-square test was
used. p values less than 0.05 were considered significant and were expressed as follows: *p < 0.05; **p < 0.01;
***p < 0.001.
Scientific Reports | (2021) 11:481 | https://doi.org/10.1038/s41598-020-80048-z 9
Vol.:(0123456789)www.nature.com/scientificreports/
Received: 30 October 2019; Accepted: 11 December 2020
References
1. Kurihara, K. Umami the fifth basic taste: history of studies on receptor mechanisms and role as a food flavor. Biomed. Res. https
://doi.org/10.1155/2015/189402 (2015).
2. Henry-Unaeze, H. N. Update on food safety of monosodium l-glutamate (MSG). Pathophysiology 24, 243–249. https://doi.
org/10.1016/j.pathophys.2017.08.001 (2017).
3. Bellisle, F. Effects of monosodium glutamate on human food palatability. Ann. N. Y. Acad. Sci. 855, 438–441 (1998).
4. Schiffman, S. S. Intensification of sensory properties of foods for the elderly. J. Nutr. 130, 972S-S930. https://doi.org/10.1093/
jn/130.4.927S (2000).
5. Toyama, K., Tomoe, M., Inoue, Y., Sanbe, A. & Yamamoto, S. A possible application of monosodium glutamate to nutritional care
for elderly people. Biol. Pharm. Bull. 31, 1852–1854 (2008).
6. Best, R. L. & Appleton, K. M. Comparable increases in energy, protein and fat intakes following the addition of seasonings and
sauces to an older person’s meal. Appetite 56, 179–182. https://doi.org/10.1016/j.appet.2010.10.011 (2011).
7. Sasano, T. Important role of umami taste sensitivity in oral and overall health. Curr. Pharm. Des. 20, 2750–2744 (2014).
8. Geha, R. S. et al. Review of alleged reaction to monosodium glutamate and outcome of a multicenter double-blind placebo-
controlled study. J. Nutr. 130, 1058S-1062S. https://doi.org/10.1093/jn/130.4.1058S (2000).
9. Mortensen, A. et al. Re-evaluation of glutamic acid (E 620), sodium glutamate (E 621), potassium glutamate (E 622), calcium
glutamate (E 623), ammonium glutamate (E 624) and magnesium glutamate (E 625) as food additives. EFSA J. 15, 4910. https://
doi.org/10.2903/j.efsa.2017.4910 (2017).
10. Stamler, J. et al. Relation of dietary sodium (salt) to blood pressure and its possible modulation by other dietary factors: the
INTERMAP study. Hypertension 71, 631–637. https://doi.org/10.1161/HYPERTENSIONAHA.117.09928 (2018).
11. Sasaki, T. et al. Bowman capsule volume and related factors in adults with normal renal function. Kidney Int. Rep. 3, 314–320. https
://doi.org/10.1016/j.ekir.2017.10.007 (2018).
12. Wiggins, J. E. Aging in the glomerulus. J. Gerontol. A Biol. Sci. Med. Sci. 67, 1358–1364. https://doi.org/10.1093/gerona/gls157
(2012).
13. Novakovic, S. et al. The interstitial expression of alpha-smooth muscle actin in glomerulonephritis is associated with renal func-
tion. Med. Sci. Monit. 18, CR235–CR240 (2012).
14. LeBleu, V. S. et al. Origin and function of myofibroblasts in kidney fibrosis. Nat. Med. 19, 1047–1053. https://doi.org/10.1038/
nm.3218 (2013).
15. Eddy, A. A. Overview of the cellular and molecular basis of kidney fibrosis. Kidney Int. Suppl. 4, 2–8 (2014).
16. Liu, X.-Y. et al. Fibronectin expression is critical for liver fibrogenesis in vivo and in vitro. Mol. Med. Rep. 14, 3669–3675 (2016).
17. Kwon, T. H., Frøkiær, J. & Nielsen, S. Regulation of aquaporin-2 in the kidney: a molecular mechanism of body-water homeostasis.
Kidney Res. Clin. Pract. 32, 96–102. https://doi.org/10.1016/j.krcp.2013.07.005 (2013).
18. Ikeda, M. & Matsuzaki, T. Regulation of aquaporins by vasopressin in the kidney. Vitam. Horm. 98, 307–337. https://doi.
org/10.1016/bs.vh.2014.12.008 (2015).
19. Graffe, C. C., Bech, J. N. & Pedersen, E. B. Effect of high and low sodium intake on urinary aquaporin-2 excretion in healthy
humans. Am. J. Physiol. Renal Physiol. 302, F264-275. https://doi.org/10.1152/ajprenal.00442.2010 (2012).
20. Sands, J. M. Urine concentrating and diluting ability during aging. J. Gerontol. A Biol. Sci. Med. Sci. 67, 1352–1357. https://doi.
org/10.1093/gerona/gls128 (2012).
21. Tamma, G., Goswami, N., Reichmuth, J., De Santo, N. G. & Valenti, G. Aquaporins, vasopressin, and aging: current perspectives.
Endocrinology 156, 777–788. https://doi.org/10.1210/en.2014-1812 (2015).
22. Jung, H. J. & Kwon, T. H. Molecular mechanisms regulating aquaporin-2 in kidney collecting duct. Am. J. Physiol. Renal Physiol.
311, 1318–1328. https://doi.org/10.1152/ajprenal.00485.2016 (2016).
23. Tapiero, H., Mathé, G., Couvreur, P. & Tew, K. D. Glutamine and glutamate. Biomed. Pharmacother. 56, 446–457 (2002).
24. Gansevoort, R. T. et al. Chronic kidney disease and cardiovascular risk: epidemiology, mechanisms, and prevention. Lancet 382,
339–352. https://doi.org/10.1016/S0140-6736(13)60595-4 (2013).
25. Liu, M. et al. Cardiovascular disease and its relationship with chronic kidney disease. Eur. Rev. Med. Pharmacol. Sci. 18, 2918–2926
(2014).
26. Gill, S. S., Mueller, R. W., McGuire, P. F. & Pulido, O. M. Potential target sites in peripheral tissues for excitatory neurotransmission
and excitotoxicity. Toxicol. Pathol. 28, 277–284 (2000).
27. Kakoki, M. et al. Amino acids as modulators of endothelium-derived nitric oxide. Am. J. Physiol. Renal Physiol. 291, F297-304
(2006).
28. Houghton, B. L. & Johns, E. J. The pressor and renal sympathetic nerve responses to vascular and spinal V1 receptor activation
after manipulation of dietary sodium intake. J. Hypertens. 29, 915–921. https://doi.org/10.1097/HJH.0b013e328344b86b (2011).
29. Dixit, S. G. et al. To study the effect of monosodium glutamate on histomorphometry of cortex of kidney in adult albino rats. Ren.
Fail. 36, 266–720. https://doi.org/10.3109/0886022X.2013.846865 (2014).
30. Ortiz, G. G. et al. Monosodium glutamate-induced damage in liver and kidney: a morphological and biochemical approach.
Biomed. Pharmacother. 60, 86–91 (2006).
31. Paul, M. V., Abhilash, M., Varghese, M. V., Alex, M. & Nair, R. H. Protective effects of α-tocopherol against oxidative stress related
to nephrotoxicity by monosodium glutamate in rats. Toxicol. Mech. Methods. 22, 625–630 (2012).
32. López-Miranda, V. et al. Effects of chronic dietary exposure to monosodium glutamate on feeding behavior, adiposity, gastroin-
testinal motility, and cardiovascular function in healthy adult rats. Neurogastroenterol. Motil. 27, 1559–1570 (2015).
33. Sharma, A. et al. Monosodium glutamate (MSG) consumption is associated with urolithiasis and urinary tract obstruction in rats.
PLoS ONE 8(e75546), 2013. https://doi.org/10.1371/journal.pone.0075546.eCollection (2013).
34. Sharma, A. et al. Proteomic analysis of kidney in rats chronically exposed to monosodium glutamate. PLoS ONE 9(e116233), 2014.
https://doi.org/10.1371/journal.pone.0116233.eCollection (2014).
35. Mahieu, S. et al. Monosodium glutamate intake affect the function of the kidney through NMDA receptor. Life Sci. 149, 114–119.
https://doi.org/10.1016/j.lfs.2016.02.023 (2016).
36. Contini, M. D. C., Fabro, A., Millen, N., Benmelej, A. & Mahieu, S. Adverse effects in kidney function, antioxidant systems
and histopathology inrats receiving monosodium glutamate diet. Exp. Toxicol. Pathol. 69, 547–556. https://doi.org/10.1016/j.
etp.2017.03.003 (2017).
37. Nakagawa, T., Ukai, K., Ohyama, T., Gomita, Y. & Okamura, H. Effect of chronic administration of sibutramine on body weight,
food intake and motor activity in neonatally monosodium glutamate-treated obese female rats: relationships of antiobesity effect
with monoamines. Exp. Anim. 49, 239–249 (2000).
Scientific Reports | (2021) 11:481 | https://doi.org/10.1038/s41598-020-80048-z 10
Vol:.(1234567890)www.nature.com/scientificreports/
38. He, K. et al. Association of monosodium glutamate intake with overweight in Chinese adults: the INTERMAP Study. Obesity 16,
1875–1880. https://doi.org/10.1038/oby.2008.274 (2008).
39. Saikrishna, K. et al. Combined administration of monosodium glutamate and high sucrose diet accelerates the induction of
type 2 diabetes, vascular dysfunction, and memory impairment in rats. J. Environ. Pathol. Toxicol. Oncol. 37, 63–80. https://doi.
org/10.1615/JEnvironPatholToxicolOncol.2018017186 (2018).
40. Bahadoran, Z., Mirmiran, P. & Ghasemi, A. Monosodium glutamate (MSG)-induced animal model of type 2 diabetes. Methods
Mol. Biol. 1916, 49–65. https://doi.org/10.1007/978-1-4939-8994-2_3 (2019).
41. Seeger, D. R. & Murphy, E. J. Mouse strain impacts fatty acid uptake and trafficking in liver, heart, and brain: a comparison of
C57BL/6 and Swiss webster mice. Lipids 51, 549–560. https://doi.org/10.1007/s11745-015-4117-6 (2016).
42. Joffre, C. et al. Modulation of brain PUFA content in different experimental models of mice. Prostaglandins Leukot. Essent. Fatty
Acids. 114, 1–10. https://doi.org/10.1016/j.plefa.2016.09.003 (2016).
43. Yilmaz, R. et al. Dietary salt intake is related to inflammation and albuminuria in primary hypertensive patients. Eur. J. Clin. Nutr.
66, 1214–1218. https://doi.org/10.1038/ejcn.2012.110 (2012).
44. Kuusniemi, A. M. et al. Kidneys with heavy proteinuria show fibrosis, inflammation, and oxidative stress, but no tubular phenotypic
change. Kidney Int. 68, 121–132 (2005).
45. Berger, R. C. et al. Renal effects and underlying molecular mechanisms of long-term salt content diets in spontaneously hypertensive
rats. PLoS ONE 10(10), e0141288 (2015).
46. Kitada, K. et al. High salt intake reprioritizes osmolyte and energy metabolism for body fluid conservation. J. Clin. Invest. 127,
1944–1959 (2017).
47. Wei, S. Y. et al. Multiple mechanisms are involved in salt-sensitive hypertension-induced renal injury and interstitial fibrosis. Sci.
Rep. 7, 45952 (2017).
48. López-Miranda, V. et al. Effects of chronic dietary exposure to monosodium glutamate on feeding behavior, adiposity, gastrointes-
tinal motility, and cardiovascular function in healthy adult rats. Neurogastroenterol. Motil. 27, 1559–1570. https://doi.org/10.1111/
nmo.12653(2015).
49. Kobayashi, A. et al. Change in glomerular volume and its clinicopathological impact after kidney transplantation. Nephrology
(Carlton). 20(Suppl 2), 31–35. https://doi.org/10.1111/nep.12463 (2015).
50. Boero, R., Pignataro, A. & Quarello, F. Salt intake and kidney disease. J. Nephrol. 15, 225–229 (2002).
51. Nabokov, A., Waldherr, R. & Ritz, E. Demonstration of the proliferation marker Ki-67 in renal biopsies: correlation to clinical
findings. Am. J. Kidney Dis. 30, 87–97 (1997).
52. Sugimoto, H., Grahovac, G., Zeisberg, M. & Kalluri, R. Renal fibrosis and glomerulosclerosis in a new mouse model of diabetic
nephropathy and its regression by bone morphogenic protein-7 and advanced glycation end product inhibitors. Diabetes 56,
1825–1833 (2007).
53. Combet, S. et al. Aquaporin-2 downregulation in kidney medulla of aging rats is posttranscriptional and is abolished by water
deprivation. Am. J. Physiol. Renal Physiol. 294, F1408-1414. https://doi.org/10.1152/ajprenal.00437.2007 (2008).
54. Hew-Butler, T., Smith-Hale, V., Pollard-McGrandy, A. & VanSumeren, M. Of mice and men-the physiology, psychology, and
pathology of overhydration. Nutrients. https://doi.org/10.3390/nu11071539 (2019).
55. Kim, J. M., Kim, T. H. & Wang, T. Effect of diet and water intake on aquaporin 2 function. Child Kidney Dis. 20, 11–17 (2016).
56. Lauridsen, T. G., Vase, H., Starklint, J., Bech, J. N. & Pedersen, E. B. Protein-enriched diet increases water absorption via the aqua-
porin-2 water channels in healthy humans. Nephrol. Dial. Transplant. 25, 2502–2510. https://doi.org/10.1093/ndt/gfq111 (2010).
57. Elliot, S., Goldsmith, P., Knepper, M., Haughey, M. & Olson, B. Urinary excretion of aquaporin-2 in humans: a potential marker
of collecting duct responsiveness to vasopressin. J. Am. Soc. Nephrol. 7, 403–409 (1996).
58. McCallum, L., Lip, S. & Padmanabhan, S. The hidden hand of chloride in hypertension. Pflugers Arch. 467, 595–603. https://doi.
org/10.1007/s00424-015-1690-8 (2015).
59. Rodan, A. R. Intracellular chloride: a regulator of transepithelial transport in the distal nephron. Curr. Opin. Nephrol. Hypertens.
28, 360–367. https://doi.org/10.1097/MNH.0000000000000502 (2019).
60. Brown, K. L., Hudson, B. G. & Voziyan, P. A. Halogens are key cofactors in building of collagen IV scaffolds outside the cell. Curr.
Opin. Nephrol. Hypertens. 27, 171–175. https://doi.org/10.1097/MNH.0000000000000401 (2018).
61. Du, Y. H. & Guan, Y. Y. Chloride channels—new targets for the prevention of stroke. Curr. Vasc. Pharmacol. 13, 441–448 (2015).
62. Matchkov, V. V., Boedtkjer, D. M. & Aalkjaer, C. The role of Ca(2+) activated Cl(-) channels in blood pressure control. Curr. Opin.
Pharmacol. 21, 127–137 (2015).
63. Ji, Q. et al. Recent advances in TMEM16A: structure, function, and disease. J. Cell Physiol. 234, 7856–7873. https: //doi.org/10.1002/
jcp.27865(2019).
64. Orlov, S. N., Koltsova, S. V., Kapilevich, L. V., Gusakova, S. V. & Dulin, N. O. NKCC1 and NKCC2: the pa thogenetic role of cation-
chloride cotransporters in hypertension. Genes Dis. 2, 186–196 (2015).
65. Delpire, E. & Gagnon, K. B. N a+–K+–2Cl− Cotransporter (NKCC) Physiological function in nonpolarized cells and transporting
epithelia. Compr. Physiol. 8, 871–901. https://doi.org/10.1002/cphy.c170018 (2018).
66. Hou, J. Paracellular transport in the collecting duct. Curr. Opin. Nephrol. Hypertens. 25, 424–428. https://doi.org/10.1097/
MNH.0000000000000253 (2016).
67. Bellisle, F. et al. Monosodium glutamate as a palatability enhancer in the European diet. Physiol. Behav. 49, 869–873 (1991).
68. Bachmanov, A. A., Tordoff, M. G. & Beauchamp, G. K. Intake of umami—tasting solutions by mice: a genetic analysis. J. Nutrition
130, 935S-941S (2000).
69. Rueden, C. T. et al. Image J2: ImageJ for the next generation of scientific image data. BMC Bioinform. 18, 529. https://doi.
org/10.1186/s12859-017-1934-z (2017).
Acknowledgements
This work was supported by Ajinomoto Innovation Alliance Program (AIAP), duration of the fund: March
2016-July 2018. The funders had no influence in the experimental design, selection of methods, performing
experiments, analysis of data and writing of the text.
Author contributions
M.C. performed ex-vivo experiments; V.B. performed in-vivo experiments; P.B., I.C., C.M.C. participated in
data collection and analysis; M.C. and C.M.C. drafted the manuscript, all authors reviewed and approved it.
Competing interests
The authors declare no competing interests.
Additional information
Supplementary Information The online version contains supplementary material available at https://doi.
Scientific Reports | (2021) 11:481 | https://doi.org/10.1038/s41598-020-80048-z 11
Vol.:(0123456789)www.nature.com/scientificreports/
org/10.1038/s41598-020-80048-z.
Correspondence and requests for materials should be addressed to C.M.-C.
Reprints and permissions information is available at www.nature.com/reprints.
Publisher’s note Springer Nature remains neutral with regard to jurisdictional claims in published maps and
institutional affiliations.
Open Access This article is licensed under a Creative Commons Attribution 4.0 International
License, which permits use, sharing, adaptation, distribution and reproduction in any medium or
format, as long as you give appropriate credit to the original author(s) and the source, provide a link to the
Creative Commons licence, and indicate if changes were made. The images or other third party material in this
article are included in the article’s Creative Commons licence, unless indicated otherwise in a credit line to the
material. If material is not included in the article’s Creative Commons licence and your intended use is not
permitted by statutory regulation or exceeds the permitted use, you will need to obtain permission directly from
the copyright holder. To view a copy of this licence, visit http://creativecommons.org/licenses/by/4.0/.
© The Author(s) 2021
Scientific Reports | (2021) 11:481 | https://doi.org/10.1038/s41598-020-80048-z 12
Vol:.(1234567890)You can also read