Structural and contextual priors affect visual search in children with and without autism
←
→
Page content transcription
If your browser does not render page correctly, please read the page content below
Received: 27 October 2020     Accepted: 22 March 2021

DOI: 10.1002/aur.2511

RESEARCH ARTICLE

Structural and contextual priors affect visual search in children with
and without autism

Sander Van de Cruys1,2                     | Lisa Lemmens1,2 | Laurie-Anne Sapey-Triomphe1,2                                            |
Andrey Chetverikov3 |                    Ilse Noens4,2 | Johan Wagemans1,2

1
 Laboratory of Experimental Psychology, KU       Abstract
Leuven, Leuven, Belgium
2
                                                 Bayesian predictive coding theories of autism spectrum disorder propose that
 Leuven Autism Research (LAuRes), KU
Leuven, Leuven, Belgium
                                                 impaired acquisition or a broader shape of prior probability distributions lies at
3
 Visual Computation Lab, Centre for Cognitive
                                                 the core of the condition. However, we still know very little about how probability
Neuroimaging, Donders Institute for Brain,       distributions are learned and encoded by children, let alone children with autism.
Cognition and Behavior, Nijmegen, The            Here, we take advantage of a recently developed distribution learning paradigm
Netherlands
4
                                                 to characterize how children with and without autism acquire information about
 Parenting and Special Education Research
Unit, Faculty of Psychology and Educational
                                                 probability distributions. Twenty-four autistic and 25-matched neurotypical chil-
Sciences, KU Leuven, Leuven, Belgium             dren searched for an odd-one-out target among a set of distractor lines with orien-
                                                 tations sampled from a Gaussian distribution repeated across multiple trials to
Correspondence                                   allow for learning of the parameters (mean and variance) of the distribution. We
Sander Van de Cruys, Brain & Cognition,
Laboratory of Experimental Psychology, KU
                                                 could measure the width (variance) of the participant’s encoded distribution by
Leuven, 3000 Leuven, Belgium.                    introducing a target-distractor role-reversal while varying the similarity between
Email: sander.vandecruys@kuleuven.be             target and previous distractor mean. Both groups performed similarly on the
                                                 visual search task and learned the distractor distribution to a similar extent. How-
Funding information                              ever, the variance learned was much broader than the one presented, consistent
Fonds Wetenschappelijk Onderzoek, Grant/
Award Numbers: 1171717N, METH/14/02              with less informative priors in children irrespective of autism diagnosis. These
                                                 findings have important implications for Bayesian accounts of perception
                                                 throughout development, and Bayesian accounts of autism specifically.
                                                 Lay summary: Recent theories about the underlying cognitive mechanisms of
                                                 autism propose that the way autistic individuals estimate variability or uncer-
                                                 tainty in their perceptual environment may differ from how typical individuals do
                                                 so. Children had to search an oddly tilted line in a set of lines pointing in different
                                                 directions, and based on their response times we examined how they learned
                                                 about the variability in a set of objects. We found that autistic children learn vari-
                                                 ability as well as typical children, but both groups learn with less precision than
                                                 typical adults do on the same task.

                                                 KEYWORDS
                                                 autism spectrum disorder, Bayesian brain, ensemble perception, perceptual learning, predictive coding,
                                                 summary statistics, visual search

INTRODUCTION                                                                   these theories, perception and learning are cast as proba-
                                                                               bilistic inferences combining prior knowledge with per-
Bayesian predictive coding theories have recently gained                       ceptual inputs (likelihood). More specifically, predictive
traction as an explanation for autistic behavior, both in                      coding assumes that priors and likelihoods are represen-
controlled lab settings (e.g., Karvelis et al., 2017; Lawson                   ted as Gaussian probability distributions (Friston &
et al., 2017; Lieder et al., 2019) and as symptom clusters                     Kiebel, 2009), characterized by a mean (the expectation)
in daily life (e.g., Lawson et al., 2014; Palmer et al., 2017;                 and a precision (inverse variance; the width of the bell-
Pellicano & Burr, 2012; Van de Cruys et al., 2014). In                         shape). The extent to which perceptual estimates

© 2021 International Society for Autism Research and Wiley Periodicals LLC.

Autism Research. 2021;1–12.                                                                                     wileyonlinelibrary.com/journal/aur    1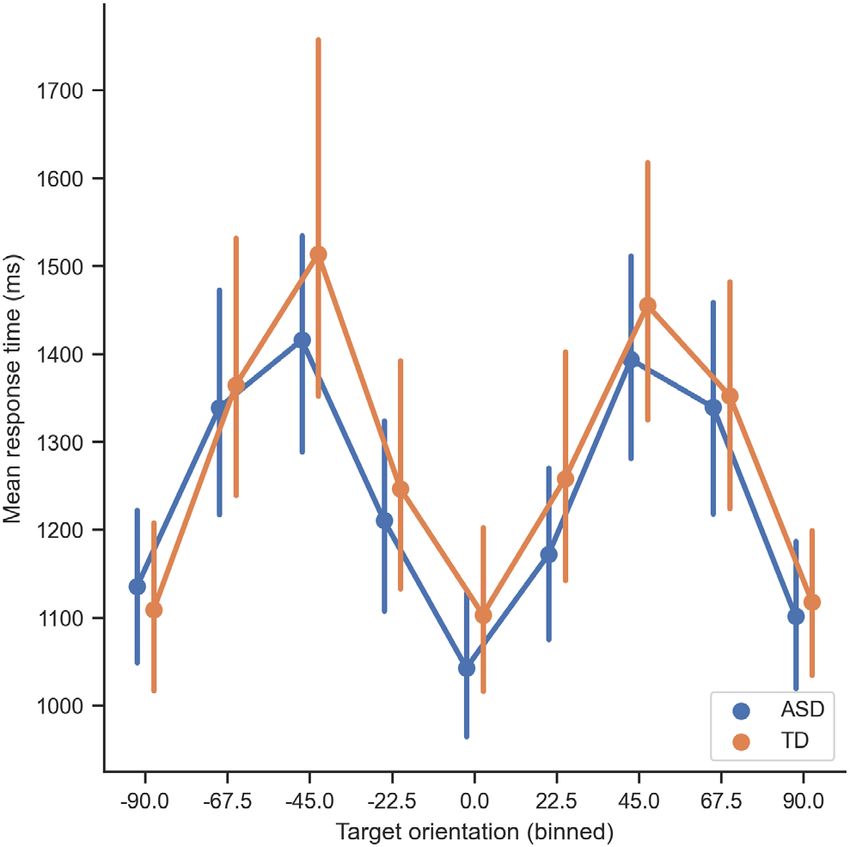
2                                                                                                           VAN DE CRUYS ET AL.

(decisions) are biased toward the actual evidence versus         outlier), it is crucial to know the diversity or variability of
the prior is determined by the relative precision of the         the items that do belong to the group (Haberman &
respective distributions. Importantly, both the means and        Whitney, 2012; Rosenholtz, 2001). Moreover, an estimate
the precisions of the prior distributions need to be esti-       of the variance of groups of stimuli provides the observer
mated or learned through experience (Hohwy, 2013).               information on the reliability or precision of the average of
Indeed, the many proposals on what inferential processes         the set. To the best of our knowledge, no studies have veri-
go awry in autism converge on how precisions are esti-           fied whether variance extraction is already present in chil-
mated and shaped by experience. For example, keeping             dren (with or without ASD).
the sensory precision constant, a prior with lower esti-             In the current study, we use odd-one-out visual search
mated precision is broader and has a weaker effect on            as an implicit measure of whether children extract vari-
perception. Usually, however, informative priors provide         ances. Rather than explicitly asking participants for esti-
the necessary robustness to perception, allowing us to           mates of summary statistics as in most studies on the
exploit known regularities and discard the noise, in order       topic, Chetverikov et al. (2016, 2017a, 2017b, 2017d,
to zoom in on behaviorally relevant changes (prediction          2020) developed a method to infer the representation of
errors) in the input (Van de Cruys et al., 2017). Hence, a       those statistics from visual search performance, arguably
failure to learn and apply informative priors may lead to        a more ecologically valid way to probe this. They based
unstable, more variable percepts (cf. hypersensitivity) and      their paradigm on findings of priming of pop-out, a phe-
problems selecting relevant input dimensions in the face         nomenon that occurs when an odd-one-out target has the
of (noise) variability in other dimensions (crucial in social    same features over different visual search trials, leading
settings). In the longer term, this inability to “regularize”    to decreased response times. Priming of pop-out has also
perception may elicit compensatory behavioral strategies         been found when distractors have the same features over
in terms of repetitive movements and other ways to               different trials. Chetverikov et al. used such priming, in
recover a modicum of predictability in perceptual inputs         addition to role reversal—when a target falls within the
(cf. insistence on sameness). In short, there is a plausible     feature distribution of distractors in previous trials—to
etiological chain from problems in estimating precision          infer to what extent the distributions of the distractor set
to the key symptom clusters in autism spectrum disorder          (their mean, variance, and shape more broadly) are
(ASD), described as impairments in social interaction            encoded implicitly. Using this method, Chetverikov
and communication on the one hand, and repetitive and            et al. (2016, 2017b, 2020) reported that our visual brain
restrictive behaviors and interests, including alterations       not only extracts and represents the first-order statistics
in sensory sensitivity, on the other hand (American Psy-         such as the average but also various other properties of
chiatric Association, 2013).                                     the distributions, such as variance, type (e.g., normal
    Research on summary statistics, also known as ensem-         vs. uniform) and skewness.
ble perception, has shown that people have no problems               The visual search paradigm by Chetverikov and col-
extracting the means of sets of stimuli, be it based on low-     leagues is extremely suited here for several reasons. First,
level features such as orientation or size, or higher-level      while concepts such as mean and variance may be diffi-
features such as face identity and emotional facial expres-      cult to grasp for children, a visual search task is very intu-
sions (Whitney et al., 2014; Whitney & Yamanashi                 itive. Second, visual search is known to be intact or even
Leib, 2018). Representing a set of stimuli by its average        improved in ASD from very early on in development
often happens without being able to recognize each indi-         (Kaldy et al., 2011; Van der Hallen et al., 2015). Any
vidual item of the set and is even present under conditions      impairments or alterations in performance are unlikely to
of reduced attention. Previous research on ensemble per-         be explained by the basic nature of the task.
ception in ASD yielded mixed results. Children (Van der              Third, the paradigm allows us to look at the role-
Hallen et al., 2017) and adults (Corbett et al., 2016) seem      reversal effect in which the target suddenly falls within
to be able to represent sets of dots by their mean size. Chil-   the previously learned distractor distribution range. Plot-
dren with ASD may even tolerate more variability when            ting the participants’ response times as a function of the
estimating averages (Manning et al., 2015; Van der Hallen        difference between the current target orientation and the
et al., 2017). Yet another study found no difference in the      previous distractor distribution mean will show the shape
ability to represent the average emotion of faces between        of the represented prior distribution (its variance or
children with and without ASD (Karaminis et al., 2017;           inverse precision), as learned across repetitions of the
but see Rhodes et al., 2015).                                    same (distractor) distribution. Here, we can address ques-
    In addition to ensemble means, ensemble variance has         tions concerning the aberrant estimation of precision, as
been found to be extracted for size and orientation in neu-      proposed by predictive coding accounts of ASD (Lawson
rotypical adults (Norman et al., 2015; Solomon, 2010), but       et al., 2014; Pellicano & Burr, 2012; Van de Cruys
has been studied less compared to the average of sets of         et al., 2014). Specifically, we will be able to examine
stimuli. Even so, we know that extracting variance is a pre-     whether the learned distractor distribution is broader or
requisite for many odd-one-out visual search tasks. Indeed,      narrower than the actually presented Gaussian distractor
to find an item that does not belong to a set (detect an         distribution. Note that there is some vagueness in the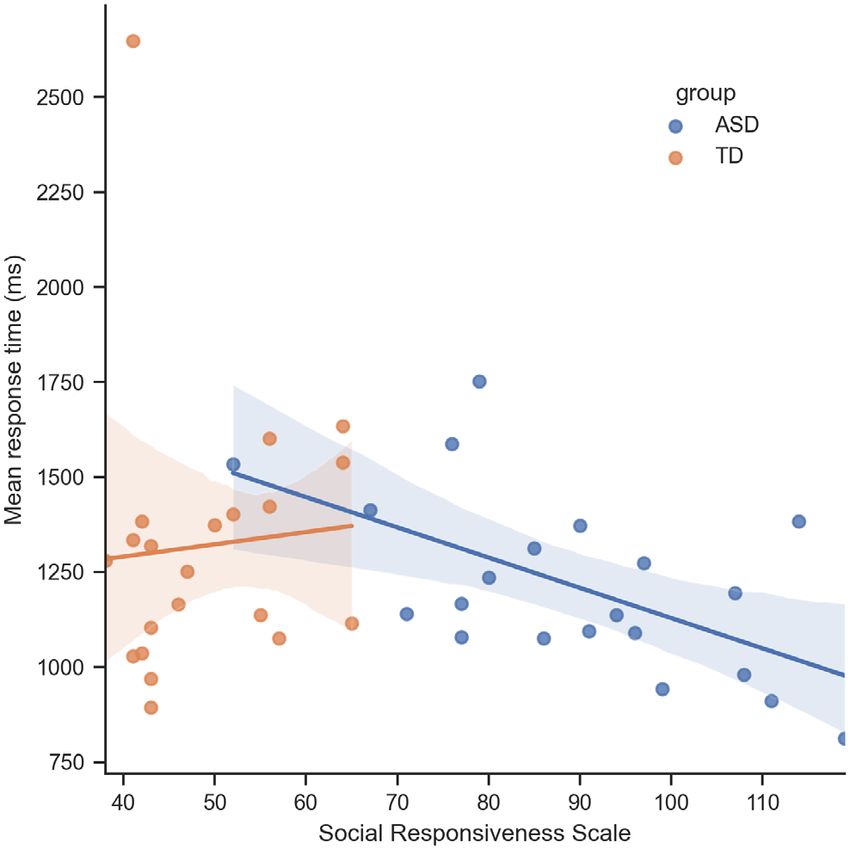
VAN DE CRUYS ET AL.                                                                                                        3

existing theoretical proposals as to what to expect: Some       SD = 1.39; range: 10–14 years). Intelligence of the partic-
merely state that the estimated precision is “aberrant” in      ipants was estimated with an abbreviated version
autism (Lawson et al., 2014), others suggest that the pre-      (Sattler, 2001) of the Wechsler Intelligence Scale, Third
cision of prediction errors is higher (Brock, 2012; Con-        edition (WISC-III-NL; Wechsler, 1992). From this
stant et al., 2018; Van de Cruys et al., 2014), which           abbreviated version, a performance intelligence quotient
should lead to more precise posteriors and, subsequently,       (PIQ), a verbal intelligence quotient (VIQ), and a full-
priors (because today’s posterior is tomorrow’s prior).         scale IQ (FIQ) are derived. Based on these results, none
Yet others made a clear claim that priors in autism are         of the participants had an intellectual disability (FIQ
less precise (Pellicano & Burr, 2012).                          ≤70). All participants had normal or corrected-to-normal
    Fourth and finally, in the literature on Bayesian pre-      vision and none reported taking any neuroleptics.
dictive coding, a distinction is made between structural            The ASD group consisted of 24 children diagnosed
and contextual priors (Seriès & Seitz, 2013; Teufel &           with ASD by a child psychiatrist or a multidisciplinary
Fletcher, 2020). Contextual priors are based on regulari-       team, based on the DSM-IV-TR criteria (American Psy-
ties specific to a particular context, for example,             chiatric Association, 2000). Participants were recruited
predicting the next word in a sentence based on the             via the Autism Expertise Centre of our university hospi-
semantic and syntactic structure. These priors are              tal. In proportion to the gender ratio described in the lit-
assumed to be learned and deployed in a hierarchical            erature (Lai et al., 2015), the ASD group comprised
way with predictions from one level predicting input            8 girls and 16 boys. The ASD diagnosis was re-evaluated
activity in the level below. Such predictions usually have      using the Autism Diagnostic Observation Schedule
a more limited applicability, but can be quickly and flexi-     2, Module 3 (ADOS-2; Gotham et al., 2007), conducted
bly learned through experience (Van de Cruys,                   by a trained psychologist. Eighteen participants scored
Vanmarcke, Van de Put, & Wagemans, 2018). This is the           above the ASD cut-off and six participants below the
type of prior we induce in our visual search paradigm, by       ASD cut-off on the ADOS-2 (Mean = 8.76, SD = 4.17).
repeating trials with the same distractor probability           Moreover, ASD traits were measured with the Dutch ver-
distribution.                                                   sion of the social responsiveness scale (SRS-2; Roeyers
    Contrary to contextual priors that are learned in a         et al., 2011). In addition, the Dutch version of the sensory
short time span (in just a few trials), structural priors       profile questionnaire (SP-NL; Dunn & Rietman, 2006)
reflect innate or overlearned statistical regularities in the   was administered to measure how the children process
visual input. These priors are applicable across all visual     sensory information in everyday situations. We assessed
inputs irrespective of context because they concern             the level of attention problems (and emotional or behav-
(quasi-)universal scene statistics. Instead of relying on the   ioral problems) by administering the child behavior
top-down connections between levels, they are thought to        checklist (Achenbach & Ruffle, 2000) parent report to
be encoded as embedded constraints in bottom-up infor-          control for the influence of attention problems on-task
mation processing (Teufel & Fletcher, 2020). A common           behavior. The typically developing (TD) group consisted
example is the light-from-above prior, which causes us to       of 25 children recruited through mainstream schools. The
perceive ambiguous shading stimuli as lighted from              TD participants did not have a known diagnosis of a
above, as is usually correct for natural images. For orien-     child psychiatric disorder nor they did have a first-degree
tation perception, it is well-known that people are much        family member diagnosed with ASD. Demographic
better at discriminating cardinal orientations (horizontal      details and p-values of a two-sided t-test for the compari-
and vertical) compared to oblique orientations because          son of the ASD group and the matched TD group are
the former are much more prevalent in our natural visual        shown in Table 1.
environment (Girshick et al., 2011). Given that we use
sets of oriented lines as visual search displays, we will be
able to verify in our study whether outliers (targets) are      Procedure
easier to spot when the distractor distribution mean is
cardinal versus oblique, and whether this effect of the         This study was approved by the ethical committee of the
structural prior is reduced in ASD (if priors are broader),     university hospital and incorporated within a larger series
as one study already found (Dickinson et al., 2016; but         of studies on visual perception in children with ASD. Par-
see Shafai et al., 2015).                                       ent consent and child assent were given before the start of
                                                                the test session. The tests took place in a quiet and dark-
                                                                ened room and the viewing distance was 57 cm.
METHODS                                                             The odd-one-out visual search task was presented to
                                                                the children as a space game in which they could discover
Participants                                                    a new planet by following the stars falling in the oddest
                                                                direction. The participants had to search for the odd-one-
Two groups of children between 10 and 14 years old par-         out in a 6 × 6 grid of 36 lines subtending 16 × 16 at the
ticipated in this study (N = 49; M age = 11.94 years;           center of a display (see Figure 1). Each line represented a
4 VAN DE CRUYS ET AL.
TABLE 1 Participant characteristics
ASD (16 male: 8 female) TD (13 male: 12 female) Two-sided t test
M SD (range) M SD (range) p-value (BF10)
Age 12 1.30 (10–15) 11.85 1.50 (10–15) 0.62 (0.32)
Verbal IQ 105 17.67 (57–130) 105 10.86 (68–122) 0.92 (0.29)
Performance IQ 106 17.23 (74–132) 107 14.09 (66–143) 0.76 (0.30)
CBCL attention 58.20 7.92 (50–77) 54.67 5.88 (50–66) 0.12 (0.85)
SRS-2 89.33 16.99 (52–119) 49 8.61 (38–65) 100)
ADOS 8.62 4.06 (1–19)
Note: SRS data of three participants with ASD and of four TD participants is missing.
Abbreviations: ADOS, autism diagnostic observation schedule; BF10, bayes factor; CBCL, child behavior checklist; SRS-2, social responsiveness scale.
F I G U R E 1 Example search array for
a prime trial and example search array for
a test trial. In the prime trial (left side), the
distractors are sampled from a Gaussian
distribution with a distractor distribution
standard deviation (DSD) of 10 (dark
red). In this example, the mean orientation
(vertical line in the bell-shape) of the
distribution is 109 and the target
orientation (blue arrow) differs 85 from
the distractor distribution mean. In the test
trial (right side), the distractors are
sampled from a Gaussian distribution with
a DSD of 5 . The previous distractor
distribution is represented in dashed lines.
In this example, the difference between the
current target orientation (blue arrow) and
the previous distractor distribution mean
(CT-PD) is 13 (red double arrow). The
target differs 61 from the current
distractor distribution mean (M = 157 ; in
dark red)
falling star and the length of each line was 1.41 . All line During the actual experiment, feedback was only pro-
positions were jittered by randomly adding a value of vided for incorrect trials.
±0.5 to vertical and horizontal coordinates. The partici-
pants used the arrow keys to indicate whether the target
was in the upper or lower half of the display (little dots Apparatus and stimuli
on the side of the search array indicated the division).
The children were encouraged to respond as fast and Trials were organized in blocks consisting of a prime
accurately as possible and received a score after each streak and a test streak. A prime streak consisted of five
response, indicating how close they got to the undi- or six trials with distractor orientations sampled from the
scovered planet. The children were told that there was same distractor distribution with a constant mean and
another competing team of astronauts with the same mis- SD. The trial number was varied to prevent participants
sion. Every 10 blocks (±70 trials), a screen was presented from learning the regularities in changes from prime
with their own score as well as the score of the competing streaks to test streaks throughout the experiment. The
team of astronauts (a random number of points below distractor distribution in trials in prime streaks was
the participant’s score). The children could take a self- always a Gaussian distribution, with a distractor stan-
paced break here. dard deviation (DSD) of 10 . The mean of the distractor
Before starting with the actual test trials, the partici- distribution was set randomly for each prime streak. The
pants completed an extensive step-by-step practice proto- target orientation was set randomly for each trial within
col with 10 practice trials, with feedback on all trials. the prime streaks, with the constraint that the differenceVAN DE CRUYS ET AL. 5
between the target orientation and the mean of the dis- predictors, revealed a significant effect of DSD on search
tractor distribution could range from 60 to 120 . During times (B = 0.08, t = 5.01, p < 0.0001), with shorter search
the prime streaks, the mean of the distractor distribution times in the test streaks with a DSD of 5 (M = 1138 ms,
and the DSD (always 10 ) remained constant, whereas SD = 686) compared to search times in the prime streaks
the target orientation and location differed on every trial. with a DSD of 10 (M = 1290 ms, SD = 1058). Neither
Each prime streak was followed by a test streak con- the effect of Group (B = 0.03, t = 0.6, p = 0.55) nor the
sisting of one to two trials with the distractor orientations interaction effect between Group and DSD (B = −0.008,
sampled from the same distractor distribution. The test t = −0.40, p = 0.69) on search times was significant (see
streak distractor distribution was a Gaussian distribution Figure 2). A generalized mixed model on the accuracies
with a DSD of 5 . The target orientation in the test trials shows the same results qualitatively: only a main effect of
differed −90 to 90 from the distractor distribution mean DSD (more accurate for low DSD), not of Group. Fur-
of the previous prime streak. The difference between the thermore, a Bayesian analysis on reaction times shows
current target orientation in the test trials and the previ- moderate evidence against including a main effect of
ous distractor distribution mean (CT-PD) was randomly Group and/or an interaction effect of Group x DSD (see
chosen out of the 13 bins with different bin sizes Supplementary Materials for full results).
(i.e., smaller bin sizes closer to zero). The different CT- These results imply typical visual search performance
PD bins were (−90 to −70 ), (−70 to −50 ), (−50 to in children with ASD, irrespective of the amount of vari-
−35 ), (−35 to −25 ), (−25 to −15 ), (−15 to −5 ), ability in the display. However, a post hoc analysis
(−5 to +5 ), (+5 to +15 ), (15 to 25 ), (25 to 35 ), showed a significant negative correlation of autism traits,
(35 to 50 ), (50 to 70 ), and (70 to 90 ). Bin sizes were as measured by the SRS-2, and mean response time in
smaller where the target orientation was closer to the pre- the visual search task (Pearson r = −0.64, p = 0.001, see
vious distribution mean (i.e., small CT-PDs), to have a Figure 3). To look at this in more detail, we plotted con-
higher precision for our response times plotted as a func- ditional accuracy functions (Figure 4) on quantile split
tion of CT-PD in the area around the previous data. They indicate that particularly in the lowest
distribution mean. response time bins, people with high SRS-2 (but not with
Each prime streak length (five or six trials) was mid SRS-2) are faster in searching the displays, without
followed by a test streak with a target orientation chosen paying in terms of accuracy. This suggests that the
based on a CT-PD sampled from each CT-PD bin, so improved visual search performance sometimes found in
together prime and tests streaks formed blocks of six to other studies (see Discussion) may be limited to individ-
eight trials. These combinations were repeated five times uals with high autism traits and displays where serial sea-
per participant, resulting in 130 blocks (13 orientations rch is not required.
× 2 streak lengths × 5 repeats) per participant, or 910
trials. The total test session duration was between 20 and
40 min, depending on the self-paced breaks. Structural priors
When looking at the effect of structural priors, one of our
ANALYSIS key questions, we find a pronounced curve which is char-
acteristic for a strong effect of cardinal orientations
All experiment code, data, and analyses (including extra
analyses) can be found at the Open Science Framework (osf.
io/95672). For all analyses, response time data were log-
transformed to reduce skewness. In all response time ana-
lyses, only correct trials are included. Per participant,
response times of three SD higher than this person’s mean
response time and response times lower than 100 ms were
removed from the analysis. Based on these outlier criteria,
1.9% of all trials were removed for the ASD group and 2.1%
of all trials were removed for the TD group. Bayes factor
versions of the reported mixed models analysis of variance
(ANOVA) can be found in the Supplementary Materials.
RESULTS
F I G U R E 2 Mean response times for the two distractor distribution
Average visual search performance conditions for both groups. Error bars represent 95% bootstrapped
confidence intervals. Lighter dots represent individual means. Note that
A linear mixed model (random intercept and random conditions have unequal trial numbers because of the design (5 are test
slope model) with DSD, Group and Group x DSD as trials, 10 prime trials)6 VAN DE CRUYS ET AL.
(B = 7.00; t = 11.1; p < 0.001), similarly present in chil-
dren with and without ASD (see Figure 5; B = 1.27;
t = 0.94; p = 0.35). We find faster target detection for tar-
gets with orientations around the horizontal or vertical
axis compared to oblique targets.
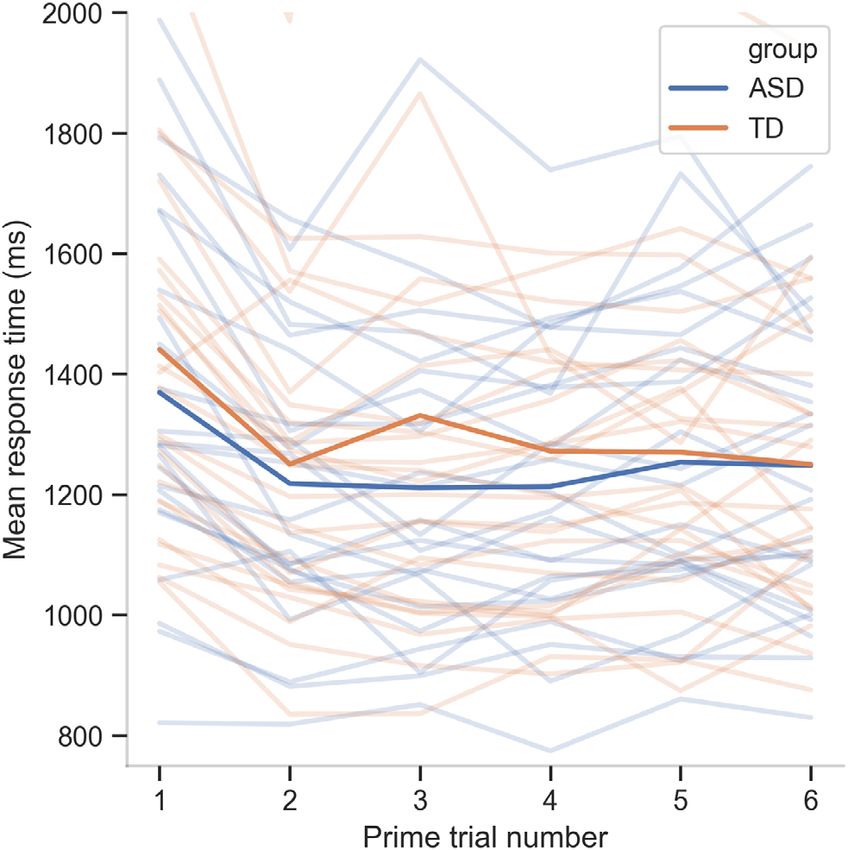
Repetition effect within prime streaks
We assessed repetition effects by analyzing response
times and accuracy over trial numbers within prime
streaks, in which the distractors at each trial were sam-
pled from the same Gaussian distribution. A linear mixed
model with Trial Number, Group and Group x Trial Num-
ber as predictors with Helmert contrasts for Trial Number
(comparing average response time on each trial with the
average response time on all subsequent trials) revealed
significantly higher response times on the first trial com-
pared to response times on the later trials for both groups
(t = 10.61, p < 0.0001; see Figure 6). On the second trial,
response times were not significantly different anymore
F I G U R E 3 Scatterplot of the social responsiveness scale-2 (SRS-2) from later trials, suggesting that virtually all learning
score by mean response time in ms per participant, with linear fits and
took place from the first to the second trial in the streak.
95% confidence intervals (shaded areas) per group
No effect of Group (t = 0.42, p = 0.68) or Group x Trial
F I G U R E 4 Conditional accuracy
functions per quantile split SRS-2 group:
low SRS-2 (80) with 13 ASD participants.
Each data point is the accuracy for a
quartile of the response time distributionVAN DE CRUYS ET AL. 7
Role-reversal effects
To test the role-reversal effects in test streaks, we ana-
lyzed response times on correct first trials of test streaks
as a function of the distance between the current target
orientation and the mean of the previous distractor distri-
bution (CT–PD) (see Figure 7). If a distractor distribu-
tion is learned and therefore inhibited during repetitions
in prime streaks, response times should increase when a
target falls within that prime distribution in a test streak.
Figure 7 shows that role-reversals have a strong effect in
both groups, as response times gradually decrease with
the increase of absolute CT-PD. A linear mixed model
with absolute CT-PD, Group, and Group x absolute CT-
PD as predictors and response time as an outcome vari-
able revealed a significantly negative effect (B = −0.05
[0.01], t = −5.47, p < 0.0001) of absolute CT-PD on
response time. No effect of Group (B = 0.03 [0.05],
t = 0.58, p = 0.56) or interaction effect of Group x abso-
lute CT-PD (B = 0.01 [0.01], t = 0.19, p = 0.85) was
found. Again, a Bayesian analysis on reaction times
F I G U R E 5 Mean response time in ms for a given target shows moderate evidence against including a main effect
orientation (binned), showing a clear effect of cardinal versus oblique
of Group and/or an interaction effect of Group x absolute
orientations (collapsed across all trials/conditions). Error bars are 95%
bootstrapped confidence intervals CT-PD (see Supplementary Materials for full results).
In typical adults, previous studies have shown that
the fall-off of response times tracks the width (or type) of
distribution closely (Chetverikov et al., 2016), indicating
that a more or less faithful representation of the distribu-
tion was learned during prime trials. However, as can be
seen in Figure 7, in our sample of children, response
times only start to go down when CT-PD is outside of
the full range of the normal distribution (beyond CT-
PD = 25), suggesting that the shape of the distribution is
not (fully) learned, but only represented as a range or uni-
form distribution. For comparison, Figure 7b shows data
Chetverikov et al. (2016, Experiment 1) for neurotypical
adults under the same distributional conditions. Indeed,
if we apply the same analysis to the binned CT-PD (bins
determined based on sampling frequencies in the experi-
ment) only two last bins, well beyond the “primed” distri-
bution, have significantly lower response times compared
to average response times in previous bins (CT-PD = 50–
70: B = −0.08, t = −2.03, p = 0.047; CT-PD = 70–90:
B = −0.12, t = −2.94, p = 0.005).
Recoding CT-PD to a binary variable indicating
whether the current target orientation fell within the
range of the previous distractor distribution (CT-
F I G U R E 6 Mean response times for each trial within prime streaks
PD < 30 ) or outside of it (CT-PD > 30 ) revealed a sig-
for both groups (darker lines). Lighter lines represent average response nificant effect of In range (B = −0.10 [0.02], t = 5.91,
times for each participant p < 0.0001) on response times, with lower response times
for trials where the target orientation fell outside
(M = 1125 ms) versus inside the previous distractor dis-
Number interactions were found. Accuracy did not tribution range (M = 1216 ms). Again, no significant
change across trials. These results indicate a quick effect of Group or Group x In range interaction effect was
decrease in response times after one trial with distractors found. Importantly, there is no effect of CT-PD on reac-
sampled from the same Gaussian distribution in both tion times if we test this on the data of within range trials
groups. only (B = 28.63; t = 0.88; p = 0.380; no group8 VAN DE CRUYS ET AL.
DISCUSSION
Children with and without ASD performed a visual sea-
rch task specifically developed to examine implicit per-
ceptual distribution learning. While our groups did not
significantly differ in overall visual search performance,
people with strong autism traits were significantly faster
in finding the target. Also, structural priors (oblique
vs. cardinal orientations) strongly but similarly
influenced search performance in both groups. In addi-
tion, both groups benefited equally from the fact that dis-
tractors are sampled from the same distribution as the
previous trial(s). However, there does not seem to be
much extra learning beyond the first repeat of that dis-
tractor distribution. Finally, through target-distractor
role reversal, we could establish that the prior distribu-
tion that children learned was much broader than the
actually presented distribution, suggesting that the vari-
ance cannot be properly learned in the number of trials in
which adults properly can do so. While a few previous
studies indeed found slower or less flexible learning of
priors in adults with ASD (Lieder et al., 2019; Sapey-
Triomphe et al., 2020; Zaidel et al., 2015), our findings
here suggest that the less precise encoding of the prior
distribution holds for all children, irrespective of ASD
diagnosis.
Despite several reports of improved visual search in
ASD, a meta-analysis showed no significant difference in
performance (Van der Hallen et al., 2015). Still, three
recent studies not included in the meta-analysis did find
improved search in very young children (Cheung
et al., 2018; Kaldy et al., 2011), with one study reporting
that better visual search performance in nine-month-old
infants predicts ASD traits at a later age (Gliga
et al., 2015). Our study corroborates that relation
between ASD traits and faster search performance, and
might help to resolve inconsistencies in this literature.
While visual search studies often use rather homogeneous
distractor sets, we continuously varied the items in this
set, which means the challenge of inferring “sameness” in
order to find the outlier (odd-one-out) is greater here.
This factor may explain the lack of the main effect of
Group on overall search performance. Compared with
adults in the same task, children are considerably slower
(average of 675 vs. 1250 ms, see Chetverikov et al., 2016)
suggesting the need to sample (saccade) across multiple
F I G U R E 7 Local regression fit of response times (shaded areas are
95% confidence interval) plotted as a function of the absolute distance (smaller) areas serially to correctly estimate means and
between current target orientation and the mean of the previous variances and find the odd-one-out. Those processes may
distractor distribution (CT-PD, in degrees), for the ASD and TD group obscure any advantages in local search that children with
(a). The middle plot (b) depicts the same for typical adults, based on autism may have. That said, our results do suggest that
data from Chetverikov et al. (2016). The lower plot (c) represents (half
children with autism are more correct in the very short
of) the normal distribution (SD = 10) from which the distractors in the
previous trials were actually sampled response times compared to typically developing chil-
dren, implying that their capacity to process the dissimi-
larity as such might be increased (when they
interaction: B = −79.27; t = −1.057; p = 0.29), indicating coincidentally land in the area of the target), in line with
that the slope in this range is not different from zero, previous studies (Baldassi et al., 2009), but that this
which is inconsistent with the encoding of a Gaussian. advantage is washed out if spatial pooling across multipleVAN DE CRUYS ET AL. 9
saccades is required. Alternatively, participants with course, we cannot exclude that children may be able to
ASD may already pool across a greater number of items implicitly learn more about the distribution given a lot
in a single fixation (leading to better mean and variance more trials than the 5 and 6 we used.
estimates, and so better outlier detection), consistent with We should emphasize that the comparison with adult
studies on motion direction discrimination (Manning data should be interpreted with some caution because of
et al., 2015, 2017). the differences in baseline response times (see Figure 7).
With regard to the influence of structural priors, we Because increased response times or an increase in noise
found that they influence perception to a similar extent in will only add noise or bias along the y-axis (independent
autism and typical development (e.g., no broader priors of CT-PD values), they will not change the shape of the
here), consistent with what Shafai et al. (2015) found for curve. However, a large change in the baseline response
a simple (single stimulus) orientation discrimination task times may be indicative of a substantial difference in the
(but see Sysoeva et al., 2015). Visual search was harder way participants conduct the task, namely in a more
(slower) when targets were near the oblique orientations serial, less efficient way. Indeed, at least in tasks that
compared to near horizontal or vertical orientations (the require the judgment of average location of sets of dots,
so-called oblique effect), showing that these biases are children have been found to use less efficient and more
already clearly apparent in children, irrespective of variable sampling strategies (Jones et al., 2019; Jones &
autism diagnosis. This is consistent with the evidence of Dekker, 2018). Other studies confirm that averages can
another intact structural prior in children with and with- be extracted from very early in development (Manning
out autism, namely the light-from-above prior (Croydon et al., 2014; Sweeny et al., 2015), but children pooled over
et al., 2017). The faster search for targets around the car- a lower number of items compared to adults. Such
dinal orientations may be due to a disproportionately decreased sampling may explain the decreased precision
larger fraction of V1 neurons sensitive to cardinal orien- of the encoding of the variance of the distractor distribu-
tations, with narrower orientation tunings (Girshick tion in children that we report. Our implicit measure of
et al., 2011), so more precise encoding and possibly better ensemble statistics also showed that the mean was implic-
discrimination in a search. However, it is possible that itly learned in both our groups, consistent with earlier
attractive biases, i.e. perceiving a stimulus to be more car- explicit tasks of summary statistics in children (and
dinal than it actually is because of the strong cardinality inconsistent with an overall global deficit in autism as
prior, also played a role. Because the average distance hypothesized by Happé & Frith, 2006).
between the target and (mean) distractor orientation was While the findings are consistent with an acquisition
90 in our design, this would likely still help the search of a broader distribution than the one presented, imply-
(e.g., +30 would become 0 ; −60 would become −90 ). ing that children form broader contextual priors than
Our findings also go against a recent neuro- adults, such “weaker” priors are not limited to individuals
computational model of autism based on divisive normal- with autism, as sometimes hypothesized (Pellicano &
ization, which predicted a reduced oblique effect in Burr, 2012). Only outside of the range of the distribution,
autism (see supplementary materials in Rosenberg the response times drop significantly, which could point
et al., 2015). Rosenberg et al. (2015) used divisive nor- to the encoding of the Gaussian distractor distribution as
malization to qualitatively model existing findings and to a uniform one (Chetverikov et al., 2017c) in children, that
predict new empirical findings in autism, assuming a is, taking into account the range of the distribution only.
decreased divisive (suppressive) normalization. However, Hence, our findings also do not align with an enhanced
contrary to the model, the oblique effect, as well as other perceptual functioning account or the idea of increased
perceptual effects based on divisive normalization sensory precision in ASD (Brock, 2012; Mottron
(Palmer et al., 2018; Sandhu et al., 2020; Van de Cruys, et al., 2006; Van de Cruys et al., 2014), since those
Vanmarcke, Steyaert, & Wagemans, 2018), seem to be accounts would predict a sharper or in any case more
preserved in autism. accurate representation of the distribution in the ASD
While studies in adults have shown that the variance group.
of the distractor distribution can be learned in a limited In future work, it will be interesting to investigate
number of trials (Chetverikov et al., 2016, 2017a, 2017c), why children with ASD lose their usual edge in visual
our data in children suggests they cannot (yet) learn the search performance in our more complex task. Both the
precise width (variance) of a Gaussian distribution, extent of spatial (and temporal) pooling (number of
and/or may rely on simpler heuristics such as the range. items), and the weights of the different items contributing
Specifically, Chetverikov et al. (2017a) showed that for to the mean and variance estimation might vary
neurotypical adults the difference between a normal and (Alvarez, 2011). In addition, it is sometimes hypothesized
a uniform (range) type of distribution arises after 1 and that the key problem in ASD may be in disentangling
2 trials already. The fact that the CT-PD curves are flat irrelevant (noise) variability from relevant dimensions of
within the full range of the normal distribution and only variability (Van de Cruys et al., 2017). Hence, adding an
then decrease (see Figure 7) suggests that children are not irrelevant dimension of variability (e.g., color) to the par-
really representing the distribution as a Gaussian. Of adigm may be promising (Hansmann-Roth et al., 2019).10 VAN DE CRUYS ET AL.
Finally and most importantly, a study with adults with Resources, Writing - Review & Editing, Funding
ASD should verify whether the capacity to encode the acquisition.
precise distractor distribution can be acquired with aging,
as seems to be the case for neurotypical adults, or CONFLICT OF INTEREST
whether autistic individuals are generally stuck with The authors declare no conflicts of interest.
broader prior distributions. Adult participants would also
allow us to increase the trial load and add conditions DAT A AVAIL AB IL IT Y S T AT E ME NT
with different distribution types (Gaussian, uniform) and All code and data are available at osf.io/95672 (doi:
widths, as done in earlier studies using this paradigm in 10.17605/OSF.IO/95672).
typical participants (e.g., Chetverikov et al., 2016, 2017a)
in order to better characterize distribution learning in OR CID
autism as well as dissociate possible effects of learning of Sander Van de Cruys https://orcid.org/0000-0003-4831-
the target distribution of priming trials versus learning 7800
(of the shape of) the distractor distribution. Indeed, the Laurie-Anne Sapey-Triomphe https://orcid.org/0000-
fact that, contrary to research in adults, we did not find a 0002-6564-5892
clear reproduction of the shape of the distractor distribu- Johan Wagemans https://orcid.org/0000-0002-7970-
tion (i.e., monotonic decrease in RT corresponding to 1541
monotonic decrease in distractor probability density),
leaves open a possible contribution of target distribution REF ER ENCE S
learning (in both groups). Achenbach, T. M., & Ruffle, T. M. (2000). The child behavior checklist
In conclusion, we present the first evidence on feature and related forms for assessing behavioral/emotional problems
and competencies. Pediatrics in Review/American Academy of
distribution learning in children. Using our implicit mea-
Pediatrics, 21(8), 265–271. https://doi.org/10.1542/pir.21-8-265
sure, we show that the variance learned was much Alvarez, G. A. (2011). Representing multiple objects as an ensemble
broader than the one of the presented distribution, con- enhances visual cognition. Trends in Cognitive Sciences, 15(3),
sistent with less informative or broader priors in children 122–131. https://doi.org/10.1016/j.tics.2011.01.003
irrespective of ASD diagnosis. This may point to a level American Psychiatric Association. (2000). Diagnostic and statistical
of developmental maturation required to neurally repre- manual, 4th edn, Text Revision (DSM-IV-TR).
American Psychiatric Association. (2013). Diagnostic and statistical
sent precise distributions, as we see in adults. In contrast, manual of mental disorders (DSM-5®). American Psychiatric Pub.
structural priors (those that do not depend on learning Baldassi, S., Pei, F., Megna, N., Recupero, G., Viespoli, M.,
within the task) do already have a strong effect on chil- Igliozzi, R., Tancredi, R., Muratori, F., & Cioni, G. (2009). Search
dren’s visual search performance, again irrespective of superiority in autism within, but not outside the crowding regime.
ASD diagnosis. Vision Research, 49(16), 2151–2156. https://doi.org/10.1016/j.
visres.2009.06.007
Brock, J. (2012). Alternative Bayesian accounts of autistic perception:
A CK NO W L E D G M E N T S Comment on {P}ellicano and {B}urr. Trends in Cognitive Sci-
The authors would like to thank all participants and their ences, 16(12), 573–574; author reply: 574–575. https://doi.org/10.
families for their time and contribution to this research. 1016/j.tics.2012.10.005
Chetverikov, A., Campana, G., & Kristj (2016). Building
ansson, A.
We would also like to thank Christophe Bossens for his
ensemble representations: How the shape of preceding distractor
help with programming the experiment, as well as Lise distributions affects visual search. Cognition, 153, 196–210. https://
Raymaekers for her help with the data collection. This doi.org/10.1016/j.cognition.2016.04.018
work has been funded by a personal fellowship awarded Chetverikov, A., Campana, G., & Kristj (2017a). Rapid
ansson, A.
to Lisa Lemmens by the Research Foundation Flanders learning of visual ensembles. Journal of Vision, 17(2), 21. https://
(1171717N) and by a Methusalem grant awarded doi.org/10.1167/17.2.21
Chetverikov, A., Campana, G., & Kristj ansson, A. (2017b). Learning
to Johan Wagemans by the Flemish Government features in a complex and changing environment: A distribution-
(METH/14/02). based framework for visual attention and vision in general. Pro-
gress in Brain Research, 236, 97–120. https://doi.org/10.1016/bs.
A UT H OR CO N T R I B U T I O N S pbr.2017.07.001
Chetverikov, A., Campana, G., & Kristj ansson, A. (2017c). Rep-
Sander Van de Cruys: Conceptualization, Design, Data
resenting color ensembles. Psychological Science, 28(10), 1510–
Collection, Data Analysis, Visualization, Writing-Origi- 1517. https://doi.org/10.1177/0956797617713787
nal draft preparation, Writing - Review & Editing; Lisa Chetverikov, A., Campana, G., & Kristj (2017d). Set size
ansson, A.
Lemmens: Conceptualization, Design, Data Collection, manipulations reveal the boundary conditions of perceptual
Data Analysis, Writing - Review & Editing; Laurie-Anne ensemble learning. Vision Research, 140, 144–156. https://doi.org/
10.1016/j.visres.2017.08.003
Sapey-Triomphe: Conceptualization, Design, Writing -
Chetverikov, A., Hansmann-Roth, S., Tanrıkulu, Ö. D., &
Review & Editing; Andrey Chetverikov: Conceptualiza- Kristj (2020). Feature distribution learning (FDL): A
ansson, A.
tion, Design, Data analysis, Resources, Visualization, new method for studying visual ensembles perception with priming
Writing - Review & Editing; Ilse Noens: Conceptualiza- of attention shifts. In S. Pollmann (Ed.), Spatial learning and atten-
tion, Design, Resources, Writing - Review & tion guidance (pp. 37–57). Springer US. https://doi.org/10.1007/
Editing; Johan Wagemans: Conceptualization, Design, 7657_2019_20VAN DE CRUYS ET AL. 11
Cheung, C. H. M., Bedford, R., Johnson, M. H., Charman, T., Cognitive Neuroscience, 24, 51–62. https://doi.org/10.1016/j.dcn.
Gliga, T., & BASIS team. (2018). Visual search performance in 2017.01.005
infants associates with later ASD diagnosis. Developmental Cogni- Karvelis, P., Seitz, A. R., Lawrie, S. M., & Seriès, P. (2018). Autistic
tive Neuroscience, 29, 4–10. https://doi.org/10.1016/j.dcn.2016. traits, but not schizotypy, predict increased weighting of sensory
09.003 information in Bayesian visual integration. eLife, 7, e34115. http://
Constant, A., Bervoets, J., Hens, K., & Van de Cruys, S. (2018). Precise doi.org/10.7554/elife.34115.
worlds for certain minds: An ecological perspective on the rela- Lai, M.-C., Lombardo, M. V., Auyeung, B., Chakrabarti, B., & Baron-
tional self in autism. Topoi. An International Review of Philosophy, Cohen, S. (2015). Sex/gender differences and autism: Setting the
39, 1–12. https://doi.org/10.1007/s11245-018-9546-4 scene for future research. Journal of the American Academy of
Corbett, J. E., Venuti, P., & Melcher, D. (2016). Perceptual averaging Child and Adolescent Psychiatry, 54(1), 11–24. https://doi.org/10.
in individuals with autism Spectrum disorder. Frontiers in Psychol- 1016/j.jaac.2014.10.003
ogy, 7, 1735. https://doi.org/10.3389/fpsyg.2016.01735 Lawson, R. P., Mathys, C., & Rees, G. (2017). Adults with autism over-
Croydon, A., Karaminis, T., Neil, L., Burr, D., & Pellicano, E. (2017). estimate the volatility of the sensory environment. Nature Neuro-
The light-from-above prior is intact in autistic children. Journal of science, 20(9), 1293–1299. https://doi.org/10.1038/nn.4615
Experimental Child Psychology, 161, 113–125. https://doi.org/10. Lawson, R. P., Rees, G., & Friston, K. J. (2014). An aberrant precision
1016/j.jecp.2017.04.005 account of autism. Frontiers in Human Neuroscience, 8, 302.
Dickinson, A., Bruyns-Haylett, M., Smith, R., Jones, M., & Milne, E. https://doi.org/10.3389/fnhum.2014.00302
(2016). Superior orientation discrimination and increased peak Lieder, I., Adam, V., Frenkel, O., Jaffe-Dax, S., Sahani, M., &
gamma frequency in autism spectrum conditions. Journal of Ahissar, M. (2019). Perceptual bias reveals slow-updating in
Abnormal Psychology, 125(3), 412–422. https://doi.org/10.1037/ autism and fast-forgetting in dyslexia. Nature Neuroscience, 22(2),
abn0000148 256–264. https://doi.org/10.1038/s41593-018-0308-9
Dunn, W., & Rietman, A. (2006). Sensory Profile-NL 3 t/m 10 jaar- - Manning, C., Dakin, S. C., Tibber, M. S., & Pellicano, E. (2014). Aver-
Handleiding. Amersfoort: Studio Imago. aging, not internal noise, limits the development of coherent
Friston, K., & Kiebel, S. (2009). Predictive coding under the free-energy motion processing. Developmental Cognitive Neuroscience, 10, 44–
principle. Philosophical Transactions of the Royal Society of 56. https://doi.org/10.1016/j.dcn.2014.07.004
London. Series B, Biological Sciences, 364(1521), 1211–1221. Manning, C., Tibber, M. S., Charman, T., Dakin, S. C., & Pellicano, E.
https://doi.org/10.1098/rstb.2008.0300 (2015). Enhanced integration of motion information in children
Girshick, A. R., Landy, M. S., & Simoncelli, E. P. (2011). Cardinal with autism. The Journal of Neuroscience: The Official Journal of
rules: Visual orientation perception reflects knowledge of environ- the Society for Neuroscience, 35(18), 6979–6986. https://doi.org/10.
mental statistics. Nature Neuroscience, 14(7), 926–932. https://doi. 1523/JNEUROSCI.4645-14.2015
org/10.1038/nn.2831 Manning, C., Tibber, M. S., & Dakin, S. C. (2017). Visual integration
Gliga, T., Bedford, R., Charman, T., Johnson, M. H., & BASIS Team. of direction and orientation information in autistic children.
(2015). Enhanced visual search in infancy predicts emerging Autism & Developmental Language Impairments, 2,
autism symptoms. Current Biology: CB, 25(13), 1727–1730. 2396941517694626. https://doi.org/10.1177/2396941517694626
https://doi.org/10.1016/j.cub.2015.05.011 Mottron, L., Dawson, M., Soulières, I., Hubert, B., & Burack, J.
Gotham, K., Risi, S., Pickles, A., & Lord, C. (2007). The autism diag- (2006). Enhanced perceptual functioning in autism: An update,
nostic observation schedule: Revised algorithms for improved and eight principles of autistic perception. Journal of Autism and
diagnostic validity. Journal of Autism and Developmental Disor- Developmental Disorders, 36(1), 27–43. http://www.ncbi.nlm.nih.
ders, 37(4), 613–627. https://doi.org/10.1007/s10803-006-0280-1 gov/pubmed/16453071
Haberman, J., & Whitney, D. (2012). Ensemble perception: Summariz- Norman, L. J., Heywood, C. A., & Kentridge, R. W. (2015). Direct
ing the scene and broadening the limits of visual processing. From encoding of orientation variance in the visual system. Journal of
Perception to Consciousness: Searching with Anne Treisman, Vision, 15(4), 3. https://doi.org/10.1167/15.4.3
339–349. Palmer, C. J., Lawson, R. P., & Hohwy, J. (2017). Bayesian approaches
Hansmann-Roth, S., Chetverikov, A., & Kristj (2019). Rep-
ansson, A. to autism: Towards volatility, action, and behavior. Psychological
resenting color and orientation ensembles: Can observers learn Bulletin, 143(5), 521–542. https://doi.org/10.1037/bul0000097
multiple feature distributions? Journal of Vision, 19(9), 2. https:// Palmer, C. J., Lawson, R. P., Shankar, S., Clifford, C. W. G., &
doi.org/10.1167/19.9.2 Rees, G. (2018). Autistic adults show preserved normalisation of
Happé, F., & Frith, U. (2006). The weak coherence account: Detail- sensory responses in gaze processing. Cortex; A Journal Devoted to
focused cognitive style in autism Spectrum disorders. Journal of the Study of the Nervous System and Behavior, 103, 13–23. https://
Autism and Developmental Disorders, 36(1), 5–25. https://doi.org/ doi.org/10.1016/j.cortex.2018.02.005
10.1007/s10803-005-0039-0 Pellicano, E., & Burr, D. (2012). When the world becomes “too real”: A
Hohwy, J. (2013). The predictive mind. Oxford University Press. http:// Bayesian explanation of autistic perception. Trends in Cognitive
books.google.be/books?id=3m8nAgAAQBAJ Sciences, 16(10), 504–510. https://doi.org/10.1016/j.tics.2012.
Jones, P. R., & Dekker, T. M. (2018). The development of perceptual 08.009
averaging: Learning what to do, not just how to do it. Develop- Rhodes, G., Neumann, M. F., Ewing, L., & Palermo, R. (2015).
mental Science, 21(3), e12584. https://doi.org/10.1111/desc.12584 Reduced set averaging of face identity in children and adolescents
Jones, P. R., Landin, L., McLean, A., Juni, M. Z., Maloney, L. T., with autism. Quarterly Journal of Experimental Psychology, 68(7),
Nardini, M., & Dekker, T. M. (2019). Efficient visual information 1391–1403. https://doi.org/10.1080/17470218.2014.981554
sampling develops late in childhood. Journal of Experimental Psy- Roeyers, H., Druart, C., De Schryver, M., & Schittekatte, M. (2011).
chology. General, 148(7), 1138–1152. https://doi.org/10.1037/ SRS Screeningslijst voor autismespectrumstoornissen. Hogrefe.
xge0000629 Rosenberg, A., Patterson, J. S., & Angelaki, D. E. (2015). A computa-
Kaldy, Z., Kraper, C., Carter, A. S., & Blaser, E. (2011). Toddlers with tional perspective on autism. Proceedings of the National Academy
autism Spectrum disorder are more successful at visual search than of Sciences of the United States of America, 112(30), 9158–9165.
typically developing toddlers. Developmental Science, 14(5), 980– https://doi.org/10.1073/pnas.1510583112
988. https://doi.org/10.1111/j.1467-7687.2011.01053.x Rosenholtz, R. (2001). Visual search for orientation among heteroge-
Karaminis, T., Neil, L., Manning, C., Turi, M., Fiorentini, C., neous distractors: Experimental results and implications for signal-
Burr, D., & Pellicano, E. (2017). Ensemble perception of emotions detection theory models of search. Journal of Experimental Psy-
in autistic and typical children and adolescents. Developmental chology. Human Perception and Performance, 27(4), 985–999.12 VAN DE CRUYS ET AL.
Sandhu, T. R., Rees, G., & Lawson, R. P. (2020). Preserved low-level visual preserved in ASD. Clinical Psychological Science, 6, 382–393.
gain control in autistic adults. Wellcome Open Research, 4(208), 208. https://doi.org/10.1177/2167702617740955
Sapey-Triomphe, L.-A., Timmermans, L., & Wagemans, J. (2020). Van der Hallen, R., Evers, K., Brewaeys, K., Van den
Priors bias perceptual decisions in autism, but are less flexibly Noortgate, W., & Wagemans, J. (2015). Global processing takes
adjusted to the context. Autism Research: Official Journal of the time: A meta-analysis on local-global visual processing in ASD.
International Society for Autism Research. Psychological Bulletin, 141(3), 549–573. https://doi.org/10.1037/
Sattler, J. M. (2001). Assessment of children: Cognitive applications bul0000004
(p. 931). Jerome M. Sattler, Publisher. Inc. Van der Hallen, R., Lemmens, L., Steyaert, J., Noens, I., &
Seriès, P., & Seitz, A. R. (2013). Learning what to expect (in visual per- Wagemans, J. (2017). Ensemble perception in autism spectrum dis-
ception). Frontiers in Human Neuroscience, 7, 668. https://doi.org/ order: Member-identification versus mean-discrimination. Autism
10.3389/fnhum.2013.00668 Research: Official Journal of the International Society for Autism
Shafai, F., Armstrong, K., Iarocci, G., & Oruc, I. (2015). Visual orien- Research, 10(7), 1291–1299. http://onlinelibrary.wiley.com/doi/10.
tation processing in autism spectrum disorder: No sign of 1002/aur.1767/full
enhanced early cortical function. Journal of Vision, 15(15), 18. Wechsler, D. (1992). Wechsler intelligence scale for children (3rd Edition
https://doi.org/10.1167/15.15.18 NL). The Psychological Corporation.
Solomon, J. A. (2010). Visual discrimination of orientation statistics in Whitney, D., Haberman, J., & Sweeny, T. D. (2014). 49 From Textures
crowded and uncrowded arrays. Journal of Vision, 10(14), 19. to Crowds: Multiple Levels of Summary Statistical Perception.
https://doi.org/10.1167/10.14.19 Whitney, D., & Yamanashi Leib, A. (2018). Ensemble Perception.
Sweeny, T. D., Wurnitsch, N., Gopnik, A., & Whitney, D. (2015). Annual Review of Psychology, 69, 105–129. https://doi.org/10.1146/
Ensemble perception of size in 4- -5-year-old children. Develop- annurev-psych-010416-044232
mental Science, 18(4), 556–568. https://onlinelibrary.wiley.com/ Zaidel, A., Goin-Kochel, R. P., & Angelaki, D. E. (2015). Self-motion
doi/abs/10.1111/desc.12239 perception in autism is compromised by visual noise but integrated
Sysoeva, O. V., Davletshina, M. A., Orekhova, E. V., Galuta, I. A., & optimally across multiple senses. Proceedings of the National Acad-
Stroganova, T. A. (2015). Reduced oblique effect in children with emy of Sciences of the United States of America, 112(20), 6461–
autism spectrum disorders (ASD). Frontiers in Neuroscience, 9, 6466. https://doi.org/10.1073/pnas.1506582112
512. https://doi.org/10.3389/fnins.2015.00512
Teufel, C., & Fletcher, P. C. (2020). Forms of prediction in the nervous
SUPPORTING INFORMATION
system. Nature Reviews. Neuroscience, 21(4), 231–242. https://doi.
org/10.1038/s41583-020-0275-5 Additional supporting information may be found online
Van de Cruys, S., Evers, K., Van der Hallen, R., Van Eylen, L., in the Supporting Information section at the end of this
Boets, B., de Wit, L., & Wagemans, J. (2014). Precise minds in article.
uncertain worlds: Predictive coding in autism. Psychological
Review, 121(4), 649–675. https://doi.org/10.1037/a0037665
Van de Cruys, S., Van der Hallen, R., & Wagemans, J. (2017). Dis- How to cite this article: Van de Cruys S,
entangling signal and noise in autism spectrum disorder. Brain and
Lemmens L, Sapey-Triomphe L-A, Chetverikov A,
Cognition, 112, 78–83. https://doi.org/10.1016/j.bandc.2016.08.004
Van de Cruys, S., Vanmarcke, S., Steyaert, J., & Wagemans, J. (2018). Noens I, Wagemans J. Structural and contextual
Intact perceptual bias in autism contradicts the decreased normali- priors affect visual search in children with and
zation model. Scientific Reports, 8, 12559. https://doi.org/10.1038/ without autism. Autism Research. 2021;1–12.
s41598-018-31042-z https://doi.org/10.1002/aur.2511
Van de Cruys, S., Vanmarcke, S., Van de Put, I., & Wagemans, J.
(2018). The use of prior knowledge for perceptual inference isYou can also read