Viva Energy REIT FY2018 Results & Equity Raising - 21 February 2019 - Open Briefing
←
→
Page content transcription
If your browser does not render page correctly, please read the page content below
VVR FY2018 RESULTS

                        Viva Energy REIT
                        FY2018 Results &
                        Equity Raising

                        21 February 2019
NOT FOR DISTRIBUTION OR RELEASE IN THE UNITED STATES
IMPORTANT NOTICE AND DISCLAIMER
NOT FOR DISTRIBUTION OR RELEASE IN THE UNITED STATES

                                                       This presentation has been prepared by Viva Energy REIT (“VVR” or                                                                                      affect future operations of VVR and the values and the impact that
                                                       “Viva Energy REIT”) which is a stapled entity comprising shares in         This presentation may not be distributed or released in the United          different future outcomes may have on VVR) and rely on their own
                                                       Viva Energy REIT Limited (ABN 35 612 986 517) (“Company”)                  States. This presentation does not constitute an offer to sell, or the      examination of VVR, including the merits and risks involved having
                                                       stapled with units in the Viva Energy REIT Trust (ARSN 613 146             solicitation of an offer to buy, any securities in the United States. The   regard to their own investment objectives, financial situation and
                                                       464) (“Trust”). VER Limited (ABN 436 609 868 000 and AFSL                  New Securities have not been, and will not be, registered under the         needs. Each person should consult a professional investment
                                                       483795) is the Responsible Entity of the Trust, and VER Manager            U.S. Securities Act of 1933 (“U.S. Securities Act”) or the securities       adviser and seek legal, accounting and taxation advice appropriate
                                                       Pty Ltd provides management services to VER Limited and Viva               laws of any state or other jurisdiction of the United States. The New       to their jurisdiction before making any decision regarding a financial
                                                       Energy REIT. This presentation contains information in relation to an      Securities may not be offered or sold to, directly or indirectly, any       product. Cooling off rights do not apply to the acquisition of New
                                                       institutional placement (“Institutional Placement”) of new ordinary        person in the United States, except in a transaction exempt from, or        Securities pursuant to the Equity Raising.
                                                       fully paid stapled securities in VVR (“New Securities”) and an offer of    not subject to, the registration requirements of the U.S. Securities
                                                       New Securities under a Security Purchase Plan (“SPP”) (together,           Act and any other applicable U.S. state securities laws.                    Industry data and third party market data
                                                       the “Equity Raising”).                                                                                                                                 This presentation contains statistics, data and other information
                                                                                                                                  The distribution of this presentation outside Australia may be              relating to markets, market sizes, market shares, market positions
                                                       The information provided in this presentation should be read in            restricted by law. Any recipient of this presentation outside Australia     and other industry data pertaining to VVR’s business and markets.
                                                       conjunction with VVR's other periodic and continuous disclosure            should seek advice on and observe such restrictions. Any non-               Unless otherwise indicated, such information is based on an industry
                                                       announcements lodged with the ASX which are available at                   compliance with these restrictions may constitute a violation of            report (“Market Report”) that Viva Energy REIT commissioned from
                                                       www.asx.com.au.                                                            applicable securities laws. Refer to the “Foreign Selling Restriction”’     Jones Lang LaSalle Advisory Services Pty Ltd, as well as Viva
                                                                                                                                  section in Appendix 3 of this presentation for more information.            Energy REIT’s analysis of such information. The information
                                                       Summary information                                                                                                                                    contained in the Market Report has been accurately reproduced,
                                                       The information in this presentation is in summary form and does not       Investment risk                                                             and, as far as VVR is aware, no facts have been omitted which
                                                       purport to be complete. This presentation is for information purposes      An investment in securities in VVR is subject to investment and other       would render the information provided inaccurate or misleading.
                                                       only, is of a general nature, does not constitute financial product        known and unknown risks, some of which are beyond the control of
                                                       advice, nor is it intended to constitute legal, tax or accounting advice   VVR, including possible loss of income and principal invested. VVR          You should note that market data and statistics are inherently
                                                       or opinion. This information does not purport to include or summarise      does not guarantee any particular rate of return or the performance         predictive and subject to uncertainty and not necessarily reflective of
                                                       all information than an investor should consider when making an            of VVR, nor does it guarantee any particular tax treatment. Investors       actual market conditions.
                                                       investment decision nor does it contain all information which would        should have regard to (amongst other things) the risk factors
                                                       be required in a Product Disclosure Statement, or other disclosure         described in the “Key Risk Factor” section in Appendix 2 of this            In preparing this presentation the authors have relied upon and
                                                       documents prepared in accordance with the requirements of the              presentation when making their investment decision.                         assumed, without independent verification, the accuracy and
                                                       Corporations Act 2001 (Cth) (“Corporations Act”).                                                                                                      completeness of all information available from public sources or
                                                                                                                                  No investment or financial product advice                                   which has otherwise been reviewed in preparation of the
                                                       Not an offer                                                               The information contained in this presentation does not constitute          presentation. All reasonable care has been taken in preparing the
                                                       This presentation is for information purposes only and is not a            investment or financial product advice (nor taxation, accounting or         information and assumptions contained in this presentation, however
                                                       prospectus, product disclosure statement or other disclosure or            legal advice), is not a recommendation to acquire New Securities            no representation or warranty, express or implied, is made as to the
                                                       offering document under Australian law or any other law (and will not      and does not and will not form the basis of any contract or                 fairness, accuracy, completeness or correctness of the information,
                                                       be lodged with the Australian Securities Investments Commission            commitment for the acquisition of New Securities. This presentation         opinions and conclusions contained in this presentation. The
                                                       (“ASIC”)). It does not constitute in any jurisdiction, whether in          has been prepared without taking into account the investment                information contained in this presentation is current as at the date of
                                                       Australia or elsewhere, an offer or invitation to apply for or purchase    objectives, financial situation or particular needs of any particular       this presentation and is subject to change without notice.
                                                       stapled securities of VVR or any other financial product and neither       person. Before making an investment decision, investors must
                                                       this presentation nor any of the information contained herein shall        consider the appropriate of the information (including but not limited
                                                       form the basis of any contract or commitment.                              to the assumptions, uncertainties and contingencies which may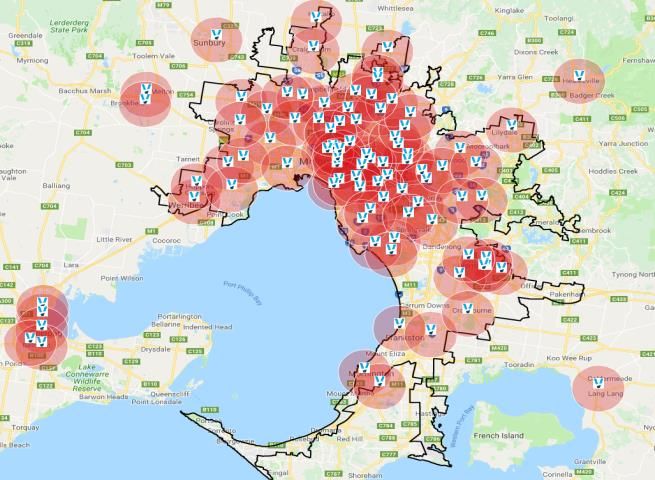
IMPORTANT NOTICE AND DISCLAIMER
NOT FOR DISTRIBUTION OR RELEASE IN THE UNITED STATES

                                                       Future performance and forward looking statements                                 be entirely at your own risk. This presentation may not be                 else’s, future financial position and/or performance. The pro forma
                                                       This presentation contains forward-looking statements, including                  reproduced or published, in whole or in part, for any purpose without      historical financial information has been prepared by VVR in
                                                       statements regarding the plans, strategies and objectives of VVR                  the prior written permission of VVR. VVR disclaims any intent or           accordance with the measurement and recognition principles, but not
                                                       management, distribution guidance, the timetable for the Equity                   obligation to update publicly any forward-looking statements,              the disclosure requirements prescribed by Australian Accounting
                                                       Raising and the use of the proceeds thereof. Forward looking                      whether as a result of new information, future events or results or        Standards. The pro forma historical financial information included in
                                                       statements can generally be identified by the use of forward looking              otherwise.                                                                 this presentation does not purport to be in compliance with Article 11
                                                       words such as, 'expect', 'anticipate', 'likely', 'intend', 'should, 'could',                                                                                 of Regulation S-X of the rules and regulations of the U.S. Securities
                                                       'may', 'predict', 'plan', 'propose', 'will', 'believe', 'forecast', 'estimate',   Past performance                                                           and Exchange Commission, and such information does not purport
                                                       'target', ‘guidance’ and other similar expressions. Indications of, and           Past performance and pro-forma historical information in this              to comply with Article 3-05 of Regulation S-X.
                                                       guidance or outlook on, future earnings or financial position or                  presentation is given for illustrative purposes only and should not be
                                                       performance are also forward looking statements. Such prospective                 relied upon (and is not) an indication of future performance including     In addition, investors should be aware that certain financial
                                                       financial information contained within this presentation may be                   future security price information. Historical information in this          measures in this Presentation are "non-IFRS financial information"
                                                       unreliable given the circumstances and the underlying assumptions                 presentation relating to VVR is information that has been released to      under ASIC Regulatory Guide 230 Disclosing non-IFRS financial
                                                       to this information may materially change in the future.                          the market. For further information, please see past announcements         information published by ASIC and also non-GAAP financial
                                                                                                                                         released to ASX.                                                           measures’ within the meaning of Regulation G under the U.S.
                                                       Any forward-looking statements, including projections, guidance on                                                                                           Securities Exchange Act of 1934 and are not recognised under AAS
                                                       future revenues, earnings and estimates, are provided as a general                Financial data                                                             and IFRS. Non-IFRS financial information/non-GAAP financial
                                                       guide only and should not be relied upon as an indication or                      All dollar values are in Australian dollars ($ or AUD) unless stated       measures in this presentation include, among other things,
                                                       guarantee of future performance. You are cautioned not to place                   otherwise. All references starting with “FY” refer to the financial year   distributable earnings, gearing and gearing ratio and the pro-forma
                                                       undue reliance on any forward looking statement. While due care                   for VVR, ending 31 December. For example, “FY2018” refers to the           balance sheet set out on page 32. VVR believes this non-IFRS
                                                       and attention has been used in the preparation of forward looking                 financial year ended 31 December 2018.                                     financial information/non-GAAP financial measures provide useful
                                                       statements, forward-looking statements involve known and unknown                                                                                             information to users in measuring the financial performance and
                                                       risks, uncertainties and other factors that may cause VVR’s actual                The financial information in this presentation has been prepared and       condition of VVR. However, investors should note that the non-IFRS
                                                       results, performance or achievements to differ materially from any                presented in accordance with the recognition and measurements              financial information and non-GAAP financial measures do not have
                                                       future results, performance or achievements expressed or implied by               principles prescribed in the Australian Accounting Standards               a standardised meaning prescribed by AAS or IFRS and, therefore,
                                                       these forward-looking statements. Any forward-looking statements,                 (including the Australian Accounting Interpretations) issued by the        may not be comparable to similarly titled measures presented by
                                                       opinions and estimates in this presentation are based on                          Australian Accounting Standards Board (“Australian Accounting              other entities, nor should they be construed as an alternative to other
                                                       assumptions and contingencies which are subject to change without                 Standards” or “AAS”), which are consistent with International              financial measures determined in accordance with AAS or IFRS.
                                                       notice, as are statements about market and industry trends, which                 Financial Reporting Standards (“IFRS”) and interpretations issued by       Investors are cautioned, therefore, not to place undue reliance on
                                                       are based on interpretations of current market conditions. A number               the International Accounting Standards Board. The financial                any non-IFRS financial information/non-GAAP financial measures
                                                       of important factors could cause VVR’s actual results to differ                   presentation in this presentation is presented in an abbreviated form      and ratios included in this presentation.
                                                       materially from the plans, objectives, expectations, estimates and                insofar as it does not include all of the presentation and disclosures
                                                       intentions expressed in such forward looking statements, including                required by the AAS and other mandatory professional reporting             Effect of rounding
                                                       the risk factors described in the “Key Risk Factor” section in                    requirements applicable to general purpose financial reports               A number of figures, amounts, percentages, estimates, calculations
                                                       Appendix 2 of this presentation, and many of these factors are                    prepared in accordance with the Corporations Act.                          of value and fractions in this presentation are subject to the effect of
                                                       beyond VVR’s control.                                                                                                                                        rounding. Accordingly, the actual calculation of these figures may
                                                                                                                                         This presentation includes certain pro forma historical financial          differ from the figures set out in this presentation.
                                                       You should rely on your own independent assessment of any                         information. The pro forma historical financial information provided in
                                                       information, statements or representations contained in this                      this presentation is for illustrative purposes only and is not
                                                       presentation and any reliance on information in this presentation will            represented as being indicative of VVR's views on its, nor anyone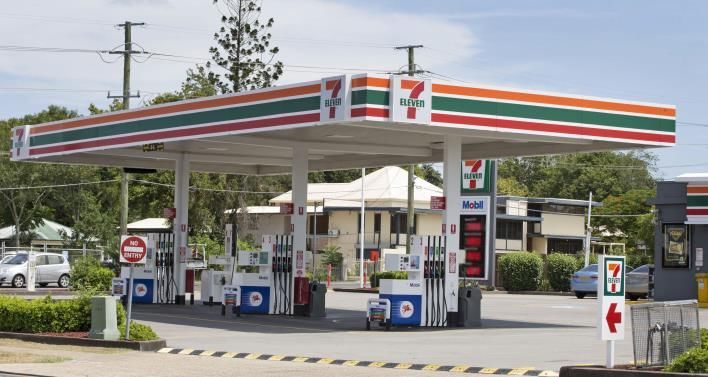
IMPORTANT NOTICE AND DISCLAIMER
NOT FOR DISTRIBUTION OR RELEASE IN THE UNITED STATES

                                                       General disclaimer                                                           The Limited Parties make no recommendations as to whether you or
                                                       The underwriters to the Institutional Placement, together with their         your related parties should participate in the Equity Raising, nor do
                                                       related bodies corporate, shareholders or affiliates and each of their       they make any representations or warranties to you concerning the
                                                       respective officers, directors, employees, affiliates, agents or             Equity Raising, and you represent, warrant and agree that you have
                                                       advisers (each a “Limited Party”) have not authorised, permitted or          not relied on any statements made by a Limited Party in relation to
                                                       caused the issue, lodgement, submission, dispatch or provision of            the Equity Raising and you further expressly disclaim that you are in
                                                       this presentation and do not make or purport to make any statement           a fiduciary relationship with any of them.
                                                       in this presentation and there is no statement in this presentation
                                                       which is based on any statement by a Limited Party.                          Investors acknowledge and agree that determination of eligibility of
                                                                                                                                    investors for the purposes of the Equity Raising is determined by
                                                       No representation or warranty, express or implied, is made by VVR,           reference to a number of matters, including legal and regulatory
                                                       its related bodies corporate, any of their respective officers, directors,   requirements, logistical and registry constraints and the discretion of
                                                       employees, agents or advisers, nor any Limited Party as to the               VVR and/or the Limited Parties, and each of VVR and the Limited
                                                       accuracy, reliability, completeness or fairness of the information,          Parties disclaim any duty or liability (including for negligence) in
                                                       opinions and conclusions contained in this presentation.                     respect of that determination and the exercise or otherwise of that
                                                                                                                                    discretion, to the maximum extent permitted by law.
                                                       Neither VVR, VER Limited, VER Manager Pty Ltd, nor any of their
                                                       associates, related entities or any of their respective officers,
                                                       directors, employees, agents, consultants or advisers, nor any
                                                       Limited Party, gives any warranty or representation (express or
                                                       implied) as to the accuracy, reliability or completeness of the
                                                       information, opinions or conclusions contained in this presentation.
                                                       In particular, the Limited Parties have not independently verified
                                                       such information and take no responsibility for any part of this
                                                       presentation or the Equity Raising.

                                                       To the maximum extent permitted by law and subject to any
                                                       continuing obligations under the ASX listing rules, VVR, VER
                                                       Manager Pty Ltd and VER Limited and each of their respective
                                                       associates, related entities, officers, directors, employees, agents,
                                                       consultants and advisers and each of the Limited Parties do not
                                                       accept and expressly disclaim any liability for any loss or damage
                                                       (including, without limitation, any liability arising out of fault or
                                                       negligence and whether direct, indirect, consequential or otherwise)
                                                       arising from the use of, or reliance on, anything contained in or
                                                       omitted from this presentation. Statements made in this presentation
                                                       are made only at the date of the presentation. VVR is under no
                                                       obligation to update this presentation. The information in this
                                                       presentation remains subject to change by VVR without notice.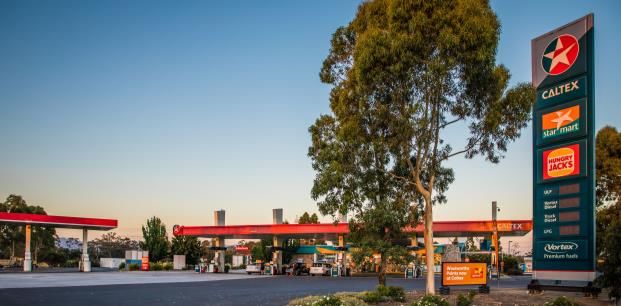
NOT FOR DISTRIBUTION OR RELEASE IN THE UNITED STATES

                                                       Highlights
                                                       MARGARET KENNEDY
                                                       Managing Director VER Manager Pty Limited

                                                              5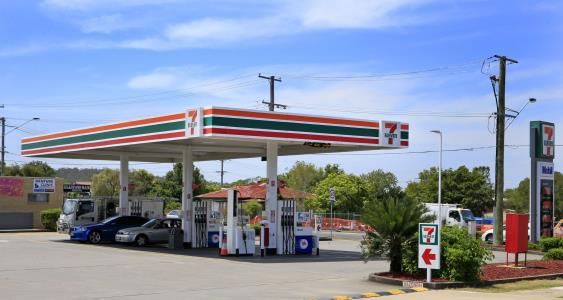
KEY HIGHLIGHTS
VVR FY2018 RESULTS
NOT FOR DISTRIBUTION OR RELEASE IN THE UNITED STATES
Results overview
VVR continues to deliver on strategic objectives
FY2018 Distributable Earnings of 14.02 CPS1, ahead of guidance
Continued growth in portfolio size whilst maintaining focus on quality
Acquisition pipeline replenished
Active capital management delivers path to continued growth
FY2019 Distributable Earnings per security growth guidance range of 3-3.75%2,3 from FY2018
1 Based on weighted average number of stapled securities on issue during the reporting period
2 Includes the impact of the $100 million fully underwritten Institutional Placement but does not include any impact attributable to the SPP (see page 30 for further details in relation to the 6
Institutional Placement and the SPP)
3 Provided there are no material changes in market conditions and no other factors adversely affecting VVR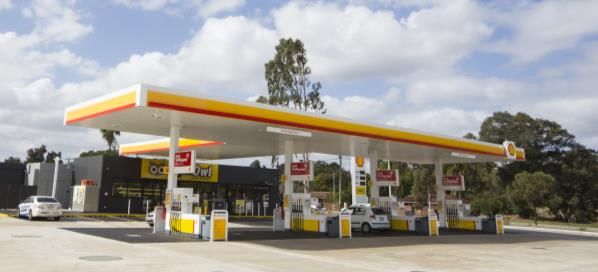
KEY HIGHLIGHTS
                                                       VVR FY2018 RESULTS
NOT FOR DISTRIBUTION OR RELEASE IN THE UNITED STATES

                                                                            FY2018 key highlights

                                                                                    Financial Performance                                                  Portfolio & Acquisitions                                                     Capital Management

                                                                            14.02 CPS Distributable Earnings 1                                                 $2.5 billion portfolio                                                   36.2% gearing ratio 5
                                                                                                                                                           454 high-quality service stations and                                        Reduces to 32.3% pro-forma for
                                                                                            (up 4.5% from FY2017)
                                                                                                                                                         convenience properties with WACR 5.8%                                            the Institutional Placement 6

                                                                                                                                                                                                                                        Weighted debt facility
                                                                                     NTA $2.20 per security 2                                                   WALE of 12.6 years
                                                                                      (up 3.8% from December 2017)
                                                                                                                                                                                                                                        maturity of 3.8 years
                                                                                                                                                          With 3% per annum fixed rent increases 3
                                                                                                                                                                                                                                Increased from 2.6 years in December 2017

                                                                                                                                                                                                                                   Increased debt facilities,
                                                                            20bps Management Expense Ratio                                                      Well located portfolio
                                                                                        (down from 24bps in FY2017)                                                  7 5 % me t r o p r o p e r t ies 4
                                                                                                                                                                                                                                     lengthened tenor and
                                                                                                                                                                                                                                 diversified sources of capital
                                                                                                                                                                                                                                                $160m of new facilities

                                                                            1 Based on weighted average number of stapled securities on issue during the reporting period
                                                                            2 NTA   reported at 31 December 2018 included a provision for the declared distribution of 7.03 CPS. Reported NTA in prior periods has included distributions accrued to the reporting date
                                                                            3 12 of 454 properties are subject to annual rent increases other than fixed 3% per annum
                                                                            4 By value
                                                                            5 Gearing calculated as total liabilities to total tangible assets measured in accordance with Australian Accounting Standards, but excluding any mark-to-market valuations of derivative

                                                                              assets/liabilities. Increased gearing relative to 30 June FY2018 partly reflects inclusion of a distribution provision (see page 12 for further details)                                         7
                                                                            6 Includes the impact of the $100 million fully underwritten Institutional Placement but does not include any impact attributable to the SPP (see page 30 for further details in relation to the

                                                                              Institutional Placement and the SPP)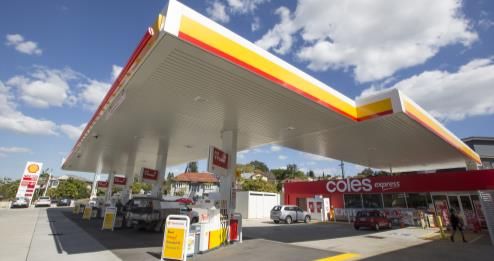
KEY HIGHLIGHTS
                                                       VVR FY2018 RESULTS
NOT FOR DISTRIBUTION OR RELEASE IN THE UNITED STATES

                                                                            Positioning VVR for future growth
                                                                            Equity raising                                                                                            Pipeline restocked
                                                                                •   $100 million fully underwritten Institutional Placement                                            •    VVR has identified a ~$130 million pipeline of potential
                                                                                                                                                                                            acquisitions, $67 million of which are in advanced due
                                                                                     -   Supplemented with a non-underwritten Security
                                                                                                                                                                                            diligence4
                                                                                         Purchase Plan (“SPP”) to eligible securityholders1
                                                                                •   Proceeds will be used to partly finance 8 acquisitions
                                                                                    totalling approximately $47 million2 completed in 2H
                                                                                    FY2018 (in addition to $8 million in committed
                                                                                    expenditure) and to provide headroom for future growth
                                                                                     -   Total FY2018 acquisitions of $129 million2
                                                                                         (6.4% WACR)
                                                                                •   Pro-forma gearing3 of 32.3% as at 31 December 2018
                                                                                     -   Target gearing range revised from 35-45% to
                                                                                         30-45%, consistent with VVR capital management
                                                                                         practice since IPO in 2016

                                                                                                                    Active capital management expected to allow VVR to
                                                                                                                          continue sustainable growth momentum

                                                                            1 Eligible securityholders are holders of existing VVR securities as at 7:00pm (AEDT) on 20 February 2019 with a registered address in Australia or New Zealand. The SPP is subject to a cap
                                                                              of $10 million and is subject to scaleback at VVR’s absolute discretion
                                                                            2 Pre transaction costs. Excludes $8.0 million of committed expenditures (pre transaction costs) in 1H FY2019 in relation to fixed-price development fund-through agreements. See page 18 for
                                                                              further details
                                                                            3 Gearing calculated as total liabilities to total tangible assets measured in accordance with Australian Accounting Standards, but excluding any mark-to-market valuations of derivative

                                                                              assets/liabilities. Increased gearing relative to 30 June FY2018 partly reflects inclusion of a distribution provision (see page 12 for further details). Includes the impact of the $100 million fully
                                                                              underwritten Institutional Placement but does not include any impact attributable to the SPP (see page 30 for further details in relation to the Institutional Placement and SPP)
                                                                                                                                                                                                                                                                                        8
                                                                            4 There can be no assurance that VVR will successfully acquire and integrate further acquisitions (see risk factors described in the “Key Risk Factors” section in Appendix 2)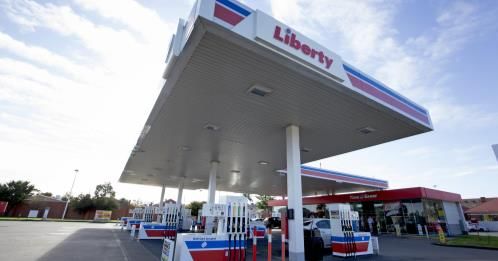
NOT FOR DISTRIBUTION OR RELEASE IN THE UNITED STATES

                                                       Financial Results
                                                       GUY FARRANDS
                                                       Chief Financial Officer VER Manager Pty Limited

                                                               9
FINANCIAL RESULTS
                                                       VVR FY2018 RESULTS
NOT FOR DISTRIBUTION OR RELEASE IN THE UNITED STATES

                                                                            Statutory financial performance
                                                                                                                                        Full year        Full year
                                                                                Statutory Profit and Loss                      31 December 2018 31 December 2017
                                                                                                                                                                          % Change    •   Rental income growth driven by fixed rent
                                                                                                                                                                   FY2018 vs FY2017       escalators and incremental acquisitions
                                                                                                                                       $ million1       $ million1
                                                                                Income
                                                                                                                                                                                      •   MER: 20bps
                                                                                Rental income from investment properties                 136.8             127.9
                                                                                                                                                                                      •   Efficiencies have reduced management
                                                                                Revenue from investment properties –                                                                      and administration expenses, despite
                                                                                                                                          25.9              29.0
                                                                                straight-line lease adjustments
                                                                                                                                                                                          portfolio growth
                                                                                Finance income                                             0.7               0.9
                                                                                                                                                                                      •   Increased finance costs reflect
                                                                                Net revaluation of investment properties2                 43.6              48.2
                                                                                                                                                                                          debt-funded acquisitions and write-off of
                                                                                Total income                                             207.0             206.0             0.5%         capitalised borrowing costs
                                                                                Expenses

                                                                                Management and administration expenses                     5.3               5.5

                                                                                Finance costs                                             34.5              30.0

                                                                                Impact of straight-line lease adjustments on
                                                                                                                                             -                 -
                                                                                fair value of investment properties

                                                                                Total expenses                                            39.8              35.5

                                                                                Statutory net profit before tax                          167.2             170.5            (1.9%)

                                                                                Tax expense                                                0.1                 -

                                                                                Statutory net profit                                     167.1             170.5            (1.9%)

                                                                            1   Totals may not add due to rounding
                                                                            2 Net   of transaction costs
                                                                                                                                                                                                                                      10
FINANCIAL RESULTS
VVR FY2018 RESULTS
NOT FOR DISTRIBUTION OR RELEASE IN THE UNITED STATES
Distributable earnings
Ahead of guidance and up 4.5% on FY2017
Full year Full year
% Change
• Distributable earnings of 14.02 CPS for
Distributable Earnings 31 December 2018 31 December 2017 FY2018, exceeding top end of guidance
1 1 FY2018 vs FY2017
$ million $ million
- FY2018 guidance range was
Statutory net profit 167.1 170.5 13.81 – 13.91 CPS
Add back:
• Distributable earnings per security growth
Amortisation/write off of debt
4.1 1.6
establishment costs of 4.5%
Adjust for:
• Full year distribution of $101.7 million
Straight-line lease adjustments 25.9 29.0
Net revaluation - investment properties2 43.6 48.2 • 100% payout ratio
Distributable Earnings 101.7 95.0
Weighted average number ordinary securities 725.7 708.3
Distributable Earnings per security (CPS) 14.02 13.41 4.5%
1 Totals may not add due to rounding
2 Includes impact of straight lining reversal. Gross increment of $77 million
11FINANCIAL RESULTS
VVR FY2018 RESULTS
NOT FOR DISTRIBUTION OR RELEASE IN THE UNITED STATES
Financial position
Full year Full year • NTA increased by 3.8% to $2.20 per stapled
Balance Sheet 31 December 2018 31 December 2017 security from $2.12, on a like-for-like basis3
$ million1 $ million1
- VVR now includes a provision for the
Assets
distribution on balance sheet (consistent
Cash and cash equivalents 12.3 43.6
with A-REIT peers)
Prepayments and property deposits 1.7 8.2
Fair value of interest rate swaps 0.9 5.4 • Investment properties held increased by 9.4%
Investment properties 2,496.1 2,281.0 from $2,281 million to $2,496 million
Total assets 2,511.0 2,338.1 - Acquisitions settled - $129 million4
Liabilities - FY2017 announced acquisitions and settled
Accounts payable and accruals 8.3 15.7 in FY2018 - $10 million5
Fair value of interest rate swaps 7.7 - - FY2018 Valuation uplift - $77 million6
Distribution payable 51.0 -
Borrowings 852.7 736.7
Deferred borrowing costs (3.4) (3.7)
Total liabilities 916.3 748.7
Net assets 1,594.7 1,589.5
NTA per security $2.20 $2.123
Gearing2 36.2% 34.1%3
1 Totals may not add due to rounding
2 Gearing calculated as total liabilities to total tangible assets measured in accordance with Australian Accounting Standards, but excluding any mark-to-market valuations of derivative assets/liabilities
3 NTA and gearing reported as at 31 December 2017 adjusted for the distribution of 6.60 CPS paid on 15 February 2018 to allow for like for like comparison
4 Excludes $8.0 million of committed expenditures (pre transaction costs) in 1H FY2019 in relation to fixed-price development fund-through agreements. See page 18 for further details
5 Relates to Alderley settling in FY2018
6 $43.6 million after impact of straight lining reversal and write-off of property acquisition costs 12FINANCIAL RESULTS
VVR FY2018 RESULTS
Capital management – FY2018 achievements
NOT FOR DISTRIBUTION OR RELEASE IN THE UNITED STATES
Debt terms improved, tenor lengthened and sources diversified
• Bank Debt Debt Facilities Expiry Profile ($ million): as at 31 December 2018
- Existing $836.6 million syndicated facility: Refinanced with 400
improved terms and margin grid 300 100
- Existing bilateral facility: Renewed and increased to $100 100
200 368
million
268
- New $100 million club facility: Arranged with 3 VVR 100 200
60 40
relationship banks 0 20
FY19 FY20 FY21 FY22 FY23 FY24 FY25 FY26 FY27 FY28
Institutional Term Loans Club Debt (new)
• Non-Bank Debt
Bi-Lateral Bank Debt Syndicated Bank Debt
- Arranged two bilateral institutional term loans totalling $60 (increased and extended)
million with weighted average duration of 8.7 years and
weighted average margin of 2.1%1 Swap Cover and average Swap Rate: as at 21 February 2019
100% 3.0%
• Swaps 80% 2.5%
- 93.4% of debt swapped for weighted average duration of 2.0%
60%
3.9 years and weighted average rate of 2.3% 1.5%
40% 88% 88%
- Post balance date, forward start swaps totalling $368 million 1.0%
47%
(agreed in June 2018) reset to take advantage of improved 20% 35% 0.5%
interest rate environment 0% 7% 7% 7% 2% 2% 0.0%
- Up-front cost of $9.2 million2, resulting in a c.65 bps FY19 FY20 FY21 FY22 FY23 FY24 FY25 FY26 FY27
Swap Cover (%) (LHS) Average Swap Rate (RHS)
improvement in hedged rate 13
1 Weighted by aggregate of the two institutional term loans
2 Treated as a transaction cost for the calculation of Distributable EarningsFINANCIAL RESULTS
VVR FY2018 RESULTS
NOT FOR DISTRIBUTION OR RELEASE IN THE UNITED STATES
Capital management
Active capital management provides opportunity for continued
growth
• Weighted average cost of debt was 3.83% for FY2018 Full year Full year
31 December 31 December
Capital Management
2018 2017
• Interest cover ratio 5.3x for FY20181
$ million $ million
• Drawn-debt was 93.4% hedged for a weighted average 3.8 Facility limit $1,096.7m4 $896.7m
years at 31 December 2018 Drawn debt $852.7m $736.7m
• Pro-forma gearing2
as at 31 December 2018 reduces to Gearing2 (including distribution provision)
36.2%
34.1%
(reported)
32.3% after the fully underwritten Institutional Placement3
% debt fixed 93.4% 100.0%
• Revised gearing policy to better reflect VVR practice:
- Target gearing range revised from 35-45% to 30-45% Weighted average cost of debt5 3.83% 3.85%
- VVR retains significant headroom to make further Weighted debt facility maturity (years) 3.8 2.6
acquisitions, consistent with VVR’s investment criteria Average fixed / hedged debt maturity (years) 3.8 2.6
Interest cover ratio4 5.3x 4.4x
• Distribution Reinvestment Plan implemented for 2H
FY2018 distribution
1 Interest cover ratio calculated as earnings before interest, tax, depreciation and amortisation (excluding any asset revaluations, mark-to-market movements and transaction costs) divided by Net
Interest Expense
2 Gearing calculated as total liabilities to total tangible assets measured in accordance with Australian Accounting Standards, but excluding any mark-to-market valuations of derivative
assets/liabilities
3 Includes the impact of the $100 million fully underwritten Institutional Placement but does not include any impact attributable to the SPP (see page 30 for further details in relation to the
Institutional Placement and the SPP) 14
4 Facility limit as at 31 December 2018 is $956.7m. Facility limit as at 21 February 2019 includes new $100m club facility and extended $40m bilateral facility
5 Weighted average cost of debt including undrawn commitment feesNOT FOR DISTRIBUTION OR RELEASE IN THE UNITED STATES
Acquisitions, Portfolio and Industry Update
MARGARET KENNEDY
Managing Director VER Manager Pty Limited
15VVR FY2018 RESULTS
NOT FOR DISTRIBUTION OR RELEASE IN THE UNITED STATES
ACQUISITIONS, PORTFOLIO AND INDUSTRY UPDATE Acquisition strategy
VVR will continue to consider acquisition and development
opportunities consistent with the following investment criteria:
1. Investment is high quality and strategically located;
2. Portfolio remains geographically diversified;
3. Investment has strong lease characteristics; and
Liberty Woodville SA
4. Investment provides security holders with potential for capital growth
over time.
Shell Coles Express Alderley QLD
16VVR FY2018 RESULTS
NOT FOR DISTRIBUTION OR RELEASE IN THE UNITED STATES
ACQUISITIONS, PORTFOLIO AND INDUSTRY UPDATE FY2018 acquisitions and FY2019 expected pipeline
VVR acquired 16 sites for $129 million1 at a WACR of 6.4%2
• Acquisitions are consistent with VVR’s growth strategy
• The addition of Caltex, 7-Eleven and Liberty Oil3 properties provides additional fuel brands to the portfolio4
• Acquisitions were all double or triple net structures with fixed 3% rent reviews5
• VVR has identified a ~$130 million pipeline of potential acquisitions, $67 million of which are in advanced due diligence6
Caltex Longwarry 7-Eleven Silkstone
1 Pre transaction costs. Excludes $8.0 million of committed expenditures (pre transaction costs) in 1H FY2019 in relation to fixed-price development fund-through agreements. See page 18
for further details
2 Capitalisation rate at acquisition is reported pre transaction costs
3 50% owned by Viva Energy Australia, as disclosed in Viva Energy Australia’s 2018 Half Year Financial Report
4 See page 22 for further details
17
5 Excludes Coomera, Caboolture and Aratula
6 There can be no assurance that VVR will successfully acquire and integrate further acquisitions (see risk factors described in the “Key Risk Factors” section in Appendix 2)VVR FY2018 RESULTS
ACQUISITIONS, PORTFOLIO AND INDUSTRY UPDATE
NOT FOR DISTRIBUTION OR RELEASE IN THE UNITED STATES
Acquisitions settled in FY2018
VVR acquired 16 sites for $129 million1 at a WACR of 6.4%
ACQUISITIONS IN FY2018
Purchase
Property State Region Cap rate (%) Major tenant Rent reveiws Lease Announced
price ($m)1
Maddington WA Metro $9.4 5.9% Viva Energy Australia Fixed 3% Double Net July 2018
Goondiwindi QLD Regional $4.0 7.0% Liberty Oil Fixed 3% Triple Net July 2018
Smithfield Plains SA Metro $4.6 6.3% Liberty Oil Fixed 3% Triple Net July 2018
Woodville South SA Metro $4.6 6.3% Liberty Oil Fixed 3% Triple Net July 2018
Longwarry Eastbound2 VIC Regional $18.0 6.1% Caltex Australia Fixed 3% Double Net July 2018
Longwarry Westbound2 VIC Regional $18.0 6.1% Caltex Australia Fixed 3% Double Net July 2018
Caboolture QLD Metro $3.5 6.7% Viva Energy Australia CPI Double Net July 2018
August 2018
Coomera QLD Metro $20.0 5.8% Viva Energy Australia Fixed 2.75% Double Net
(Settlement)
Silkstone QLD Regional $5.2 6.4% 7-Eleven Fixed 3% Double Net February 2019
(Total $47 million1)
Announced today
Albany WA Regional $3.53 7.0% Liberty Oil Fixed 3% Triple Net February 2019
Miles QLD Regional $5.5 7.0% Liberty Oil Fixed 3% Triple Net February 2019
Old Noarlunga SA Metro $6.5 6.6% Liberty Oil Fixed 3% Triple Net February 2019
Kingaroy QLD Regional $5.0 7.0% Liberty Oil Fixed 3% Triple Net February 2019
Townsville QLD Regional $2.54 7.0% Liberty Oil Fixed 3% Triple Net February 2019
Aratula QLD Regional $14.0 7.0% Viva Energy Australia CPI Double Net February 2019
Roma QLD Regional $4.5 7.0% Liberty Oil Fixed 3% Triple Net February 2019
Total $128.8 6.4%
1 Pre transaction costs. Excludes $8.0 million of committed expenditures (pre transaction costs) in 1H FY2019 in relation to fixed-price development fund-through agreements
2 Longwarry Eastbound and Longwarry Westbound are considered two separate properties
3 Excludes $4.5 million of committed expenditures in 1H FY2019 in relation to a fixed-price development fund-through agreement
4 Excludes $3.5 million of committed expenditures in 1H FY2019 in relation to a fixed-price development fund-through agreement 18VVR FY2018 RESULTS
NOT FOR DISTRIBUTION OR RELEASE IN THE UNITED STATES
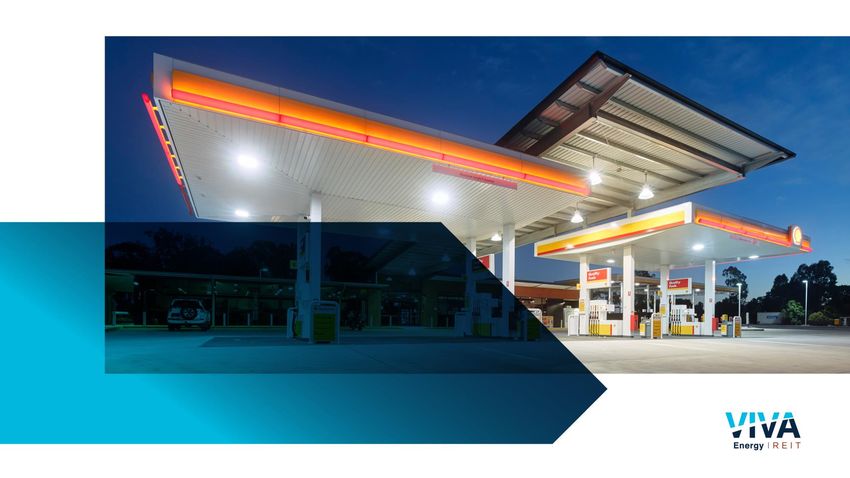
ACQUISITIONS, PORTFOLIO AND INDUSTRY UPDATE Portfolio overview
PORTFOLIO AT 31 DECEMBER 2018
Properties Value ($m) Average1 value ($m) Average1 size (m2) WACR (%) WALE (years)
Metropolitan 316 1,863 5.9 3,683 5.5 13.0
Regional 138 633 4.6 6,842 6.8 11.7
Total 454 2,496 5.5 4,643 5.8 12.6
• 2.11 million m2 of property geographically diversified and aligned with the
Australian population density
• 81% of properties by value located in Australia’s more populous Eastern
seaboard states
• 75% of properties by value located in metropolitan areas
• 82% of VIC property value located within the metropolitan region Shell Maddington WA
• 71% of NSW property value located within the metropolitan region
1 Calculated as the arithmetic average 19VVR FY2018 RESULTS
NOT FOR DISTRIBUTION OR RELEASE IN THE UNITED STATES
ACQUISITIONS, PORTFOLIO AND INDUSTRY UPDATE Portfolio lease profile
As at 31 December 2018
• 100% occupancy
• 3% per annum fixed rental increases1
• Majority of market rent reviews not until 20262 (IPO Portfolio)
• Current WALE of 12.6 years
Portfolio Lease Expiry Profile - Service Stations only3
25%
20%
% of income
15%
10%
5%
0%
FY19 FY20 FY21 FY22 FY23 FY24 FY25 FY26 FY27 FY28 FY29 FY30 FY31 FY32 FY33 FY34
Year of lease expiry
1 12 of 454 properties in the portfolio are subject to annual rent increases other than fixed 3% per annum
2 6 of 454 properties have reviews prior to FY26: FY20 (Rouse Hill) and FY21 (Half Way Creek, Blaxland, Caboolture, Silkstone and Townsville) 20
3 WALE is calculated from service station properties only and excludes retail lease agreements between VVR and the tenants on some properties (~$1.1m p.a.)VVR FY2018 RESULTS
NOT FOR DISTRIBUTION OR RELEASE IN THE UNITED STATES
ACQUISITIONS, PORTFOLIO AND INDUSTRY UPDATE Property revaluations
Revaluations supported by contracted rental growth
Valuation Policy
WACR by State (%): as at 31 December 2018
• Fair value of the individual properties are reviewed by the Board at each
NT reporting date
• Rolling one third of the portfolio is independently valued each year with
each individual property valued at least once every three years
Northern QLD
6.5%
7.0%
Gross increase WACR
Southern QLD
5.9%
$m %
WA 6.6%
150 properties independently valued by Jones Lang LaSalle
5.6% NSW
6.6%
Metro $28 +4.8% 5.4%
6.3% ACT
SA Regional $6 +3.2% 6.8%
5.4%
VIC
Sub-total $34 +4.5% 5.7%
6.3% TAS
275 properties valued by VVR
$43 +3.0% 5.8%
Note: QLD is separated north and south. ACT is separate from NSW directors1
Total Portfolio $77 +3.5% 5.8%
1 Excludes acquisitions completed after 30 June 2017 21VVR FY2018 RESULTS
NOT FOR DISTRIBUTION OR RELEASE IN THE UNITED STATES
ACQUISITIONS, PORTFOLIO AND INDUSTRY UPDATE Portfolio tenants
VVR has continued to add to its brand mix
• VVR’s portfolio is supported by strong and stable tenants, Tenant Income2 FY20163 FY2017 FY2018
including key tenant, Viva Energy Australia, a leading company
in fuel manufacturing, supply and marketing in Australia Viva Energy Australia 100% 99% 95%*
Liberty Oil1 - ~1%* 2%*
• Viva Energy Australia was the sole VVR tenant at IPO in 2016
Caltex - - 2%*
• The addition of Caltex, 7-Eleven and Liberty Oil1 properties
provides additional fuel brands to the portfolio 7-Eleven - -VVR FY2018 RESULTS
NOT FOR DISTRIBUTION OR RELEASE IN THE UNITED STATES
ACQUISITIONS, PORTFOLIO AND INDUSTRY UPDATE Retail fuel & convenience property sales
Transaction yields continue to remain attractive
Legend:
VVR Portfolio Cap Rate 5 Year Swap Curve
• VVR portfolio cap rate remains in-
8.0% Reported Wtd Ave Transaction Yield 10 Year Gov. Bond
(JLL Market Report 31 December 2018)1 line with the weighted average
7.0%
transaction yield
6.0% • Both the market transaction yield
and VVR portfolio cap rate have
5.0% traded at a ~3% premium to the
Initial Yield
10 year government bond rate
4.0%
over the last two years
3.0%
2.0%
1.0%
0.0%
Jan-14
Apr-14
Jan-15
Jan-16
Jan-17
Jan-18
Oct-14
Apr-15
Oct-15
Apr-16
Oct-16
Apr-17
Oct-17
Apr-18
Oct-18
Jul-14
Jul-15
Jul-16
Jul-17
Jul-18
Source: Bloomberg and Jones Lang LaSalle Advisory Services Pty Limited (JLL) Market Report 31 December 2018 for VER Manager Pty Ltd as Manager of Viva Energy REIT.
Yields are net initial yields based upon net passing income at the time of sale and are based on a sample of service station sales through metropolitan and regional Australia during 2016,
2017 and 2018. This sales data is intended to provide an indication only. JLL are not representing that every sale within the Sector has been captured within the sample. JLL accepts no
liability for any inaccuracies contained in the information that has been sourced from a variety of industry sources, or for conclusions which are drawn either wholly or partially from that 23
information. No responsibility is accepted to any third parties.
1 Reported weighted average transaction yield includes sales data provided by JLL onlyVVR FY2018 RESULTS
NOT FOR DISTRIBUTION OR RELEASE IN THE UNITED STATES
ACQUISITIONS, PORTFOLIO AND INDUSTRY UPDATE Convenience retail market trends
Convenience retailing has become an integral component of the
service station industry
• Structural changes over the past decade have enhanced the
attractiveness of service stations
• Customer needs continue to be met with the evolution of fuel Viva Energy Australia – Coles Express Alliance
retailing and wider service station offerings
• On 6 February 2019, Viva Energy Australia
• The opportunity from profit margins of the convenience offering announced the extension of a retail alliance with
continues to grow, and VVR’s portfolio and tenants are well Coles Express to 2029 under new arrangements to
positioned to take advantage of that trend support future growth and cement the network as
Australia’s leading fuel and convenience business2
• Modern service stations are now characterised by expanded
format convenience stores, quasi-supermarkets, fast food • VVR welcomes the announcement, which confirms
outlets, coffee shops and automated car washes both parties’ commitment to the Alliance, provides
greater alignment to capture future growth
- In 2017 the convenience sales (excluding fuel) market has
opportunities, and supports significant reinvestment2
grown to $8.4bn1
1 Australasian Association of Convenience Stores (AACS): 2017 State of the Industry Report
2 As disclosed in Viva Energy Australia’s ASX announcement dated 6 February 2019
24NOT FOR DISTRIBUTION OR RELEASE IN THE UNITED STATES
Strategy & Outlook
MARGARET KENNEDY
Managing Director VER Manager Pty Limited
25STRATEGY & OUTLOOK
VVR FY2018 RESULTS
NOT FOR DISTRIBUTION OR RELEASE IN THE UNITED STATES
Competitive strengths
Market-leading national service station and convenience retail
distribution platform
• Irreplicable high-quality, strategically located service station and convenience retail
distribution platform
• National distribution platform aligned with population density
• 100% occupancy, predominantly long-term Triple Net leases to high-quality tenants 1
• 3% per annum rent increases and ongoing growth through acquisition and
development opportunities 2
• Portfolio underpinned by 2.11 million m 2 of quality real estate
• Pursuing value enhancing site optimisations with key tenant Viva Energy Australia
1 16 of 454 properties in the portfolio have Double Net leases in place
2 12 of 454 properties in the portfolio are subject to annual rent increases other than fixed 3% per annum
26STRATEGY & OUTLOOK
VVR FY2018 RESULTS
NOT FOR DISTRIBUTION OR RELEASE IN THE UNITED STATES
Strategy and outlook
FY2019 Distributable Earnings per security growth guidance range of
3-3.75%1,2 from FY2018
• Optimise core business and maintain low management expense ratio
• Continue to pursue further acquisition opportunities consistent with our strategy
and investment criteria
• Manage our balance sheet to maintain diversified funding sources with pro -forma
gearing to 32.3% 1 at this point in the cycle
• FY2019 Distributable Earnings per security growth guidance range of 3-3.75% from
FY2018 1,2
• Target payout ratio 100% of Distributable Earnings
1 Includes the impact of the $100 million fully underwritten Institutional Placement but does not include any impact attributable to the SPP (see page 30 for further details in relation to the Institutional
Placement and the SPP)
2 Provided there are no material changes in market conditions and no other factors adversely affecting VVR 27NOT FOR DISTRIBUTION OR RELEASE IN THE UNITED STATES
28
QuestionsNOT FOR DISTRIBUTION OR RELEASE IN THE UNITED STATES
Equity Raising
MARGARET KENNEDY
Managing Director VER Manager Pty Limited
29EQUITY RAISING
VVR FY2018 RESULTS
NOT FOR DISTRIBUTION OR RELEASE IN THE UNITED STATES
Equity Raising overview
• Fully underwritten Institutional Placement to raise $100 million
• Institutional Placement issue price of $2.32 per New Security
Institutional
Placement offer − A discount of 4.1% to the last closing price of $2.42 on 20 February 2019
structure and price − A discount of 3.5% to the 5-day VWAP of $2.40 to 20 February 2019
− Represents a FY2019 distributable earnings yield of 6.2-6.3%1
• Proceeds will be used to partly finance 8 acquisitions totalling approximately $47 million2 completed in 2H FY2018
Use of proceeds (in addition to the $8 million in committed expenditure) and to provide headroom for future growth
• Balance sheet refreshed with capacity to pursue further acquisitions, consistent with VVR investment criteria, as
opportunities arise
Financial outcomes
• Pro-forma gearing of 32.3%1
• FY2019 Distributable Earnings per security growth guidance range of 3-3.75% from FY20181,3
• New Securities issued under the Institutional Placement and the SPP will rank pari passu with existing securities
from issue
• New securities issued under the Institutional Placement and SPP will be entitled to any distribution for the six
Ranking months ending 30 June 2019, however, they will not be entitled to the distribution for the 6 months ended 31
December 2018, to be paid on 28 February 2019.
1 Includes the impact of the $100 million fully underwritten Institutional Placement but does not include any impact attributable to the SPP
2 Pre transaction costs. Excludes $8.0 million of committed expenditures (pre transaction costs) in 1H FY2019 in relation to fixed-price development fund-through agreements. See
page 18 for further details 30
3 Provided there are no material changes in market conditions and no other factors adversely affecting VVREQUITY RAISING
VVR FY2018 RESULTS
NOT FOR DISTRIBUTION OR RELEASE IN THE UNITED STATES
Equity Raising overview (continued)
• Following the completion of the Institutional Placement, VVR will offer eligible securityholders 1 the opportunity to
participate in a non-underwritten SPP to raise up to $10 million
− Eligible securityholders in Australia and New Zealand will be invited to subscribe for up to $15,000 of additional
Security Purchase
Plan (“SPP”) New Securities2 per securityholder, free of transaction and brokerage costs
• The offer price under the SPP will be $2.32 per new security, being the issue price under the Institutional Placement
• Further information in relation to the SPP will be dispatched to eligible securityholders on or around 5 March 2019
Viva Energy • Viva Energy Australia continues to view its investment in VVR as strategically significant, however is not entitled to
Australia participate in the Institutional Placement under ASX Listing Rules
participation
Sources and uses 3
Sources $ million Uses $ million
Recent acquisitions (together with
Institutional Placement proceeds 100
committed expenditure) and balance 98
sheet headroom for future growth
Equity raising costs 2
Total 100
Total 100
1 Eligiblesecurityholders are holders of existing VVR securities as at 7:00pm (AEDT) on 20 February 2019 with a registered address in Australia or New Zealand
2 If
total demand exceeds $10 million, VVR reserves the right to scale back the maximum number of New Securities issued to each eligible securityholder at its absolute discretion
3 Excludes any impact of the SPP, which could raise up to $10 million 31EQUITY RAISING
VVR FY2018 RESULTS
NOT FOR DISTRIBUTION OR RELEASE IN THE UNITED STATES
Timetable
Event Date
Trading halt and announcement of Equity Raising Thursday, 21 February 2019
Institutional Placement
Institutional Placement bookbuild Thursday, 21 February 2019
Announcement of outcome of Institutional Placement Friday, 22 February 2019
Trading halt lifted Friday, 22 February 2019
Settlement of New Securities under the Institutional Placement Tuesday, 26 February 2019
Allotment and trading of New Securities issued under the Institutional Placement Wednesday, 27 February 2019
SPP
Record date for SPP Wednesday, 20 February 2019 (7:00pm AEDT)
SPP offer period Tuesday, 5 March 2019 — Tuesday, 19 March 2019
Allotment of New Securities issued under the SPP Tuesday, 26 March 2019
New Securities issued under the SPP commence trading on ASX Wednesday, 27 March 2019
Holding statement dispatch date Thursday, 28 March 2019
Note: The above timetable is indicative only and subject to change. Subject to the requirements of the Corporations Act, the ASX Listing Rules and any other applicable laws, VVR, in
consultation with the underwriters, reserves the right to amend this timetable and withdraw the offer at any time 32EQUITY RAISING
VVR FY2018 RESULTS
NOT FOR DISTRIBUTION OR RELEASE IN THE UNITED STATES
Pro-forma balance sheet
The pro forma balance sheet has been derived from VVR’s financial statements for the financial year
ended 31 December 2018, adjusted for the effects of the pro forma adjustments described below
Actual Institutional Placement Pro-forma
31 December 2018 Pro forma adjustments (net of costs) 31 December 2018
$ million1 $ million1 $ million1
Cash 12 - 12
Prepayments and property deposits 2 - 2
Fair value of interest rate swaps 1 - 1
Investment properties 2,496 - 2,496
Total Assets 2,511 - 2,511
Accounts payable and accruals 8 - 8
Fair value of interest rate swaps 8 - 8
Distribution payable 51 - 51
Borrowings 853 (98) 754
Deferred borrowing costs (3) - (3)
Total Liabilities 916 (98) 818
Net Assets 1,595 98 1,693
NTA per security $2.20 $2.20
Gearing2 36.2% 32.3%
Number of securities 725.7 43.1 768.9
1 Totals
may not add due to rounding
2 Gearing calculated as total liabilities to total tangible assets measured in accordance with Australian Accounting Standards, but excluding any mark-to-market valuations of derivative
assets/liabilities 33NOT FOR DISTRIBUTION OR RELEASE IN THE UNITED STATES
34
QuestionsNOT FOR DISTRIBUTION OR RELEASE IN THE UNITED STATES
35
GlossaryGLOSSARY
VVR FY2018 RESULTS
NOT FOR DISTRIBUTION OR RELEASE IN THE UNITED STATES
Glossary
The contractual alliance between Viva Energy Australia and Coles Express (and their associated entities) including the
Alliance Alliance Agreement and Site Agreements as outlined in the PDS and as amended in February 2019 (as announced to ASX
by Viva Energy Australia on 6 February 2019)
AEDT Australian Eastern Daylight Savings Time
CAGR Compound average growth rate
Cap Rate Capitalisation rate
CPS Cents per security
This is a non-IFRS measure being net statutory profit adjusted to remove transaction costs and non-cash items, including
Distributable Earnings straight-lining of rental income, amortisation of debt and establishment fees and any fair value adjustments to investment
properties or derivatives
Distributable Earnings Calculated as Distributable Earnings divided by the weighted average number of ordinary securities on issue during the
Per Security period
Agreement where the tenant is responsible for all outgoings except fair wear and tear, capital expenditure, the difference
Double Net lease
between single and multiple land tax and, in some cases, the landlord’s property management fees (if any)
The equity raising undertaken by VVR as described in this presentation comprising an institutional placement of New
Equity Raising
Securities and an offer of New Securities under a Security Purchase Plan (SPP)
Forecast The financial forecasts contained in Viva Energy REIT PDS and subsequent ASX Announcements
FY Viva Energy REIT financial year, being year end 31 December
Total liabilities to total tangible assets measured in accordance with Australian Accounting Standards, but excluding any
Gearing
mark-to-market valuations of derivative assets/liabilities
Initial Listing Viva Energy REIT initial listing date on the Australian Securities Exchange being 3 August 2016
36GLOSSARY
VVR FY2018 RESULTS
NOT FOR DISTRIBUTION OR RELEASE IN THE UNITED STATES
Glossary
Interest Coverage Earnings before interest, tax, depreciation and amortisation (excluding any asset revaluations, mark-to-market
Ratio or ICR movements and transaction costs) divided by net interest expense
IPO Initial Public Offering
Liberty Oil Liberty Oil Holdings Pty Limited (ABN 67 068 080 124)
Management Expense
Management and corporate expenses as a percentage of Viva Energy REIT’s total assets
Ratio or MER
Properties that are located within the Urban Boundary, which is sourced from the Australian Bureau of Statistics
Metropolitan region
(ABS 2016 Significant Urban Area (SUA) boundary)
Net Interest Expense Finance costs less finance income
NTA Net tangible assets
PDS Viva Energy REIT’s Replacement Prospectus and Product Disclosure Statement dated 22 July 2016
Regional All other properties not located within the Urban Boundary
Agreement where the tenant is responsible for all outgoings. In the case of Viva Energy REIT’s leases to Viva Energy
Triple Net lease
Australia, the landlord’s property management fees (if any) are not paid by the tenant
Viva Energy Australia Viva Energy Australia Pty Ltd (ABN 46 004 610 459) (a wholly owned subsidiary of Viva Energy Group Limited)
Viva Energy REIT Viva Energy REIT is a stapled entity comprising one share in Viva Energy REIT Limited (ABN 35 612 986 517)
or VVR and one unit in the Viva Energy REIT Trust (ARSN 613 146 464)
WACR Weighted average capitalisation rate, weighted by contract price excluding transaction costs
WALE Weighted average lease expiry, weighted by rental income
37NOT FOR DISTRIBUTION OR RELEASE IN THE UNITED STATES
38
Appendix 1APPENDIX
VVR FY2018 RESULTS
NOT FOR DISTRIBUTION OR RELEASE IN THE UNITED STATES
Viva Energy Australia snapshot
A leading integrated downstream petroleum company in Australia
24%1 of the Australian downstream petroleum market
1,215 service station sites nationwide in Viva Energy’s network
44 fuel import terminals and depots2 nationally to support operations
52 Airports and airfields across Australia supplied by Viva Energy
120 kbbls/d capacity oil refinery in Geelong, Australia
110+ years proudly operating in Australia
Sole right to use the Shell brand in Australia for the sale of retail fuels3
Retail Alliance with Coles – extended to 20294
Strategic relationship with Vitol companies
38%5 holding in ASX listed Viva Energy REIT – c.$668 million6
Source: Viva Energy Australia analyst management presentation dated 22 November 2018
1 Market share data is based on total Australian market fuel volumes of 59.6 billion litres, as per Australia Petroleum Statistics in 2017, and in respect of Viva Energy, is based on total fuel volumes of
14.2 billion litres in the 2017 calendar year.
2 Includes 23 import terminals and 21 active depots (including 16 Liberty Oil depots), Viva Energy holds a 50% interest in the Liberty business and supplies it with fuel
3 Viva Energy has been granted that right by an affiliate of Royal Dutch Shell and Viva Energy has in turn granted a sub-licence to Coles Express and to certain other operators of Retail Sites
4 Viva Energy and Coles Express extended the Alliance to 2029 as per Viva Energy Australia and Coles Group announcements dated 6 February 2019
39
5 Pre impact of the Equity Raising
6 Based on ASX market price of $2.42 per security as at 20 February 2019APPENDIX
VVR FY2018 RESULTS
NOT FOR DISTRIBUTION OR RELEASE IN THE UNITED STATES
Retail fuel & convenience property sales
A highly liquid market
Legend:
10.0% VVR Portfolio
2016 sales • Sales continue to remain stable
2017 sales
9.0% • Market is highly liquid with tight
2018 sales yields being achieved
8.0%
• Demand remains high for
attractive properties that have
7.0%
quality tenants and lease
Initial Yield
covenants
6.0% VVR Portfolio (IPO)
5.0%
4.0%
3.0%
2.0%
0 5 10 15 20
Remaining Lease Term (years) at Time of Sale
Source: Jones Lang LaSalle Advisory Services Pty Limited (JLL) Market Report 31 December 2018 for VER Manager Pty Ltd as Manager of Viva Energy REIT. Yields are net initial yields
based upon net passing income at the time of sale and are based on a sample of service station sales through metropolitan and regional Australia during 2016, 2017 and 2018. This sales
data is intended to provide an indication only. JLL are not representing that every sale within the Sector has been captured within the sample. JLL accepts no liability for any inaccuracies 40
contained in the information that has been sourced from a variety of industry sources, or for conclusions which are drawn either wholly or partially from that information. No responsibility is
accepted to any third parties.APPENDIX
VVR FY2018 RESULTS
NOT FOR DISTRIBUTION OR RELEASE IN THE UNITED STATES
Australian fuel industry landscape
• Vehicle ownership in Australia has experienced a +2.2% CAGR from 2013 to 20181
• Composition of fuel demand is expected to change over time due to population growth, improved vehicle efficiency, changes in
mobility choices and new fuel technologies
• Increased vehicle ownership in Australia has offset fuel efficiency and the impact of Electric Vehicles, which represent less than
0.1% of total vehicles on road2
• Australian growth in EV uptake trails behind global leaders2
• Some barriers impacting the uptake rate in Australia include2:
- Battery technology and range anxiety;
- Model type availability;
- Lack of second hand market and upfront purchase price;
- Charging infrastructure challenges; and
- New technology to develop induction charging
1 Calculated on the basis of Estimated Motor Vehicles on Register of 17,180,596 as at January 2012 and 19,173,279 as at January 2018 according to ABS Motor Vehicle Census (9309.0)
41
2 ClimateWorks Australia, “The state of electric vehicles in Australia”, June 2018. Note that Tesla numbers are estimated and included in this figureYou can also read