Online course Wind power - planning and measurement - RENAC
←
→
Page content transcription
If your browser does not render page correctly, please read the page content below

Online course
Wind power – planning and measurement

© Renewables Academy (RENAC) AG

This copyrighted course is part of the series of online study programmes offered by the Renewables
Academy AG. The course materials are provided exclusively for personal or curriculum and course-
related purposes to enrolled students and registered users only. Any further use of this material shall
require the explicit consent of the copyright and intellectual property rights holders, Renewables
Academy AG. This material or parts of it may neither be reproduced nor in any way used or disclosed or
passed on to third parties. Any unauthorised use or violation will be subject to private law and will be
prosecuted.

Berlin, 2020-03-03
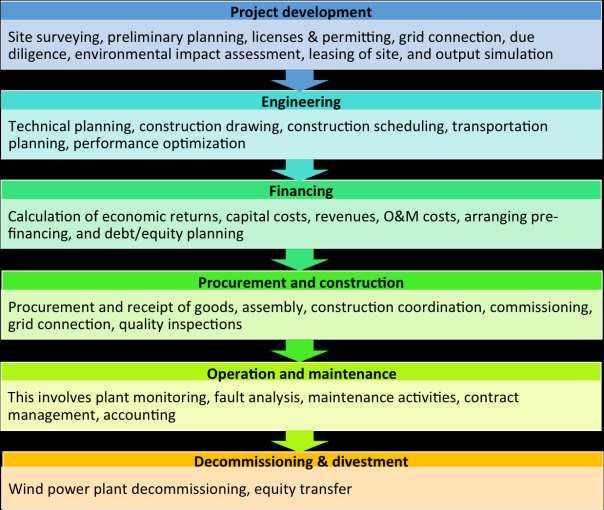
Table of Contents

1 Introduction ........................................................................................................................ 2
 1.1 Learning objectives of the course ............................................................................... 2
 1.2 Introduction to the course .......................................................................................... 2
2 Wind farm planning and design .......................................................................................... 3
 2.1 Introductory comments............................................................................................... 3
 2.2 Planning steps overview .............................................................................................. 4
 2.3 Feasibility study ........................................................................................................... 7
 2.4 Energy yield calculation ............................................................................................. 10
 2.5 Correlation and prediction ........................................................................................ 13
 2.6 Formal uncertainty analysis....................................................................................... 14
 2.6.1 Types of Uncertainties ....................................................................................... 14
 2.6.2 Assessing Risk ..................................................................................................... 16
 2.6.3 Uncertainty and Energy Production Calculation ................................................ 17
 2.7 Logistics, installation and commissioning ................................................................. 19
3 Wind measurement .......................................................................................................... 23
 3.1 General ...................................................................................................................... 23
 3.2 Equipment ................................................................................................................. 24
 3.3 Light Detection and Ranging (LIDAR) and Sonic Detection and Ranging (SODAR) ... 26
 3.4 The Weibull equation ................................................................................................ 27
4 Software ............................................................................................................................ 29
5 Summary ........................................................................................................................... 30
6 Further reading ................................................................................................................. 31
7 Annex: Specifications of software for use in wind projects ............................................. 32

 Page 1 of 39
 03/03/2020
1 Introduction

1.1 Learning objectives of the course

 • identify fundamental wind farm planning and construction steps,
 • estimate the duration of the wind farm planning steps,
 • identify software for different purposes around wind power generation.
 • state the purpose of measured wind data and explain why it is important to measure the wind
 resource at the project site.

1.2 Introduction to the course

This course on wind power planning and wind measurement will focus on wind power project
development, and on the calculation of wind power.

Chapter 2 provides an overview of the main activities in the planning and design of a wind farm,
starting with project development activities, and continuing with financing, engineering, procurement,
construction, operation and maintenance, and finally ending with the decommissioning or repowering
of the wind farm.

Following this, Chapter 3 covers wind measurement, and describes the equipment used to perform a
measurement campaign, along with the measurement methods of LIDAR and SODAR. The Weibull
equation is explained in detail to enable an understanding of how the wind speed distribution of a
specific site is measured and used.

Chapter 4 focuses on the application and main features of a number of software packages that have
been developed to provide for different needs around wind power generation.

 Page 2 of 39
 03/03/2020
2 Wind farm planning and design

2.1 Introductory comments

Generally, the planning and design phase of a wind energy project can be divided into three steps:
initial investigations, site analysis, and actual planning process.

During the initial investigations, the basic feasibility of the proposed project site is assessed. This entails
an estimation of wind conditions and potential energy yield, proposals for possible wind farm layouts,
and examination of the relevant local infrastructure, including the proximity to grid connection, the
quality of local roads, etc.

Reliable estimates of the expected wind resource and the energy output of each wind turbine are
necessary in order to determine the economic viability of a wind farm. But besides resource specific
factors, a number of environmental factors also influence wind farm layout. In particular, the number
and size of turbines in a wind farm may be constrained because of the proximity of the site to human
settlements, which can be impacted by noise emissions, shadow flicker, or visual impact. Non-human
impacts may also impact the prospects, especially where endangered or migrating species may be
affected.

 German wind farm (Source: © Tiedemann, RENAC)

 Page 3 of 39
 03/03/2020
2.2 Planning steps overview

Learning objectives: After completing the following page, you should be able to

 • identify the key wind farm planning and construction steps, and
 • estimate the duration of the wind farm planning steps.

The development of a wind project involves a number of variables in a complex set of relationships.
The following graph gives an overview of key factors and questions that need to be taken into account
in a typical wind farm project planning process.

 Page 4 of 39
 03/03/2020
Wind power project development key aspects (Source: Vestas, 2012, adapted by RENAC)

There are a number of specialised software tools that can help in analysing these interrelations, which
is especially important in considering the optimisation of production for a project. Professional
software packages, including WAsP, WindPro, WindFarmer, WindSim, OpenWind and HOMER, can be
used to calculate expected energy yields. But often the developer’s experience is even more important
in ensuring efficiencies to help optimise the performance of a wind farm.

The following table shows benchmark data regarding the time needed to plan and build a wind farm.
The duration of each step can depend on several factors, many of which can be only partly controlled
by the project developer.

 Step Duration

 Site identification (low conflict areas) c. 3 to 6 months*

 Pre-project planning (including wind resource assessment and > 1 + x years*
 economics)

 Permission and grid connection agreement c. ½ year to x**

 Detailed project planning c. ½ year

 Finance agreements and contracts (equity and depth)

 Production/delivery time and transport of turbines, transformer, etc. c. ½ year + x***

 Page 5 of 39
 03/03/2020
Construction and commissioning Some weeks to months +
 x****

 Operation 20 + x years

 Dismantling Some months + x****

Average benchmark data for the duration of wind farm planning steps
(*duration depends on the quality of the wind resource data that are already available; **duration
depends on complexity of the environmental impact assessment and negotiation with grid operators;
***duration depends on market situation; ****duration depends on size and complexity of the project
as well as number of teams working in parallel).

A detailed checklist for wind farm planning is available for download in the “further reading” section
of this course. It indicates all the following aspects that may need to be taken into account, though
these may vary somewhat from project to project and even more from country to country: system
engineering, yield assessment, planning, construction and permits, site securing, plant operation,
financing conditions, legal aspects and insurances, and regulatory framework, all need to be
considered in pretty much any wind power project.

The figure here details many of the steps and related activities in the course of a wind power project.

 Main steps of a wind power project (Source:RENAC )

 Page 6 of 39
 03/03/2020
2.3 Feasibility study
Learning objectives: After completing the following page, you should be able to

 • identify the key steps in developing a feasibility study.
The feasibility study analyses the likelihood of a successful wind power project (WPP) at a specific site.
After each step in the process, a developer has to decide whether to continue or to terminate the
planning process. The order in which the steps are undertaken should be flexible in response to the
information available, in order to minimise costs and delays.

During the feasibility study the developer produces an initial project design, which facilitates discussion
with the various stakeholders: the public, local politicians and administrators, landowners, investors,
the grid operator, and suppliers. Here, the developer’s art consists of weighing the various interests.1
In general, the following questions arise:2

 1. Existing interests: Are military or air traffic installations, or nature protection zones
 nearby?
 2. Land use: Are ground conditions feasible? Is the owner willing to lease or sell the land at
 a reasonable price?
 3. Grid connection: Is the capacity of the grid sufficient to connect a WPP at a reasonable
 distance and cost?
 4. Environmental constraints: What impacts does the WPP have on neighbours or the
 environment? Can these be overcome or mitigated?
 5. Public opinion: Is local public opinion favourable, or strongly opposed?
 6. Permissions: Is the chance to obtain permissions reasonably good?
 7. Financial calculations: Are investors interested and prepared to finance the feasibility
 study and planning process, as well as the subsequent development? What is the price
 range of available wind turbines? What other costs need to be considered?
 1. Existing interests. Existing or opposing interests may be enough to scuttle a promising project.
If the project interferes with other users or interests, in some cases permission will simply not be
granted. For example, regulations around airports and air traffic routes and any related limits must be
checked using public maps or in cooperation with local authorities. The regulations might limit turbine
height or require special security measures, or restrict certain areas altogether. Military installations,
on the other hand, are often secret. Thus, a specific request to military authorities should be made at
a very early stage of the project planning. Another opposing interest may be nature protection zones
or protected habitats for animals, especially for birds. Such information is normally included in public
maps, and it is often best to avoid such areas where possible.
 2. Land use. Most of the time, land for a WPP is leased from the owner for a certain period (20
to over 100 years). The developer will usually seek to enter a preliminary contract with the landowner
in order to reserve the site while they run the feasibility study; a conditional long term contract option
is usually attached, which will become operative should the site and other factors prove viable.

1 (Hau, 2008)
2 (Wizelius, 2007)

 Page 7 of 39
 03/03/2020
Two options for landlord remuneration exist; a fixed price payable at the beginning of the project,
and/or an annual remuneration. The latter is more common. In total the cost for land use is usually
about 3% of the total lifetime project cost.3
It is important to think about every stakeholder. If cables or roads are going to run over (or under)
neighbouring lands, these landowners also need to be involved in the development process. Their
refusal at a later stage risks terminating the project, or increasing costs dramatically. Depending on the
legal regulations, the air above the land may be the property of landowners, too. Thus if even the tip
of a rotor blade might penetrate the property of a neighbouring landowner, a contract will need to be
executed with that party as well.
It is important to ensure that the ground can support wind turbines even at extreme wind speeds. If a
terrain is complex – e.g. hard rock, perhaps mixed with very wet or boggy ground – the engineering
task becomes more difficult and the costs for the foundations increase. Specialists surveyors can be
hired to furnish an opinion on the ground conditions, which is generally necessary for obtaining
permissions and financing.

 3. Grid connection. For grid-connected wind projects, the capacity and characteristics of the grid,
as well as the distance to the point of coupling, will be critical to the project’s success. The electricity
grid interconnects vast areas with many generators and millions of users. The electricity grid can be
divided into several sub-grids, according to the voltage range at which different segments operate: a
typical subdivision is between the national (usually international) transmission grid, which operates at
230-750 kV; the regional grid (70-130 kV); the local distribution grid (10-40 kV); and the low voltage
consumer grid (230-1000 V).
In contrast to conventional power plants, single wind turbines are generally connected to the
distribution grid; only larger wind parks are connected to the transmission grid.4 During the feasibility
study the developer will need to consider the available voltage level and other grid characteristics. This
information can be obtained directly from the grid operator. Close cooperation with the grid operator
and care in taking grid codes into account is important in avoiding problems later.
 4. Environmental constraints. Any WPP will generate noise and a moving shadow (flicker), and
visually impact the landscape. These effects often impact nearby neighbours, and to avoid conflicts, a
wind turbine will typically have to be located at some minimal distance to the nearest dwelling;
distances of 500-1000 m are commonly required. For large wind turbines or wind parks this distance
often increases to around 1-1.5 km to the nearest dwelling. Shorter distances are appropriate for
smaller wind turbines, as the impacts tend to shrink with turbine size and number.
Maximum permitted noise levels differ between jurisdictions. Wind turbines also have noise regulation
functions – these reduce the power output but also the noise output of a turbine and might therefore
be beneficial, or even necessary. During the feasibility study different scenarios are used to analyse
the likelihood of a direct shadow impact. In a worst-case scenario, the sun always shines (sunrise-
sunset) and the wind always blows from the direction of maximal shadow (maximal noise). In practice,
the cloud cover and different wind direction reduces the impact of the worst-case scenario to around
30% of the maximum. If the worst-case scenario indicates problems, a detailed analysis including
weather data, the frequency distribution and the wind rose needs to be considered.

3 (EWEA, 2009)
4 (Wizelius, 2007)

 Page 8 of 39
 03/03/2020
5. Public opinion. In general, public opinion around wind energy is very positive,5 but on the local
level this might not be the case; “not in my backyard” is a term commonly used to describe the attitude
behind local resistance. From the first stage onwards the public needs to be informed, and sufficient
information should be available to the local community. Even small opposition groups can become
very vocal and prolong the planning process, thus increasing costs; whereas local support can help not
only in planning and permitting but also during the operation phase, for example to report faults.
Providing a photomontage to show the visual impact, and holding local information meetings, may
increase acceptance. If the local population can benefit financially from the WPP, acceptance will tend
to be even higher.
 6. Permissions. The likelihood of obtaining permission will be affected by all of the above-
mentioned factors. Political support for wind energy and spatial plans increases the likelihood of a WPP
being able to proceed, but support at one level of government (e.g. national) may not ensure
permission at another level (state or local). A developer needs to be familiar with all the rules and
regulations in place, as additional issues may also arise, which may fall under another governmental
department (for example, endangered species or wetlands restrictions). The developer should seek to
communicate with all relevant authorities before and during the feasibility study, to get a feel for the
preferences and interpretations of the authorities.
 7. Financial calculations. At this stage a detailed financial calculation is not yet possible. Publicly
available wind data (such as wind atlas data) should be used to estimate the annual energy production
likely in the area. The accuracy in this stage is not very high, and results could have up to ±25%
deviation. As the project progresses and more data is acquired, the cost estimations will become more
accurate as well, as indicated in the graph shown here. These estimations are very important in
attracting investors, and are thus essential at all stages, even where accuracy is limited. These early
calculations need also to include the costs for the feasibility study itself, including the cost for a wind
assessment study. Final decisions on financing and building usually await detailed economic analysis
using sometimes two years or more of locally obtained wind data, as well as detailed materials and
construction related costs.

Accuracy of cost estimates during the project development (Source: Natural Resources Canada, 2015)

5 Ibid: 191 et seq

 Page 9 of 39
 03/03/2020
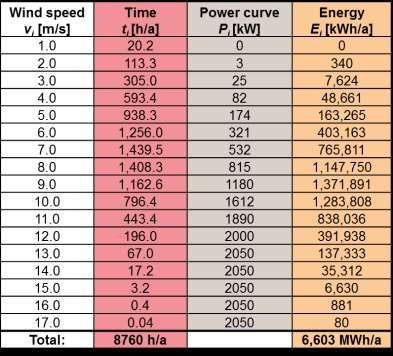
2.4 Energy yield calculation

Learning objective: After completing the following page, you should be able to

 • calculate the energy yield of a wind turbine using measured wind speed data and wind
 turbine power curves.
To make a good estimate of the annual energy production of a proposed wind farm, a lot of information
is required. However, the two key parameters needed are 1) the wind speed distribution at the
planned site and 2) the power curve of the wind turbines being installed. The energy production is
calculated for every wind speed class individually by multiplying the duration of wind speeds at a
specific wind speed class with the power output of the wind turbine at that specific wind speed class,
according to the formula:

 = ( ) ×

 where:

 Ei = Energy production of wind speed class i [Wh, watt-hours]

 Pi(vi) = Power of wind speed class i derived from wind turbine power curve [W, watt; J/s,
 joules per second]

 ti = Duration of wind speeds at wind speed class i [h, hours].

The total energy yield is the sum of all energy yields of the different wind speed classes:

 ∑E= E1 + E2 +…+ En [Wh]

 ∑E = Energy production over one year [Wh].

 Energy yield calculation for every wind speed class (Source: RENAC)

 Page 10 of 39
 03/03/2020
Example of energy yield calculations (Source: RENAC)

If a number of wind turbines are installed in a small area, the turbines may have a negative influence
on each other (because of the wake effect). The wake effect can reduce wind speeds downwind of a
turbine by up to 40%. Downwind turbines will thus obtain significantly less power relative to the
upwind rows. Wind turbines with inadequate distances between them and under unfavourable wind
directions face increased wind loads, and the overall energy yield from the wind park is significantly
reduced. As a rule of thumb, the minimum transversal separation (i.e. perpendicular to the prevailing
wind direction) should be at least 3 to 5 diameters of the turbine rotor, and in the longitudinal direction
(in the predominant wind direction) at least 5 to 7 diameters in order to reduce the wake effect.

 Distances between wind turbines in each direction (Source: RENAC)

 Page 11 of 39
 03/03/2020
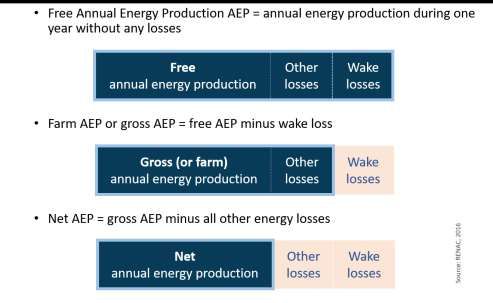
Thus, the total energy yield of a wind farm is lower than what the sum of the energy yields of the
individual wind turbines would have been if they had been installed alone and not as part of the wind
farm. Further parameters that affect the energy yield are the “availability” of the wind turbines and
grid connection downtimes. Additionally, losses within the internal electricity grids of wind farms are
not negligible.

Typical losses include: 3-15% shading losses in the wind farm (wake effect); 1.5-3% internal grid losses;
1-3% technical non-availability of wind turbines; 0-0.5% blade degradation; and 0.5-2% non-availability
of grid connection.

Generally, the net annual energy production at the point of common coupling can be calculated as
follows, using the sample loss percentages given above:

 3% wake 3% technical
 effect losses non-availability

 [ ℎ]
 = [ ℎ] × 97% × 98.5% × 97% × 98%

 1.5% internal 2% grid non-
 grid losses availability

The free, gross, and net annual energy production (AEP) can thus be calculated as follows:

 = + = +

 Free, gross and net energy production illustration (Source: RENAC)

Note that, free AEP minus wake loss equals gross AEP, and gross AEP minus all other losses equals net
AEP.

 Page 12 of 39
 03/03/2020
As an example, to calculate the net farm AEP before and after losses, given a free AEP of 12.0 GWh per
WTG and a farm efficiency of 90% (due to wake losses), losses for availability of 3%, for internal and
external grid of 3%, for curtailments of 2%, and all other losses of 2%, we have:

 = 12.0 × 0.9 = 10.8 ℎ

 = 12.0 × 0.9 × (1 − 0.03) × (1 − 0.03) × (1 − 0.02) × (1 − 0.02) = 9.76 ℎ

2.5 Correlation and prediction
Learning objectives: After completing the following page, you should be able to

 • Describe the procedure for long-term wind data correlation and prediction
In the “Wind power - Technology and measurement“ course it was stated that the developer typically
has access to measurement data taken over only a short time period. However, one needs to predict
from this a long-term wind regime and reduce the bias due to inter-annual variations, such as are
shown in the figure.

 Long term wind energy generation in Germany (BWE, 2010)

Long-term reference data should be obtained from meteorological reference stations located as close
to the likely site as possible. The data gathering method of the reference station, the equipment used,
and the surroundings (e.g. obstacles), should be unchanged throughout the analysed period, if the
data is to be reliable for projections. To gather this information, an on-site visit and an interview with
the staff of the meteorological station can be helpful.

 Page 13 of 39
 03/03/2020
The most important factor, however, is whether there is a strong correlation between the long-term
reference data and the shorter term measured data. The European Wind Energy Association suggests
that the Pearson correlation of the two data sets should not be lower than 0.8.6

For each of the sectors of the wind rose, the measured data are compared to the reference data
through the following steps:7

 1. To minimise the influence of local site conditions, wind speeds below 5m/s are excluded.
 2. The analysis compares:
 a) wind roses, for information on local features influencing the directional results.
 b) the wind speed ratio between the reference data and the potential wind farm site.

The result is a set of scale parameters for each wind rose sector. These scale parameters represent the
factor by which the wind resource of the reference site needs to be multiplied in order to get an
appropriate new long-term wind resource at the potential site. The uncertainty of this long-term
resource depends on the quality of the on-site measurements, the quality of the reference data, the
correlation between the two data sets, and the computational method used.

2.6 Formal uncertainty analysis
Learning objectives: After completing the following page, you should be able to

 • identify important sources of uncertainty in wind resource assessment, and
 • calculate the overall uncertainty of the annual wind energy production calculation.

2.6.1 Types of Uncertainties

Single uncertainties. Uncertainty analysis quantifies the potential deviation, both positive and
negative, from the expected annual wind regime. The production (and thus financial) risk in a project
is equal to the probability of lower production values in comparison with the expected value. Higher
outcomes represent the upside potential, whereby the actual production and revenues from a project
may exceed the expected values.8 A comprehensive uncertainty analysis is an indispensable part of a
high quality wind resource assessment (WRA). The individual uncertainties “are assumed to be
normally distributed and therefore statistically expressed in terms of a standard deviation from their
mean”. The most important sources of uncertainty are, inter alia:9

 • The site conditions, especially the surface roughness: its influence might be misjudged even
 by an expert evaluating the site. Furthermore, the site conditions can change over time (trees
 grow, buildings are constructed, etc.).
 • The quality of wind speed data: data from reference stations are often taken at a height of 10
 m above ground and are therefore significantly influenced by the reference site conditions.

6 (EWEA, 2009).
7 (EWEA, 2009)
8 (Boensch, 2005)
9 (Boensch, 2005); (EWEA, 2009)

 Page 14 of 39
 03/03/2020
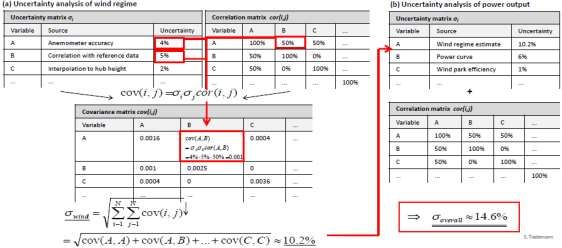
The technology of the reference station’s measuring devices may be low, calibration
 inaccurate, or the measuring method may have been changed during the measurement
 period. For on-site measurements the uncertainty depends on the quality of the
 anemometers, the standards of calibration, the duration of measurements, and the measuring
 height in relation to the hub height of the turbine. Control measurements generally increase
 the accuracy.
 • The correlation between reference and on-site data: if the data of the reference station and
 the potential site are well correlated, the uncertainty might not exceed an additional 5%. For
 low correlation or unsuitable procedures, the uncertainty increases up to 20%, and thus ruins
 the quality of on-site measurements.
 • The variability of the wind regime: the WRA for a bankable report includes two different
 uncertainties; the uncertainty for one year and the uncertainty over a longer time span, e.g.
 10 years. In general, the variability for one year is around 6%, for ten years around 2%.10

Total uncertainty. The objective of uncertainty analysis is to get one value representing the total
uncertainty of the expected annual energy production value, through the quantification of the
individual uncertainties. To produce an overall uncertainty of the WRA it is important to know the
degree to which the single uncertainties correlate.11

This correlation is given by the correlation matrix with its entries cor(i,j), i = A,B,C,... and j = A, B,C,... .
Here, correlation means that if one value changes due to its inherent uncertainty, the uncertainty of
another value, but not the other value itself, changes. The uncertainty is expressed as a per cent of the
expected value. Thus, if the expected value is large, the total uncertainty of the expected value changes
more than if the expected value is small. From the uncertainty – and the correlation matrix – one
obtains the respective covariance matrix and, finally, the overall uncertainty. The figure here describes
the procedure.

 Calculating the overall uncertainty of the annual energy production using measured and reference
 wind data. (Source: RENAC)

10 (EWEA, 2009)
11 That two parameters are dependent is a necessary, not a sufficient, condition for correlation of their uncertainties!

 Page 15 of 39
 03/03/2020
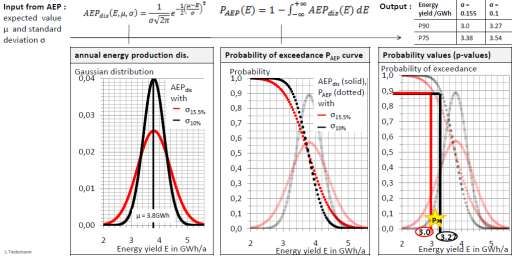
The values here are estimates, and the sources of uncertainty are not complete! The accuracy of the
anemometer (variable A) has an uncertainty of 4% and the correlation with the reference data
(variable B) has an uncertainty of 5%. The correlation between the uncertainties of variable A and
variable B is cor(A,B) = 50%.

To determine the overall uncertainty of the WRA, we have to multiply the individual uncertainties
along with their correlation, as shown by the formula in the graph. For our example, we get cov(A,B) =
4% x 5% x 50% = 0.001. By simply summing up the single entries of the covariance matrix and then
taking the square root, we obtain one scalar value, which is the uncertainty of the WRA σwind = 10.2%.
On the right side of the figure the same procedure is repeated, giving us the overall uncertainty of the
annual energy production, σoverall= 14.6%.

2.6.2 Assessing Risk

At this point of the analysis, the expected value of the annual energy production (AEPµ) and its
overall uncertainty (σtotal) are known. If we identify the overall uncertainty with the standard
deviation of a normal distribution, these values define the Gaussian distribution of the annual energy
production:

 1 − 2
 1 − ( )
 ( , , ) = 2
 √2

E stands for the total annual energy production; e is the mathematical constant. Fehler! Verweisquelle
konnte nicht gefunden werden. shows the Gaussian AEP for an expected value µAEP = 3.8GWh and two
different uncertainty levels (as % values) of σAEP1 = 15.5.% and of σAEP2= 10% (solid lines). As the
uncertainty rises, the distribution becomes flatter and, therefore, a lower-than-expected output
becomes more likely. This likelihood needs to be quantified as part of developing a solid financial plan.

To do so, the AEPdis is integrated to give the probability of exceedance curve:
 +∞
 ( ) = 1 − ∫−∞ ( ) .

From PAEP the probability of exceeding certain energy yields can be read off as pX-values, where X gives
the probability in per cent of exceeding a certain annual energy production. The dotted lines in the
figure are the PAEP for the corresponding AEPdis. The horizontal and vertical lines indicate the p90 values.
With an uncertainty of 15.5%, the energy output achieved at a probability of 90% is only 3 GWh. An
annual energy production of AEP = 3.38GWh is achieved at a probability of 75%. The probability of
exceeding higher energy output increases as the overall uncertainty of the AEP decreases. That is, if
the overall uncertainty is 10% (black curves), the probability to exceed 3GWh is almost 97%.

 Page 16 of 39
 03/03/2020
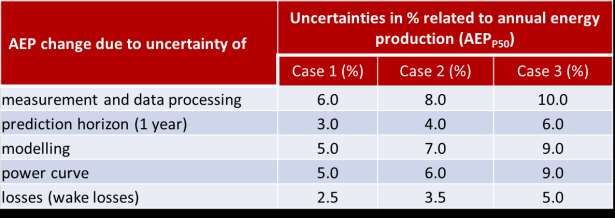
How to obtain p-values from the annual energy production distribution and probability of exceedance
 curve for different overall uncertainties (Source: RENAC)

The different pX-values are the input parameter for a “cash flow analysis under different degrees of
risk tolerance”12: the lower the probability, the higher the risk that the corresponding AEP may not be
achieved. Interest rates generally increase with a higher risk tolerance, and lenders, including banks,
normally use the P90 value as their benchmark. Thus an important financial motivation of the WRA is
to minimise uncertainty in order to decrease the interest rate on debt.

2.6.3 Uncertainty and Energy Production Calculation

The methodology to determine how all the uncertainties of a project together influence the annual
energy production is as follows:

A) Split the uncertainty evaluation into a wind speed and energy related field. (Important: wind speed
uncertainties in m/s have to be translated into energy related uncertainties in MWh/a.)

B) In case uncertainties are stochastically independent, calculate the root of the sum of the squares of
the individual uncertainties:

 = √ 1 2 + 2 2 + 3 2 + ⋯ + 2

With:

Utotal = total uncertainty in absolute values (MWh/a) or as a % of AEP

U1 to UN = individual uncertainties

Wind speed related uncertainties could arise through measurement and data processing
uncertainties, for example. Examples of energy related uncertainties could be in the power curve,
wake effect, or flow modelling uncertainties. The table here shows the ranges for a number of types
of uncertainties.

12 (Boensch, 2005)

 Page 17 of 39
 03/03/2020
Range of wind speed and energy related uncertainties (Source IEC,2017)

In the following table, uncertainties in % related to annual energy production (AEPP50) are shown for
three different cases. Then the total uncertainty for each case is:

Case 1 (%) : = √(0.06)2 + (0.03)2 + (0.05)2 + (0.05)2 + (0.025)2 = 10.1

Case 2 (%) : = √(0.08)2 + (0.04)2 + (0.07)2 + (0.06)2 + (0.035)2 = 13.3

Case 3 (%) : = √(0.10)2 + (0.06)2 + (0.09)2 + (0.09)2 + (0.05)2 = 18.0

 (Source: RENAC)

 Page 18 of 39
 03/03/2020
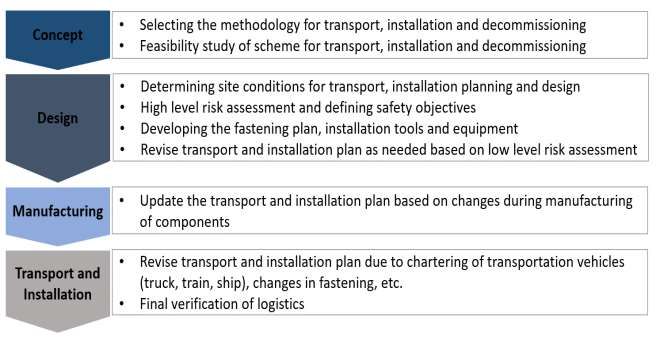
2.7 Logistics, installation and commissioning
Learning objectives: After completing the following page, you should be able to

 • identify important steps in the transport, installation and commissioning of wind turbines for
 large wind farm
Logistics

Transporting the equipment and materials needed in a 150 MW wind farm can require as many as 650
truckloads, 140 railcars and eight ships to complete the transportation process.13 Transportation
logistics issues impose limits on the development trend toward bigger and taller wind turbines.
Developers must pay attention to the challenges of moving wind turbine components from the
manufacturing facilities to the site.

The height of a wind turbine may reach to 170 meters.14 Each rotor blade may be longer than 80
meters,15 and the components are generally getting heavier. The nacelle, the hub and the blade
together may easily weigh over 400 tons. Roads, bridges, and other infrastructure are often not
designed for such loads, which can complicate the transport logistics situation.

A well-prepared transport plan should be developed early in the project to ensure resources are
available to ensure safe, practical, and economically feasible transport and installation processes. The
figure here outlines the key planning tasks for transportation and installation during development of
a wind turbine project.

 Aspects of transportation logistics for a wind project (Source: DNV.GL, 2017)

13 (Lockheed Martin Corporation , 2017)
14 (Max Bögl Wind AG, n.d.)
15 (GE, 2019)

 Page 19 of 39
 03/03/2020
Logistics must consider the limitations of infrastructure for each mode of transportation (road, rail and
waterway options) with respect to the size and weight of wind turbine components. Considerations
include distances; permits for oversized and overweight components; geometries of roads and rails
(turning radius, slope, tunnels, bridges); obstructions around road and railroad (power transmission
lines, trees, signage); bridge or road weight limits; overall vehicle length, width, and height; combined
weight of components and vehicle; and the condition of temporary roads at the site. Note that size
and weight limits vary from country to country.

For waterway and offshore transport, factors like wind speed, wave heights, water depth, wind
induced water level changes, high water cable and bridge overhead clearance, tidal variations, currents
(speed and direction), turning radius of long components in narrow areas, dimensional limitations
through bridges, locks, must all be considered. Also, the space for storage, loading, unloading, and
assembly at ports are important factors, due to ship cargo capacity limits, and the potential impact of
weather conditions.

2.8. Construction, installation and commissioning (onshore turbines)

The first step of the installation process involves site preparation, including preparing roads,
underground wiring, and the turbine foundation according to the manufacturer’s specifications. Heavy
machinery is used to prepare a roadway that can accommodate additional machinery; most important
is preparing for the crane and turbine parts, which require sufficient roadway width and capacity for
heavy loads. Wiring is often installed under or beside the roadway at this stage, or this can be done
after the heaviest machinery has completed work at the site.

Heavy machinery is used to excavate a large hole for the foundation, which is typically composed of
reinforced concrete with mounting bolts or other tie-in to secure the turbine base. If the topography
allows, turbines may be mounted directly on exposed bedrock. On softer soils, piles may need to be
driven deep into the ground. The foundation will also have electrical wiring conduits inlaid. The
foundation concrete needs considerable time for curing, often in the order of weeks, before the
turbine can be mounted.

Once the components are on site, the installation of onshore wind turbines is usually done with a crane
suited to the size and weight of the component parts, and the heights to which the parts must be lifted.
The type of crane is also dependent to the location and characteristics of the site, including soil types
and slopes, and could be caterpillar crane or tyre crane.16 Components may be lifted directly from a
truck, or all the components may first be laid on the ground and then lifted into place. The limiting
factor in a large wind project is usually the crane; rentals can be quite expensive, and mobile cranes
capable of the necessary height and weight demands are often in short supply, especially for larger
turbines. Thus ensuring the availability of an appropriate crane is an important component and should
be addressed at an early stage of the project planning.

Sites are selected based primarily on the wind potential, but high winds can hinder the operation of
cranes due to safety concerns. Some developers plan to erect turbines in the lower wind season, to
reduce the chance of delays and excess rental costs, including penalties that may be due for using the
crane(s) longer than anticipated.

16 (SGS et al-a, 2015)

 Page 20 of 39
 03/03/2020
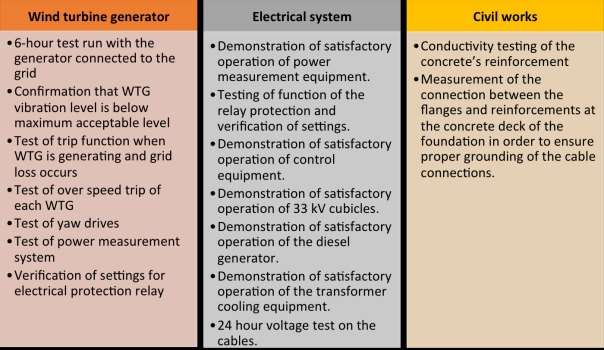
Wind delays times can be reduced by the use of different installation concepts; it may be possible to
pre-assemble tower parts (not usual), or to mount two or three blades to the hub prior to lifting it into
place. The pre-assembly process is typically done at to the onshore pad site, or at port prior to load-
out for offshore projects.17

 Assemblies for different installation concepts (Source: RENAC)

Commissioning

Project “commissioning” involves a set of activities performed in order to confirm that the wind turbine
has been correctly installed, and that it can be operated safely and run automatically to continuously
generate electricity. Commissioning generally includes all activities undertaken after installation of the
wind turbine, usually involving standard tests on the wind turbine generator, the electrical system,
safety equipment, sensors and actuators, and inspection of routine civil engineering records.

Typical commissioning tests for each step are shown in the chart. The commissioning and pre-
operation testing must be performed according to the turbine manufacturer’s guidelines and checklist,
which must also comply with local regulations. Commissioning of a single turbine can be completed in
little more than 2 days, with expert staff, but commissioning of a large wind farm can take a significant
amount of time, as many tests must be conducted on each turbine individually.18

17 (DNV.GL, 2017), (SGS et al-a, 2015)
18 (EWEA, 2009)

 Page 21 of 39
 03/03/2020
Commissioning tests of different parts of wind turbine. (Source: Vattenfall, 2009)

Installation of wind turbine tower with separate sections (Source: © Eslami, RENAC)

 Page 22 of 39
 03/03/2020
3 Wind measurement

3.1 General

Learning objectives: After completing the following page, you should be able to

 • identify the purpose of measuring wind data, and
 • explain why it is important to measure the wind resource at the site.
Wind data is recorded as time series (e.g. wind speed and wind direction over time), as a statistical
analysis of a time series (e.g. frequency per wind speed interval or per wind direction, minimum or
maximum wind speeds), or as a mathematical description of a statistical distribution (e.g. Weibull
distribution). Many countries have publicly available wind atlases, and this data can be used for a
preliminary assessment of wind resources.

It is also possible to synthesize wind data from monthly average wind speeds if the Weibull k-factor is
known. However, to evaluate whether a specific site is economically suitable for a wind farm, on-site
wind speed measurement is recommended, because wind speed distributions can vary markedly from
one location to another due to terrain effects.

Reliable wind data provides the basis for making accurate estimates of the annual energy production
to be expected from a wind farm or single wind turbine. Lenders look for reliable wind analyses as a
condition for project financing.19 Even in cases where satellite models already exist for projection and
estimation of wind speed, on-site measurements are irreplaceable from a technical and financial point
of view. Reliable wind data is also important in order to inform the developer’s choice of the optimal
wind turbine for the specific site conditions.

It is important to consider that the effect of variation of wind speed is “micro”; its effects are specific
and involve a number of complex variables. Therefore, the design scheme of a wind farm will often
refer to “micro-siting”, highlighting the need to accommodate variations that can occur even over
short distances.

Another fundamental aspect is the analysis and integration of a newly created wind database with
long-term databases, i.e. those that, while they have not been measured directly at the site, have
historical records of more than 5 or 6 years. This kind of analysis can mitigate the randomness inherent
in the survey time period (which may be a windy year, for instance), and therefore reduce the
production risk in the project.

The table below lists the data that needs to be obtained from a wind measurement survey (right
column), and the tasks for which this data is required (left column).

(IFE, 2019)

 Page 23 of 39
 03/03/2020
Task Data to be collected

• Calculation of annual energy production (AEP) Wind speed distribution (wind speed versus
• Calculation of finances time)

• Structural safety calculations Turbulence intensity
• Calculation of tower heights Wind shear profile
• Calculation of mechanical loads Wind shear and vertical wind component
• Micro-siting of wind turbines and wind farm set-up Wind direction distribution (direction
• Calculation of wake effects versus time)
• Calculation of air density Humidity, temperature
 The maximum wind speed occurring every
• Decision to choose wind turbine class I, II, III or IV
 50 years*, turbulence levels of the wind
 (according to IEC 61400)
 speed
* Data available from long-term weather monitoring.

3.2 Equipment

Learning objectives: After completing the following page, you should be able to

 • identify equipment commonly used in a wind measuring campaign, and
 • explain fundamental settings of a wind measurement campaign.
Wind data is usually recorded using a wind measuring tower or mast, with calibrated sensors at various
heights. Financiers may require that the mast have the same height as the expected hub height of the
proposed wind turbines. This is to avoid the errors involved when wind speed measurements taken
near to the surface are used to estimate what the wind speed will be at the hub height of the proposed
wind turbines - which is the method typically used in meteorological stations, and thus the source of
wind atlas data. Metal masts over 100 m high are commonly used.

Anemometers, which measure wind speeds, should be calibrated before the start of a survey and after
its completion. This is necessary to be able to confirm the quality of the measuring campaign. The
anemometer is calibrated in wind tunnels according to the MEASNET ‘Reference Measurement
Procedure’ which is based on the IEC 61400-12, Annex F ‘Cup anemometer calibration procedure’.

Wind speed measurements can be considered representative (valid) for the area around the point at
which a measurement is taken, depending on the nature of the terrain – up to radial distances of 10
km for flat terrain, but only up to 2 km for hilly terrain (> 30 % slope inclination; for details see IEC
61400-12).

It is common practice to measure wind speeds at a minimum of two anemometer heights, and also to
measure wind direction changes, air density, air temperature and air pressure. By fitting the
anemometer to the top of the mast, disruption to the airflow by the mast itself is minimised. If the
anemometer is fixed to the side of the mast it should be positioned in the prevailing wind direction in
order to minimise wind shadow from the mast. Wind vane data can be used to exclude measured wind
speed data from the assessment that were negatively influenced by the mast shadow.

 Page 24 of 39
 03/03/2020
The height of the top anemometer should be at the height of the nacelle but, if this is not possible, it
should be at least 2/3 of the nacelle height above ground. For standards purposes, wind speeds are
measured every 3 seconds, and every 10 minutes wind speed average and standard deviation are
recorded. Wind direction is measured in 10 minute average intervals.

Data is continuously recorded (with a data logger) at 1 or 10 minute intervals. Measurements should
cover a minimum period of 12 months, in order to take any seasonal effects into account.

Schematic of a wind measurement mast equipped with two anemometers, a wind vane, temperature,
 humidity and barometric pressure sensors, and data logger, with PV module power supply (Source:
 RENAC)
 © A. Tiedemann

 © A. Tiedemann
 © A. Tiedemann

 Temperature sensor, anemometer, data logger and PV power supply for data logger assembled
 during RENAC Seminar at Wigton Training Centre in Jamaica (Source: © Tiedemann, RENAC)

 Page 25 of 39
 03/03/2020
3.3 Light Detection and Ranging (LIDAR) and Sonic Detection and Ranging (SODAR)

Learning objective: After completing the following page, you should be able to

 • state the purpose of non-contact measurement systems, and
 • explain how non-contact measurement systems can be used in wind farm planning.
The wind profile of a prospective wind generation site can also be measured “remotely” with non-
contact methods, using LIDAR systems (Light Detection and Ranging) and SODAR (Sonic Detection and
Ranging) systems, which have been developed to do this.

LIDAR measures wind conditions with the help of a laser beam. Aerosols moved around by the wind
flow reflect the beam and cause a frequency shift (Doppler Effect). The LIDAR evaluates the frequency
shift between its sent and received signals, and calculates the wind speed and wind direction by
considering measurements in at least three different directions.

SODAR technology sends out tone pulses into the atmosphere. The reflected sound has a different
frequency than the sound transmitted, again due to the Doppler Effect. As with LIDAR, the difference
between frequencies is used to calculate wind speed and direction.

LIDAR/SODAR can be used to complement a shorter measuring mast, taking measurements either next
to it or at various points around a planned wind farm site. They are used to check and improve both
the accuracy of measured data, and the extrapolation of data to a certain height. This is especially
useful at sites where wind shear is an issue: for example, close to forests the wind shear can be affected
by stability and terrain roughness. LIDAR/SODAR installed at ground level can enable the measurement
of wind speed and wind direction at up to 200 m height.

Wind measurement with LIDAR and wind mast (120 m wind mast, wind turbine on a 120 m tower and
 LIDAR/SIDAR measuring up to 200 m) (Source: RENAC)

 Page 26 of 39
 03/03/2020
3.4 The Weibull equation

Learning objective: After completing the following page, you should be able to

• apply a mathematical formula widely used to calculate wind speed distribution, and
• explain how the scaling factor and the shape factor change the Weibull graph.
At any given site, wind speed will vary quite a lot over the course of a day, a month, and a year. There
are several reasons why we are interested in the distribution of wind speed; these include for the
calculation of annual energy production, the choice of best wind turbine for a specific site, and the
calculation of thermal loading of cables and grid infrastructure.

The Weibull equation is a mathematical formula that is widely used to estimate the wind speed
distribution. The equation estimates the relative frequency of a specific wind speed h(vi) by using two
factors: a scaling factor A and a shape factor k. The shape factor k indicates the breadth of the wind
speed distribution. The average wind (Vaverage) speed time is almost 0.9 times the scaling factor A.

 −1 −( )
 ℎ , ( ) = ( )

Where:

 vi = Wind speed [m/s] k = Shape factor, dimensionless [-]

 hW,i (vi) = Relative frequency of wind speed vi A = Scaling factor [m/s]
 [%]

 i = Index variable

The graphs below show several different wind speed distribution curves derived using the Weibull
equation. Because A is constant in the first graph, the three curves have the same average wind speed
but the shape of the curve is very different. In the second graph, k is constant and A varies. The
distribution with a shape factor k = 2 is called the Rayleigh distribution.

As the graph show, lower k values correspond to broader wind speed distributions – the wind speeds
tend to spread out over a large range of speeds. Higher k values correspond to narrower wind speed
distributions, in which wind speeds tend to stay within a narrow range.20

20 HOMER micropower optimisation model, 2009.

 Page 27 of 39
 03/03/2020
Wind speed distribution curves for different shape factors k with constant scaling factor A.(Source:
 RENAC)

 Wind speed distribution curves for different scaling factors A with constant shape factor k.
 (Source: RENAC)

 Page 28 of 39
 03/03/2020
4 Software
Learning objectives: After the following page, you should be able to

 • identify some commonly used software for wind power
Several software packages have been developed for different purposes with respect to wind power
generation.

RETScreen, HOMER, and SAM are three software packages used at the pre-feasibility and feasibility
study stages. As discussed earlier in the course, the pre-feasibility study occurs at an early stage of
analysing a prospective wind farm scenario. The level of accuracy in this stage is in the range of ±40%.
The feasibility study is an in-depth study of the same topic of pre-feasibility study and should provide
enough information to inform the “go/no-go” decision point. The cost estimation accuracy in this stage
is ±25%.

A number of software packages are used in the design and improvement of turbines, such as Ashes,
Fast, FOCUS6, HAWC2, QBlade, and Simpack. These software are not really relevant to the process of
developing a wind power project, but they do have a role in helping evaluating turbine performance
at different wind speeds, calculating wind load capacity, and many other factors.

Breeeze and FLOWSTAR-Energy are used as wind resource monitoring systems. Also, to predict
important wind characteristics at locations where measurement is not available, flow modelling
sotware such as Continuum, Meteodyn WT, WAsP, Windie, WindSim, WindStation, and ZephyCFD are
applicable.

In designing the layout, visualisation software like Furow, Meteodyn WT, WindFarmer, Windplanner,
WindPRO and ZephyCFD are useful, especially in graphically presenting a proposed wind farm to aid in
obtaining construction permits and for public consultations.

There are also software available for monitoring the wind farm after finishing the installation e.g. GPM
Horizon, Meteodyn SPA, ROTORsoft, windOPS, and windPRO - PERFORMANCE CHECK module. These
are important for remotely monitoring overall wind farm performance, as well as to watch each
turbine for faults and errors.

The table in Annex 1 illustrates the specifications of each software and its application to each phase of
a wind power project. Note that many other software packages exist beyond the ones referenced here;
RENAC does not recommend any specific software.

 Page 29 of 39
 03/03/2020
5 Summary

The development of a wind power project is a complex process requiring that a wide range of skills
and knowledge be utilised during the project life cycle to cover all aspects of development. A wind
power project typically begins with a remote wind analysis via wind atlas data as a contributor to a
pre-feasibility assessment. If this proves promising, a developer will initiate a wind assessment survey,
including by erecting one or more test towers and possibly complementing these with LIDAR/SODAR
analysis. A feasibility study will be conducted using this data and cost estimates regarding components
and construction costs, as well other costs like insurance and maintenance. Project development
includes a range of pre-construction activities, along with post-construction commissioning to ensure
the project is safe and reliable.

Once the wind farm is operational, operations and maintenance (O&M) is conducted for the life of the
project, which often coincides with a power supply agreement lasting 20 years or even longer. Finally,
after the wind turbine service life ends, which should roughly correspond to its contract duration of
20-25 years, the turbines will be removed or replaced, along with other wind farm infrastructure.

The development process steps are captured in the following schematic:

 (Source: RENAC)

 Page 30 of 39
 03/03/2020
6 Further reading

Erich Hau, Wind Turbines: Fundamentals, Technologies, Application, Economics. Springer. ISBN 13-
978-3-540-24240-6. This book contains material on everything from windmills and wind wheels to
the complex design of all components of a modern wind turbine.

Wind energy project analysis: RETScreen international. Minister of Natural Resources Canada 2001
– 2004. ISBN 0-662-35670-5. Online at

Wind speed distribution, energy curve, specific yield, and wind plant capacity factor are some of the
aspects that the authors explain in this document.

Wind energy: Implications of large-scale deployment on the GB electricity system. Royal Academy
of Engineering, 2014. ISBN 978-1-909327-07-8. Online at

The document from the Royal Academy of Engineering goes into detail on the technologies, wind
resource, integration to the grid system, economics, and even a view of the energy plan for 2030 for
the British grid.

 Page 31 of 39
 03/03/2020
7 Annex: Specifications of software for use in wind projects
 Applicable for Software name Main feature
 Pre-feasibility and RETScreen - calculation of energy yield
 - financial analysis
 feasibility study
 - risk analysis for financial parameters21
 HOMER - calculation of energy yield
 - hybrid system modelling
 - techno-economic optimisation for possible solutions22
 SAM - calculation of energy yield
 - financial analysis
 - PPA price calculation
 - Sensitivity analysis by specifying a range of values for input
 variables as a percentage23
 Turbine design Ashes - analysis of aerodynamic and mechanical horizontal axle wind
 turbines24
 Bladed - design and certification of onshore and offshore wind turbines
 - offshore support structure modelling
 - hydrodynamic modelling
 - examination of blade stability and quantification of the risk of
 blade flutter25
 FAST - simulation of the coupled dynamic (coupled nonlinear aero-
 hydro-servo or control and electrical system-elastic or
 structural) response of wind turbines26

 FOCUS6 - design of wind turbines and turbine components27
 HAWC2 - calculation of wind turbine response in time domain include of
 aerodynamic model, hydrodynamic model, and water
 kinematics28
 QBlade - design and simulation of wind turbine blades/rotors29
 Simpack - analysis and design of wind turbine.
 - resonance analysis and load calculations
 - simulation of extreme events, e.g. wind gust, voltage dip
 emergency braking
 - stress, strain and durability

 Wind resource Breeeze - wind resource monitoring system to manage wind
 monitoring measurement campaigns30
 FLOWSTAR-Energy - 3D estimate of flow and turbulence
 system
 - map of wind speed and wind energy for the wind turbine make
 - free stream, gross and net wind speed, energy yield and
 capacity factor for individual wind turbines
 - vertical profiles of free stream wind speed, turbulence
 components and other atmospheric boundary layer
 characteristics31

21 (Natural Resources Canada , 2019)
22 (HOMER Energy LLC, 2019)
23 (Blair, et al., 2014)
24 (Simis as, 2019)
25 (DNV.GL, 2019)
26 (NREL, 2019)
27 (WMC & ECN, 2019)
28 (DTU Wind Energy b, 2019)
29 (HFI TU Berlin, 2019)
30 (Greenbyte AB, 2019)
31 (Wind Energy and Airflow, 2019)

 Page 32 of 39
 03/03/2020
You can also read