Exploring the impact of the COVID-19 pandemic on global emission projections - Pbl
←
→
Page content transcription
If your browser does not render page correctly, please read the page content below

Exploring the impact of the
COVID-19 pandemic on global
emission projections
Assessment of green versus non-green recovery
Authors:
Ioannis Dafnomilis, Michel den Elzen, Heleen van Soest (PBL Netherlands Environmental
Assessment Agency), Frederic Hans, Takeshi Kuramochi, Niklas Höhne (NewClimate Institute)

                                                                        September 2020
Exploring the impact of the
COVID-19 pandemic on global
emission projections
Assessment of green versus non-green recovery

Project number
319041

© NewClimate Institute 2020

Authors
Ioannis Dafnomilis, Michel den Elzen, Heleen van Soest (PBL Netherlands Environmental Assessment
Agency), Frederic Hans, Takeshi Kuramochi, Niklas Höhne (NewClimate Institute)

Disclaimer
The views and assumptions expressed in this report represent the views of the authors and not
necessarily those of the client.

Cover picture: Kate Trifo via pexels.com

      Download the report
      http://newclimate.org/publications/
Exploring the impact of the COVID-19 pandemic on global emission projections

Table of Contents
Table of Contents ......................................................................................................................................i
List of Figures ........................................................................................................................................... ii
List of Tables ........................................................................................................................................... iii
Abbreviations ........................................................................................................................................... iv
Acknowledgements ..................................................................................................................................v
Main findings ........................................................................................................................................... 1
    Introduction ......................................................................................................................................... 3
    Impact of the COVID-19 pandemic on global emissions in 2020 and out to 2030 ............................ 4
    2.1 Global CO2 emission estimates for 2020 .................................................................................... 4
    2.2 Emission projections up to 2030 ................................................................................................. 7
       2.2.1 Current policies scenario ....................................................................................................... 7
       2.2.2 NDC scenarios and updates ............................................................................................... 11
       2.2.3 Least-cost mitigation scenarios consistent with the Paris Agreement's temperature limits 12
    2.3 Assessment of uncertainties and sectoral rebound effects ...................................................... 14
    2.4 Conclusion: General implications for policy .............................................................................. 16
    Assessment of green vs. ‘non-green’ recovery ................................................................................ 17
    3.1 What is considered as ‘green recovery’?.................................................................................. 17
    3.2 A framework for assessing economic stimulus packages ........................................................ 20
    3.3 Estimating the impact of recovery measures on GHG emission pathways.............................. 23
    Capturing the impact of the pandemic and recovery measures through modelling ......................... 25
    4.1 Modelling short-term effects: the challenges ............................................................................ 25
    4.2 Modelling long-term effects: the way forward ........................................................................... 26
References ............................................................................................................................................ 27
Annex A.1 Short-term GDP projections .................................................................................................... I
Annex A.2 Defining ‘green’ and ‘grey’ policy archetypes ........................................................................ II
Annex A.3 Germany's fiscal stimulus package announced on 3rd of June 2020 ................................... VI

    PBL Netherlands Environmental Assessment Agency / NewClimate Institute | September 2020                                                                 i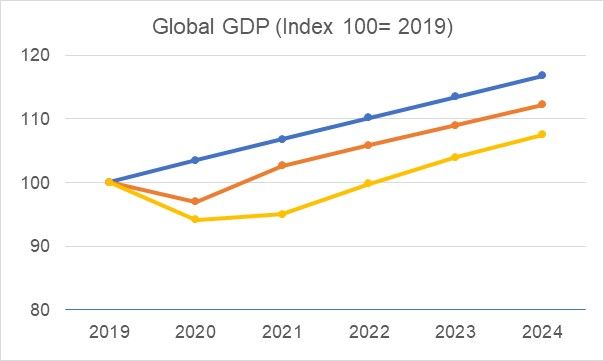
Exploring the impact of the COVID-19 pandemic on global emission projections

List of Figures
Figure 1: Global energy-related CO2 emissions and annual changes, 1900-2020 ................................. 5
Figure 2: Global total greenhouse gas emissions (median estimates) in the current policies scenario for
2010-2030, for various scenarios related to the COVID-19 pandemic ................................................... 9
Figure 3: Global fossil CO2 emissions (median estimates) in the current policies scenario for 2010-2030,
for various scenarios related to the COVID-19 pandemic ..................................................................... 10
Figure 4: Global CO2 emissions projections for the current policies scenarios (median estimates) for the
period 2010-2030 for various scenarios related to the COVID-19 pandemic, compared against the 1.5
°C and 2 °C scenarios from UNEP. ........................................................................................................ 13

Figure 5: Economic recovery measures in Germany’s fiscal stimulus package of 3 June 2020, classified
by 'colour type' and sector ..................................................................................................................... 21
Figure 6: Economic recovery measures in Germany’s fiscal stimulus package of 3 June 2020, classified
by 'colour type' and sector as defined in the Sustainable Recovery Plan of IEA (2020b). The “not
applicable” category applies to measures not covered by IEA ............................................................. 22
Figure 7: Relationship between green investment in period 2020-2030 and GHG emissions intensity of
GDP in 2030 .......................................................................................................................................... 23
Figure 8: Global GHG emissions projections (median estimates) for the current policies scenarios and
two recovery scenarios (4% and 6% decarbonisation based on full implementation of IEA’s (2020b)
Sustainable Recovery Plan) for the period 2010-2024/2030, including various scenarios related to the
COVID-19 pandemic ............................................................................................................................. 24
Figure 9: Short-term GDP projections of the IMF Baseline and Longer and New Outbreak scenario..... I

    PBL Netherlands Environmental Assessment Agency / NewClimate Institute | September 2020                                                           ii
Exploring the impact of the COVID-19 pandemic on global emission projections
List of Tables
Table 1: Global total GHG emission estimates for the current policies scenarios in 2030 (median and
10th to 90th percentile range from the model studies) ............................................................................ 10
Table 2: Global total GHG emissions in 2030 under different scenarios of UNEP (2019) (median and
10th to 90th percentile range).................................................................................................................. 12
Table 3: Cumulative CO2 emissions over 2020-2030, current policies scenario (median and 10th to 90th
percentile range) .................................................................................................................................... 13
Table 4: Possible rebound effects by sector, with either positive or negative effects on CO2 emissions.
............................................................................................................................................................... 15
Table 5: Defining ‘green recovery’ in response to COVID-19: overview of recent literature (April-June
2020)...................................................................................................................................................... 18
Table 6: Classification of ‘green’ policy archetypes ................................................................................ II
Table 7: Summary of ‘grey’ policy archetypes........................................................................................ III
Table 8: Classification of the measures included in Germany's fiscal stimulus package announced on
3 June 2020 in response to the COVID-19 pandemic ............................................................................ VI
PBL Netherlands Environmental Assessment Agency / NewClimate Institute | September 2020 iiiExploring the impact of the COVID-19 pandemic on global emission projections Abbreviations CO2 carbon dioxide CAT Climate Action Tracker ERP economic recovery package GCP Global Carbon Project GDP gross domestic product GHG greenhouse gas Gt gigatonne (billion tonnes) GW gigawatt (billion watts) IAM integrated assessment model IEA International Energy Agency IIASA International Institute for Applied Systems Analysis IMF International Monetary Fund JRC Joint Research Centre NDC Nationally Determined Contributions NIES National Institute for Environmental Studies OECD Organisation for Economic Co-operation and Development PBL PBL Netherlands Environmental Assessment Agency PIK Potsdam Institute for Climate Impact Research UNEP United Nations Environment Programme VAT value-added tax WEO World Energy Outlook WSF Germany’s Economic Stabilisation Fund (Wirtschaftsstabilisierungsfonds) PBL Netherlands Environmental Assessment Agency / NewClimate Institute | September 2020 iv
Exploring the impact of the COVID-19 pandemic on global emission projections

Acknowledgements
This project was financed by the European Commission, Directorate General Climate Action (DG
CLIMA). The report and calculations have benefited from comments by Miles Perry (DG CLIMA). We
also thank all colleagues involved, in particular Pieter Boot, Detlef van Vuuren, Andries Hof and David
Gernaat (PBL), with special thanks to Christien Ettema (www.shadesofgreen.nl) for the thorough text
editing.

This report has been prepared by PBL/NewClimate Institute/IIASA under contract to the European
Commission, DG CLIMA (EC service contract N° 340201/2019/815311/SERICLIMA.C.1 “Analytical
Capacity on International Climate Change Mitigation and Tracking Progress of Action”) started in
December 2019.

   PBL Netherlands Environmental Assessment Agency / NewClimate Institute | September 2020           v
Exploring the impact of the COVID-19 pandemic on global emission projections

Main findings
COVID-19 is primarily a global health crisis, but the pandemic also has a substantial impact on socio-
economic activities and energy use, and therefore on CO2 emissions. Due to the population lockdowns,
restrictions in movement and reduced energy demand, global emission levels in 2020 will, by most
accounts, show the largest annual decline in history. Moreover, the pandemic and the recovery
measures taken in its wake will likely affect emissions for the years to come. The extent of this impact
is uncertain to an unprecedented degree, due to the unpredictable future course of the pandemic and
large uncertainties surrounding the national and international recovery trajectories.

This report assesses the implications of the COVID-19 pandemic and associated recovery measures
on emissions out to 2030 and global emission pathways towards meeting the Paris climate goals. Due
to the high uncertainty surrounding the course of the pandemic and its impact on CO2 emissions, we
only present ‘what-if’ scenarios, based on explorative ‘ex-post’ calculations (using sources available
before June 2020) for several potential emission pathways and factors that could affect their course,
including rebound effects. Furthermore, we review and summarise the most recent insights (up to June
2020) published in the literature on post-COVID emissions projections and green recovery trajectories,
and provide a framework for analysing the ‘greenness’ of recovery packages, using Germany as a case
study. Finally, we explore how integrated assessment models can be used to explore both the short-
term and long-term effects of the pandemic and associated recovery measures.

Our main findings are as follows:

• Based on data and projections of the IEA and Global Carbon Project published in April and May
  2020, our median estimate for the global CO2 emission reduction in 2020, compared to 2019
  levels, is –8% in case of prolonged lockdowns worldwide until the end of 2020, and –4% to –5% if
  lockdowns are shorter and Europe and North America recover faster in the second half of 2020.

• For the longer term, our ex-post calculations indicate that the impact of the general slowdown of the
  economy would lead to an annual global emission reduction of –2.5 to –4.5 GtCO2e (–4% to –
  7%) in 2030, compared to pre-COVID current policy projections, for IMF’s Baseline and Longer
  and New Outbreak scenario, respectively. These numbers are based on IMF’s (April 2020) GDP
  projections for 2020-2024 and model decarbonisation rates from post-COVID current policies
  scenarios. However, the impact of a rebound to fossil fuels, with lower decarbonisation rates, the
  emission reduction in 2030 is projected to be smaller (–3.0 instead of –4.5 GtCO2e in the
  Longer and New Outbreak scenario) or may even turn into an increase (+0.5 instead of –2.5
  GtCO2e in the Baseline scenario).

• The effect of the COVID-19 pandemic on projected emissions under the Nationally Determined
  Contribution (NDC) scenarios is limited so far, because NDC targets have not changed at this
  point. For countries whose reduction targets are defined per unit of GDP, including China and India,
  the pandemic will likely affect NDC emission projections through its effects on GDP growth, but
  information at this level is not yet available. The NDC projections of UNEP (2019, pre-COVID)
  (54-56 GtCO2e in 2030) partly overlap with our post-COVID estimates for the current policies
  scenarios (55-60 GtCO2e in 2030).

• At this point, the COVID-19 pandemic is expected to have little effect on estimates of the 2030
  GHG emission levels consistent with a least-cost pathway in line with the Paris Agreement
  goals, as the 2020 drop in emissions is not due to structural changes. While the CO2 emissions
  reduction in 2020 is probably unprecedented, a consistent, similar rate of decrease would need
  to be maintained for decades in order to achieve the 1.5 °C warming limit. Low-carbon
  development needs to play a key role in countries’ recovery strategies to avoid that emissions bounce
  back or even overshoot previously projected levels by 2030, as shown in our projections.

   PBL Netherlands Environmental Assessment Agency / NewClimate Institute | September 2020            1
Exploring the impact of the COVID-19 pandemic on global emission projections

• Assessing the effect of the fiscal stimulus packages announced by governments in response to
  the pandemic requires an in-depth analysis of individual measures. To this end, we propose a
  classification defining ‘green’, ‘grey’ 1 and ‘colourless’ measures (both sector-specific and
  economy-wide). Besides tracking incoming economic recovery packages, attention should focus on
  how to account for the environmental effects of additional rescue measures such as airline bailouts,
  how to include non-budgeted measures, and how to account for regulatory roll-backs.

• Using the classification method mentioned above, a pilot assessment of the €130 billion fiscal
  stimulus package announced by the German government on 3 June 2020 reveals that ‘green’
  recovery measures account for approximately 31% of this stimulus. While the package does not
  contain unambiguously ‘grey’ measures, some measures currently coded as ‘green’ or ‘colourless’
  may require further assessment once more information becomes available. Approximately 21% of
  the package is in line with the green measures defined by IEA’s Sustainable Recovery Plan.

• Based on our ex-post method, we estimate that full implementation of IEA’s Sustainable
  Recovery Plan, assuming similar decarbonisation rates and global GDP growth as IEA, would
  result in global GHG emissions of 49 to 52 GtCO2e in 2024, which is below 2019 levels.

• To further assess the impact of the pandemic and associated recovery measures, Integrated
  Assessment Models (IAMs) are most suitable for long-term projections, and less suitable to account
  for short-term dynamics. The latter can be partly overcome by making use of projections from
  macroeconomic models such as E3ME and GEM-E3-FIT, provided that a series of inputs
  representing different long-term future scenarios are carefully constructed beforehand. This way,
  IAMs can provide valuable input on the feasibility of post-COVID transition pathways towards zero
  carbon emissions.

1
  In line with the EU Technical Expert Group on Sustainable Finance (2020, p. 51) and MacKenzie (2020), we
propose to henceforth use the word ‘grey’ rather than ‘brown’ for polluting measures, to accommodate different
cultural contexts and avoid racial connotations. When citing papers that use the word ‘brown’ as an indicator of
‘polluting’, we refer to this as “brown” [grey].

   PBL Netherlands Environmental Assessment Agency / NewClimate Institute | September 2020                    2
Exploring the impact of the COVID-19 pandemic on global emission projections

     Introduction
COVID-19 is primarily a global health crisis, but the pandemic also has a substantial impact on socio-
economic activities and energy use, and therefore on CO2 emissions. Due to the population lockdowns,
restrictions in movement and reduced energy demand, emission levels in 2020 will, by most accounts,
show the largest annual decline in history. Moreover, the pandemic will likely affect global CO2 emissions
for the years to come. The extent of this impact is uncertain to an unprecedented degree, due to the
unpredictable future course of the pandemic and large uncertainties surrounding the national and
international recovery trajectories.

This report explores the implications of the COVID-19 pandemic and economic recovery measures on
CO2 emissions out to 2030 and on the global emission pathways towards meeting the Paris climate
goals. The impact of the pandemic on energy demand and associated emissions is highly uncertain for
2020, and even more so for the medium-term (out to 2030) and long-term projections (out to 2050).
Therefore, this report only presents “what-if” scenarios, based on explorative calculations, to gauge the
effect of different possible recovery trajectories on potential emission pathways. These calculations were
conducted at the global level, due to the pandemic nature of COVID-19 and the limited availability of
national data at this point.

Chapter 2 takes stock of the impact of the COVID-19 pandemic on current global emissions and
expected trends. More specifically, this chapter first focuses on emission data and projections for 2020
(as published between April and June of this year) and then combines this information with IMF’s
economic forecasts to adjust the pre-COVID emission projections up to 2030. These ‘ex-post’
calculations are presented for the current policies scenarios and compared with the NDC scenarios and
least-costs scenarios in line with the Paris Agreement goals. Finally, this chapter identifies the main
uncertainties surrounding these projections, particularly in terms of possible rebound effects at the
sector level.

Chapter 3 discusses green versus ‘non-green’ recovery, by (i) identifying green recovery criteria, and
(ii) proposing a framework to track and evaluate economic stimulus packages, including a classification
of recovery measures based on their potential mitigation (or intensification) of GHG emissions. The
proposed framework is demonstrated using Germany as a case study, as this country has the most
detailed recovery measures planned so far. Finally, this chapter discusses how to assess the impact of
recovery measures on GHG emissions. As an example, the ex-post method introduced in Chapter 2 is
used to project global emissions under full implementation of IEA’s Sustainable Recovery Plan (IEA,
2020b).

Finally, Chapter 4 explores how the impact of the COVID-19 pandemic on emission projections can be
captured through modelling, i.e. moving beyond the trend analyses and ex-post calculations presented
in the current report. Specifically, this chapter evaluates the suitability of Integrated Assessment Models
(IAMs) to explore the short-term impacts of the pandemic – such as the effect of lock-downs and reduced
transport – versus the long-term impacts of both the pandemic and the recovery measures taken, in
terms of structural changes in the economy, energy production, consumption patterns, mobility and
lifestyles.

   PBL Netherlands Environmental Assessment Agency / NewClimate Institute | September 2020               3
Exploring the impact of the COVID-19 pandemic on global emission projections
Impact of the COVID-19 pandemic on global emissions in
2020 and out to 2030
This chapter addresses the following key questions:
• What is the impact of the COVID-19 pandemic on global CO2 emissions in 2020?
• What is the impact of the COVID-19 pandemic on global CO2 emissions out to 2030?
• What are the main uncertainties in these global trends, particularly in terms of rebound effects?
• What are the general implications for policy?
2.1 Global CO2 emission estimates for 2020
As the COVID-19 pandemic unfolded in recent months, its implications for daily global CO2
emissions soon became apparent, with significant consequences expected for this year’s annual
total. The global CO2 emission estimates for 2020 reviewed in this section 2 show significant
reductions compared to 2019, including a full range from –4% to –11%. The median estimate
shows a reduction of –8% in case of prolonged lockdowns worldwide until the end of 2020, and
a reduction of –4% to –5% if lockdowns are shorter and Europe and North America recover faster
in the second half of 2020. The above estimates are based on several sources published in April
and May 2020, including reports by the IEA and Global Carbon Project. The estimated emission
reduction for 2020 is in the order of magnitude of the yearly decrease rate required over the
following decades to limit global temperature rise to 1.5oC.
In April 2020, the International Energy Agency IEA was the first to publish an authoritative report to
estimate the energy impact of a widespread global recession caused by months-long restrictions on
mobility and social and economic activity. Their Global Energy Review (IEA, 2020a) presents emissions
data for the first quarter of 2020 and emission projections for 2020 as a whole. According to this report,
global total energy-related CO2 emissions in 2020 are expected to fall to 30.6 GtCO2 (an annual decline
of 8%, or almost 2.6 GtCO2), the lowest level since 2010 (see Figure 1). Such a year-on-year reduction
would be the largest ever, six times larger than the previous record reduction of 0.4 GtCO2 in 2009 –
caused by the global financial crisis – and twice as large as the combined total of all previous reductions
since the end of World War II. A reduced lockdown period and faster recovery in the second half of 2020
in Europe and North America, and shorter lockdowns in other regions, would reduce the negative impact
on Asian manufacturing countries (IEA, 2020a). This would limit the 2020 decline in global CO2
emissions to about 5%, based on IEA’s estimates for this year’s oil, coal and natural gas consumption
(IEA, 2020a).
2This section presents data and projections for the whole 2020 period. For a more detailed breakdown of daily CO2
emissions by the Global Carbon Project see the data presented here: https://mattwjones.co.uk/covid-19/ . For a
regularly updated estimates on daily CO2 emissions see the Carbon Monitor analysis here:
https://carbonmonitor.org .
PBL Netherlands Environmental Assessment Agency / NewClimate Institute | September 2020 4Exploring the impact of the COVID-19 pandemic on global emission projections
Figure 1: Global energy-related CO2 emissions and annual changes, 1900-2020 (IEA, 2020a)
Also in April 2020, Climate Action Tracker (a collaboration between the New Climate Institute and
Climate Analytics) published a report including emission estimates and policy recommendations in
response to the pandemic (Climate Action Tracker, 2020). Their report estimates that the economic
damage caused by the COVID-19 pandemic could result in a fall in global CO2 emissions from fossil
fuels and industry by at least 4–11% in 2020. In addition, they project that 2021 emissions may change
by 1% above to 9% below 2019 levels (Climate Action Tracker, 2020).
In May 2020, Le Quéré et al. (2020) published their estimates from the Global Carbon Project in the
leading journal Nature Climate Change, showing reductions in daily global fossil CO2 emissions 3 of 17%
(11% to 25% for ±1σ) by early April 2020 compared with mean 2019 levels. Reduced surface transport
accounted for almost half of these reductions. At the peak of confinement, daily fossil CO2 emissions in
individual countries declined by 26% on average. Le Quéré et al.’s estimates of the pandemic’s impact
on 2020 annual emissions are in the same line as the numbers discussed above (Climate Action
Tracker, 2020; IEA, 2020a), with a low estimate of –4% (–2% to –7%) if pre-pandemic conditions return
by mid-June, and a high estimate of –7.5% (–3% to –13%) if some restrictions remain worldwide until
the end of 2020.
3 Fossil CO2 emissions include sources from fossil fuel use (combustion, flaring), industrial processes (cement,
steel, chemicals and urea) and fossil product use.
PBL Netherlands Environmental Assessment Agency / NewClimate Institute | September 2020 5Exploring the impact of the COVID-19 pandemic on global emission projections Finally, in the same month, Enerdata (a leading energy intelligence and consulting company) published their updated Global Energy Trends report (Enerdata, 2020), in which they estimate CO2 emissions in 2020 to decline by –8.5 %, as a direct result of reduced socio-economic activity (mostly transport and industry) and larger share of renewables in the energy mix. However, according to their projections, the strong increase of renewables in the energy mix is temporary; a rebound effect of fossil emissions in 2021 is likely, depending on economic recovery. Methodology of data sources The four sources discussed above base their projections on various trends in energy use and GDP growth. Firstly, IEA’s projections (IEA 2020a) are mainly based on the plummeting use of carbon-intensive fuels (coal, oil and natural gas) in the first half of 2020, which they extrapolated to an expected reduced demand for these fuels during the rest of this year. The IEA also assumed that global GDP would decline by about 6% in 2020, broadly in line with the Longer and New Outbreak Scenario of the International Monetary Fund (IMF, 2020c). Secondly, Climate Action Tracker’s (2020) projections for the total energy and industry CO2 emissions take into account the short-term (2020-2021) economic projections of the IMF (2020c) and other organisations, applying the full range of changes in carbon intensity of energy and industry as a function of GDP assumed in IEA’s World Energy Outlook (IEA, 2019) for 2020 and 2021 (IMF, 2020c). Thirdly, Le Quéré et al. (2020) estimated the changes in fossil fuel CO2 emissions for three levels of confinement and for six sectors of the economy, as the product of the fossil fuel CO2 emissions by sector before confinement and the fractional decrease in those emissions due to the severity of the confinement and its impact on each sector. Their detailed analysis was performed for 69 countries, 50 US states and 30 Chinese provinces, which together represent 85% of the world population and 97% of global fossil fuel CO2 emissions. Finally, Enerdata based their forecasts on energy consumption and emission projections at country and regional level, made by various international bodies including the European Commission, Organisation for Economic Co- operation and Development (OECD), IMF and the Asian Development Bank. Based on the literature discussed here, we estimate the median reduction in 2020 annual global emissions at 4% to 5% if the lockdown period is limited, and at about 8% if some restrictions remain worldwide until the end of 2020. The collective understanding is that projections for 2020 (and 2021) heavily depend on a multitude of factors: the duration and extent of the lockdowns; the time it will take to resume normal activities; the degree to which life will resume its pre-confinement course; and the effects of the economic downturn on the carbon intensity of economic activity, as the effects of the lockdowns on economic activity, GDP growth and CO2 emissions are inherently linked (Le Quéré et al., 2020). This estimated reduction for 2020 is in the order of magnitude of the yearly decrease rate required over the following decades to limit global temperature rise to 1.5oC. Given that renewable energy systems seem to be most resilient to COVID-19 lockdown measures, as demand for renewable electricity has been largely unaffected by the overall fall in energy use (IEA, 2020a), this crisis can provide opportunities to set structural changes in motion by implementing economic stimuli aligned with low carbon pathways, at least in the short term (Le Quéré et al., 2020). In the long term, additional renewable capacity additions may be hampered due to lower investments in renewables (see Section 2.3). PBL Netherlands Environmental Assessment Agency / NewClimate Institute | September 2020 6
Exploring the impact of the COVID-19 pandemic on global emission projections

However, the decline in emissions projected for 2020 is likely to be only temporary. Historical data show
that a decrease in emissions caused by a crisis is often followed by an increase in emissions during and
after economic recovery. For example, the global CO2 emissions decline of 1.4% in 2009 as a result of
the 2008–2009 Global Financial Crisis was immediately followed by a 5.1 % growth in emissions in
2010, the highest year-on-year increase on record (Le Quéré et al., 2020). Additionally, the present
economic crisis associated with COVID-19 is markedly different from previous economic crises in that
it is more deeply anchored in constrained individual behaviour, rather than in systemic issues.
Approximately 60% of the emission reductions estimated for 2020 can be attributed to the decline in
surface transport and energy demand, which are directly related to population lockdowns (sharp
decrease in public and private transport) and associated decrease in power demand from industry and
public spaces (Enerdata, 2020). For the power sector specifically, the drop in CO2 emissions is
accentuated by the increased share of renewables in the energy mix due to the plummeted demand for
fossil fuels. This trend in the energy mix is likely to be reversed once the lockdown measures are ended
and the transport and industry sectors return to pre-pandemic activity levels (Enerdata, 2020).

2.2    Emission projections up to 2030
This section assesses the effect of the COVID-19 pandemic on emission projections out to 2030, by
adjusting pre-COVID model projections using the 2020 emission estimates of the IEA and Global Carbon
Project and IMF’s GDP projections published in April 2020. We conducted these ex-post calculations
for the current policies scenario, in which we compared two GDP scenarios related to the length of the
lockdowns (Baseline versus Longer and New Outbreak (IMF, 2020c)) and two decarbonisation rates
(model rates versus reduced rates due to a rebound to fossil fuels). We compare these outcomes to
projections for the NDC scenarios and the least-costs mitigation scenarios to meet the Paris Agreement
goals.

2.2.1 Current policies scenario
Based on IMF’s (April 2020) GDP projections for 2020-2024 and model decarbonisation rates, our
ex-post calculations indicate that the impact of the general slowdown of the economy would lead
to an annual global emission reduction of –2.5 to –4.5 GtCO2e (–4% to –7%) in 2030, compared
to pre-COVID current policy projections. These numbers apply to IMF’s Baseline and Longer and
New Outbreak scenario, respectively. However, in case of a rebound to fossil fuels, with lower
decarbonisation rates, the emission reduction in 2030 is projected to be smaller (–3.0 instead of
–4.5 GtCO2e in the Longer and New Outbreak scenario) or may even turn into an increase (+0.5
instead of –2.5 GtCO2e in the Baseline scenario).

The current policies scenario projects GHG emissions assuming that all currently adopted and
implemented policies (defined as legislative decisions, executive orders, or equivalent) are realised and
that no additional measures are undertaken. To assess the impact of the pandemic on these projections,
we first calculated the median pre-COVID estimate, using the most recent (pre-COVID) current policy
projections from eight international modelling groups whose input is also used in UNEP’s 2019
Emissions Gap Report (Rogelj et al., 2019). Specifically, we used the numbers published in Roelfsema
et al. (2020), who reported results from (i) International Institute for Applied Systems Analysis
(MESSAGE–GLOBIOM model), (ii) Japan’s National Institute for Environmental Studies (AIM model),
(iii) PBL Netherlands Environmental Assessment Agency (IMAGE model), (iv) Potsdam Institute for
Climate Impact Research (REMIND–MAgPIE model) and (v) RFF–CMCC European Institute on
Economics and the Environment (WITCH model). In addition, we included (vi) Joint Research Centre
(POLES model) (Keramidas et al., 2020), (vii) the current policies projection of the IEA’s 2019 WEO
(IEA, 2019) and (viii) the Climate Action Tracker (2019). Based on the projections of these eight
modelling groups, our median estimate of global GHG emissions in 2030 for the pre-COVID-19
current policies is 60 GtCO2e (range of 56–65 GtCO2e).

   PBL Netherlands Environmental Assessment Agency / NewClimate Institute | September 2020             7
Exploring the impact of the COVID-19 pandemic on global emission projections

Next, we applied an ex-post method, inspired by Climate Action Tracker (2020), to adjust the pre-COVID
current policies model projections for 2030 to a ‘post-COVID’ estimate, based on the assumptions
outlined below. In short, we calculated the total global energy and industry-related CO₂ emissions for
the period 2020–2024 using Kaya’s equation (Kaya, 1990), in which we applied IMF’s (2020c) short-
term (2020–2024) GDP projections for two scenarios (IMF Baseline versus IMF Longer and New
Outbreak) 4 and two decarbonisation rates (CO2/GDP) (model rates and lower rates for Fossil Rebound,
see point 2 below). For the period 2025-2030, we used our ex-post calculations for 2024 as a starting
point to apply the pre-COVID estimate for the emissions growth projected by the models mentioned
above. The resulting CO2 emissions projections are based on the following assumptions:

     1. For 2020, the global fossil CO₂ emissions 5 were calculated as the CO₂ emissions in 2019 (Le
        Quéré et al., 2020) multiplied by the change in GDP in 2020 (IMF, 2020c), multiplied by the
        change in decarbonisation rate – i.e. the change in CO2 emissions per unit of GDP (CO₂/GDP).
        To estimate the latter, we conceptually mapped IMF’s (2020c) projected GDP growth rates for
        2020 (–3% in the Baseline scenario and –5.8% in the Longer and New Outbreak scenario) to
        the CO₂ emissions decline of 4.2% and 7.5% projected for 2020 by Le Quéré et al. (2020). This
        assumption resulted in decarbonisation rates of 1.2% and 1.8%, respectively, for the two IMF
        scenarios. 6 Note that these rates are significantly lower than the past decade’s average rate of
        2.7% (Le Quéré et al., 2020) and the median 2.4% projected by the model studies.
    2. For 2021-2024, global fossil CO₂ emissions were estimated by taking into account IMF’s
        (2020c) short-term (2021-2024) GDP projections for their Baseline and Longer and New
        Outbreak scenarios, and applying different decarbonisation rates, assuming two scenarios:
            a. The Model decarbonisation scenario, which assumes for 2021-2024 an annual
                CO2/GDP decrease of 2.4%, i.e. the median estimate of the decarbonisation rate based
                on the eight model studies cited above;
            b. The Rebound to fossil fuels scenario, which assumes for 2021-2024 an annual
                CO2/GDP decrease of 1.2% (IMF Baseline) or 1.8% (IMF Longer and New Outbreak).
                In other words, we assumed that the lower decarbonisation rates estimated for 2020
                (see point 1 above) would also apply to the period 2021-2024, as a result of a fossil
                rebound and possible delay in policy implementation.
        For each IMF GDP scenario and decarbonisation scenario, the fossil CO₂ emissions in 2024
        were estimated as: CO₂ emissions (2020) X Change in GDP (2020-2024) X Change in
        CO₂/GDP (2020-2024).
    3. For 2025-2030, we assumed the CO₂ emissions trends projected by the model studies, using
        the estimated CO₂ emissions in 2024 (see point 2 above) as a starting point.
    4. For 2020-2030, the non-CO₂ GHG emissions and CO₂ land-use related emissions were
        assumed to follow the same trend as the original model projections, since there is no data
        available for the impact of the COVID-19 pandemic on these emissions.

Based on the methods and assumptions outlined above, our post-COVID emission projections for the
current policies scenario out to 2030 are as follows. When accounting only for the pandemic’s expected

4 The IMF Baseline scenario assumes that the pandemic fades in the second half of 2020 and containment efforts
can be gradually unwound; the IMF Longer and New Outbreak scenario assumes that the outbreak takes longer to
contain in 2020 and that a second outbreak occurs in 2021 (IMF, 2020c). See also Appendix A.1.
5 Fossil CO emissions include sources from fossil fuel use (combustion, flaring), industrial processes (cement,
            2

steel, chemicals and urea) and fossil product use.
6
  We recognise that the IMF’s updated GDP projections published in June 2020 would change our estimated
decarbonisation rates. The pandemic-induced changes in CO2 emissions cannot be fully linked to changes in GDP
growth, but their link is assumed in our ex-post method.

    PBL Netherlands Environmental Assessment Agency / NewClimate Institute | September 2020                  8
Exploring the impact of the COVID-19 pandemic on global emission projections effects on GDP growth, we estimate that global GHG emissions in 2030 for the current policies scenario will be reduced by about 2.5 to 4.5 GtCO2e (–4% to –7%) compared to the pre-COVID current policies projection (Figure 2). These numbers apply to IMF’s Baseline and Longer and New Outbreak scenarios, respectively. More specifically, compared to the pre-COVID projection of 60 GtCO2e (range 56–65 GtCO2e), our post-COVID estimate for the current policies projection in 2030 is 57 GtCO2e (range of 53–62 GtCO2e) for the Baseline scenario, and 55 GtCO2e (range of 51–60 GtCO2e) for the Longer and New Outbreak scenario (see Table 1). The impact on the energy CO2 emissions is illustrated in Figure 3. When accounting not only for the pandemic’s expected effects on GDP growth but also assuming lower decarbonisation rates in case of a rebound to fossil fuels, the emission reduction in 2030 is projected to be smaller (–3.0 instead of –4.5 GtCO2e in the Longer and New Outbreak scenario) or may even turn into an increase (+0.5 instead of –2.5 GtCO2e in the Baseline scenario). In the latter scenario, global GHG emissions would return to 2019 levels by 2025, and in the former scenario by 2030 (Figure 2). It is important to note that the post-COVID projections presented above for the current policies scenario do not account for the recovery measures currently taken to address the economic fallout from the pandemic. In addition, the results are only indicative (based on simple calculations compared to the model-based pre-COVID projections), and strongly driven by IMF’s GDP estimates published in April 2020, which are likely to change in the coming months. Figure 2: Global total greenhouse gas emissions (median estimates) in the current policies scenario for 2010-2030, for various scenarios related to the COVID-19 pandemic. Source: this study. PBL Netherlands Environmental Assessment Agency / NewClimate Institute | September 2020 9
Exploring the impact of the COVID-19 pandemic on global emission projections

Figure 3: Global fossil CO2 emissions (median estimates) in the current policies scenario for 2010-2030,
for various scenarios related to the COVID-19 pandemic. Source: this study.

Table 1: Global total GHG emission estimates for the current policies scenarios in 2030 (median and
10th to 90th percentile range from the model studies). Post-COVID estimates are based on pre-COVID
model projections
                                                                      Global emissions in
 Current policies scenario
                                                                             2030*
                                                                            [GtCO2e]
 Pre-COVID-19
 Original model studies                                                    60 (56–65)
 Post-COVID-19 (ex-post calculations):
 Current trend (IMF Baseline, Model decarbonisation)                       57 (53–62)
 Current trend (IMF Longer and New Outbreak, Model decarbonisation)        55 (51–60)
 Rebound to fossil fuels (IMF Baseline)                                    60 (55–61)
 Rebound to fossil fuels (IMF Longer and New and Outbreak)                 57 (52–58)

* rounded to the nearest Gt.

   PBL Netherlands Environmental Assessment Agency / NewClimate Institute | September 2020 10
Exploring the impact of the COVID-19 pandemic on global emission projections
2.2.2 NDC scenarios and updates
The effect of the COVID-19 pandemic on projected emissions under the NDC scenarios is limited
so far, because NDC targets have not changed at this point (most are set for 2030). For countries
whose reduction targets are defined per unit of GDP, the pandemic will likely affect NDC
emission projections through its effects on GDP growth, but information at this level is not yet
available. Therefore, we assumed that the NDC emission projections of UNEP (2019) still apply.
Their pre-COVID NDC projections (54-56 GtCO2e in 2030) partly overlap with our post-COVID
estimates for the current policies scenarios (55-60 GtCO2e).
The NDC scenarios estimate the level of global total greenhouse gas emissions resulting from the full
implementation of the mitigation actions pledged by countries in their Nationally Determined
Contributions (NDCs) (e.g., den Elzen et al., 2016; Rogelj et al., 2016; Roelfsema et al., 2020). So far,
the emission projections for the NDC scenarios are not affected by the COVID-19 pandemic, as the
NDC reduction targets are mainly defined for the year 2030 (except for the US (2025) and some other,
smaller, countries) and these targets have not changed at this point 7. However, for countries whose
reduction targets are defined per unit of GDP, including China and India, emission projections under the
full implementation of the NDCs will depend on these countries’ GDP growth projections, which are likely
to be significantly affected by the COVID-19 pandemic. To date, there are no studies available that have
explored this effect. Furthermore, the effect of NDC updates for the 2020 Glasgow UN Climate
Conference is limited so far, because due to the pandemic this conference has been postponed to 2021
and only few (small) countries have updated their targets at this point (recent updated information will
be presented at: www.pbl.nl/indc and www.climateactiontracker.org).
Therefore, this study assumes no change in the NDC emissions projections made before the pandemic,
and adopts the numbers published by UNEP (2019) (see Table 2). According to their projections, full
implementation of the unconditional and conditional NDCs would lead to global GHG emissions in 2030
of 56 and 54 GtCO2e respectively. This range partly overlaps with our post-COVID median estimates
for the current policies scenarios (range from 55 to 60 GtCO2e in 2030, with the lower estimate
representing the Longer and New Outbreak scenario without fossil rebound, and the upper estimate
representing the Baseline scenario with fossil rebound; details see Table 1).
7
https://www4.unfccc.int/sites/NDCStaging/Pages/LatestSubmissions.aspx (accessed July 7, 2020).
PBL Netherlands Environmental Assessment Agency / NewClimate Institute | September 2020 11Exploring the impact of the COVID-19 pandemic on global emission projections
Table 2: Global total GHG emissions in 2030 under different scenarios of UNEP (2019) (median and
10th to 90th percentile range). All projections taken from UNEP (2019), except for the post-COVID
estimate (our calculations).
Number of Global emissions
Scenario models in in 2030*
set [GtCO2e]
Current policies (pre-COVID-19) 8 60 (56–65)
Current policies (post-COVID-19 estimates, based ex-post
55–60 (51–62)
calculations, see Table 1)
Unconditional NDCs (pre-COVID-19) 11 56 (54–60)
Conditional NDCs (pre-COVID-19) 12 54 (51–56)
Below 2.0°C (66% chance) 29 41 (39–46)
Below 1.8°C (66% chance) 43 35 (31–41)
Below 1.5°C in 2100 and peak below 1.7°C (both with 66%
13 25 (22–31)
chance)
* rounded to the nearest Gt.
2.2.3 Least-cost mitigation scenarios consistent with the Paris Agreement's
temperature limits
At this point, the COVID-19 pandemic is expected to have little effect on estimates of the 2030
GHG emission levels consistent with a least-cost pathway in line with the Paris Agreement goals
(limiting global average temperature rise to well below 2 °C and pursuing to limiting it to 1.5 °C).
The pathways towards 2030 may change slightly, but it is too soon to draw conclusions as the
currently observed drop in emissions is not due to structural changes.
The least-cost pathways in line with the Paris Agreement goals indicate the emission levels needed to
limit global average temperature increase to well below 2 °C and pursuing to limit it to 1.5 °C. So far,
there are no 1.5°C / 2°C scenario studies available that account for the impact of the COVID-19
pandemic. Based on the literature discussed in Chapter 2.1, the impact of the pandemic on 2020 CO2
emissions is an estimated reduction of between 1.5 and 3 GtCO2 below 2019 levels, while, on average,
reductions of 1 GtCO2 and 1.6 GtCO2 would be needed every year until 2030 to limit global warming to
2 °C and 1.5 °C, respectively (Figure 4). Based on these numbers, the pandemic is expected to have
little effect on the long-term estimate of emission levels required in 2030 to limit temperature rise to
1.5°C / 2°C. Thus, the emissions gap in 2030, defined as the difference between projected global GHG
emissions in 2030 under the NDC scenarios and emissions under least-costs pathways limiting warming
to below 2 °C and 1.5 °C, is expected to remain the same.
In terms of cumulative CO2 emissions, the estimated impact of the COVID-19 pandemic over the period
2020–2030 is a decrease of about 25 to 45 GtCO2 under the current policies scenario (about 6 to 10%
lower) compared to the pre-COVID estimates (Table 3). Thus, the pandemic is expected to slightly
reduce the implementation gap, i.e. the difference between estimated total global emissions in 2030
under the NDC scenarios versus emissions under current policies.
PBL Netherlands Environmental Assessment Agency / NewClimate Institute | September 2020 12Exploring the impact of the COVID-19 pandemic on global emission projections
Table 3: Cumulative CO2 emissions over 2020-2030, current policies scenario (median and 10th to 90th
percentile range). Pre-COVID estimate from UNEP (2019) and post-COVID estimates based on our
calculations.
Cumulative CO2 emissions over
Current policies scenario 2020-2030*
[GtCO2]
Pre-COVID-19
Original model studies 495 (460–580)
Post-COVID-19 (ex-post calculations):
Current trend (IMF Baseline, Model decarbonisation) 465 (425–550)
Current trend (IMF Longer and New Outbreak, Model decarbonisation) 450 (410–530)
* rounded to the nearest Gt.
Note: numbers include CO2 emissions from energy, industry and land use, but exclude non-CO2 greenhouse gases
Figure 4: Global CO2 emissions projections for the current policies scenarios (median estimates) for the
period 2010-2030 for various scenarios related to the COVID-19 pandemic (source: this study),
compared against the 1.5 °C and 2 °C scenarios from UNEP (2019).
PBL Netherlands Environmental Assessment Agency / NewClimate Institute | September 2020 13Exploring the impact of the COVID-19 pandemic on global emission projections 2.3 Assessment of uncertainties and sectoral rebound effects The COVID-19 pandemic has only increased the uncertainties with regard to emission projections, especially for the short-term (2020-2024). The full impact of the pandemic on emissions is yet unknown, and will depend on many factors, including the time needed to develop a vaccine, lifestyle and mobility changes, and the size and design of macroeconomic policy responses. These factors will determine whether rebound effects at the sector level will be positive or negative in terms of their climate impact. As mentioned in Chapter 2.2, our projections up to 2030 are ex-post, showing a slight decrease (4–7%) in overall emissions for that time horizon, based on the projected economic effects of the COVID-19 pandemic over 2020-2024. However, the full impact of the pandemic is yet unknown, as there are numerous other factors (other than GDP growth) that will determine the ultimate effect on emissions. One of the key issues is the duration of the pandemic and the time needed to develop a vaccine. Recovery paths around the world will be shaped by the duration of national and local lockdown and relaxation measures, public health developments such as a possible second wave of the pandemic, and even changes in lifestyle (e.g. more people working from home versus a shift from public to private transport modes). Moreover, these pathways will be influenced to a great extent by the size and design of macroeconomic policy responses (IEA, 2020b). Investments in renewable energy are also uncertain. Although they have generally shown to be more resilient to the current economic downturn than fossil energy, investments in renewable power projects are still expected to fall by 10% in 2020 compared to 2019 (IEA, 2020c). While this decrease is smaller than the decline observed for fossil fuel investments, which witnessed the largest annual fall in history (around 20%, a decline of about $400 billion, see IEA, 2020c), the flat trend in investments in clean energy and efficiency since 2015 is far from enough to put the world on a more sustainable pathway and bring a lasting reduction in emissions (IEA, 2020c). Projections with respect to recovery at the sectoral level should be treated with caution as well, especially for the short-term. The current crisis has resulted in a very different type of economic shock than has been experienced in the past. The purposeful restriction of economic activity—and restrictions on the movement of people—will likely affect emissions across sectors of the economy in very different ways than in past financial crises. For example, while the 2008 financial crisis had significant financial repercussions and led to a wave of home foreclosures, it did not restrict transport or commercial energy use in the way that is occurring today (Hausfather, 2020). In the current crisis, emissions have been reduced in almost every sector except the residential sector; as mentioned in Chapter 2.1, the transport and power sectors alone are responsible for about 60% of the reduction in 2020 emissions as they are affected most by the recession and containment measures (Enerdata, 2020). Rebound effects in these and other sectors can have both negative and positive effects on emissions (see Table 4), depending on economic recovery policies and changes in working conditions, societal norms and lifestyles. Thus, the COVID-19 pandemic has only increased the uncertainties with regard to emission projections, especially for the short-term (2020-2024). PBL Netherlands Environmental Assessment Agency / NewClimate Institute | September 2020 14
Exploring the impact of the COVID-19 pandemic on global emission projections

Table 4: Possible rebound effects by sector, with either positive or negative effects on CO2 emissions.
Source: Enerdata (2020) and this study.
 Sector                                                            Rebound effect
                                            Positive                                      Negative
 Surface Transport               Reduced commuting as more              Increased private car use and decreased
                                   people work from home               public transport use, due to fear of contagion

                                 Increased “soft mobility” (non-           Lower incentive to purchase electrical
                                  motorised transport such as             vehicles, due to low oil prices and lower
                                           bicycling)                                     incomes
 Industry                         State support conditional on             Increased production – catch up with
                                    sustainability measures                               demand

                              Self-sufficiency / local production as     Climate targets set aside due to low fossil
                                     new central paradigm                                  prices
 Power                        Lower investments in fossil fuels vs.         Reduced growth of renewable power
                               renewables this year (IEA, 2020c)           capacity this year (2020) due to lower
                                                                            renewable investments (IEA, 2020c)
                                  State support conditional on
                                    sustainability measures            Coal bounce back (especially in Asia) due to
                                                                                       low coal prices
                   Aviation     Decrease in flying, people using       Increase in flying, as a reaction to months of
                                    only necessary flights                               confinement
   International
      bunkers

                                  Airlines complying to stricter                Unconditional state support
                                       emissions standards
                                                                        Weakened international effort to implement
                                                                         pre-COVID climate protection measures
                   Shipping         Decreased global trade
 Public services                 Reduced demand for heating,
                               electricity, public sector services,
                               and offices as people work more
                                            from home
 Residential                                                             Increased energy use, especially during
                                                                         winter periods, as people work more from
                                                                                           home

                                                                          Less financial support for retrofits (e.g.
                                                                                         insulation)

                                                                        Lower incentive for retrofitting due to low oil
                                                                                      and gas prices

   PBL Netherlands Environmental Assessment Agency / NewClimate Institute | September 2020 15
Exploring the impact of the COVID-19 pandemic on global emission projections 2.4 Conclusion: General implications for policy The message is clear: while the CO2 emissions reduction in 2020 is probably unprecedented, a consistent, similar rate of decrease would need to be maintained for decades in order to achieve the 1.5 °C warming limit. The decline in emissions in 2020 due to the COVID-19 pandemic may only be temporary, if no structural changes are made. Greener investments are needed now to avoid a lock-in to carbon intensive energy sources and potential future stranding of high-carbon assets. Moreover, low- carbon development strategies and policies needs to play a key role in the economic stimulus packages that are currently being rolled out in response to the COVID-19 pandemic. Otherwise, emissions could bounce back and even overshoot previously projected levels by 2030, despite lower economic growth (Climate Action Tracker, 2020). PBL Netherlands Environmental Assessment Agency / NewClimate Institute | September 2020 16
You can also read