EGVI 10 YEARS IMPACT ASSESSMENT - Comprehensive impact assessment covering EGVI decade of existence
←
→
Page content transcription
If your browser does not render page correctly, please read the page content below

EGVI
10 YEARS
IMPACT ASSESSMENT

Comprehensive impact
assessment covering
EGVI decade of existence
EGVIA                                                ADDRESS :               CONTACT :

European Green Vehicles Initiative Association       Av. de Cortenbergh 66   P : +32 2 736 12 65

(EGVIA), non-profit organisation engaged with        B - 1000 Brussels       W : egvi.eu

the European Commission services in the EGVI                                 M : info@egvi.eu

(European Green Vehicle Initiative) public private

partnership

PAGE 2                                                                        EGVI 10 YEARS IMPACT ASSESSMENT
EGVI
10 YEARS
IMPACT ASSESSMENT
April 2019

 in collaboration
 with

EGVI 10 YEARS IMPACT ASSESSMENT   PAGE 3

PAGE 4 EGVI 10 YEARS IMPACT ASSESSMENT

Table of Content
 EXECUTIVE SUMMARY................................................................................ 7
 1. INTRODUCTION...................................................................................... 11
           A. PRESENTATION OF EGVI.................................................................................................................... 11

           B. A 10 YEARS PARTNERSHIP, TIME TO ASSESS ITS IMPACT ............................................................. 12

           C. OUTLOOK OF THE METHODOLOGY................................................................................................... 13

 2. EGVI CURRENT COVERAGE: MODULES AND DOMAINS. ............................... 17
 3. EGVI’S ROLE IN HELPING EUROPE REACH ITS CO 2 EMISSIONS OBJECTIVES 21
           A. EUROPEAN STRATEGY FOR LOW-EMISSION MOBILITY................................................................... 21

           B. EU MOBILITY DEVELOPMENT AND GHG EMISSIONS....................................................................... 22

 4. EGVI BENEFIT BY THE NUMBERS: A QUANTITATIVE IMPACT ASSESSMENT... 25
           A. 10 YEARS IMPACT ON CO2 EMISSIONS REDUCTION ...................................................................... 25

           B. ECONOMIC IMPACTS OF EGVI: R&D INVESTMENTS AND MARKET DEVELOPMENT....................... 31

 5. 10 YEARS IMPACT ASSESSMENT OF INDUSTRIAL AND SOCIETAL BENEFITS 37
 6. A RATIONALE FOR ACCELERATING R&D FUNDING IN GREEN VEHICLES........ 45
 7. LESSONS LEARNT, IMPROVEMENT AREAS AND PROPOSED EVOLUTIONS
 FOR EGVI PPP............................................................................................ 53
           A. STRENGTHS OF THE CURRENT PARTNERSHIP ............................................................................... 53

           B. WHAT SHOULD COME NEXT? IMPROVEMENT AREAS AND PROPOSED EVOLUTIONS FOR EGVI                                                              55

 8. HOW TO MOVE FURTHER IN THE NEXT 10 YERS?...................................... 59
 9. WAY FORWARD...................................................................................... 65

EGVI 10 YEARS IMPACT ASSESSMENT                                                                                                                             PAGE 5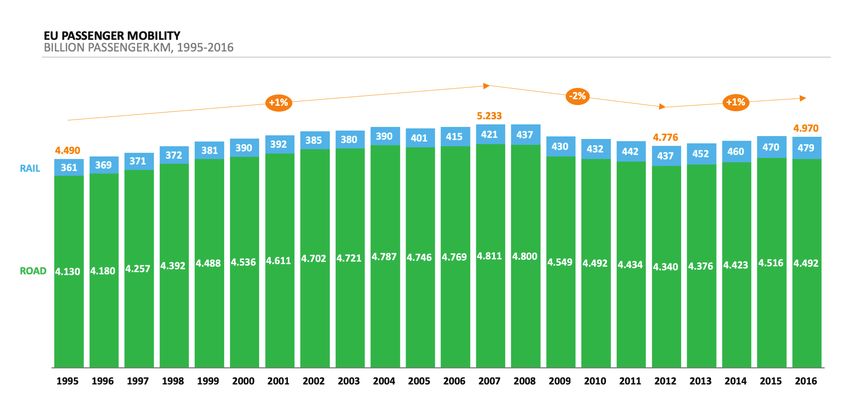
PAGE 6 EGVI 10 YEARS IMPACT ASSESSMENT

EXECUTIVE
SUMMARY
Mobility is one of the keys of European economic growth and development. Since 2012, pas-
senger and freight road mobility in Europe has been on the rise and is expected to still grow
significantly by 2030 (+10%). In the meantime, transport represents almost a quarter of Europe's
greenhouse gas emissions and is one of the main cause of air pollution in cities.
To conciliate the necessary reduction of GHG emissions with societal mobility needs, Europe's
answer should be a rapid and massive shift to low-emission mobility solutions.
In 2008, the European Green Vehicles Initiative (EGVI) cPPP has been set-up to tackle these
challenges and support the European automotive value chain to overcome the consequences of
the economic crisis. Over its 10 years duration, the European Union has funded 178 projects dis-
tributing €886 million to all stakeholders along the value chain: industry players, SMEs, research
centres, universities … via the EGVI partnership.
Covering many different areas in the field of the improvement of energy efficiency of vehicles,
EGVI has improved the performance of many vehicles types and has been a success so far by:
Helping achieve CO2 emission reduction: reduction potential amounts to 34% by 2030
compared to 2015 best in class vehicles, of which 10% thanks to fleet electrification and
24% is due to type improvements at vehicle level and improvement of traffic conditions
which EGVI projects are contributing to
Accompanying the growth of automotive R&D spending leading to highly skilled job
creation within the EU, including within SMEs & outside of the automotive industry
Supporting the European industry to enter and take a leading position in the race of
Green Vehicle technologies
Fostering new technology developments to help Europe keeps its leadership in automo-
tive innovation and low emission vehicles.
EGVI 10 YEARS IMPACT ASSESSMENT PAGE 7
However, several challenges still lay ahead for the EU low-emissions road transport:
Technical challenges: the future CO2 emissions targets are very challenging and can only be
achieved by investigating all technical options available, at an acceptable cost level
A competitive challenge: several new contenders emerging in comparison to the 2008-2017
period, especially China where the industry weight in the GDP has tripled in less than 15 years
A research funding challenge: China, USA & Japan invest between €100M and €1Bn per year
in public funded research that needs to be matched by the EU to stay in the global race.
To consolidate its achievements and deliver additional impact in the future Research Framework
Programme Horizon Europe, EGVI needs to:
Accelerate and support the roll out in serial life of new technologies already developed
Push further in-vehicle technology topics, with a specific focus on affordability and manu-
facturing
Move from a tank-to-wheel view to cradle-to-grave and full life cycle thinking on all emis-
sions type
Find the right balance between disruptive and incremental innovation projects
Expand its scope of research by developing a holistic view of the transportation system, by
deepening the links with energy production and by leveraging digital technologies
Extend its membership and collaboration to new stakeholders within automotive and outside
such as ICT, battery manufacturers, infrastructure and energy producers and distributors.
The challenge of reducing road transport emissions to deliver on environmental and socie-
tal goals is only going in one direction: getting bigger and harder to achieve. The European
RTD ecosystem has only started to deliver results in the car fleet, and more will follow
soon thanks to the activities currently performed in collaborative research, but reaching
the 2030 and 2050 targets is not getting any easier. The amount of work to be done and
the number of people to be put around the table to achieve our targets is very high and is
continuously growing. The EU needs to make sure to keep its leadership in clean vehicles
technologies and to maintain the associated necessary levels of investment in R&D and
CAPEX in order to lead the race in Green Vehicles technologies.
The achievements are already significant, but we need to continue building on the success-
ful EGVI experience to achieve a Green Vehicle fleet on European roads!
PAGE 8 EGVI 10 YEARS IMPACT ASSESSMENTEGVI 10 YEARS IMPACT ASSESSMENT PAGE 9
PAGE 10 EGVI 10 YEARS IMPACT ASSESSMENT
1. INTRODUCTION
A. PRESENTATION OF EGVI
The European Green Vehicle Initiative Association (EGVIA) is a European non-profit organisation
engaged with the European Commission services in the EGVI (European Green Vehicle Initiative)
public private partnership. It federates its 84 members around the future challenges and research
and innovation activities needs to achieve a smart, sustainable and integrated road transportation.
EGVI was created 10 years ago, following the 2008 economic crisis, to increase European
competitiveness and to keep an EU competitive edge on powertrain efficiency, alternative
powertrains and a leading edge on mobility systems in a context where technological competition
from the USA but also Asia is growing with a risk of taking over the undisputed long lasting EU lead-
ership in automotive innovation and clean powertrains.
The main activity of EGVIA is to identify research and innovation priorities and support activi-
ties performed under the relevant R&D&I projects funded under the partnership, as part of the
Horizon 2020 programme. EGVIA fosters collaboration among its members thanks to a technical
roadmap defining commonly shared objectives, its participation to the preparation of biennial calls for
projects, the sharing of information on research project results, dedicated events and networking
with public entities.
EGVIA members are typically:
Industrial companies: OEMs, suppliers, smart system providers, infrastructure
developers…
Research entities: Contract Research Organisations, Universities…
SMEs developing new technologies and services…
Since 2009, the partnership is strongly connected with three European Technology Platforms:
ERTRAC 1, EPoSS 2 and ETIP-SNET3 and covers all types of road vehicles: passenger cars, light
commercial vehicles, trucks, buses and 2-wheelers.
The EGVI cPPP role is to accelerate the research, development and demonstration of new technolo-
gies to facilitate the use of clean energies in road transportation to reduce CO2 emission from road
transport.
1. European Road Transport Research Advisory Council
2. European Technology Platform on Smart Systems Integration
3. European Technology and Innovation Platform for Smart Networks for Energy Transition
EGVI 10 YEARS IMPACT ASSESSMENT PAGE 11B. A 10 YEARS PARTNERSHIP, TIME TO ASSESS ITS IMPACT
A first assessment on the research PPPs established under the European Economic Recovery
Programme was performed in 2013 and was very supportive of the research PPP model, although
it noted that only a few projects had been completed yet and that it was still somewhat early to be
definitive about the magnitude of the effect in terms of achieved commercialisation.
EGVIA has already conducted an impact assessment in 2016. This analysis has already demonstrat-
ed tangible results obtained thanks to EGVI cPPP and was covering the 2009-2015 period. EGVI kept
accelerating after this period.
For its tenth anniversary, EGVI has decided to reflect back on its activities and to carry out a
more comprehensive impact assessment covering its decade of existence with the support of two
external consultancies: Advancy and EMISIA. Beyond the impact assessment itself, one objective is
to identify areas for improvements and opportunities for new R&D topics on clean and sustainable
mobility.
While Horizon Europe, the next Framework Programme for Research and Innovation, is currently
being discussed, this new assessment aims at reflecting what has already been achieved by EGVI
while identifying areas for improvements in the next financial framework.
The objective of this new study is to assess the benefits and impacts of EGVI cPPP on the
automotive value chain along several dimensions:
CO2 savings thanks to the market introduction of more efficient combustion engines, electri-
fication and alternative powertrains
Market development of EVs, hybrids and alternative fuels vehicles
Increase of Europe competitiveness with a specific focus on the financial crisis of 2009
Leverage effect of the PPP on private R&D investment
Creation of new jobs across the European Union
Development of new skills around E-Mobility and smart mobility systems
Emergence and participation of SMEs in the new green transportation eco-system.
PAGE 12 EGVI 10 YEARS IMPACT ASSESSMENTThis study also addresses specific topics to understand what was the contribution of the EGVI
cPPP during the last ten years in order to fuel the next programme:
Support of stakeholder to overcome the “Valley of death of innovation” and resulting in a
reduction of time-to-market of innovations introduction
Contribution of new skills being developed to keep European leadership in green and sustain-
able transportation
Value added of co-programming thanks to the involvement of private partners in the
programme definition
Project key success factors of the above successes
Potential benefits beyond the automotive industry.
C. OUTLOOK OF THE METHODOLOGY
The methodology used to perform this assessment combines three dimensions:
´´ A quantitative assessment of EGVI’s impact on CO2 emissions, based on EMISIA’s fleet and
emission projection tool SYBIL:
Detailed bottom-up fleet projection using survival curves based historic fleet composition
and age information
Integrated baseline for all EU Member States individually and EU28 as a whole
Detailed model parameters such as:
COPERT vehicle categories and trip patterns (urban / rural / highway / e-mobil-
ity)
Advanced fuel and efficiency parameters (fossil, electricity, bioethanol/biodiesel,
LPG/CNG, Hydrogen)
Detailed information on vehicle stocks and activities, covering 5 main domains of outputs:
Greenhouse gas and energy (CO2, CH 4, N 2O, fuel consumption, energy consump-
tion)
EGVI 10 YEARS IMPACT ASSESSMENT PAGE 13Fig. 1 - SIBYL model structure
´´ A quantitative and qualitative assessment of the industrial & societal impact of Green Vehicles
on European competitiveness and competencies run by Advancy:
Quantitative assessment of industrial & societal impact on the Green Vehicle product plans
and volumes designed and developed in Europe, R&D spending evolution, patents and stan-
dards
Benchmark between Europe, China, USA and Japan in terms of investment, R&D spending,
government-funded research
Qualitative assessment of the skills and non-swappable jobs creation, development of
SMEs and development of the research ecosystem in Europe.
´´ A qualitative review of EGVI strengths, success stories, improvement areas and possible need
for scope enlargement, based on stakeholder’s interviews [more than 30 interviews performed]
PAGE 14 EGVI 10 YEARS IMPACT ASSESSMENTEstablishing a direct link between EGVI projects and technologies in serial production is a very
challenging exercise, for two main reasons:
A newly launched vehicle embarks several technologies; hence, it is usually more the result
of a combination of projects rather than the direct output of a single pre-competitive project
EGVI projects are focused on the pre-competitive phase. Before reaching the commercial
stage, automotive players have to invest on their own funds to deploy new technologies on
the market and the information becomes harder to trace due to confidentiality issues.
However, the co-programming aspect of the partnership ensure that topics funded in the frame
of the EGVI cPPP are of high interest to the automotive community. Results are indeed taken to
higher TRLs and are included in the portfolio of technologies developed by each stakeholder.
EGVI 10 YEARS IMPACT ASSESSMENT PAGE 15PAGE 16 EGVI 10 YEARS IMPACT ASSESSMENT
2. EGVI current coverage: modules and domains
EGVI research topics were able to federate a large number of participants (1 000+ of which 160+
SMEs), allowing to fund more than 65 projects, leading to c.25 peer-reviewed publications between
2014 and 2017.
By addressing a large portion of the challenges faced by the full automotive value chain and
research ecosystems, it allowed to structure the pre-competitive research effort around all types of
Green Vehicle formats and to cover most of the key decarbonisation topics.
Passenger cars: EVs, Plug-in Hybrids, Full Hybrids, Mild Hybrids…
Light Commercial Trucks: EVs, Full Hybrids…
Heavy duty Trucks: Natural Gas, Electrified trucks…
Fig. 2 - Main research areas of EGVI projects
Through both Green Car and Green Vehicle initiatives, a major funding has been dedicated to
European research on road transportation decarbonisation.
EGVI 10 YEARS IMPACT ASSESSMENT PAGE 17Fig. 3 - Status of projects funded by EGCI and EGVI (2009-2018) PAGE 18 EGVI 10 YEARS IMPACT ASSESSMENT
EGVI 10 YEARS IMPACT ASSESSMENT PAGE 19
PAGE 20 EGVI 10 YEARS IMPACT ASSESSMENT
3. EGVI’s role in helping Europe reach its CO 2
   emissions objectives
A. EUROPEAN STRATEGY FOR LOW-EMISSION MOBILITY

Transport represents almost a quarter of Europe's greenhouse gas emissions and is one of the
main cause of air pollution in cities. The transport sector has not seen the same gradual decline in
emissions as other sectors: emissions only started to decrease in 2007 and still remain higher than
in 1990 (see Figure 4). Within this sector, road transport is by far the biggest emitter accounting for
more than 70% of all GHG emissions from transport in 2014. It has only recorded a decrease between
2007 and 2012 mostly due to a decrease in road mobility, in the aftermath of the 2008 economic crisis
(see Figure 4).

                                  Fig. 4 - GHG emissions in the EU – Index 100 = 1990

With the global shift towards a low-carbon, and circular economy already underway, the European
Commission's low-emission mobility strategy, adopted in July 2016, aims to ensure Europe stays
competitive and able to respond to the increasing mobility needs of both people and goods.

EGVI 10 YEARS IMPACT ASSESSMENT                                                                PAGE 21
Europe's answer to the emission reduction challenge in the transport sector is an irreversible shift
to low-emission mobility. By mid-century, greenhouse gas emissions from transport will need to be
at least 60% lower than in 1990 and be firmly on the path towards zero emission. Emissions of air
pollutants from transport that harm citizens’ health need to be drastically reduced without delay.
The strategy integrates a broader set of measures to support Europe's transition to a low-carbon
economy and supports jobs, growth, investment and innovation.
The strategy will benefit European citizens and consumers by delivering improvements in air quality,
reductions in noise levels, lower congestion levels and improved safety. Consumers will benefit from
less-energy consuming cars, from better infrastructure for alternative fuels, better links between
transport modes, better safety and fewer delays thanks to the roll-out of digital technologies.
B. EU MOBILITY DEVELOPMENT AND GHG EMISSIONS
Passenger & freight mobility in Europe, and in particular road mobility, has been on the rise since
2012.
One may think that increasing the share of rail in transport mode, especially for freight as suggested
by the White Paper on “Roadmap to a Single European Transport Area – Towards a competitive and
resource efficient transport system” published in 2001 and updated in 2011, could be an efficient
solution to reduce EU GHG emissions. However, the share of rail transport has not grown sufficiently
to replace road mobility in the last decade and no game changer take off is expected in the short to
medium-term.
Fig. 5 - Long-term passenger mobility evolution in the EU
PAGE 22 EGVI 10 YEARS IMPACT ASSESSMENTIn addition, mobility, and in particular road mobility, are expected to rise significantly by 2030 (c.+1%
p.a. long term trend) driven by the population growth, the economic development, the rise of e-
commerce and an increase in people mobility.
Most of the mobility increase will be achieved thanks
to light and commercial vehicle. The share of rail is still
very low in passenger and goods transportation as illus-
trated in Figure 6.
As it is politically and societally not acceptable to limit
mobility of people and goods, disruptive progress needs
to be made to reduce the climate and environmental im-
pact of the constantly growing road mobility needs, both
in terms of green powertrains and mobility systems.
Therefore, it is even more critical to invest more in R&D
to develop these requested technologies and PPPs like
EGVI are key contributors to achieve this objective.
To compensate for this increase in mobility, it is man-
datory to further reduce emissions of road transpor-
tation.
In this context, achieving EU’s GHG objectives will
require a step change in vehicle emissions, doubled
with an active renewal of the fleet of licensed vehicles in
Europe, by proposing Green Vehicle alternatives to
European and worldwide consumers. The final aim is to
reduce our dependency on fossil fuels for both environ-
mental purposes and economic impact by reducing oil
imports and energy dependency.
During its first decade, EGVI funded 178 projects for
a total funding exceeding €800 million; all projects
contributing to the reduction of emission directly or in-
directly. All these new technologies will be embarked
in vehicles reaching the European roads between 2014
and 2024 (typically 5 years after the project comple-
tion). EGVI ambition is to keep funding new projects in
the future to help reach these more than ever challeng-
ing emission targets.
Achieving this goal will require to broaden the
scope of emission reduction levers, to develop
new technologies, and to foster collaboration
with more players, traditional and new comers,
Fig. 6 -Passenger and freight mobility including SMEs.
forecast to 2030
EGVI 10 YEARS IMPACT ASSESSMENT PAGE 23PAGE 24 EGVI 10 YEARS IMPACT ASSESSMENT
4. EGVI BENEFIT BY THE NUMBERS:
A QUANTITATIVE IMPACT ASSESSMENT
A. 10 YEARS IMPACT ON CO 2 EMISSIONS REDUCTION
The CO2 emission reduction was calculated using 2 distinct elements:
1. The fleet composition mix.
2. Various technical measures that can reduce CO 2 at vehicle level
To ensure consistency with previously performed activities, it was decided to rely on the ERTRAC
fleet composition scenarios which included:
A highly electrified scenario that describes a situation with maximum market uptake of plug-
in hybrid electric vehicles (PHEV) and battery electric vehicles (BEV)
A partially electrified scenario which is more conservative with regard to the market
penetration of advanced electrified powertrains (PHEV and BEV)
A mix scenario that assumes substantially lower fleet electrification, halving the shares of
BEV of the partially electrified scenario.
In order to use a “neutral” basis for the calculation of the EGVI impact assessment, the CO2 impact of
the fleet composition was calculated by applying the ERTRAC “Mix” scenario values for new vehicle
registrations and comparing the result to the SIBYL baseline (see Figures 7 and 8).
Fig. 5 - LDV fleet evolution
Fig. 7 - LDV fleet evolution Fig. 8 - HDV fleet evolution
EGVI 10 YEARS IMPACT ASSESSMENT PAGE 25The various technical measures that can reduce CO2 at vehicle level have been grouped according
to the following ERTRAC measure types:
Type A: Improvements at vehicle level (e.g. powertrain)
Type B: Improved traffic conditions (e.g. green traffic light)
Type C: Traffic reduction technologies (e.g. truck load optimisation)
The calculations for the CO2 impact assessment were performed using the ERTRAC “Mix” scenario
and type A and type B measures only; type C measures have not been considered since this type
of activities are not covered by the EGVI partnership. It is noted that the CO2 reductions refer to
real-world rather than type approval values.
Because a direct link between EGVI projects and technologies embarked into the vehicles is difficult
to establish (see paragraph 1 C above), a detailed scientific assessment of the possible CO2 impact
of all the different technical measures was made as a first step4.
For each single measure, energy or CO2 reduction potentials relative to a 2015 typical vehicle of the
same type were assessed, by means of vehicle powertrain simulation models, for the vehicle cate-
gories considered. Saving potentials were defined for three different driving profiles (urban / rural /
highway) separately.
To limit uncertainty, for each measure, each vehicle type, and each driving profile, optimistic as well
as pessimistic 2050 scenarii were developed. The optimistic value represents the upper limit of
the effect a measure could have, while the pessimistic value gives a more cautious estimate of the
measures’ minimum potentials.
In a second step, the different technical measures were combined per vehicle category and class
to compute an overall efficiency improvement from the implementation of all type A and type B
measures applicable for each vehicle category and class. This was done by multiplying the individ-
ual fuel consumption reduction percentages assigned to each type A and type B measures for each
vehicle category and class.
The resulting improvements in fuel economy were then applied in the SIBYL model using the fuel
consumption evolution parameters. As an example, the fleet average CO2 value per vehicle for new
passenger cars is given in Figure 9. It needs to be highlighted that for this assessment the real-world
emission values available in the SIBYL model and the average over all vehicle sizes without compen-
sation for the vehicle mass were used, which as such, results in higher values than the CO2 industry
targets set by the European Commission.
4. See Krause et al. “EU Road Vehicle Energy Consumption and CO2 emissions by 2050 - Expert-Based Scenarios” paper submitted for publication
to the Energy Policy
PAGE 26 EGVI 10 YEARS IMPACT ASSESSMENTFig. 9 - Evolution of the average CO2 emissions (in g CO2 /km) from new passenger cars assumed for the
calculations of an ambitious pathway
Figure 9 shows the evolution of the average CO2 emissions (in g CO2 /km) from new passenger
cars in real world driving conditions. The observed reductions are due to the combined effect
of fleet composition change (i.e. the electrification effect) and the overall vehicle efficiency
improvements brought by type A and type B measures (optimistic values). For the latter a gradual
implementation (penetration) of relative technologies starting from 2020 until 2040 has been
assumed.
The reductions shown in Figure 9 in particular for the years 2025 and 2030 compared to 2021 levels
are calculated using the 2050 optimistic ERTRAC target and interpolating in 2030 with the most
ambitious CO2 reduction targets arising from the array of relevant EGVI projects. This ambitious line
shows that there is the technology potential to achieve the 15% and 37.5% reduction targets set for
new cars sold in the EU, provided that there is
on one hand, a strong electrification of the fleet and,
on the other hand, a substantial improvement of the Internal Combustion Engine, possibly
coupled with a decarbonisation of the fuel.
It is noted that the values in the graph show real-world emissions, whereas the CO2 regulatory
targets are based on the legislative driving cycle (WLTP).
EGVI 10 YEARS IMPACT ASSESSMENT PAGE 27Fig. 10 - Evolution of the average CO2 emissions (in g CO2 /km) from new heavy-duty vehicles (including
buses) assumed for the calculations of an ambitious pathway
Similarly, Figure 10 shows the evolution of the average CO2 emissions (in g CO 2/km) from new
heavy-duty trucks and buses. As in the case of passenger cars, the reductions represent here an
ambitious pathway, also calculated using the 2050 optimistic ERTRAC target and interpolating in
2030 with the most ambitious CO2 reduction targets arising from the relevant EGVI projects.
PAGE 28 EGVI 10 YEARS IMPACT ASSESSMENTFig. 11 - Relative CO2 reduction potential for the optimistic scenario Figure 11 presents the total CO2 emissions reductions potential – for the entire vehicle fleet – from the change in fleet composition, and the implementation of type A and type B measures, compared to reference emissions. This reduction potential is presented as percentage reduction over the reference CO2 values assuming no drastic change in the fleet composition and no further improve- ment in fuel efficiency after 2020. In 2030, the maximum CO 2 emissions reductions potential amounts to 34%, of which 10% is due to the fleet electrification and 24% is due to type A and type B measures to which EGVI projects are contributing to. EGVI 10 YEARS IMPACT ASSESSMENT PAGE 29
Fig. 12 - Absolute CO2 reduction potential

The Figure 12 shows the absolute emission values (in Mt of CO2 emitted) for three years – 2020,
2025 and 2030 – attributed to fleet composition change, type A and type B measures.

Figure 12 complements the above pictures by providing the reduction potential in absolute terms for
the target years 2025 and 2030.

PAGE 30                                                                          EGVI 10 YEARS IMPACT ASSESSMENT
B. ECONOMIC IMPACTS OF EGVI: R&D INVESTMENTS AND
MARKET DEVELOPMENT

R&D INVESTMENTS

R&D investment of the industry has massively increased in recent years leading to a worldwide
European leadership in automotive, with regulation being a strong driver.

EU is the world leader in automotive R&D spending (45% of world investment, at an 8% p.a. growth
rate since 2011, to reach €56B in 2017). In particular, EU R&D investment remained resilient during the
height of the 2008-2010 crisis, with a drop of only 2% in 2009 and a decrease of €2 Billion in EU.

                                  Fig. 13 - Automotive R&D spending evolution – 2007-2017

Compared to other regions, the growth of R&D spending has been strong and steady in Europe. EU
is stabilising its share of R&D around 45-46% globally. This growth is clearly driven by the need to
develop new products incorporating the new technological trends: vehicle electrification, connectiv-
ity, autonomous vehicles, light-weighting and new mobility services. The main driver are clearly car
electrification and ICE efficiency improvements which are taking a higher share of R&D spending in
EU according to stakeholders. EGVI cPPP is spending around € 85 M per year and, including the
share of private contributors, it represents around 2% of total EU R&D spending per year and has
spent in 10 years about € 850M.

EGVI 10 YEARS IMPACT ASSESSMENT                                                              PAGE 31
This has been a major positive societal impact on the support of the R&D in automotive in Europe.
Pre-competitive collaboration research activities are one of the backbone of the development of
knowledge and partnerships in the automotive industry. Without financial support from the EGVI
partnership, it is most likely that private companies would not have pursued this type of research,
hence some of the innovations developed in the last 10 years would not be available today.
EGVI and the European Union have significantly contributed to the growth of automotive R&D
spending which has been consistent and sustainable over the decade; this growing spending has
turn out into highly skilled job creation within EU.
MARKET DEVELOPMENT
Decarbonised transportation has been a strong item in the R&D agenda of EU vehicle and parts
manufacturers between 2008 and 2017, with measurable benefits at an industrial level and as a
consequence, the EU expected to take leadership positions on these technologies between 2020
and 2025.
During the 2001 through 2008 period, EU OEMs have focused their R&D efforts on Natural Gas and
Flexfuels, while significantly lagging behind Japanese and Korean OEMs in the field of electrified
powertrains (Hybrid, Plug-in Hybrid and Battery Electric Vehicles) apart from Renault and its EV
product range.
However, starting from 2012, thanks to the heavy investments in electrification R&D undertook in
the aftermath of the 2008 crisis, OEMs have managed to bring to the market the first models, while
gaining traction between 2012 through 2017 to reach 25-30% of electrified vehicle sales in Europe.
Fig. 14 - OEM market shares of passenger cars (volume) in Europe by origin of OEM
PAGE 32 EGVI 10 YEARS IMPACT ASSESSMENTIn addition, product plans show that the EU OEMs electrified vehicle (EV+Hybrid) market share in
number of new models are set to reach more than 25% of total new vehicle launches, above the
worldwide average, showing a clear inflection point and positioning themselves as leaders on this
market, especially in the field of hybrid powertrains.
Fig. 15 - Powertrain mix evolution per OEM origin
In the field of hybrid vehicles, EU OEMs are launching many new models and are getting ahead of the
race closely followed by Japan. Hybrid vehicles are expected to remain the fastest growing segment
in OEM’s product plans. This trend is likely to be sustained in the near future. Indeed, according to
known product plans and expected volumes, EU OEMs should reach by 2026 a market share of 65%
of their new launches being electrified vehicle models. This should allow them to reach approxi-
mately 40% market share in number of models starting in 2020.
The situation is more disputed in the field of Electric Vehicles, as the EU OEMs market share will
be hindered by the push of China on Electric Vehicle demonstrated by the high number of new
products launched in the last five years.
EGVI 10 YEARS IMPACT ASSESSMENT PAGE 33Fig.16 - EU market share evolution in Hybrid & Electric Vehicles At the beginning of the PPP, EGVI projects were very much focused on EV and Energy Storage Systems and move to hybrids at a later stage. This has contributed one way or the other to the acceleration of EV product launches in 2017 and onwards. On hybrids, it contributed to help European OEMs to catch up with Japanese OEMs. Hybrid vehicles were not a focus before 2011 when new model market introduction started to take off with moving from 32 new models in 2016 to a plateau of more than 170 market introductions in 2016. New EVs started to grow at the same time but at a much slower pace with a jump in 2017 with a peak at 42 in 2017 & 2018 most likely to prepare for the entry in force of EU CO2 emission regulation in 2020. This rise of electrified and green vehicles and the acceleration would not have been possible for the European OEMs without the availability of emission reduction technologies which have been partially developed in EGVI funded projects and incorporated into these vehicles. Even though it is not possible to make a direct connection between specific EGVI technologies and new vehicle models, the domination of EU players is the testimony that these technologies have been developed in Europe with the support of private and public funding. PAGE 34 EGVI 10 YEARS IMPACT ASSESSMENT
One key question for the future technological development is: will the product offer of hybrids and
electric vehicles be attractive enough to consumers to allow reaching the 2030 targets (less than
60gCO 2/100km, NEDC cycle)?

If not, efforts to further reduce ICE fuel consumption will need to be reinforced and it is expected that
diesel engines will keep a significant share of the market since theyse are 20% to 25% more efficient
than gasoline engines on long distance (which make it a relevant option for commercial vehicles).
Though, they will need to be much cleaner on NOx and particles to limit the negative impact on air
quality.

PATENTS AND INTELLECTUAL PROPERTY
Another important dimension is the development of patents to protect technology IP. In Europe, the
number of patents has been growing strongly over the last decade to reach a peak in 2013 and has
slowdown since then. EU is clearly ahead in terms of patents filled in automotive sector with more
than 50% worldwide.

                  Fig. 17 - Evolution of automotive industry patent filling split in EU per country of origin, 2008-2017

Staying in the patent race is key for EU since it protects technologies and generates revenues thanks
to royalties helping to fund new developments.

EGVI 10 YEARS IMPACT ASSESSMENT                                                                                            PAGE 35
PAGE 36 EGVI 10 YEARS IMPACT ASSESSMENT
5. 10 YEARS IMPACT ASSESSMENT OF
   INDUSTRIAL AND SOCIETAL BENEFITSS

EMPLOYMENT

Vehicle and parts manufacturing is a strong asset for the European economy and has significantly
grown in importance since the mid-2000’s.

The EU vehicles and parts manufacturing industry has traditionally been a pillar of European
industrial competitiveness. The total direct and indirect jobs in Europe reaches approximately
13 million. The manufacturing part of the sector employed directly about 2.5 million full-time
equivalents in 2016, and has increased by 2% p.a. since 2011, driven by increasing investments and
innovation in the industry gaining a total of 300.000 jobs in six years.

                              Fig. 18 - Automotive industry employees in manufacturing in Europe

EGVI 10 YEARS IMPACT ASSESSMENT                                                                    PAGE 37
When looking at job creation at European OEMs level, the growth is spectacular in the last decade
since the total worldwide R&D FTEs of EU car manufacturers have increased by about 50,000 FTEs,
which represents +50% in a decade.
Fig. 19 - Evolution of European Automotive OEM R&D Employees
Benefits are not only for OEMs but go across the full supply chain where it helps the eco-system to
be more competitive on all fronts.
As an example, one RTO was involved from the beginning of the partnership. It has been able to
dedicate 5% of its R&D headcounts to work on EGVI projects which directly or indirectly led to an
additional 5 to 10% headcount working downstream to industrialise the developed technology: it is
the “multiplier effect”.
Some European players have started a few years ago to expand their R&D employment footprint
outside of the EU and their FTEs abroad is growing. Keeping a significant level of public R&D
funding on Green Vehicles is critical to keep high-value jobs in Europe and create the future tech-
nologies for green and sustainable mobility.
PAGE 38 EGVI 10 YEARS IMPACT ASSESSMENTThere are many jobs at risk not only in R&D but also in production. We will still need significant
R&D spending on traditional ICE since it will remain a key pillar of hybrid powertrain and need to be
much more efficient, but at the same time, there is a clear need to transition some of the engineers
to new technologies and to develop the skills of tomorrow. It is also highly critical to master the key
technologies so that they can be produced in Europe. Ten thousands of workers in Europe are
producing ICE engines every day; when the EU will be transitioning to EV and other clean powertrains
solutions, we need to ensure that Europe will maintain a high level of integration in order to avoid
losing (many) manufacturing jobs. Battery production is a good example that can become a game
changer.
In 2014, a study by the European climate Foundation estimated that by reducing oil demand through
the introduction of more efficient and less carbon-consuming vehicles, EU economy could witness
a significant increase in EU GDP, and create between 350,000 and 500,000 jobs economy-wide
through avoided oil-use.
More recent figures suggest that in particular, the plug-in hybrid and battery electric vehicle
ecosystem, that requires a wide array of expertise to develop innovative components (including
batteries, software, semi-conductors) and infrastructure (including charging stations, upgrades to
the grid) could be benefit the European industry and society through jobs that are almost all skilled
or semi-skilled.
Fig. 20 - Electric vehicle impact on employment
EGVI 10 YEARS IMPACT ASSESSMENT PAGE 39If investment in the automotive sector has supported job creation, especially in R&D, the
specific investment in Green Vehicle technology yields significant upsides even beyond automotive.
A large portion of the jobs created through EV and PHEV penetration will benefit industries outside of
automotive and transportation, especially in the maintenance of charging infrastructure and grid,
electricity generation, installation and manufacturing of charging equipment.
Fig. 21 - Mix of jobs created in the electro mobility value chain
These figures need to be put in perspective with the risks weighing on the full European automotive
value chain that is likely to suffer from the move away from ICE technology as these know-hows
have been preserved as core capabilities by most OEMs and their direct suppliers, and constituted a
clear competitive advantage versus new comers (especially China).
When balancing those effects, it appears necessary for European industry to focus on capturing
a large portion of the EV manufacturing, including batteries, to be able to offset the impact and
maintain its pool of employment in Europe.
PAGE 40 EGVI 10 YEARS IMPACT ASSESSMENTFig. 22 - Car manufacturing jobs evolution vs. 2020 baseline
STRUCTURATION OF THE AUTOMOTIVE RESEARCH ECOSYSTEM
In addition to quantitative emission reduction, EGVI PPP projects have, according to project
participants, allowed to reap qualitative benefits for the European ecosystem of green road mobility
by:
Bringing together the European research ecosystem around Green Vehicles with an
appropriate time-horizon to work on, by:
Allowing sufficient collaboration time between stakeholders to achieve sizeable and
long-term projects goals: “Technology scouting early on is key to identify promising
technologies; without it, EU would not be the clear leader in Green Vehicles. Long-term
planning on green vehicle technologies is clearly an asset and should be pursued as well.
Typically, EGVI projects engage partners in a 5-year timeline: about 18 months to build
and get the project, the rest to deliver it; some national projects are shorter (for example
in UK) but it is not as effective since working for a longer period with our partners is very
beneficial. EGVI is the best tool we have to involve and make large groups of very different
entities on innovation subjects”
EGVI 10 YEARS IMPACT ASSESSMENT PAGE 41 Giving SMEs access to large industrial corporations: “EGVI projects have
allowed large companies to have access to small enterprises they would not
have known of without the PPP and vice versa: SMEs and start-up can pro-
mote their technologies to potential customers. This is also an opportunity for
engineers at large corporations to be challenged by youngers and more agile engineers”
Bringing CROs closer to industrial stakeholders: “CRO can demonstrate their skills
and tools in pre-competitive phase thanks to EGVI projects and win business later on
to help industrialise the technologies thanks to relationships you have built during
projects. EGVI projects was an excellent opportunity to improve the quality of our
simulation backbone”
Helping sustain academic research relevant to the Industry: “EGVI helped universi-
ties to keep investing in upstream research (low TRLs) by getting access to European
funding for R&D. Consequently, it also allowed to finance projects with TRL between TRL3
and 6 which are critical (Innovation death valley) for EU future competitiveness”
Enabling future commercial relationships between European companies during com-
petitive stages: “We are exposed early to the Green Vehicle Roadmaps and we start
building relationships with future client by developing new technologies in EGVI projects;
this has led years after to bilateral projects to industrialise the technology; this exposure
is key for us”.
Contributing to new skills being developed to sustain European leadership in green and
sustainable transportation:
Battery chemistry innovation in the path to higher energy density: “We have been able
to develop knowledge on battery chemistry and new materials thanks to EGVI projects,
especially useful for increased energy density”
Battery safety management to reduce hazards linked with EVs and foster faster
adoption: “Battery safety was a field in which we started from scratch and gained signifi-
cant knowledge thanks to the EGVI project”
In-vehicle software for improved vehicle system energy management: “Our project’s
system was developed for the project to act as a powertrain manager and will probably be
re-used in other applications such as ADAS / AD”.
PAGE 42 EGVI 10 YEARS IMPACT ASSESSMENT Bringing benefits outside of the automotive industry and disseminating them in the R&D
ecosystem and society as a whole:
Disseminating innovation beyond automotive through additional synergy effect
for other industries: “We are developing not only for automotive, we now work on low
emissions large engine ship powertrain, off-road”
Long-lasting impact on design capabilities through the development of tools, espe-
cially for simulation: “Thanks to EGVI projects, we have developed powerful and trustful
simulation tools, for battery systems (cooling simulation) or hybrid powertrain systems
(energy flows, emissions, EMC)”
Facilitating collaboration across the ecosystem by establishing standards &
paving the way towards interoperability: “One key benefit in working with the whole value
chain, is being able to initiate discussions about interoperability and standards and gain
understanding from the constraints of each stakeholder. For example, as a follow-up to
EGVI projects, we are working on a project dealing with Interoperability & standardisation
of charging infrastructure for buses between OEMs”
Improving road experience for EU citizens & road-users: “Users of vehicles should have
an improved on-board experience thanks to the command software that was developed
during the project, while at the same time reducing their emissions”.
EGVI 10 YEARS IMPACT ASSESSMENT PAGE 43PAGE 44 EGVI 10 YEARS IMPACT ASSESSMENT
6. A RATIONALE FOR ACCELERATING R&D
  FUNDING IN GREEN VEHICLES

However, this situation cannot be seen as sufficient to maintain European competitive advantage
in the longer term, and to sustain the societal and economic benefits attached to the achievements
completed in the field of Green Vehicles.

Europe needs to further sustain and even accelerate its investments in Green Vehicles for several
reasons.

First, there is an increasing competition in the automotive industry, with several new contenders
emerging in comparison with the 2008-2017 period, especially in China where the weight of the
industry in the GDP has tripled in less than 15 years.

                          Fig. 23 - Share of automotive industry in the GDP for key automotive country

EGVI 10 YEARS IMPACT ASSESSMENT                                                                          PAGE 45
Even if Europe is still leading the race in R&D spending with a compound annual growth rate (CAGR)
of 7%, Japan is just behind in terms of spending and growth with 6% in average per year and China
is clearly accelerating with a growth path of 21%, though starting from a much lower base.
Fig. 24 - Evolution of automotive R&D spending and split by region
Furthermore, the Chinese government has invested c.€52 Billion to reach its ambitious NEV (New
Energy Vehicle) initiative, that is targeting to achieve a c. 20% market share of Battery and Plug-in
Hybrid Electric vehicle of new vehicle sales.
PAGE 46 EGVI 10 YEARS IMPACT ASSESSMENTFig. 25 - China NEV strategy & market share target This € 52Bn package included around € 7Bn in R&D funding between 2009 and 2017 to develop the technological capabilities required, amounting to an average € 1Bn per year to sustain the research effort required to build its competitive advantage. The US are also investing heavily to bridge the gap with European and Japanese/Korean OEMs in the field, with an overall investment reaching c.€ 250M per year, with a wider approach, covering several aspects of lower emissions vehicle: hybrid electric systems, materials technology required to achieve light-weighting solutions and fuel technology. EGVI 10 YEARS IMPACT ASSESSMENT PAGE 47
Fig. 26 - US low emissions vehicle strategy

Though, the R&D Funding is very different in the US: several competitors can be involved in a single
project but it is limited to a specific step of the value chain; hence, that generates a very different
eco-system.

In Japan, despite smaller scale of the automotive industry and a high emphasis on Fuel Cell / Hy-
drogen, investments in the field of electrified vehicle (batteries, V2G and smart charging, and new
solid-state technology) seem to be reaching the same order of magnitude as in Europe.

PAGE 48                                                                         EGVI 10 YEARS IMPACT ASSESSMENT
Fig. 27 - Japan long-term goal and key R&D projects (excluding Fuel Cell R&D)

The EU funding effort in the field seems smaller in comparison, with a risk of being caught up by
international competition. Indeed, EGVI funding is well below these measures, reaching around €85
Million per year despite of a c.23% increase from 2009-2013 to 2014-2017 with more than €100
Million annual funding and an increased focus on electric drive and batteries. With a funding gap between
3X and 11X, it is key to at least maintain the R&D efforts to avoid being overtaken by these powerful
competitors.

         Average € 84M invested per year during the 2009-2013 period and € 103M
                              in 2014-2017 (+23% increase)

   EGVI 10 YEARS IMPACT ASSESSMENT                                                                            PAGE 49
The effectiveness of R&D
spending is key to ensure a
high level of Return on Invest-
ment and the European Union
has proven to be a success-
ful player when looking at the
international competition with
this approach.
Even if spending massive
amount in R&D does not
guarantee a leadership posi-
tion, when the EU is spending
significantly less than its
competitors, it is more likely
to be bypassed in the develop-
ment of new technologies.
Fig. 28 - EGVI funding over the decade &
budget until 2020
Keeping an ambitious level of funding associated with appropriate and efficient funding tools will
be critical to maintain the European Union in a leadership position in Green Vehicles.
Last, but not least, globalisation and international trade was slow down recently after the election
of President D. Trump in the US. This policy shift has reinitiated commercial trade with increasing
tariffs and strategic components and products are now being constrained not to be sold in some
countries. Europe is facing some threats: tariffs on steel and aluminium have been raised signifi-
cantly and European OEMs have been threatened of massive tariff increases on imported cars. The
next step could be to limit the access to critical components such as chips and semi-conductors
to protect the American IP and to use it as a bargaining power tool. Green Vehicle development is
highly dependent on the emergence of new electronic and software: being able to access the next
generation, or even more being independent, is highly critical.
Car electrification is calling for new power electronics and Europe has a strong asset with several
key players there (Infineon, ST Microelectronics, Valeo-Siemens, Bosch, Continental…) but we need
to ensure that they will have the skills and financial resources to keep developing these technologies
without being limited to access some elements (rare earths materials…).
PAGE 50 EGVI 10 YEARS IMPACT ASSESSMENTAll Li-Ion batteries are coming from Asia nowadays, especially from China and Korea. The full automotive industry in Europe is exposed to sharp and unplanned price increases or capacity limita- tions. It is highly critical for Europe to rely on European production: on this front the announcement in October 2017 of the creation of “Battery Alliance” is an excellent news. But Europe needs to go beyond the mass market Li-Ion technology and prepare the next generation of battery cells which will create breakthrough in performance and eliminate roadblocks in the development of EV sales. This will call for massive R&D funding to compete with the billions invested every year on this domain by other players across the world, mainly Asian companies (Panasonic, LG, Samsung, BYD, CATL….). EGVI 10 YEARS IMPACT ASSESSMENT PAGE 51
PAGE 52 EGVI 10 YEARS IMPACT ASSESSMENT
7. LESSONS LEARNT, IMPROVEMENT AREAS
AND PROPOSED EVOLUTIONS FOR EGVI PPP
A. STRENGTHS OF THE CURRENT PARTNERSHIP
According to stakeholders interviewed, EGVI PPP has achieved tremendous success on key
areas bringing forward the research topics and putting together an effective research community in
Europe around the themes of Green Vehicles for road transportation. The dynamics measured by the
increase of projects, funding and participants speaks for itself.
All interviewees stress 4 main factors to support their assessment of EGVI as a success:
The clarity of focus on technology supporting lower emissions of road transportation is a clear
success factor for EGVI and its funded projects
The appropriate coverage in types of vehicles (Passengers Cars, Commercial Vehicles, 2/3
Wheelers). In particular, with the industry being very much focused on Passenger Car emissions
due to volumes, other OEMs and suppliers were happy that EGVI covered Commercial Vehicles
as a central part of its project portfolio
An effective measurement methodology: for large projects, the technology was introduced
in a real vehicle, in real-driving conditions with measurement of impacts. When components
or budget are unavailable, robust alternatives were found by bringing together different test
environments and getting a validated simulation of components
An effective market impact stemming from EGVI programme or technology developed in the
context of EGVI programme:
“We have used elements from this battery technology to do battery development for many
companies”
“Integrated Starter-Alternator driveline that was part of EGVI project has been used in
our commercial products, with over 4,000 buses around the world already equipped.
What’s more, we were able to take quickly the EU Rise / Energy management for complete
vehicles into our commercial products"
"As an ESP, we look at what we have invested in terms of technology vs. what business we
got from our customers based on these technologies. Overall our ROI is 20:1 in lifetime
sales".
EGVI 10 YEARS IMPACT ASSESSMENT PAGE 53These successes were made possible by the core strengths of EGVI PPP, as identified by its
participants:
Setting clear and challenging technology goals for emissions and fuel efficiency:
“Our objective was to achieve -22% emissions vs. comparable Diesel technology and
fulfilling EURO 7 (-50% emissions vs. EURO 6b)”
“We had an objective of -20% consumption vs. 2014 baseline”.
Establishing an effective ecosystem management to overcome "the Valley of death of
innovation" and reduce time-to-market by:
Mobilising the right partners across the value chain in a “roundtable approach”:
Universities, CROs, OEMs, Suppliers, SMEs, start-ups…
nn “One of the main success factors was to have a roundtable approach, gathering
people form the whole value chain discussing the issues we were facing: from OEM
down to battery manufacturers: all were on-board and allowed exchange of informa-
tion at the right level (material, cell integration, scaling-up for cell production, pack
integration)”
nn “Bringing the whole value chain together and the right level of competencies in the
same project allow to have not only the right level of competences, but also a first level
of supply chain for the future once the technology is ready, thus reducing time-to-mar-
ket by at least 5 to 10 years”
nn “Bringing the stakeholder community together without collusion, to be more efficient
on R&D is one of the core strengths of EGVI PPP”
nn “We had the right profile of people involved: technical representative, technical staff
AND management”.
Involving SMEs, academia & research organisations to enrich the consortium through
additional flexibility and specific skills:
nn “SMEs bring to the table their higher degree of flexibility, in particular for research tasks
where they offer highly specialised skills (e.g. for verification & validation). The benefit
they get is to be exposed to large companies up to the OEM, and better understand
their expectations and the way they design and think of their products”
nn “We had the chance to count the Technical University of Graz as a participant in the
consortium. That helped us gain access to official testing equipment and allowed us to
participate on standardisation topics and gain in know-how”
PAGE 54 EGVI 10 YEARS IMPACT ASSESSMENT Being focused on conducting high risk / low maturity breakthrough projects: “You could never
do a project on Natural-Gas commercial vehicle (€ 28M funding) with a single company: it would
be too expensive and you would never have all the skills required in-house”
Maintaining a balanced private-public dedicated organisation avoiding administrative slow-
down and delays while fostering a trustworthy culture:
Size of the consortia is contained to avoid dispersion and inefficiencies: “EGVI has
managed to rein in the size of the consortia, and it is a good thing to keep them effective”
It is very easy to engage projects within EGVI and the process is transparent: “project
targets are clear and you know clearly the reasons why you have lost when your project was
not selected”
Innovation Time to Market is not hindered by bureaucratic processes: “engaging critical
R&D projects cannot sustain the low speed of bureaucratic organisation”
EGVI organisation is perceived as lean and agile: “We see EGVI administration as very lean
and very efficient. Bureaucracy level is low compared to other EU programmes and JU &
association fees are small as well; value added time is maximised on projects not on regular
& useless reporting”
EGVI managed to established a trustworthy and safe environment for exchange: “We feel
we have a very open communication level with EGVI: we can trust them and we feel free to
discuss sometimes sensitive topics".
B. WHAT SHOULD COME NEXT? IMPROVEMENTS AREAS AND
PROPOSED EVOLUTIONS FOR EGVI PPP
However, interviewees have also highlighted some improvement areas on which EGVI PPP could
work to further improve its impact and effectiveness which is already broadly acknowledged:
The focus of EGVI on technologies could be adjusted for the next phases:
The vehicle itself has been the core focus, by optimising the overall efficiency, when more
room could be made to also work on key component efficiency
On batteries, efforts have been more focused on battery systems and less on the cells
whereas the latter are critical for performance; it is necessary to understand why we are
lagging behind in battery cell technologies while Europe count some of the most innova-
tive chemical groups
So far, EGVI has under addressed some topics that are critical to achieve the low carbon
footprint vision for the EU within a system approach, such as the links between vehicles
and infrastructure or renewable/synthetic fuels.
EGVI 10 YEARS IMPACT ASSESSMENT PAGE 55You can also read