Affordable Housing Strategy: The Current State of Housing in the City of Guelph - Prepared by City of Guelph (October 2015)
←
→
Page content transcription
If your browser does not render page correctly, please read the page content below

Attachment 2

Affordable Housing Strategy:
The Current State of Housing
    in the City of Guelph

          Prepared by
         City of Guelph
         (October 2015)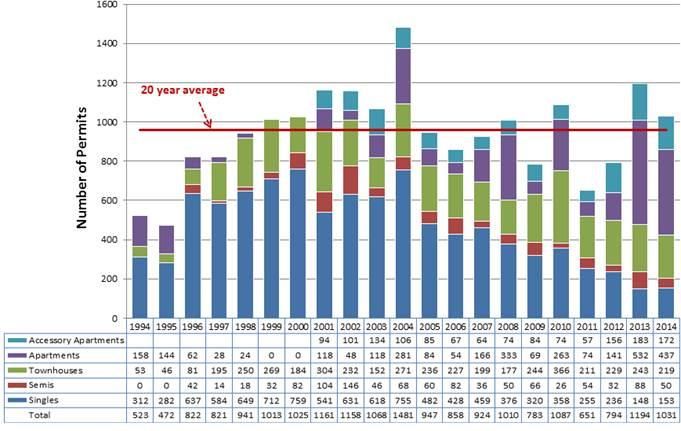
Executive Summary
This State of Housing report presents the results of Phase 2 of the Affordable
Housing Strategy. It presents a statistical analysis of demographic, economic and
housing data for Guelph, and identifies three key issues where improvements can
be made to advance the City’s targets for affordable rental and ownership housing,
as outlined in the Official Plan Update (Official Plan Amendment 48), 2012.

The primary focus of the Affordable Housing Strategy is on private market
housing for low and moderate income households. In Guelph, private market
housing represents 95% of the current housing supply (over 50,000 units).

The 10-year Housing and Homelessness Plan (HHP) for Guelph and Wellington
County – A Place to Call Home, 2013 - produced by the Service Manager (County of
Wellington) in collaboration with the City and other community providers, outlines
the community’s plan for non-market housing. The City recognizes the continued
lead role of the Service Manager in implementing the 10-year HHP. The City’s
Affordable Housing Strategy is meant to complement the HHP, by ensuring that,
where appropriate, complementary and value-added strategies are developed.

The City’s Affordable Housing Strategy will focus on policy drivers, tools and
incentives available to the City, in its role as the local land use planning authority.
It will also assist Council in responding to affordable housing funding opportunities
and the City’s potential role in funding or incenting affordable housing projects, for
example by using the City’s Affordable Housing Reserve (AHR). The opportunity to
integrate recommended actions with existing policies and processes, including other
funding sources, growth management monitoring and other monitoring processes,
will also be explored.

What is Affordable Housing?

The term "affordable housing" is often used interchangeably with "social housing."
However, social (government subsidized) housing is just one category of affordable
housing. Affordable housing is a much broader term that includes housing provided
by the private, public and not-for-profit sectors, as well as all forms of housing
tenure.

The City’s Official Plan defines affordable housing according to the Provincial Policy
Statement, 2014 and Provincial Growth Plan, 2006 definitions, as follows:

   a) In the case of ownership housing, the least expensive of:
        i.   Housing for which the purchase price results in annual accommodation
             costs which do not exceed 30% of gross annual household income for
             low and moderate income households; or
       ii.   Housing for which the purchase price is at least 10% below the
             average price of a resale unit in the regional market area.

State of Housing in Guelph, October 2015                                                 2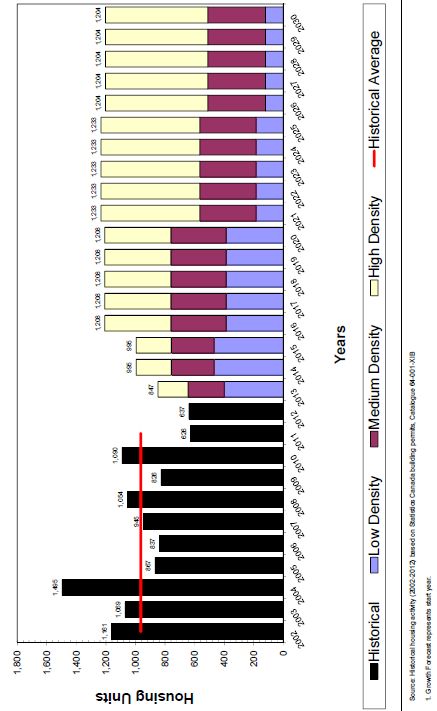
b) In the case of rental housing, the least expensive of:
        i.   A unit for which the rent does not exceed 30% of gross annual
             household income for low and moderate income rental households; or
       ii.   A unit for which the rent is at or below the average market rent of a
             unit in the regional market area.

Summary of Data Findings

Economic and Demographic Factors that Influence Housing Demand

   •   High household growth – The population of Guelph is growing, which will
       contribute to strong household formation and housing demand. The number
       of households in Guelph is projected to rise 48% between 2011 and 2031.

   •   Aging population - The population is aging, and there is an increasing
       desire among seniors to “age in place”. The increase in the proportion of
       seniors in the community will increase the demand for adaptable and
       accessible, multiple-unit housing. Affordability for seniors living on fixed
       incomes will also be a factor.

   •   Immigration – Immigration is expected to be a strong contributor of
       population growth in the Greater Golden Horseshoe area, which includes
       Guelph. Recent immigrants will increase the demand for rental
       accommodations.

   •   People on the move - Between 2006 and 2011, over 27,000 individuals
       changed houses within Guelph. In addition, 20,000 individuals moved to
       Guelph from other places. The majority of these new residents are intra-
       provincial migrants (i.e. moved to Guelph from other municipalities in
       Ontario).

   •   Low unemployment – Guelph has consistently outperformed the provincial
       average on a range of labour force indicators (i.e. participation rate,
       employment rate, etc.) over the past decade. Guelph typically holds one of
       the lowest unemployment rates in Ontario. When unemployment rates are
       low, more people are typically able to afford a house.

   •   Many commuters - The cost of housing is a determining factor in where a
       worker chooses to live. In 2011, about 25,000 workers commuted to
       positions located in Guelph, while roughly 15,000 Guelph residents travelled
       to jobs located outside the City. All told, Guelph residents held 61% of jobs
       located in the City of Guelph. The majority of external workers come from
       Waterloo Region and Wellington County.

   •   Earnings - In 2014, half of Guelph’s labour force earned less than $23 per
       hour, which equates to an annualized full-time salary of approximately
       $43,000 per year. Households whose primary income source is derived from

State of Housing in Guelph, October 2015                                               3
earnings in low paying industries and occupations tend to require affordable
housing options.
• Household Income – Average household incomes in Guelph are slightly
below the provincial average. In general, tenant households have lower
incomes than homeowners.
Household Characteristics
• Shrinking household size - At present, the average household size in
Guelph is 2.5 individuals. The average size of households has been declining
for over 20 years, and this trend is expected to continue. In Guelph, the
share of one person households has increased, while the proportion of three
or more person households has declined.
• More one person households - Individuals living alone have been the
fastest growing household type in Guelph over the past 15 years. They
currently comprise over one-quarter of all household types, and the largest
share (43%) of all renter household types.
• Seniors living alone – Seniors make up the largest segment (37%) of all
one person households. Many of these seniors are living on fixed incomes,
and will require affordable housing options. The median household income for
this group ($32,379) is the lowest of all household types.
• Age of homeowners - Three-quarters of primary household maintainers
above the age of 35 own their home, and homeownership rates remain high
throughout the senior years.
• Preferred structure type - In general, renter households tend to occupy
apartment structures while a majority of ownership households occupy single
detached dwellings. Occupancy levels reflect the nature of the rental and
ownership housing stock available.
Housing Supply
• Composition of housing stock - While there has been an increase in the
number of new apartments and townhouse units being constructed in recent
years, Guelph’s housing stock is predominantly comprised of low density
housing.
• Condominion conversions - Demolitions and rental conversions are not
resulting in a significant loss of total rental housing stock.
• Low vacancy rate - The vacancy rate for Guelph’s primary rental market is
currently 0.6% (April 2015), well below the balanced and healthy benchmark
of 3%.
State of Housing in Guelph, October 2015 4• Increasing rental rates – Between 2011 and 2014, the private market
rental rates for Guelph increased 8%, above the Consumer Price Index (CPI)
rate of inflation for Ontario of 5% during this time period.
• Secondary rental market – 45% of Guelph’s rental units are in the
secondary market, and are considered to be temporary. One-quarter of all
accessory apartments are not rented.
• Rising house prices – The average resale price of a home was $327,062 in
2013 – up 25% since 2009, well above the CPI for Ontario of 8% during this
time period.
• Non-market housing – Non-market housing represents 4% of the total
housing stock in Guelph. The City currently supports non-market housing by
providing funding support to the Service Manager, as well as through its
historic use of Affordable Housing Reserve funds to incent the development
of affordable housing units.
Housing Affordability, Adequacy and Suitability
• Affordability challenges – One-quarter of Guelph’s households spent
above the affordability threshold for housing in 2011. Renters are more likely
than homeowners to have affordability challenges.
• Lack of small housing units - There is a shortfall of bachelor and one
bedroom units, and an abundant supply of dwelling types consisting of three
or more bedrooms. The projected rise in the number of one person
households will further increase the demand for small units.
• In good conditions - Over 90% of the housing stock is in good condition,
requiring only regular maintenance and minor repairs.
• Households in core housing need - 11% of all Guelph households were
living in core housing need in 2011. The incidence is highest among renters,
lone parent households, and one person households.
The Updated Affordable Housing Benchmarks
The updated affordability targets for 2013 are:
• Ownership - $294,000 per dwelling
• Rental - $944 per month
These benchmarks were derived using market based calculations, as the rates are
lower than income based ones. The calculations are detailed in the report.
State of Housing in Guelph, October 2015 5The City is currently exceeding its affordable homeownership target to provide 27%
of new units below the benchmark price, but is not meeting the affordable rental
target of 3%.
Problem Statement
The range of housing options available in Guelph is not fully meeting the
affordability needs of low and moderate income households.
Over half of all households in Guelph cannot afford housing at the affordable
benchmark amounts.
Renter households with annual incomes at or below the 30th income percentile have
very limited housing options in the private market. In Guelph, this represents about
4,300 renter households with incomes below $23,000 (some of whom would be
living in non-market housing). These households are unable to afford a bachelor
unit, with an average market rental rate of $654 per month. Affordable options for
these households include: government subsidized housing, shared
accommodations, rooming houses, or lower cost accessory apartments. When these
options are not available, low income tenant households may be at risk of becoming
homeless due to an inability to pay market rent.
Tenant households with incomes between the 30th and 60th income percentiles may
be able to afford to rent units in the private market. However, they most likely do
not have the financial means to rent a “suitable” unit (i.e. a unit that has enough
bedrooms for the size and make-up of the household). In Guelph, there are
approximately 5,700 renter households with incomes in this range (between
$23,000 and $46,000). These households are able to afford a bachelor unit, and
some one and two bedroom units in the private market.
With respect to ownership, households with incomes between $45,000 and $89,000
(i.e. 30th and 60th income percentile for all households) may be able to afford to
enter the ownership market. In Guelph, there are about 19,000 households with
annual incomes in this range. These households can afford to purchase apartments
and some townhouse and semi-detached units.
Key Issues
Issue 1: There are not enough small units to rent or buy to meet the
affordability needs of all smaller households.
Issue 2: A lack of available primary rental supply makes it difficult for
people to find affordable rental housing.
Issue 3: The secondary rental market provides choice of affordable
dwelling types but the supply is not as secure as the primary
rental market.
State of Housing in Guelph, October 2015 6Table of Contents
Executive Summary .............................................................................................................................. 2
1. Introduction ....................................................................................................................................... 9
1.1 How To Read This Report ....................................................................................................................... 9
1.2 Data Sources and Limitations ............................................................................................................. 10
2. Affordable Housing Strategy Background ............................................................................. 11
2.1 Scope ............................................................................................................................................................ 11
2.2 Approach .................................................................................................................................................... 13
3. Defining Affordable Housing ...................................................................................................... 14
3.1 Housing Terminology ............................................................................................................................ 15
4. Demographic and Economic Factors Influencing Housing Demand ............................ 15
4.1 Population Characteristics .................................................................................................................. 15
4.1.1 Population and Household Growth ........................................................................................................... 15
4.1.2 Age Distribution ................................................................................................................................................ 16
4.1.3 New Immigrants ................................................................................................................................................ 18
4.1.4 People Who Moved........................................................................................................................................... 18
4.2 Labour Force Characteristics.............................................................................................................. 19
4.2.1 Unemployment Rates ...................................................................................................................................... 19
4.2.2 Commuting Patterns ........................................................................................................................................ 20
4.2.3 Employment Earnings .................................................................................................................................... 21
4.3 Income......................................................................................................................................................... 23
4.3.1 Income Distribution ......................................................................................................................................... 23
4.3.2 Incidence of Low Income ............................................................................................................................... 25
4.4 Summary of Demographic and Economic Data Findings .......................................................... 26
5. Household Characteristics .......................................................................................................... 27
5.1 Household Size ......................................................................................................................................... 27
5.2 Household Types ..................................................................................................................................... 28
5.2.1 Income by Household Types ........................................................................................................................ 30
5.3 One Person Households ........................................................................................................................ 31
5.4 Tenure ......................................................................................................................................................... 32
5.4.1 Tenure by Household Types ........................................................................................................................ 33
5.4.2 Tenure by Structure Type ............................................................................................................................. 34
5.5 Primary Household Maintainer ......................................................................................................... 35
5.5.1 Age of Primary Household Maintainer by Structure Type .............................................................. 36
5.6 Summary of Household Characteristic Findings ......................................................................... 38
6. Housing Supply ................................................................................................................................ 39
6.1 Existing Housing Stock .......................................................................................................................... 39
6.1.1 Structure Type ................................................................................................................................................... 40
6.2 Residential Development ..................................................................................................................... 41
6.2.1 Residential Permits .......................................................................................................................................... 41
6.2.2 Residential Demolitions ................................................................................................................................. 43
6.2.3 Condominium Conversions .......................................................................................................................... 43
6.3 Primary Rental Market ......................................................................................................................... 44
State of Housing in Guelph, October 2015 76.3.1 Average Market Rents ..................................................................................................................................... 44
6.3.2 Vacancy Rates ..................................................................................................................................................... 45
6.4 Secondary Rental Market ..................................................................................................................... 47
6.4.1 Accessory Apartments .................................................................................................................................... 47
6.4.2 Secondary Market Rental Rates .................................................................................................................. 48
6.5 Resale Housing Market ......................................................................................................................... 49
6.5.1 Average Resale Prices ..................................................................................................................................... 49
6.6 Non-Market Housing .............................................................................................................................. 50
6.7 Summary of Housing Supply Findings ............................................................................................. 53
7. Housing Affordability, Suitability, and Adequacy ............................................................... 53
7.1 Affordability .............................................................................................................................................. 54
7.2 Suitability ................................................................................................................................................... 55
7.3 Adequacy .................................................................................................................................................... 56
7.4 Core Housing Need ................................................................................................................................. 58
7.4.1 Core Housing Need by Household Type .................................................................................................. 59
7.4.2 Core Housing Need by Age ............................................................................................................................ 60
7.4.3 Core Housing Need by Household Type and Age ................................................................................ 61
7.5 Summary of Housing Affordability, Suitability, and Adequacy Findings ............................ 63
8. Updating the Affordable Housing Benchmarks ................................................................... 63
8.1 Rental Benchmark .................................................................................................................................. 64
8.1.1 How the Rental Benchmarks have Changed Over Time ................................................................... 64
8.1.2 Who Can Afford to Rent What ..................................................................................................................... 65
8.2 Ownership Benchmark ......................................................................................................................... 68
8.2.1 How the Ownership Benchmarks have Changed Over Time .......................................................... 68
8.2.2 Who Can Afford to Purchase What ............................................................................................................ 69
9. Achieving the Official Plan Amendment 48 Affordable Housing Targets ................... 72
9.1 Establishing the Target ......................................................................................................................... 72
9.2 Ownership Outcomes ............................................................................................................................ 72
9.2.1 New Residential Development .................................................................................................................... 72
9.3 Rental Outcomes ..................................................................................................................................... 74
9.3.1 Primary Rental Market ................................................................................................................................... 74
9.3.2 Secondary Rental Market .............................................................................................................................. 74
10. Findings and Conclusion............................................................................................................ 75
10.1 Problem Statement and Key Issues................................................................................................ 75
10.2 Conclusion ............................................................................................................................................... 77
References ............................................................................................................................................. 79
Appendix A – Glossary ....................................................................................................................... 82
Appendix B – Housing Continuum Methodology ...................................................................... 87
Appendix C – Secondary Rental Market Research Methodology ........................................ 89
Appendix D – Ownership Benchmark Price Methodology.................................................... 91
Appendix E – Number and Type of Units Sold in Relation to BMP ..................................... 95
Appendix F – Supplementary Household Income Percentile Tables ................................ 96
State of Housing in Guelph, October 2015 81. Introduction
Where you live impacts how you live. Having an appropriate, safe and affordable
place to call home contributes to all aspects of individual development. It promotes
positive health outcomes, supports strong educational and economic achievement,
encourages social inclusion, and helps to reduce poverty and homelessness. All of
which are essential to maintaining community health and wellbeing.
The provision of a full range of housing options to meet the changing needs of the
population is a fundamental component of the City of Guelph’s (City) sustainable
community vision. One of the key priorities of the City’s Corporate Strategic Plan
(2012-2016) is, “to ensure a well-designed, safe, inclusive, appealing and
sustainable City.” Accordingly, the City has undertaken the development of an
Affordable Housing Strategy. The primary focus of this strategy is on private market
housing for low and moderate income households.
This State of Housing report presents the results of Phase 2 of the Affordable
Housing Strategy. It presents a statistical analysis of demographic, economic and
housing data for Guelph, and identifies three key issues where improvements can
be made to advance the City’s targets for affordable rental and ownership housing,
as outlined in the Official Plan Update (Official Plan Amendment 48), 2012.
1.1 How To Read This Report
The information in this report has been organized into 11 sections, as follows:
1. Introduction – sets out the purpose and context of this report, and includes
important background information about the sources of data used in this
analysis.
2. Affordable Housing Strategy Background - provides an overview of the
purpose, scope, approach and timeline for the development of the Affordable
Housing Strategy.
3. Defining Affordable Housing – clarifies what the term “affordable housing”
means, including how much an affordable unit would cost to rent or buy in
the private market place.
4. Demographic and Economic Factors Influencing Housing Demand –
presents Guelph’s current and forecasted population, with a focus on key
demographic and economic characteristics that influence the need for and
supply of affordable housing.
5. Household Characteristics – explores the size and composition of
households by structure type, tenure, and age of the primary household
maintainer.
State of Housing in Guelph, October 2015 96. Housing Supply – describes the supply and make-up of both rental and
ownership housing in the current private market place. Also includes some
background information on non-market housing, which is primarily
administered by the local Service Manager (County of Wellington).
7. Housing Affordability, Suitability and Adequacy – examines three vital
indicators of community wellbeing individually- housing affordability,
suitability and adequacy – and then as a combined indicator of core housing
need.
8. Updating the Affordable Housing Benchmarks – describes how the
housing affordability benchmarks were set, how these benchmarks have
changed over time, and how the benchmarks compare to market prices and
local household incomes.
9. Achieving the Official Plan Amendment 48 Affordable Housing
Targets – outlines how the City has performed against the affordable
housing targets in the Official Plan Update (OPA 48) to date.
10.Findings and Conclusions – describes three key issues about housing
affordability that will guide the deliberations in the following phases of the
Affordable Housing Strategy.
11.References and Appendices – includes supplementary information, such
as a glossary of key housing terms, references, methodological and survey
details, and technical data used to determine the housing affordability
thresholds.
1.2 Data Sources and Limitations
This report presents a compilation of available demographic, socio-economic and
housing market data about Guelph. The primary sources of data for this report
include: Canada Mortgage and Housing Corporation (CMHC), City of Guelph, County
of Wellington, EMSI (Economic Modeling Specialists Intl.), Municipal Property
Assessment Corporation (MPAC), and Statistics Canada’s Census of the Population,
National Household Survey (NHS), and Labour Force Survey (LFS). For a detailed
list of definitions and data sources, please refer to the References.
It is important to note that data from the 2011 NHS is of lower quality than the
mandatory long-form Census it replaced, and some of the results show different
trends than those derived from other surveys and administrative data.
Consequently, data from the NHS has only been used when higher quality data is
not available. In addition, due to changes in the collection methodology, the NHS
data is not comparable to the Census-based estimates produced in the past, and
this has limited the historical trending and analysis possible. In such instances,
information for Ontario has been included for comparison purposes.
State of Housing in Guelph, October 2015 10Where possible, data has been presented for the Guelph Census Subdivision (CSD population 121,688 in 2011) which aligns with the boundary for the City of Guelph. In some instances, data was only available for the Guelph CMA (Census Metropolitan Area), which includes the City of Guelph, the Township of Guelph/Eramosa and the Township of Puslinch (CMA population of 141,097 in 2011). The figures and tables cite where data represents the Guelph CMA. Where Guelph is stated alone, the data is for the Guelph CSD (City of Guelph). 2. Affordable Housing Strategy Background The Affordable Housing Strategy is intended to address municipal requirements under the Provincial Policy Statement, 2014 and the Provincial Growth Plan, 2006. It builds on the City’s Official Plan Update (OPA 48, currently under appeal to the Ontario Municipal Board), which establishes a framework for planning for a range of housing types and densities, through appropriate land use designations and supporting policies. The Affordable Housing Strategy will provide further clarity around affordability issues and concrete recommendations regarding how to advance the Official Plan affordable housing target that 30% of all new residential units constructed be affordable. This target is broken down into an annual target of 27% ownership housing and 3% rental housing. While not part of the annual affordable housing target, the creation of 90 accessory apartments per year is also encouraged. The Affordable Housing Strategy will focus on policy drivers, tools and incentives available to the City, in its role as the local land use planning authority. It will also assist Council in responding to affordable housing funding opportunities and the City’s potential role in funding or incenting affordable housing projects, for example by using the City’s Affordable Housing Reserve (AHR). The opportunity to integrate recommended actions with existing policies and processes, including other funding sources, growth management monitoring and other monitoring processes, will also be explored. 2.1 Scope The current housing supply in Guelph consists of approximately 53,000 housing units – 96% of which are private market units and 4% of which are non-market units (MPAC, December 2013). As illustrated in Figure 1 – The Affordable Housing Continuum - the private market includes both private rental and homeownership. Non-market housing consists of emergency shelters, transitional housing, supportive housing, social housing and subsidized rental housing, and is generally administered by other levels of government.1 1 In accordance with the Housing Services Act, 2011, the County of Wellington is the Consolidated Municipal Service Manager (Service Manager) for Guelph, and as such, State of Housing in Guelph, October 2015 11
The primary focus of the Affordable Housing Strategy is on private market
housing for low and moderate income households.2 The 10-year Housing and
Homelessness Plan (HHP) for Guelph and Wellington County – A Place to Call Home,
2013 - produced by the Service Manager (County of Wellington) in collaboration
with the City and other community providers, outlines the community’s plan for
non-market housing. The City recognizes the continued lead role of the Service
Manager in implementing the 10-year HHP. The City’s Affordable Housing Strategy
is meant to complement the HHP, by ensuring that, where appropriate,
complementary and value-added strategies are developed.

Figure 1 – The Affordable Housing Continuum

Source: Ministry of Municipal Affairs and Housing, 2011

administers provincially legislated social services for residents of both the City of Guelph
and Wellington County. The City of Guelph is a funder of provincially mandated housing and
homelessness services, administered by the County.
2
  Households with an annual gross income at or below the 60th income percentile for the
regional market area are considered to be low and moderate income households.

State of Housing in Guelph, October 2015                                                  12
2.2 Approach
The process for developing the City’s Affordable Housing Strategy is occurring in
the following four phases, with community engagement opportunities provided at
key stages:

    1. Background - The Background Report was presented to Council in April
       2014. It sets out the context and scope of the Affordable Housing Strategy.
       It details information about various government roles, responsibilities and
       relationships, background policy documents, past studies and reports, and
       City funding initiatives.

    2. State of Housing – Over the past year, City staff have collected and
       analyzed available demographic, economic and housing market data,
       primarily from Statistics Canada, MPAC and CMHC. Due to a lack of available
       data on the secondary rental market in Guelph, two studies were undertaken
       in 2014: a Registered Accessory Apartment Survey and a Secondary Rental
       Market Study. Following preliminary analysis of the data, the City held a
       targeted focus group on February 2, 2015 with 17 stakeholders3 to review
       the data findings, and discuss the emerging affordable housing issues. This
       report presents the results of this analysis.

       The methodological details of the secondary rental market studies, and data
       collection and analysis process, is included in the Appendices.

    3. Directions – The next phase of the project will build on the data and
       preliminary housing issues presented in this report. Staff will begin by
       identifying available tools and formulating directions. Examples of tools
       include regulatory responses (e.g. Zoning Amendment), policies and
       procedures (e.g. development approvals process), financial (e.g. Affordable
       Housing Reserve) and other (e.g. partnerships, communications, advocacy).
       Community stakeholders will be consulted about the tools generated by staff
       and how could they best be used to address the affordability issues.

    4. Affordable Housing Strategy – The final report, which is scheduled for
       completion in 2016, will provide concrete recommendations regarding how to
       best support achievement of the city-wide 30% affordable housing target,
       along with mechanisms to monitor achievement of the target.

3
 Focus group participants included representatives from CMHC, County of Wellington,
Developer/Homebuilder, Guelph and District Association of Realtors, Habitat for Humanity,
COALT (Community Older Adult Leadership Team), Guelph and Wellington Task Force for
Poverty Elimination, University of Guelph, Central Student Association and the Wellington
Guelph Housing Committee.

State of Housing in Guelph, October 2015                                                13
3. Defining Affordable Housing
According to CMHC (2014), housing is considered to be affordable for a given
household if it costs less than 30% of gross (before-tax) household income. The
term "affordable housing" is often used interchangeably with "social housing."
However, social housing is just one category of affordable housing; it usually refers
to rental housing subsidized by the government. Affordable housing is a much
broader term and includes housing provided by the private, public and not-for-profit
sectors as well as all forms of housing tenure (i.e. rental, ownership – freehold,
condominium, and cooperative). It also includes temporary as well as permanent
housing. In other words, the term affordable housing can refer to any part of the
housing continuum from emergency shelters to market homeownership (see Figure
1 above).
The City’s Official Plan defines affordable housing according to the Provincial Policy
Statement, 2014 and Provincial Growth Plan, 2006 definitions, as follows:
a) In the case of ownership housing, the least expensive of:
i. Housing for which the purchase price results in annual accommodation
costs which do not exceed 30% of gross annual household income for
low and moderate income households; or
ii. Housing for which the purchase price is at least 10% below the
average price of a resale unit in the regional market area.
b) In the case of rental housing, the least expensive of:
i. A unit for which the rent does not exceed 30% of gross annual
household income for low and moderate income rental households; or
ii. A unit for which the rent is at or below the average market rent of a
unit in the regional market area.
The Provincial Policy Statement, 2014 defines households as low and moderate
income households when their total annual income falls at or below the 60th income
percentile for the regional market area. In Guelph, the 60th income percentile is
$88,656 for all households, and $43,685 for tenant households (2013). The
affordable housing benchmark is set at a price of $294,000 per dwelling for
ownership housing, and $944 per month for rental housing (Refer to section 8 –
Updating the Affordability Housing Benchmarks – of this report for detail on how
these figures were derived).
Finally, it is important to note that the affordability definition in the Provincial Policy
Statement, 2014 differs from the definition in the federal-provincial Investment in
Affordable Housing (IAH) program. For properties built/renovated through the IAH,
tenants pay no more than 80% of Average Market Rent (AMR).
State of Housing in Guelph, October 2015 143.1 Housing Terminology
The definitions of key housing terms are described in the text (or footnoted) when
they first appear. In addition, a full glossary is provided in Appendix A.
4. Demographic and Economic Factors Influencing
Housing Demand
This section of the report presents demographic and economic factors that influence
the demand for affordable housing in Guelph. The data presented here includes:
population size, growth and composition; employment and working conditions; and
household income levels. Reviewing both past trends and future forecasts helps us
to understand the community’s future affordable housing needs.
4.1 Population Characteristics
4.1.1 Population and Household Growth
The latest Census (2011) indicates that there are approximately 122,000 people
and over 48,000 households in Guelph. Municipal projections estimate that the
population will reach approximately 169,000 (excluding the Census undercount) by
2031. The total number of households is projected to reach 70,500 by 2031. The
future increase in households will outpace population growth, primarily due to
decreasing sizes of average households (see section 5 for detail). How the City
manages this growth will have a large impact on livability and community
wellbeing.
Data Highlights
There were 121,688 individuals living in Guelph in 2011.
Between 2011 and 2031, Guelph’s population is expected to grow 39%, an
increase of 50,000 people to a total of 169,000 people in 2031.
Future population growth is projected to be higher (22% between 2011 and
2021) than historical trends (15% between 2001 and 2011).
There were 48,115 households in Guelph in 2011.
Between 2011 and 2031, the total number of households is projected to rise
48%, an increase of 22,500 households to a total of 70,500 households in
2031.
Future household growth is projected to be higher (26% between 2011 and
2021) than historical trends (19% between 2001 and 2011).
Future household growth will outpace population growth.
State of Housing in Guelph, October 2015 15Figure 2 – Historical and Projected Population and Household Growth in Guelph,
2001-2031
200000
175000
150000
125000
100000
75000
50000
25000
0
2001 2006 2011 2016 2021 2026 2031
Households Population
Source: City of Guelph Planning, Urban Design and Building Services. Data from Statistics Canada, 2001,
2006 and 2011 Census, and Watson & Associates, Development Charge Background Study, 2014
4.1.2 Age Distribution
The age distribution of the population impacts the type and size of housing needed
in a community:
• 18-24 years – At the onset of adulthood, young people begin moving out of
their parental home and seeking independent accommodation. They may be
entering the workforce and/or pursuing post-secondary opportunities. They
are generally looking for shared rental accommodations, bachelor or one
bedroom units.
• 25-44 years – People in this age category are in their “prime household
formation” years, when most individuals get married, have children, and
enter the housing market.
• 45-64 years – Individuals in this age category are in their prime earning
years. Their housing needs and aspirations may also begin to change as they
have more disposable income, and their children age and leave home.
• 65-74 years – People begin to retire, but are still relatively active. According
to CMHC (2015 & 2008), there is an increasing desire among seniors to “age
in place” (i.e. continue to live in their current home and familiar community
for as long as possible, even if their health changes). This trend will create a
need for homes that can be easily adapted. Others may choose to downsize
out of lifestyle preferences, and a desire for less responsibility for looking
after a home. Research conducted by Lin (2015) found that individuals who
downsize after the age of 65 tend to move to rental accommodations,
whereas those who downsize before the age of 65 tend to stay owners.
State of Housing in Guelph, October 2015 16• 75 years and over – As individuals age, they may need support services
and assistance, such as personal care, homecare and meal preparation, to
allow them to remain in their homes. Others may need some form of
supportive housing or long-term care.
Figures 3 and 4 illustrate the 2011 Census and forecasted age distribution of males
and females living in Guelph and in the Province of Ontario. In general, the
population is aging and individuals of childbearing age are having fewer children
than previous generations. Over time, the age distribution of the population is
expected to become more uniform. There will be a decline in the proportion of
households in their prime household formation years (25-44 years), and an
increase in the proportion of seniors (65+ years). Although the absolute numbers of
people living in the community, in all age groups, will increase due to population
growth (see 4.1.1). The increase in the proportion of seniors in the community will
increase the demand for adaptable and accessible, multiple-unit housing.
Affordability for seniors living on fixed incomes will also be a factor.
Data Highlights4
In 2011, the median age of Guelph’s population was 37.7 years – 2.5 years
younger than the provincial median of 40.4 years.
The population in their prime household formation years (25-44 years)
represented 29% of Guelph’s total population – 3 percentage points more
than the provincial average of 26%.
Between 2011 and 2031, the share of Guelph’s population aged 25-44 years
is expected to decline by 2 percentage points. Although the absolute number
will increase from 34,785 to 47,780 individuals.
In 2011, older adults (55-64 years) represented 9% of Guelph’s total
population – 4 percentage points less than the provincial average of 13%.
Between 2011 and 2031, the share of Guelph’s population aged 55-64 years
is expected to increase by 2 percentage points. The absolute number will
increase from 10,860 to 18,670 individuals.
In 2011, seniors (65+ years) represented 9% of Guelph’s total population –
1 percentage point less than the provincial average of 10%.
Between 2011 and 2031, the share of Guelph’s population who will be
seniors is expected to increase by 5 percentage points. The absolute number
wil increase from 11,285 to 24,240 individuals.
4
Due to a difference in data sources and methodologies, the future population projections
for 2031 for Guelph and Ontario are not comparable.
State of Housing in Guelph, October 2015 17Figure 3 – Population Distribution by Figure 4 – Population Distribution by
Age and Sex, Guelph, 2011 and 2031 Age and Sex, Ontario, 2011 and 2031
80-84 80-84
70-74 70-74
Age Categories
60-64 60-64
Age Categories
50-54 50-54
40-44 40-44
30-34 30-34
20-24 20-24
10-14 10-14
0-4 0-4
10 5 0 5 10 10 5 0 5 10
Population (%) Population (%)
Male 2011 Female 2011 2031 Projection
2031
Male 2011 Female 2011
Projection
Source: City of Guelph Planning, Urban Design Source: City of Guelph Planning, Urban Design
and Building Services. Data from Statistics and Building Services. Data from Statistics
Canada, 2011 Census, and Hemson Consulting Canada, 2011 Census, and Ministry of Finance,
Ltd., Greater Golden Horseshoe Growth Forecasts Ontario Population Projections Update, 2011-
to 2041, 2013 2036, Spring 2012
4.1.3 New Immigrants
Recent immigrants (arrived between 2006 and 2011) represented 2% of Guelph’s
population (2,965 individuals) in 2011, compared to 4% across the province
(Statistics Canada, 2011 NHS). Immigration is expected to be an important
contributor to population growth in the Greater Golden Horseshoe area, which
includes Guelph (Hemson Consulting Ltd., 2013). According to CMHC (2015),
immigrant populations are more likely to rent when they first move to Canada.
4.1.4 People Who Moved
Mobility status refers to the movement of Canadian residents. Persons who have
not changed residential dwellings are referred to as “non-movers”, and persons who
have relocated from one residence to another are referred to as “movers”. There
are different types of movers - people who moved within the same city or town
(non-migrants); people who moved to a different city or town (internal migrants);
and people who came from another country to live in Canada (external migrants).
Between 2006 and 2011, over 27,000 individuals relocated their household within
Guelph. In addition, 20,000 individuals moved to Guelph from other places. The
majority of these new residents are intra-provincial migrants (i.e. moved to Guelph
from other municipalities in Ontario).
State of Housing in Guelph, October 2015 18Data Highlights
Between 2006 and 2011, the majority of residents in Guelph (58%) lived in
the same residence as they did five years prior – 5 percentage points below
the provincial average of 63%.
24% of Guelph’s population (20,085) relocated in the past 5 years – 3
percentage points above the provincial average of 21%.
14% of Guelph’s population (15,715) was intra-provincial migrants – 3
percentage points above the provincial average of 11%.
1% of Guelph’s population was inter-provincial migrants – on par with the
provincial average.
2% of Guelph’s population was external migrants5 – 2 percentage points
below the provincial average of 4%.
Table 1 – Population Who Moved, Guelph and Ontario, 2006-2011
Guelph Guelph Ontario
(#) (%) (%)
Lived in Same Dwelling (non-movers) 65,755 58% 63%
Moved within municipality (non-migrants) 27,300 24% 21%
Moved from a different municipality in Ontario
15,715 14% 11%
(intra-provincial migrants)
Moved from another province (inter-provincial
1,610 1% 1%
migrants)
Moved from another country (external migrants) 2,760 2% 4%
Source: Statistics Canada, 2011 NHS
4.2 Labour Force Characteristics
Employment and housing have an interdependent relationship, as most people’s
income comes from their job. A robust labour market contributes to a high demand
for housing, the type of which depends on the level of jobs in a community. An
economy with a large proportion of high-income positions, for example, tends to
lead to a demand for high-end housing. Low wage or part-time jobs can increase
the demand for affordable housing. When affordable housing options are not
available locally for the labour force, workers may purchase/rent homes outside the
community and commute to where they work. Therefore there is a need to ensure
that the local housing supply matches the economic requirements of the local
workforce.
4.2.1 Unemployment Rates
Guelph has consistently outperformed the provincial average on a range of labour
force indicators (i.e. participation rate, employment rate, etc.) over the past
decade. Guelph typically holds one of the lowest unemployment rates in Ontario.
5
External migration should not be confused with immigration. It also includes Canadian
citizens who relocate to/from other countries.
State of Housing in Guelph, October 2015 19When unemployment rates are low, more people are typically able to afford a
house.
However, low unemployment rates may present recruitment challenges for
employers, particularly those looking for skilled workers. For employers looking to
recruit workers, or invest and expand their businesses in Guelph, it is helpful if
there is a range of affordable housing options available locally for the workforce.
Data Highlights
In 2014, the unemployment rate of the labour force (individuals 15 years and
over) in the Guelph CMA was 6% - 1 percentage point lower than the
provincial average of 7%.
Between 2001 and 2014, the unemployment rate for the Guelph CMA has
consistently been lower than the provincial average.
In 2014, the participation rate for the Guelph CMA labour force was 69% - 3
percentage points higher than the provincial average of 66%.
The employment rate for the Guelph CMA labour force was 64% - 3
percentage points higher than the provincial average of 61%.
Over the past decade, the participation rate and employment rate has been
higher in the Guelph CMA in comparison to the provincial average. However,
the gap between the rates for Guelph and Ontario shrunk in 2013-2014.
Figure 5 – Unemployment Rate, Guelph CMA and Ontario, 2001-2014
10
9
8
% of Labour Force
7
6
5
4
3
2
1
0
2001
2002
2003
2004
2005
2006
2007
2008
2009
2010
2011
2012
2013
2014
Ontario Guelph CMA
Source: Statistics Canada, Tables 282-0129 and 282-0123, LFS estimates, annual
4.2.2 Commuting Patterns
The cost of housing is a determining factor in where a worker chooses to live. In
2011, about 25,000 workers commuted to positions located in Guelph, while
roughly 15,000 Guelph residents travelled to jobs located outside the City. All told,
State of Housing in Guelph, October 2015 20Guelph residents held 61% of jobs located in the City of Guelph. The majority of
external workers come from Waterloo Region and Wellington County.
Data Highlights
In 2011, Guelph’s labour force consisted of 54,510 individuals.
Guelph is the place of work for 65,100 individuals. Guelph residents hold
61% of these positions.
10,590 more workers travelled to Guelph to work than left Guelph to work
elsewhere.
14,725 individuals (27% of Guelph’s labour force) commuted to jobs located
outside of Guelph.
10% of Guelph’s labour force commuted to jobs in Waterloo Region, followed
by the GTA (8%) and Wellington County (5%).
46% of external workers came from Waterloo Region, followed by Wellington
County (27%) and the GTA (12%).
Table 2 - Commuting Flow To and From Guelph, 2011
Net Gain
Place of Work Inbound Outbound
(Loss)
Waterloo Region 11,530 5,345 6,185
GTA (Greater Toronto Area) 3,040 4,305 (1,265)
Wellington County 6,905 2,595 4,310
City of Toronto 650 1,270 (620)
Hamilton 1,420 610 810
South-western Ontario 1,245 260 985
Other 525 340 185
Total 25,315 14,725 10,590
Source: Statistics Canada, 2011 NHS
4.2.3 Employment Earnings
According to the North American Industry Classification System (NAICS), there are
20 different job sectors in Canada. In Guelph, the top five industries are
Manufacturing; Educational Services; Retail Trade; Health Care and Social Services;
and Accommodation and Food Services. Collectively, these sectors represent two-
thirds of all jobs in the city.
In 2014, the median hourly earnings among all occupations was $22.99. In other
words, half of Guelph’s labour force earned less than $23 per hour (which equates
to an annualized full-time salary of approximately $43,000 per year).
Accommodation and Food Services and Retail Trade (which collectively represent
16% of Guelph’s labour force) are generally low paying sectors. As illustrated in
Table 3, individuals holding sales and service positions earn the lowest wages of all
occupation types (median of $15.95 per hour). Households whose primary income
source is derived from earnings in low paying industries and occupations tend to
require affordable housing options.
State of Housing in Guelph, October 2015 21Data Highlights
In 2014, the top five industries in Guelph - Manufacturing; Educational
Services; Retail Trade; Health Care and Social Services; and Accommodation
and Food Services – represented 64% of all jobs.
The average annual earnings among all industries located in Guelph were
$44,366.
Among the top 10 industries in Guelph, workers on average earn the highest
in Construction ($58,577) and the lowest in Accommodation and Food
Services ($14,741).
The median hourly earnings among Guelph’s labour force was $22.99,
ranging from $38.33 for management positions to $15.95 for sales and
service jobs.
Table 3 – Earnings in the Top 10 Industries in Guelph, 2014
% Jobs Average Annual
Industry Earnings Per Job,
2009 2014 2014
1. Manufacturing 26 28 $50,521
2. Educational services 13 12 $48,489
3. Retail trade 10 9 $27,210
4. Health care and social assistance 8 9 $42,678
5. Accommodation and food services 6 7 $14,741
6. Public administration 5 5 $55,725
7. Wholesale trade 5 5 $53,628
8. Professional, scientific and technical 4 4 $58,033
services
9. Administrative and support, waste 4 4 $29,441
management and remediation services
10. Construction 3 4 $58,557
All Industries $44,366
Source: EMSI – Employees, 2015.16
6
In order to capture a complete picture of industry employment, EMSI combines
employment data from Survey of Employment, Payrolls and Hours (SEPH) with data from
the Labour Force Survey (LFS), Census, and Canadian Business Patterns (CBP) to form
detailed geographic estimates of employment. Projections are based on the latest available
EMSI industry data, 10-year past local trends in each industry and growth rates from
national industry projections from the Canadian Occupational Projection System (COPS)
produced by Human Resources and Skills Development Canada.
State of Housing in Guelph, October 2015 22You can also read