Implementation of High-Performance Network Interface Monitoring - Sami Tuomisto - Theseus
←
→
Page content transcription
If your browser does not render page correctly, please read the page content below
Sami Tuomisto

Implementation of High-Performance
Network Interface Monitoring

Metropolia University of Applied Sciences
Bachelor of Engineering
Information and communication technology
Bachelor’s Thesis
10 May 2019
Abstract

                           Sami Tuomisto
Author
                           Implementation of High-Performance Network Interface Moni-
Title
                           toring
Number of Pages
                           39 pages
Date
                           10 May 2019

Degree                     Bachelor of Engineering

Degree Programme           Information and Communication Technology

Professional Major         Smart Systems

Instructors                Keijo Länsikunnas, Lecturer
                           Risto Mettänen, System Specialist

This thesis describes the development process of a monitoring solution that is capable of
handling and crunching a vast amount of network traffic swiftly without impacting its perfor-
mance. The goal of the project, as well as the requirement, was to capture the data without
much or any loss. The project was done as a proof of concept as turning the data collec-
tion to a service was better option to extend the scalability of existing software solution.

The project started by drafting the initial sketch of the program architecture and agreeing
upon certain features that were necessary. After initial planning was done it was time to set
up the development environment and the required hardware. Only after the physical setup
was properly running the programming could begin. The first parts of the programming
consisted of getting to know the design patterns of asynchronous web servers and to study
how to transfer data over the wire effectively. After some initial server drafts it was time to
start studying the API provided by the hardware manufacturer. The API and the SmartNIC
was the most important part of the project as it was responsible for capturing and handling
the data.

The development of the program was split into parts and developed separately. The pro-
ject began by developing the server and a client for testing purposes. After successfully
sending and receiving data it moved forward to implementing the API and capturing data
from the network.

In the end, the project reached such a state that it was able to receive parameters from the
client application and start a monitoring session based on the parameters. It then pro-
ceeded to capture data matching the filter and sending it to the client packed in a Protocol
Buffer. As a result, the project was deemed to be a success as a proof of concept.

Further development for the product can be done by improving the complexity of the filter-
ing, as the SmartNIC offers wide range of tools to customize the filtering of the network
traffic. Adjusting the filtering can provide more defined information about the state of the
network and possible errors that are hampering the performance.

Keywords                      Networking, C++, Monitoring
Tiivistelmä
Sami Tuomisto
Tekijä
Implementation of High-Performance Network Interface Moni-
Otsikko
toring
Sivumäärä
39 sivua
Aika
10.5.2019
Tutkinto insinööri (AMK)
Tutkinto-ohjelma Tieto- ja viestintätekniikka
Ammatillinen pääaine Smart Systems
Ohjaajat Lehtori Keijo Länsikunnas
System Specialist Risto Mettänen
Insinöörityön tarkoituksena on esitellä projekti, jonka aiheena oli verkon monitorointi. Ta-
voitteena oli kehittää ohjelmistoratkaisu, joka pystyy monitoroimaan suuria määriä verkko-
liikennettä ilman minkäänlaista ongelmaa. Projektin tavoite sekä vaatimukset olivat, että
kaapattu data pitää saada kiinni semmoisenaan, eikä sitä saisi kadota juuri laisinkaan.
Projekti toteutettiin niin ikään näyttönä, jonka tarkoituksena oli lujittaa mielipidettä siitä, että
datan kerääminen palvelumuotoisena applikaationa on parempi ratkaisu, kun pyritään
skaalaamaan olemassa olevaa ohjelmaa suurempaan mittapuuhun.
Projektin alussa laadittiin erilaisia vedoksia ohjelmiston arkkitehtuurista sekä sovittiin,
mitkä ominaisuudet ovat tärkeimpiä projektin onnistumisen kannalta. Näiden toimenpitei-
den jälkeen aloitettiin kehitysympäristöiden asentaminen, sekä hankittiin tarvittavat laitteis-
tot. Kun laitteistot oli asennettu, pystyttiin siirtymään ohjelmoinnin pariin. Ensimmäiset vai-
heet ohjelmoinnissa olivat erilaisiin suunnittelumalleihin tutustuminen sekä datan lähettä-
minen ja vastaanottaminen kaapelin välityksellä. Ensimmäisten ohjelmaluonnosten jälkeen
siirryttiin opiskelemaan laitevalmistajan toimittamaa ohjelmistorajapintaa. Tämä ohjelmisto-
rajapinta oli SmartNIC:in lisäksi projektin kannalta kaikkein tärkeimmät seikat, koska ne oli-
vat pääsääntöisesti vastuussa datan kaappaamisesta sekä sen käsittelystä.
Projekti jaettiin kahtia ja kumpaakin osaa kehitettiin erillään toisesta. Ensimmäisessä vai-
heessa projektia pyrittiin kehittämään serveri sekä asiakasohjelma, joilla kokonaisuutta voi-
taisiin testata. Tämän vaiheen jälkeen siirryttiin työstämään ohjelmistorajapinnan käyttöä
datan kaappauksessa.
Lopulta projekti oli saavuttanut sellaisen pisteen, jossa se pystyi vastaanottamaan ehdot
monitoroinnin aloittamiseksi asiakasohjelmalta, sekä lähettämään noiden ehtojen mukaista
dataa takaisin.
Jatkokehityksenä projektiin voidaan toteuttaa monimutkaisempia ja tarkempia suodattimia
asiakasohjelman parametrien perusteella. Nämä tehokkaammat suodattimet voivat antaa
tarkempaa informaatiota verkon mahdollisista vikatiloista sekä ongelmista.
Avainsanat Tietoverkot, C++, MonitorointiContents
List of Abbreviations
1 Introduction 1
2 Overview 2
2.1 Motivation 2
3 Background 3
3.1 TAP 3
3.2 Port mirroring 6
3.3 Probe 8
3.4 Open Systems Interconnection model 8
3.5 Network Interface Controller 11
3.6 SmartNIC 11
3.7 Selected solution 12
4 Tools, libraries and classes 13
4.1 Microsoft Visual Studio 13
4.2 CMake 14
4.3 MobaXterm 14
4.4 Wireshark 14
4.5 Docker 15
4.6 NT40E3-4-PTP SmartNIC 15
4.7 Libraries and APIs 16
4.7.1 Boost 16
4.7.2 Google Protocol Buffer 17
4.7.3 JSON for Modern C++ 17
4.7.4 LibNTAPI 18
4.7.5 googletest 18
4.7.6 spdlog 19
4.8 Project classes 20
4.8.1 Buffers, pools, queues and controllers 20
4.8.2 Writers 214.8.3 ProtoBuilder 21
4.8.4 Streams and containers for them 21
4.8.5 Filtering 22
4.8.6 Keys 22
4.8.7 Configurations and arguments 23
5 Architecture 24
5.1 Object pool 27
5.2 Server 27
6 Implementation 28
6.1 Creating the server and the client 28
6.2 Installing and getting to know Napatech 30
6.3 Starting to write capture software 31
6.4 Implementing primitive filtering 32
6.5 Refining filtering 33
6.6 Tackling the threads 34
6.7 Sending captured data to client 35
6.8 Sending Protocol Buffers 36
6.9 Protocol Buffers in filtering 37
6.10 Simplify test client 37
6.11 Adding flexibility to the server 38
7 Results 38
8 Conclusions and further development 39
References 40List of Abbreviations
SmartNIC Smart Network Access Interface. A computer hardware component that
enables the computer to connect to a network.
UDP User Datagram Protocol. Allows computer applications to send messages
to other hosts in the network.
TCP Transmission Control Protocol. Main protocol in the Internet Protocol suite.
Provides ordered, reliable and error-checked delivery of stream of octets.
SCTP Stream Control Transmission Protocol. Networking protocol that operates
at the transport layer and acts similarly to UDP and TCP.
RHEL7 Red Hat Enterprise Linux 7. A distribution of Linux targeted for commercial
use.
TAP Terminal Access Point. System that monitors the network events and pro-
vides aid in analyzing it.
SPAN Switched Port Analyzer. Port mirroring is generally referred as SPAN in
Cisco System’s switches.
RSPAN Remote Switch Port Analyzer. Same as SPAN but allows monitoring of traf-
fic from source ports of multiple different switches.
MAC Medium Access Control. Part of the Data Link Layer which controls the
hardware that is responsible for interacting with the wire or wireless media.
LAN Local Area Network. A computer network within a limited area that inter-
connects computers.
ASIC Application-specific integrated circuit. An integrated circuit that is tailored
for a specific purpose.
FPGA Field-programmable gate array. An integrated circuit that can be configured
by the user.SOC System on Chip. An integrated circuit that can contain all the necessary
components of a computer or an electrical system.
IDE Integrated Development Environment. Software application that provides
an environment where to develop code. Often consists of at least a source
code editor, build tools and a debugger.
STL Standard Template Library. A set of common classes for C++ that influence
many parts of the C++ Standard Library.
OS Operating System. A software that handles hardware and software re-
sources.
API Application Programming Interface. A clearly defined set of functions and
methods used to interface two components.1 1 Introduction The services and functionalities of today’s life are built upon a complicated network struc- ture that is constantly changing and evolving to allow more and more connections with ever increasing transfer speed. Transactions and communication flow through the wire and even a slightest disturbance in the connectivity can cause severe issues in daily routines of the users. Monitoring the state and the performance of the network is important to guarantee the best possible service to the users. Different monitoring techniques and solutions have been developed to diagnose issues in connectivity, such as monitoring software or even physical devices that are connected to the wire. Depending on the selected monitoring solution there can be noticeable degradation of the service or other issues such as packet loss. The purpose of this thesis was to explore different monitoring options and describe the design and implementation of a project that was used to monitor high speed connections in mobile networks. The project was planned to be a part of a larger software structure and a proof of concept. The goal of the project was to separate the data collection from existing software and turn it in to a running service that could reliably provide the re- quested monitoring data to the client. Due to the vastness of the project, the thesis focuses mainly on implementing the data capture and processing and partly covers the data transferring between client and the server.
2

2     Overview

The project served as a proof of concept and was done for Nokia. The purpose was to
separate data collection from an existing software solution and turn it in to a data collector
software that was able to answer requests from other programs or client applications.
The data that could be requested was limited at the beginning, but it could easily be
expanded within the capabilities of the network card. The card that was used in the pro-
ject is produced by Napatech. It is part of the Smart Network Interface Cards (SmartNIC)
family and it is capable of processing large chunks of data segments rapidly. It offers
wide range of useful features to handle incoming traffic while still having negligible impact
on the performance of the network.

Monitoring the network is important because it provides vital information for different is-
sues. For example, the monitoring data can be used to pinpoint a malfunctioning base
station in the mobile network or use the data to develop machine learning algorithms.
The SmartNIC provides multiple different ways to define which type of data is to be cap-
tured. The project was initially interested in capturing only UDP, TCP and SCTP data.

The program that was developed and described in this thesis was written in C++ utilizing
drivers and libraries provided by Napatech, as well as Boost and some third-party librar-
ies. The final product was planned to be used in UNIX environment. The main develop-
ment tools were Microsoft Visual Studio 2017, CMAKE and a server running Red Hat
Enterprise Linux 7 (RHEL7).

2.1    Motivation

While every year connectivity increases as more and more items are introduced to the
network and can transmit data, providing proper tools to maintain and monitor those net-
works become increasingly important. The motivation for this thesis came from the desire
to learn how networks operate and how data could be transferred securely and effectively
over the wire.
3

3     Background

Network monitoring is important as it provides vital information to administrators of the
network in case there is an anomaly in the performance. The monitoring could be imple-
mented by using a Network TAP (Terminal Access Point) or a port mirroring. Both have
their time and place as well as strengths and weaknesses. A probe is best described as
a program or device that utilizes the received data from a TAP and visualizes or other-
wise processes it to provide useful information.

This section of the thesis covers some of the existing monitoring solutions and how they
function, how the network layers are stacked and what they do and how does the Smart-
NIC compare to ordinary NIC. These are important concepts to grasp prior to developing
a monitoring application.

3.1    TAP

A Network TAP is often a dedicated hardware device, which is inserted in the network.
It is installed between the device that is to be monitored and the network. When the
packets arrive to the monitored device, the TAP copies them and sends the copies to
probes or analytics systems. This monitoring solution has existed for a long time. During
the early days of the network it was done for the copper wires. Nowadays it is done for
the optic fibers.
4

Figure 1.   Diagram displaying TAP device with three ports.

The TAP device consists of at least three ports: A, B and monitoring port. In Figure 1 the
TAP device copies the packets in the AB wire to the Monitoring wire. This is the simplest
form of TAP since it only copies the data. More complicated version of TAP could per-
form, for example filtering and send only the requested packets to the Monitoring wire.
Placing the TAP as a monitoring device in the network can introduce unwanted interac-
tions. If the device crashes or is booted, the network will stop as it is installed in-line.

The physical TAP device can be switched to a Tapping system to counter the issue of
crashing the network if the device encounters an error or is rebooted. From Tapping
systems, V-Line Tapping is the most important, as it allows the network to continue op-
erating even if the TAP is not operational at the time. In V-Line Tapping, the system is
installed in-line but it keeps sending heartbeat packets to the system at the end of the
Monitoring wire, to check if it is still available. If the TAP does not receive heartbeat
acknowledgement from the system, it enters a bypass mode in which it directs the traffic
normally from A to B. However, if the system responds to the heartbeat the traffic is
copied over to the Monitoring wire.
5

Figure 2.   In-Line Bypass TAP with a Monitoring system

In Figure 2, if the Monitoring system (depicted as a circle) does not respond to the heart-
beat packet, the TAP triggers the Bypass mode and stops sending traffic to Monitoring
wire. The TAP continues to send heartbeats to the Monitoring system in case it becomes
active again.

The benefits of using a TAP to monitor a network lie in the reliability. TAP eliminates the
risk of dropped packets and received all the traffic, including physical errors. It also pro-
vides complete visibility into full-duplex networks as it transmits both the received and
sent data simultaneously on separate channels. Downside of implementing a TAP solu-
tion are the costs that increase when higher levels of OSI model are required to be mon-
itored.

The internal hardware of TAPs contains often different type of splitters that do what the
name implies, split the signal. An optical splitter is used with optical fiber connections
and copper TAPs are used with original twisted pair cables. As the name suggests, an
optical splitter operates on signals generated by light and copper splitters operates on
signals generated by electricity.

Traditionally the light in the optical fiber is split fusing two cables together in a such way
that the light carrying the signal is partially funneled off to the second cable. This method
is called Fused Biconical Taper (FBT). Another type of splitter uses thin film technology
6

which takes advantage of reflections. A light is basically shone through a window and a
portion of that light is reflected.

3.2   Port mirroring

Port mirroring is a process where the network switch sends a copy of network packet
received in one port, to another switch port which is used to monitor the network. In Cisco
Systems switches port mirroring in referred to Switched Port Analyzer (SPAN) or Remote
Switched Port Analyzer (RSPAN). Each switch manufacturer has their own name for the
technology.

According to Cisco’s documentation regarding port mirroring, SPAN is an important con-
figuration in a switch to ensure that the probe can receive the traffic. Compared to a hub
which sends the incoming traffic to all ports, switch learns the destination MAC ad-
dresses and forwards traffic only to ports that corresponds to the right MAC. Therefore,
the probe does not receive any traffic, except traffic that is flooded to all ports. [1] If the
switch does not know who should receive the data, it will send it to all connected ports
and leave it up to the receiving end to decide if the data is meant for them. In this case
the sniffer will receive the data.
7

Figure 3.   The switch does not know the MAC address of Client B and therefore sends all traffic
            to connected ports.

Figure 3 demonstrates the case where the switch has not learned all the MAC addresses
and will flood the traffic to all ports. When the correct recipient of the data is learned, the
MAC address of that client is added to the switch’s routing table and further traffic pointed
to that address is automatically forwarded.

Figure 4.   The switch knows that the data from Client A is meant for Client B and forwards it
            straight to the correct recipient.
8 In Figure 4 the switch is aware of Client B’s MAC address and can forward the data directly to it without needing to flood it to every connection. This data is undetectable to the sniffer. Compared to TAP, port mirroring is a low-cost solution and remotely configurable as the network switches are often configured to be accessible remotely. If the network traffic becomes too intense, SPAN might start dropping packets to keep pace with the traffic. It also requires more from the switch, as it now needs to copy the traffic to a designated monitoring port. 3.3 Probe Probe is a device or a software that is used to extract metadata from the network traffic which is received from a TAP or a SPAN. Probes are mainly used for troubleshooting the network issues, for visualizing the traffic and for providing insight for the administra- tors. Network probes can operate either passively or actively. Passive probes do not generate any traffic in the network as they just receive the packets and process them. Active probes are mainly used for end-to-end monitoring between different nodes and requires an active probe to generate data, which is then received by another probe. The perfor- mance of the network is monitored and assessed from the results generated by probes. 3.4 Open Systems Interconnection model The development of the Open Systems Interconnection model (OSI model) was started in 1977 by the International Organization of Standardization (ISO). They noticed that there was an urgent need for standards in network communications to allow creation of heterogenous informatic networks. Even though experimental computer networks, such as ARPANET, had already been under development and considered to be hetero- genous, each manufacturer had their own way of connecting their equipment. This re- sulted in a situation where equipment from two different manufacturers were incompati- ble or required hard work, when it came to be connecting these two pieces so that the communication functioned correctly. [2, p. 425]
9

Open Systems Interconnection model (OSI model) is a conceptual model which de-
scribes the standardized way the communication should be conducted in the network.
The model consists of seven layers, each serving to the layer above. The seven layers
of the model from the lowest to the highest are as follows: Physical, Data Link, Network,
Transport, Sessions, Presentation and Application. Each layer has a specific task and
set of protocols that is unique to that layer.

When data passes through the stack it is handled as a protocol data unit (PDU). Each of
these protocol data units contain a payload which called service data unit (SDU) and
protocol-related headers. For example, when the data starts from the application layer
and proceeds down the stack, each layer concatenates the encapsulated data with a
header related to that specific layer. When the data reaches the lowest level, it is trans-
mitted to the receiving device. The data then moves up the stack as a series of service
data units as the layers strip the headers away, passing only the contained payload up
to the next level.

Figure 5.   Layers, corresponding PDU and the number of headers in encapsulated data for each
            layer.

Figure 5 illustrates the stack of the OSI model and displays the corresponding PDU next
to the layers. The encapsulation demonstrates the number of headers for each layer, as
the data flows down from the application layer towards the physical layer. Physical layer
10 does not apply any headers of its own as it is responsible for transmitting the data instead of further encapsulating it. Three of the lowest levels of the OSI model (Physical, Data Link, Network) are grouped as Media layers. They are responsible for sending and receiving the data as well as making sure that the transmitting and receiving happens. Physical layer handles the hardware level operations that include mechanical and electrical operations. It receives and transmit the data in its rawest format, as electrical, radio or optical signals. The data link layer receives the data from physical layer, detects possible errors in it and tries to correct them. It handles the data frames and their transmission between two nodes that are connected by the physical layer. The network layer hides all the oddities from the next layer (Transport) as it does not need to be concerned with the actual transfer medium. This way the network layer pro- vides independence from relaying and routing considerations as well as from the data transfer technology. The data transferred at this layer can be of varying length. If the length of the data to be transmitted is too large, it can be chopped to smaller segments that are then transmitted and constructed on the receiving end. Data sequences at this layer are called packets. Transport layer provides transparent transfer of data between the end systems. By providing reliable and efficient data transfer, the upper layers can focus solely on their own functionality. Transport layer can tract the segments that it transmits and therefore retransmits the segments that fail delivery. The session layer handles the establishing, management and termination of connections between applications. These applications can be local or remote. According to Huber Zimmermann in his paper OSI Reference Model – The ISO Model of Architecture for Open Systems Interconnections, the session layer provides services two types of ser- vices. Firstly, it can bind and unbind two presentation entities into a relationship. This service is called session administration service. Secondly, it controls data exchange, delimiting and synchronization operations between two presentation entities. This sec- ond service is called session dialogue service. [2, p. 430]
11

Presentation layer provides independence to the application process by allowing the ap-
plication layer entities to use different syntax and semantics if the presentation layer pro-
vides the required mapping for them. John D. Day and Huber Zimmermann state in their
paper, The OSI Reference Model, that the presentation layer’s protocol allows the user
to select a “Presentation Context”. They continue to explain that the Presentation Context
can be application specific, i.e. library protocol. [3, p. 1338]

The last of the layers, application layer, is the closes one to the end user. This means
that both the user and OSI application layer interact directly with the software. Typical
functions of application layer are for example determining available resources and syn-
chronizing communication.

3.5     Network Interface Controller

Network Interface Controller (NIC, also known as Network Interface Card, Network
Adapter, LAN Adapter or Physical Network Interface) is a hardware component that al-
lows the computer to connect to a network. The NIC acts as both the physical and data
link layer device. During the early days of the Internet the network cards were designed
as extension cards that could easily be plugged in a motherboard. In the end, it was the
ubiquity of the Ethernet standard combined with the low costs, which lead to including
these networking capabilities directly into the motherboards. Nowadays these Ethernet
capabilities come from chipsets integrated directly into the motherboard or from a low-
cost dedicated Ethernet chip, making a separate network cards redundant unless there
is a need for additional independent connections or the network uses some non-Ethernet
type.

3.6     SmartNIC

SmartNIC (Smart Network Interface Controller) functions like a normal NIC but brings
more to the plate in functionality. These SmartNICs go further than just simple connec-
tivity and perform network traffic processing right on the card instead of requiring CPU
to handle the processing. This lightens the load on the CPU when there is a need to
inspect the traffic going through the card. SmartNICs come in different forms but the
most common, if not the only, cards are ASIC, FPGA or SOC based. Each of these types
12

have their own strengths and weaknesses when developing programs that utilize them
to their fullest.

ASIC stands for Application Specific Integrated Circuit. It is an integrated circuit (IC) that
is designed and programmed to serve only a single purpose. Because it is tailored to
perform a single operation efficiently it has amazing price-performance. ASIC based
SmartNICs are easy to program and extend, but they are flexible only to their pre-defined
capabilities.

FPGA is an abbreviation for field-programmable gate array, which is an IC that is config-
urable by the customer or a designer. The chip contains an array of programmable logic
blocks that can be connected. These connections can be reconfigured when necessary.
A single logic block can contain a complex combinational function or act as a simple logic
gate. These chips are programmed using hardware description language (HDL). Smart-
NICs utilizing FPGA based design have a good performance but are rather costly. They
are also harder to program when compared to their ASIC based counterparts.

SOC, System on Chip, integrates all components of a computer or another electronic
system. This type of chip often includes a CPU, memory, secondary storage and I/O
ports, all on a single small chip. SmartNICs based on this solution offer easily approach-
able programming tasks as well as high flexibility.

3.7    Selected solution

In the project the Napatech’s SmartNIC was connected directly to the optical splitter, as
there was no need to configure more complex setup. The data was split 90/10 between
the project server and the original server, meaning that the project server received 10 %
of the data and the original server 90 %. This solution was chosen as the server running
the original software could not be disturbed. This setup allowed the project server to still
receive the data that the original server was monitoring. Verification of the data became
easier as both applications wrote were able to write the captured data to PCAP format.
These capture files were then inspected with Wireshark and compared.
13

Figure 6.   Configuration of the hardware.

Figure 6 above displays how the optical splitter was connected to the servers and the
source of the data. If the splitter could not have been connected directly to the Napatech’s
SmartNIC, SPAN could have been used to monitor the in the project server. The Smart-
NIC used in the project was FPGA based.

4     Tools, libraries and classes

4.1    Microsoft Visual Studio

Microsoft Visual Studio was the chosen integrated development environment (IDE) for
the project because of earlier experience from its use. It offered the possibility to remotely
connect to UNIX based machine and upload and compile sources in that environment.
When executing the program, the IDE acts as a front-end and displays in a console win-
dow the outputs of the program running remotely in the Linux server. This was a desired
feature because the project was targeted for UNIX based environments and the devel-
opment was done on a Windows machine. Debugging with Microsoft Visual Studio of-
fered a valuable insight into the current variable states and what was running and in
which thread. The possibility of debugging the program step by step made finding the
errors and bugs much easier.
14

4.2   CMake

CMake is a combination of cross-platform tools that are designed to build and test soft-
ware. Instead of writing complicated Makefiles, the CMake was chosen for this project
due to its relatively ease of use. CMake’s build process has two stages, configuration
and generation steps.

During the configuration step CMake first looks for and read CMakeCache.txt, if it exists
from previous runs. After that CMakeLists.txt is read from the root of the source tree
given to CMake. These files contain the information how to generate the build files. Con-
tents of these files are parsed by CMake language parser and it effectively “executes”
the user-provided CMake code. After the code is executed and everything have been
correctly computed, CMake generates CMakeCache.txt for further runs.

After configuration step is completed generation step starts and creates the build files for
selected build tool. The generation step is much shorter and simpler than the configura-
tion step as it involves only writing the build files, whereas configuration step checks for
cache, reads files and writes cache.

4.3   MobaXterm

MobaXterm is a terminal tool that is ideal for remote connections. Originally the project
started by using PuTTy, but the functionality it provided proved to be lacking in the long
run. Some of the perks that the MobaXterm offered was SFTP browser to the currently
connected SSH session, which allowed easily to move files between the remote server
and local computer.

4.4   Wireshark

Wireshark is a valuable tool when one needs to analyze network traffic and protocols. It
can capture live traffic or perform analysis offline. The displayed data can be filtered
extensively based on protocols, IP addresses or such. Wireshark can read and write in
many different capture formats and compress them with gzip. For this project it is used
15

as a debugging tool and a way to verify the contents of the messages sent between client
and the server. The verification of the data was done by capturing simple UDP messages
that were known beforehand, such as “Hello World”. The captured data was written in a
PCAP file and then opened on Wireshark for closer inspection.

Figure 7.   Inspecting the captured frame in Wireshark

In Figure 7 the captured frame is inspected closer. Wireshark opens the frame and dis-
plays its data in organized manner. The lower window shows the hex dumb of the frame,
from which the UDP message can be seen clearly.

4.5   Docker

Docker is an application that performs virtualization at the operating-system-level. It al-
lows to create multiple isolated user-space instances where applications can be exe-
cuted. The containers created by the Docker are lightweight and can run the applications
in isolation. Being lightweight is only one of the many strengths that Docker brings to
development process. Alongside being lightweight it is also portable, meaning that you
can build your application locally, deploy it to the cloud and run it from anywhere. [4]

4.6   NT40E3-4-PTP SmartNIC

The Napatech SmartNIC used in the project was NT40E3-4-PTP. It provided full packet
capture and analysis of Ethernet Local Area Network (LAN) at a stunning 40 Gbps speed
without packet loss.
16

The SmartNIC provided multiple different key features that made analyzing and captur-
ing of packets effective. It provided a timestamp with 1 nanosecond resolution for every
frame that it captured. An Ethernet frame could be received and transmitted every 67
nanoseconds when running at 10 Gbps, and every 6.7 nanoseconds at 100 Gbps. The
precision of the timestamp allowed each frame to be uniquely identified. The SmartNIC
also provided capabilities to handle fragmented IP frames, efficiently identifying and col-
lecting them before passing them to the same CPU core for processing. [5]

Napatech had implemented many ready macros that made navigating the captured
packet easier. These macros moved the pointer to the start of a specific data. They also
offered an easy way to slice the data of interest out from the packet.

4.7     Libraries and APIs

4.7.1    Boost

Boost is a portable C++ source library that is free and peer-reviewed. It contains a wide
range of different libraries that work well with the C++ Standard Library and provide use-
ful functions and methods that speed up the development of projects. By using Boost,
the developers can effectively avoid reinventing the wheel and bugs. Because Boost is
maintained by open source community, it can also effectively cut long-term maintenance
costs. According to the Boost Background Information on Boost’s homepage, ten of the
Boost libraries are already included in the C++ Standard Library and more are in the
pipeline for standardization [6].

For this project, Boost offered multiple useful libraries, most notably Boost.Asio. Boost
also offered an implementation of Smart Pointers that are already part of Standard Li-
brary, but for the sake of cohesion the project opted to use Boost’s version. Boost.Asio
is a cross-platform C++ library that provides developers with a model to handle network-
ing and low-level Input / Output (I/O) programming using modern C++.It is developed
and copyrighted by Christopher M. Kohlhoff and distributed under the Boost Software
License.
17

4.7.2   Google Protocol Buffer

Protocol buffers are structured data format that is developed by Google. It works like
XML, but is smaller, faster and simpler. Protocol buffers provide an easy way to serialize
structured data for read and write operations through different streams. When Protocol
buffer is defined and compiled for C and C++, it provides header and cpp files that con-
tain the functions to serialize the data. The code is generated based on the definitions in
the proto file. This proto file can be used to reinforce the data structure used between
different project and different developers without them needing to know how the other
side is handling the data contained in the Protocol buffer.

4.7.3   JSON for Modern C++

JSON for Modern C++ is one of many approaches to create a robust JSON parser for
C++. The library is maintained in GitHub, and it has been contributed to by a wide range
of people. The design goals listed in README.md states that their aim was to provide
an intuitive syntax as well as trivial integration and complete testing of the library. [7]

JavaScript Object Notation (JSON) uses human-readable text to transmit data objects
that consist of attribute – value pairs and array data types. It is an open-standard file
format and commonly used for asynchronous client – server communications.

Figure 8.   Snippet of JSON format. [7]

The JSON format depicted in Figure 8 can be easily constructed by the functions and
constructors provided by the library. User is given multiple ways to initialize the JSON
object there are different iterators and methods to access the values in the object.
18

4.7.4   LibNTAPI

LibNTAPI is part of the 3rd generation driver for Napatech adapters (3GD). The whole
driver itself can be divided into four parts: driver, NtService, LibNTAPI and LibNTOS. The
driver is the low lever driver that runs in the kernel space. NtService is a daemon that
runs in the user space and is the actual driver containing all the adapter specific code.
LibNTOS is the OS abstraction library and it handles the OS specific tasks, such as
memory mapping, sockets and such.

From the projects perspective the important one is the LibNTAPI. It contains the functions
that allow the application to communicate with the NtService daemon.

4.7.5   googletest

Googletest is a testing framework, much like the one offered by Boost. It is developed
and maintained by the Testing Technology team at the Google. It is targeted for testing,
maintaining and further improving C++ code. [8] Googletest was chosen for the project
as it seemed to provide more features and easier syntax at first glance. The basic con-
cepts of writing tests proved to be a simple task as the testing started by writing simple
assertions, which test if the condition is true. The results for these tests could be success,
nonfatal failure or fatal failure. These assertions were helpful to test the functionalities of
the buffers in the project, as well as testing the saving of a filter.

TEST_F(TestSetName, TestName)
{
     TestObject obj;
     obj.SetName(“Test”);
     EXPECT_EQ(obj.GetName(), “Test”);
}

Listing 1. Example of test using Googletest

The above code snippet demonstrates how to write a simple test using googletest. The
test creates the object, tries to set a name for it using the method SetName and then the
result is evaluated with EXPECT_EQ macro. The macro’s first parameter gets the name
field from the object and compares it to the expected value which is the second param-
eters. If the values match, the test is successful.
19
4.7.6 spdlog
During the development there was a need to implement some kind of logging to visualize
the data that the program was operating on. This logging could have been done by just
using something like the following function.
void Log(std::string& a_logString) {
std::cout20 Figure 9. Results of the benchmark. Figure 9 is from spdlog’s GitHub page which also contains a handful of simple examples [9]. 4.8 Project classes The functions and methods that were used to interface with the NapaTech’s SmartNIC were wrapped in custom classes that were specific for the project. These wrapper clas- ses made up the backbone of the monitoring part of the project. 4.8.1 Buffers, pools, queues and controllers DataBuffers (called just Buffers in the early stages of the project) were specific objects for the project which were used to store vital information. They contained the Napatech’s captured data in its own format as well as the ID of the stream and connection. These buffers resided in an object pool that was responsible for their lifecycle. Buffers were
21

requested from the bool as needed and they were marked to be in use. The buffer then
stored the data received from the stream and waited for its turn to be sent to the client.
When the contents of the buffer had been processed and sent to the client, the buffer’s
status was updated to indicate that it was available, and it was returned to the pool of
available buffers.

The ID of the stream was used to prevent usage of duplicate filters, which could result in
certain type of race condition when capturing packets. If two streams tried to capture
packets with same filters, only one of the streams got the data. The connection ID was
used to identify which client connection the data packet should be sent to.

4.8.2   Writers

A set of primitive writers were defined for the project. DiskWriter was developed as a
base class for different type of writers. It handled the creation, opening and closing of a
file, as well as writing to a file in the simplest form. The write methods created for
DiskWriter handled different data types. From this class the PCAPWriter was derived.
This new and refined class handled the generation of PCAP general and record headers,
as well as inserting them to the file at the correct moment.

4.8.3   ProtoBuilder

Google’s Protocol Buffers generated a large amount of code that handled setting and
reading the fields of proto objects, but handling them one at a time was time consuming
and repetitive. ProtoBuilder class handles the construction of a proto object with given
parameters. The methods take in a reference of existing proto and adjust the fields with
given parameters. This way the construction of proto was streamlined and made cleaner.

4.8.4   Streams and containers for them

Stream class wrapped in all the functionality that was required to operate the SmartNIC.
The Reference Documentation described five different streams: Info Stream, Event
Stream, Configuration Stream, Statistics Stream and Network Stream. From these
streams the most important ones from the project’s perspective were Configuration
22

Stream and Network Stream. Network Streams contained the RX Network Stream which
was used for the capture and Configuration Stream was used to setup the filters and
other configurable features.

The container class for streams kept track of currently active streams and was respon-
sible for shutting them down when the clients so wished. The container also handled the
threading of the streams.

4.8.5   Filtering

Creating the filtering for the project was a rather complicated task. The filtering was per-
formed by FilterBuilder, FilterRecorder and FilterManager. FilterManager acted as an
entry point from the server to Napa side of the project. FilterRecorder kept track of cur-
rently active filters to reduce the wasted resource of duplicate streams as well as elimi-
nate possible data races between two clients. FilterBuilder.

Improving the filter to capture data from certain source or destination address as well as
ports required implementing so called Key tests. FilterBuilder’s job was to build a proper
set of NTPL statements from the parameters and order them in the vector so that the
filter can be successfully assigned.

RecordIndex was created to act as a simple data structure that contains all the infor-
mation related to the filter. It contains information such as source and destination IPs
and ports, possible index of existing keys that are used to match said addresses and
ports, desired protocol and the stream ID which the filter is assigned to.

4.8.6   Keys

When matching the captured frame against a more specified filter, different tests could
be used to achieve this stricter filter. IPMatch test checked the source and destination IP
addresses from the received frame against IPMatchList, which contained the desired
addresses and if the values match the frame that received frame was captured. Accord-
ing to the Reference Documentation, the KeyMatch test was a more generic version of
the IPMatch test.
23

Key test was the generalization of KeyMatch test and instead of testing different fields in
the frame, the test is conducted on a key definition that can constitute of multiple fields
from a frame. The captured frame can be tested with multiple Keys. The combination of
different keys is achieved with ‘OR’ and ‘AND’ operators. [10]

4.8.7   Configurations and arguments

Testing the connection between the client and the server proved to be a repetitive task
after a while, as the client needed to be compiled every time there was a need to switch
parameters that would be sent over to the server. To solve this problem the test client
was modified to accept parameters as command line arguments. These arguments were
parsed using Boost’s program_options library. It offered an easy way to define what type
of arguments were accepted and how they would be mapped.

The ArgParser class was responsible for reading the arguments given through the com-
mand line and parsing them to vectors. These vectors were then used to construct the
Protocol Buffer. As the client was developed only for a test usage and it was not required
feature for the project, the ArgParser was rather simple. It did not handle errors well and
was quite strict with the format it accepted. For example, defining a protocol was done
by passing “--protocol udp”. This set the protocol as UDP but adding anything unneces-
sary like “--protocol udp tcp” would result in an error, since the class would consider “tcp”
to be a command from that string. Each of the configurable value required by the client,
could be supplied through the command line. Such values were for example: protocol,
source and destination IP addresses, source and destination ports and stream name.

ConfigParser and ConfigFlags were two classes that were created to make the project
more flexible. There was a requirement to adjust the size of the pools as well as the
address and port of the server, without needing to compile the whole program again.
This flexibility was gained by creating ConfigParser, which reads a simple configuration
file line by line and picks the set values from there. This parser was rather straightfor-
ward, as the configuration parameters needed to be exact in the file.

# CONFIGURATION FILE #

[Logging Configuration]
Log_console = true
Log_file = false
24

[Buffer Configuration]
poolsize = 1500
buffersize = 1700

[Server Configuration]
Server_address = 0.0.0.0
Server_port = 6666

[Filepath Configuration]
filter_setup_file = FilterMacros.txt
server_log_file = ServerLog.pcap

Listing 4. Possible contents of the configuration file

The above snippet depicts how the configuration file would be structured. Separating
values to sections was not necessary but it made the file easier to read and manage.
The ConfigParser read each line and looked for “=”, if it found the correct symbol it then
proceeded to split that line to two. These two values were then passed to a different
parser function that compared the string from the left side of the symbol to identify the
correct configuration parameter. When the correct parameter was found, it was initialized
with the value parsed from the right side of the symbol.

When the configuration file was read through and values had been parsed to their cor-
responding variables in the program, ConfigFlags class would take over.

ConfigFlags was not a class but rather just a namespace that contained the variables
with the values from the ConfigParser. The namespace contained functions to set, get
and check the values.

5    Architecture

The project consisted of two parts. First part contained the libraries and the API provided
by Napatech and was responsible of controlling the SmartNIC to capture the data and
forward it to an object pool. The second part contained the implementation of the server,
that handled the incoming connections as well as sending and receiving data to client
applications. Due to the complexity of creating a proper server from scratch, the thesis
focuses more on describing the controlling of SmartNIC and other functionalities related
to it. The server implementation was done by modifying existing server code to better
fulfill the requirements of the project. A rather simple client application was created to
25

serve as a debugging tool and to visualize the contents of the Protocol buffers transmit-
ted between the server and the client. Both parts of the project took advantage of object
pool design pattern. Reusing the objects obtained from the pool instead of reinitializing
them every time resulted in a much faster performance.

A group of utility classes were developed to provide additional support during the devel-
opment and provide additional value to complete product. These classes provided func-
tions to print easily readable text to console or to a file. As one of the requirements, which
came up during the development, was that the final product should be configurable to
some degree, a group of parsers were included in the utility group. These parsers were
used to parse configuration files that could be used to adjust a handful of values in the
program. These utility classes also served as a continuing point for possible further pro-
jects, as they were designed to serve universal purpose and work by just plugging them
in a project. Further down the line these classes could have been compiled into a single
library that would be easily added to multiple projects. To reach this point the classes
would have to be developed further so that they could handle a wide range of situation
that are encountered in different kind of projects. For this project these classes remained
rather simple.
26

Figure 10. Architecture and data flow in the project as well as how some of the classes were
           grouped.

Figure 10 describes the architecture and flow of data in the part of the project that han-
dles the Napatech’s SmartNIC. The architecture is pictured in its simplest form, without
going in too much details how the server part functions. The server was separated from
the Napatech as there were no need to tie them together in any special way. The classes
displayed in the Utility group serve only to support and are in no way necessary for the
execution of the application.
27 5.1 Object pool Object pool is a design pattern that offers scalability and performance by allocating a block of memory in form a pool to resources. These resources are commonly user de- fined objects that are frequently used in the application. The object pool allocates a block of memory in the heap for a collection of said objects. These objects are then requested from the object pool and returned to the calling function if there are resources available. When the requested resource is no longer used, it is returned to its initial state and re- turned to the pool, from which it can be requested again. The objects stay allocated in the pool until the program is terminated or they are intentionally freed. The benefit of this design pattern lies in the performance boost in situations where initializing an instance of a class is costly. 5.2 Server The server for the project was created by modifying existing server code. The classes and function contained efficient handling of incoming connections as well as error han- dling. Data was transferred as a simple stream over the wire. The header was always the same length and the first to be transmitted. The header contained the length of the data frame that followed and other useful information, such as application version num- ber and timestamp. When a client connected, the server started to asynchronously wait for a data to be available in the wire. When data became available the server read alter- nately headers and packets. Packets were sent to an object pool from where they were then processed. The packets contained the parameters that were used to start the mon- itoring streams. Each connection was tagged with a connection ID, to further separate them from each other and to determine which connections each captured data packet were to be sent. While the data transfer was done with header and packet structs, the packets were con- structed from Protocol Buffers. This unified the communication on both ends.
28

6     Implementation

6.1    Creating the server and the client

The project began by sketching out a raw concept of the program parts and how the data
should be moved between them. The goal of the project was to separate the data cap-
turing and handling from existing program and turn it in to a service. The requirements
for this service were capability to serve data to multiple client connections and capture
data without delay. After the initial sketch was completed and some of the features
agreed upon, the building of the development environment and the server started.

After studying the examples provided by Napatech and existing server codes, the project
began by planning and writing a server that handles a single client connection. The goal
was to have a server that could serve to multiple clients, but for the start only a single
connection could be used to debug and to get started. Writing proper network code from
scratch was tedious and required extensive error handling, but luckily the development
could be streamlined a bit by using I/O libraries from Boost. Boost’s Asio library provided
simple functions to accept incoming connections as well as read and write to sockets
asynchronously.

The coding of the server started by following the example of an asynchronous TCP day-
time server from Boost’s website [11]. The example provided a base for a server and
client, that could be expanded upon. When client and server successfully traded simple
“Hello world.” messages the code was ready to be modified to send more complicated
messages. The plan was to have client send parameters to the server, which would use
them to start a monitoring session. This was more in line with the requirements of the
project. Initially the client and server worked synchronously, but that was only acceptable
with a single connection. To be able to handle multiple connections in the future, the read
and write operations were changed to asynchronous operations. When running asyn-
chronously, both read and write have a callback function which is called when the re-
quired data is available. This cut down the idle waiting and unnecessary blocking. Asyn-
chronous model and callbacks proved to be a handful and caused the messages to get
mixed and become corrupted. The problem was solved with proper handling of alternat-
ing between reading a header of specified length and reading a packet with length spec-
ified in header.
29
void TcpConnection::Receive() {
boost::asio::async_read(m_socket,
boost::asio::buffer(m_buffer.data(), HEADER_LEN),
boost::bind(&TcpConnection::AsyncReadHandler,
this,
boost::asio::placeholders::error,
boost::asio::placeholders::bytes_transferred));
}
Listing 5. Asynchronous read function using Boost’s ASIO
The function described above reads from the socket to a buffer the number of bytes that
is the size of the header. Because the function call is asynchronous, it returns immedi-
ately and allows other part of the program to run. The function will continue until the
buffer supplied is full or an error occurs. In this case the buffer is exactly the size of the
header. When the callback is invoked the buffer contains the header data and can be
casted to a struct specifying the header. From this struct the length of the packet can be
determined, and the same function implementation can be called with that length.
After the parameters were properly received on the server side, the project moved for-
ward. Next step was the installation of Napatech’s SmartNIC in to the server computer,
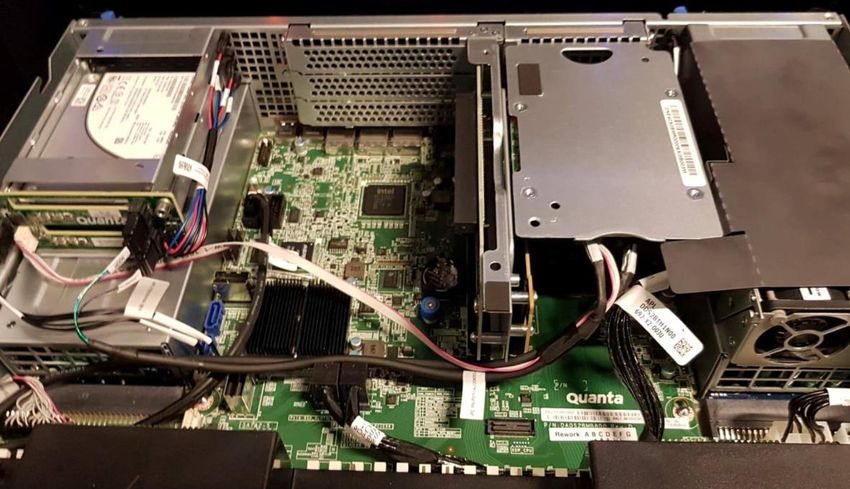
installing the required drivers and applications as well as getting to know the API.30 6.2 Installing and getting to know Napatech The Napatech’s SmartNIC was installed to a server computer and required cables were connected. The installation process proved to be a challenge, due to tightly fitted com- ponents that were already present in the server. The server was also mapped to a dif- ferent network which prevented any attempts to remotely connect to it. After thinking it over it was deemed best to move the card to a different server that had the option of remote connection, instead of moving the whole server from the server hall to the office for physical access. Figure 11. Napatech’s SmartNIC in the server Figure 11 is a picture of the contents of the server machine. Napatech’s SmartNIC is on the right side under the metallic cover. When the card was installed it was time to install the operating system, required drivers and download the API. The OS chosen for the project was RHEL 7. When the OS was installed the required updates were configured to be fetched from Nokia’s own update repositories. For a first-time user this proved to be a much more complicated task because it involved authentication keys and defining repositories from which to fetch updates. The installation of the drivers also had problems. When compiling the drivers an error occurred stating that the kernel headers did not match. The error was fixed by removing
31

and reinstalling the specific version of kernel headers. When the compiling and installa-
tion was done the project was ready to move to the next phase, writing a program to
capture data with the SmartNIC.

6.3   Starting to write capture software

The first phase in the development of the capture software was to create a program that
uses the API to open a stream and capture data specified a simple filter. The data is then
written to a file in PCAP format and inspected with Wireshark. This way the validity of
the captured data could be verified.

Figure 12. Initial plan for handling captured data

Figure 12 depicts the initial plan that was drafted for handling the data. The captured
data is collected in an object pool from which it is then processed in the order dictated
by the queue. Figure 12 describes the relation between the classes. Buffers contain the
captured data and other important information used in later stages of the program. Pool
contains predefined number of ready buffers which are requested and released by the
MessageSink class, which acts as a controller that combines the pool and the queue to
You can also read