USING REAL DRIVING DATA FOR TRANSPORTATION POLICY - A PROOF OF CONCEPT Muhammad Daud Ari Kaputkin Rigel Jarabo Joanna Simon - NYU Wagner
←
→
Page content transcription
If your browser does not render page correctly, please read the page content below
Muhammad Daud
Ari Kaputkin
Rigel Jarabo
Joanna Simon

USING REAL DRIVING DATA
     FOR TRANSPORTATION
                 POLICY
                A PROOF OF CONCEPT

                    Master of Urban Planning

                           Capstone Project

                                               1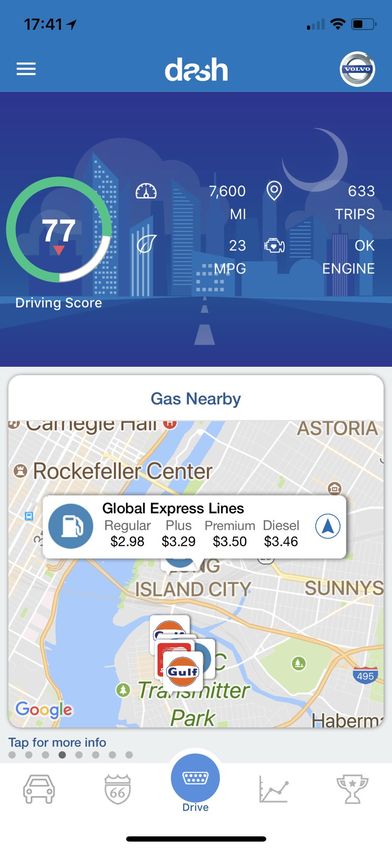
USING REAL DRIVING DATA
                     FOR TRANSPORTATION
                                 POLICY
                                                             A PROOF OF CONCEPT

                              PREPARED FOR:

                                Dash labs. Inc

                              http://dash.nyc/

                             175 Varick St. 4th Fl

                            New York, NY 10014

                               PREPARED BY:

              Robert F. Wagner Graduate School of Public Service

                      295 Lafayette Street, Second Floor

                         New York, NY 10012-9604

u ACKNOWLEDGEMENTS

                                                                            2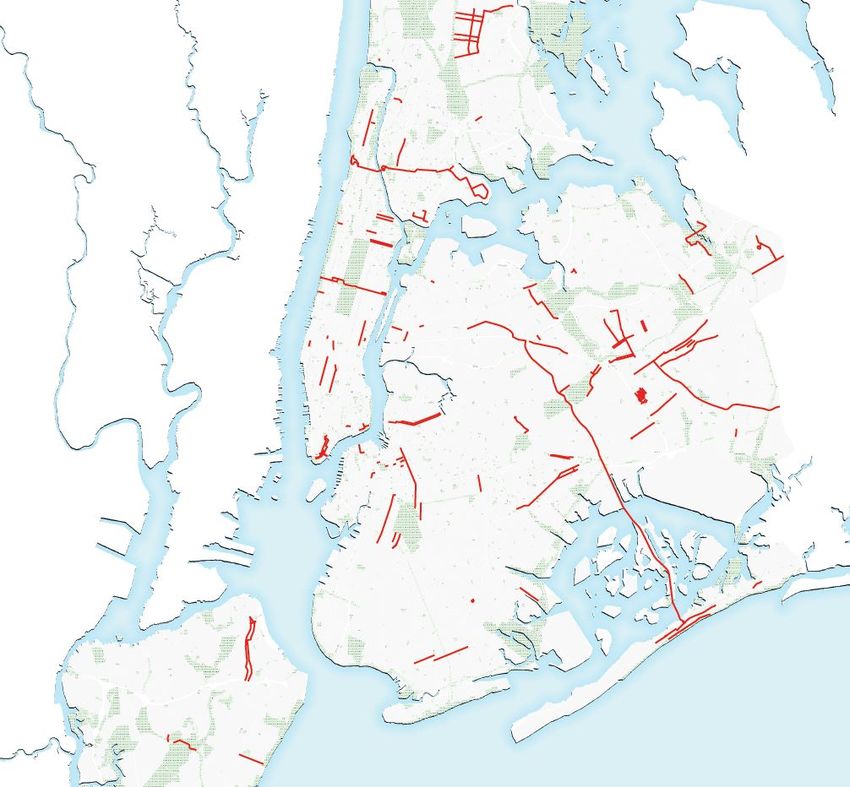
Dash labs. Inc

    Jamyn Edis
   Brian Langel
  Ethan Hartman

Capstone Team

 Muhammad Daud
  Joanna Simon
   Ari Kaputkin
Rigel Jarabo García

Capstone Advisor

 Sarah Kaufman

                      3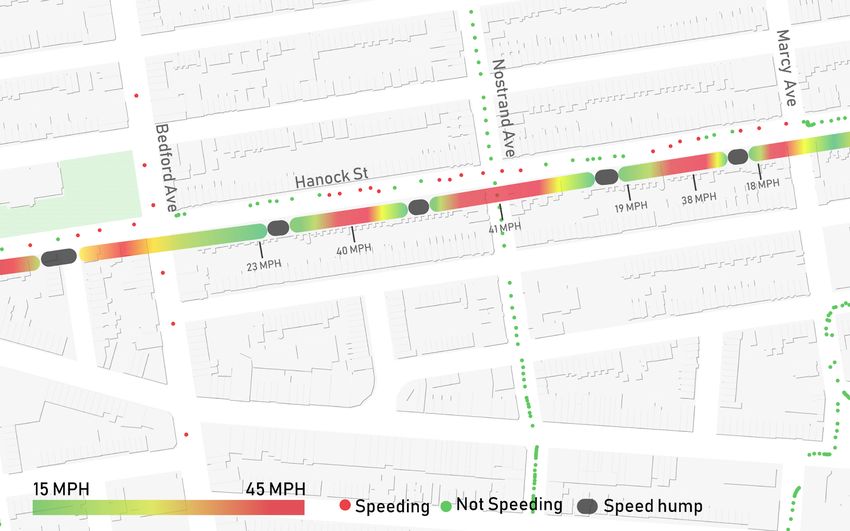
u CONTENT
Executive Summary .......................................................................................................................................... 6
Introduction ...................................................................................................................................................... 6
Context ............................................................................................................................................................. 9
  »   Transportation Policy in New York City ................................................................................................. 9
  »   Trends in technology........................................................................................................................... 11
  »   Data Integration and City Function ..................................................................................................... 15
Data & Methodology....................................................................................................................................... 16
  »   DOT and Vision Zero ........................................................................................................................... 16
  »   DASH ................................................................................................................................................... 16
  »   User Anonimity .................................................................................................................................... 16
  »   Data limitations .................................................................................................................................. 17
  »   Methodology ....................................................................................................................................... 17
Results ........................................................................................................................................................... 19
  »    Driver Behavior ................................................................................................................................... 19
  »    Built Environment ............................................................................................................................... 30
Policy implications and conclusion ................................................................................................................ 36
  »     Holding traffic violators accountable .................................................................................................. 36
  »     Reclaiming parking spaces................................................................................................................. 36
  »     Automating vehicle inspection process .............................................................................................. 37
  »     Opportunities for new road pricing plans ........................................................................................... 37
  »     Leveraging usage-based insurance .................................................................................................... 37
Works Cited .................................................................................................................................................... 39

                                                                                                                                                                4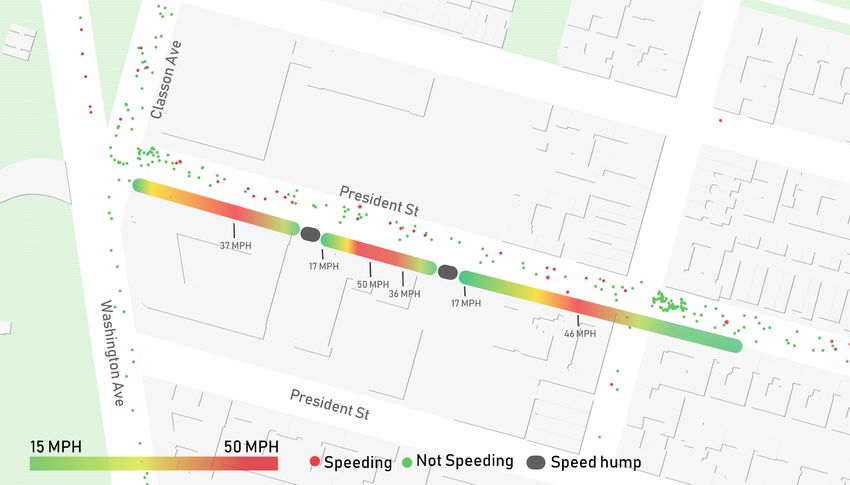
u LIST OF FIGURES
Figure 1. Fatality Rate, NYC (2000-2016). .................................................................................................... 10
Figure 2. Dash App highlights ........................................................................................................................ 14
Figure 3. Dash App screenshots .................................................................................................................... 14
Figure 4. Percent of Vehicle Travel time in NYC spent speeding ................................................................... 21
Figure 5. Percent Speeding by time of day by street speed limit .................................................................. 22
Figure 6.Travel speed by percent of road speed limit, all cars by road speed limit ...................................... 23
Figure 7. Proportion of drivers that over speed when reach speed limit ...................................................... 24
Figure 8. Percent moving time spent speeding by Borough .......................................................................... 25
Figure 9. Percent moving time spent speeding by car type........................................................................... 26
Figure 10 .Hard brake detection, phone in portrait position ......................................................................... 27
Figure 11. Hard brake detection, phone in landscape position .................................................................... 27
Figure 12. Speed on 25 MPH Roads & Precipitation, December .................................................................. 29
Figure 13. Speed on 25 MPH roads with and without speed humps by neighborhood................................ 34

u LIST OF MAPS
Map 1. Hot spots of speeding events ............................................................................................................ 20
Map 2. Top two percent of braking events .................................................................................................... 28
Map 3. Street Improvement Projects Completed in 2017 ............................................................................ 31
Map 4. Speeds Along Street Improvement Corridors .................................................................................... 31
Map 5. Queens Boulevard: Before & After Street Improvement Project ....................................................... 31
Map 6. 7th Ave: Before & After Street Improvement Project......................................................................... 32
Map 7. Grand Concourse: Before & After Street Improvement Project ......................................................... 32
Map 8. Speed Bump analysis ........................................................................................................................ 33

                                                                                                                                                   5
u EXECUTIVE SUMMARY
           Dash Labs, Inc. is a New York City based start-up that publishes one of the most
    popular phone-based connected-car platforms. With nearly 450,000 downloads since the
    App launched in 2014, the platform collects real-world data from drivers around the world.
    Aiming to demonstrate the value of user-generated data in transportation policy, Dash
    Labs engaged a Capstone team from Robert F. Wagner Graduate School of Public Service
    to create visualizations and policy recommendations based on vehicle usage data within
    the 5 boroughs.

    The Capstone team aimed to answer three main questions: 1) how are drivers behaving
    when they move through NYC? and 2) how does the urban environment affect driver’s
    behavior? And 3) what is the potential use of this type of data in the future, when
    telematics platforms are more generalized and automated vehicles or connected cars
    permeate society?

    To answer those questions, the team used Dash real-time user-generated data overlaid
    with public open data and gained meaningful insights that can be valuable when creating
    transportation policy towards increasing safety. Among the results the team identified the
    following:

        1)    Areas where speeding happens and thus are in need of speed enforcement
              efforts and pedestrian and bike safety initiatives.
        2)    Areas where hard braking and quick acceleration occurs and can be a proxy for
              “near accidents,” demonstrating that transportation policy-makers do not have to
              rely on accidents and fatalities to assess the riskiness of a street or intersection.
        3)    Evaluate the success of street improvement projects in changing the behavior of
              aggressive drivers.

     Finally, the capstone team highlighted potential implications and approaches that cities
     can take, beyond street safety, when utilizing user-generated data, expecting that the
     trend of connected cars and automated vehicles continues to grow. The potential policy
     implications are:

          •   Holding traffic violators accountable,
          •   Reclaiming parking spaces,
          •   Automating vehicle inspection process,
          •   Opportunities for new road pricing plans, and
          •   Leveraging usage-based insurance.

u INTRODUCTION

                                                                                                      6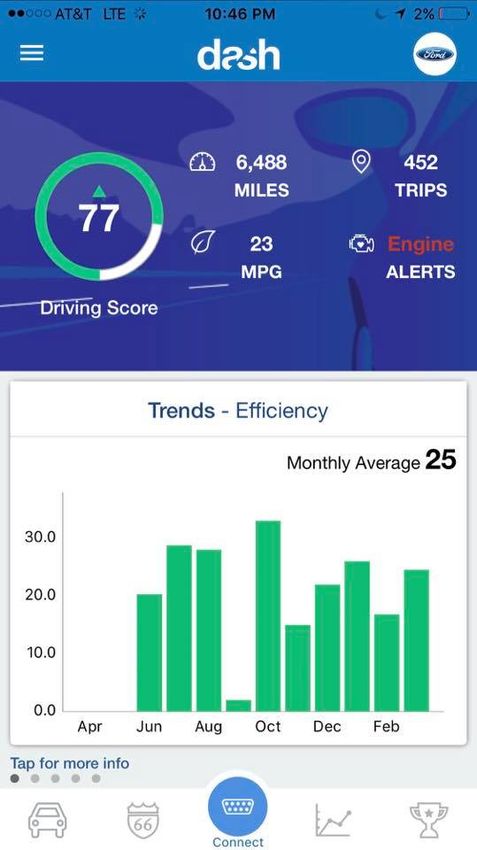
Data is essential for transportation planning and policy. Whether used to perform everyday
activities, like finding the best route from point A to point B, or to the planning, delivery, and management
of mobility services and transportation infrastructure. Today, almost every person, company and
organization consumes and produces data on a daily basis; using computers, smartphones and connected
vehicles. Data is all around us and this trend will continue to grow and permeate every aspect of daily life.

The private sector has caught up to this trend and has tailored services that make use of information and
communication technology (ICT) and location based services (LBS). As it becomes cheaper and easier to
obtain real-time data, many services provide information and entertainment subject to the user’s
geographic location. Policy-makers in the transportation world have not yet caught up to the potential of
this trend, not just for offering services but for harvesting essential information.

Although some crucial data for policy design and evaluation is currently generated through sensors and
cameras, the majority of the data is still gathered through traditional means such as administrative
records and surveys that are associated with heavy financial costs and administrative burdens.

Policy-makers in transportation should create and implement mechanisms to harness data and find ways
to integrate a variety of sources to better inform policy. The most crucial element of this data integration
process is to consolidate public information with data generated by individuals to gain an unprecedented
understanding of vehicle movement, driver behavior and vehicle interaction that is otherwise impossible to
gain.

This report addresses some of the potential uses and challenges that arise when integrating real-time,
user-generated with public data to address street safety and driver behavior.

   » First, the report dives into the world of transportation policy in New York City, data-driven policy is
       created and implemented. Next, it describes the different trends in technology and business
       models that generate key information that could improve transportation policymaking.

   » The second chapter describes the data sources considered in our analysis, the potential data
       limitations of this report, and information regarding important issues when considering data
       integration of individuals, such as data anonymity and transparency. This chapter also outlines
       the methodology used to gather, process and organize Dash data to create maps and
       dashboards important to reach our results.

   » The third chapter presents the main results divided into two categories of analysis: driver
       behavior and built environment. The first category describes how drivers move through the city
       and how it relates to the perception of safety by showing the location of speeding, hard braking
       events and weather. The second category describes how the built environment affects driving
       behavior and how effective are the interventions by analyzing case areas where street
       improvement projects and traffic calming strategies such as speed bumps have been
       implemented.

                                                                                                          7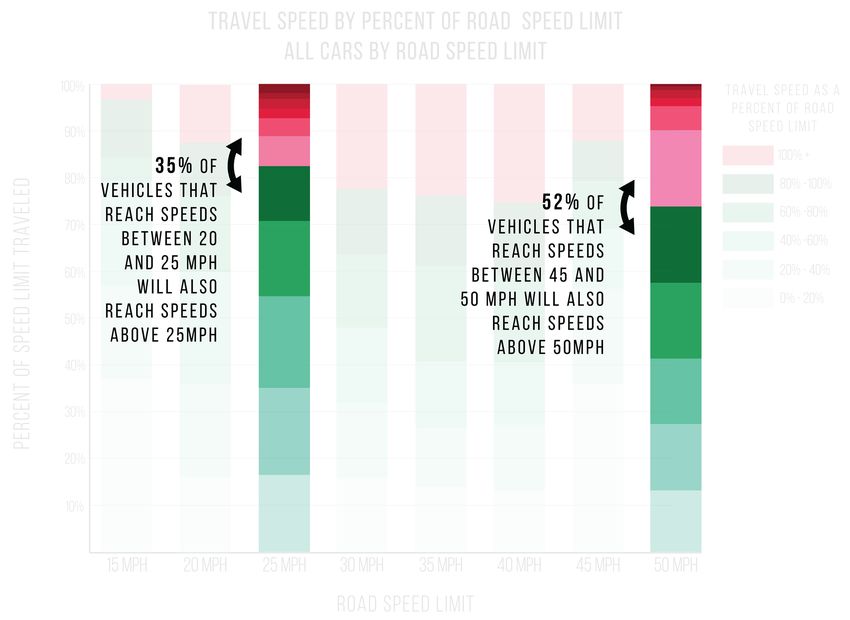
» The final chapter presents policy implications that go beyond street safety, and intend to
   demonstrate the potential of this data in city policy and planning.

                                                                                          8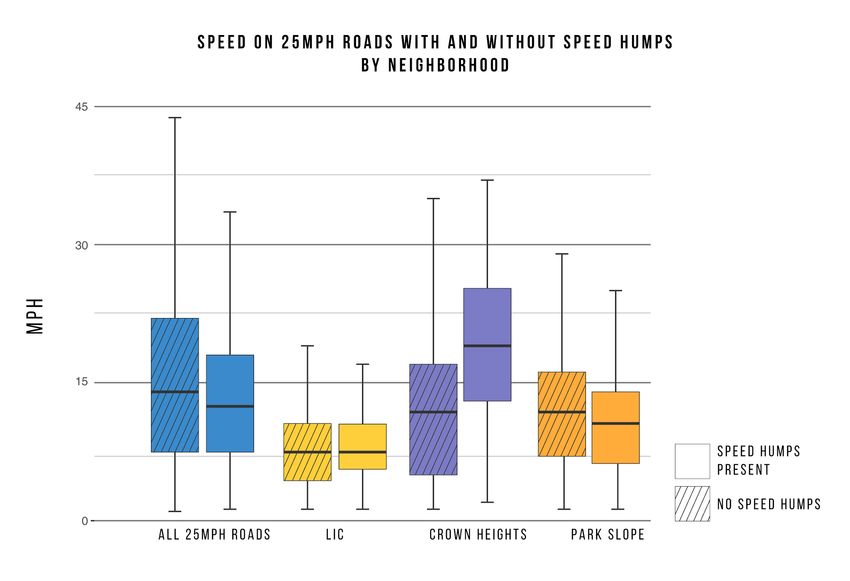
u CONTEXT
This section dives into the world of transportation policy in New York City, describing how different
agencies take part in the process of policy making and how data-driven policy is created and implemented,
focusing on the areas and programs where increasing road safety is the main objective.

»      TRANSPORTATION POLICY IN NEW YORK CITY
Transport policy in New York City has evolved significantly over time (Meyer, 2000). From adopting a car
centric approach that aimed to increase car ownership and use, to a new paradigm that promotes efficient
and safe travel not only for car users but for pedestrians and cyclist. From having an expansionist objective
that encouraged road creation, to a new purpose of creating flexible and adaptive mobility solutions. From
an activity where policy decisions were reached in a discretionary manner to a data-driven approach where
policy is informed considering different data sources.

The omnipresence of data in the modern world has already been stated, however, it is important to
highlight that “Not All Data is Created Equally”, and in the world of policy, the source of data can dictate
not only the costs associated with it, but also its quality and how accurately it represents what its meant to.
This can have huge impacts on whether a policy can be evaluated and eventually deemed as a success or
failure (Esty & Rushing, 2007).

Transportation policy in NYC is driven by the work of various agencies, at the city, state and metropolitan
level, which have different responsibilities. Some agencies are in charge of the transportation policy design
while others are in charge of transportation policy implementation and enforcement.

DATA DRIVEN POLICY
Data-driven policy in transportation is not a new concept. One example dates back to 1966 when fatalities
from automobile accidents topped 50,000 a year at a national level. The National Highway Traffic Safety
Administration (NHTSA) was created with increasing road safety as its priority and to reduce the number of
fatalities using safety standards for cars and roads. Since then, NHTSA has developed and maintained the
Fatality Analysis Reporting System (FARS), a nationwide census providing an overall measure of highway
safety, to suggest solutions, and to provide an objective basis to evaluate the effectiveness of motor
vehicle safety standards and highway safety programs (Esty & Rushing, 2007).

The FARS helped isolate causes of accidents that result in fatalities and injuries and compare the
performance of policy approaches from state to state. With this approach, the trend of increasing traffic
fatalities was reversed. The accident fatality rate has steadily declined over the last three decades, and in
2014 was at an all-time low.

One of the most successful approaches to data-driven policy in NYC is the Vision Zero program— a public
safety campaign aimed at improving street safety and decreasing traffic crashes— which followed the

                                                                                                          9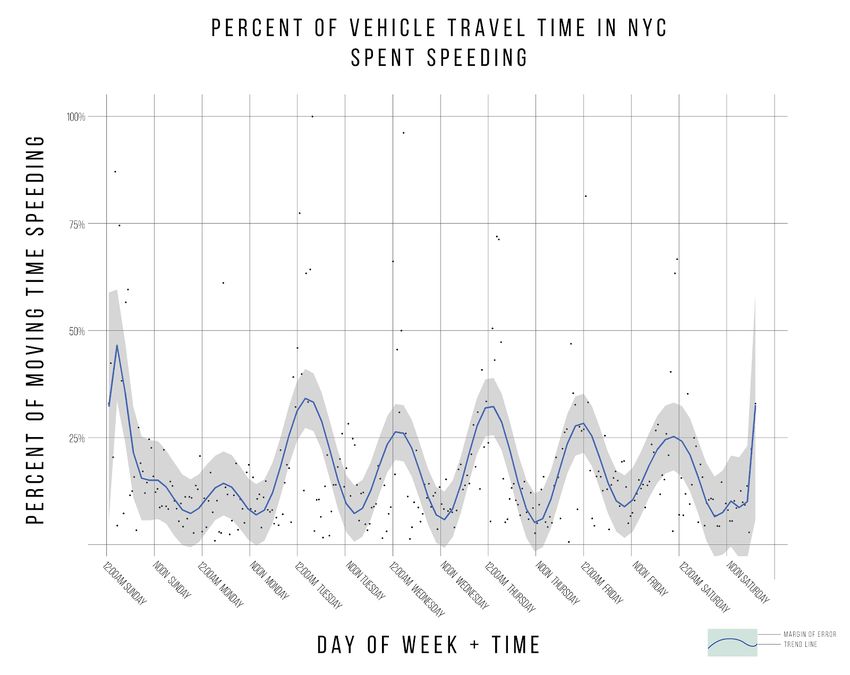
example of NHTSA by creating and sharing data that can help identify the different determinants of
pedestrian fatalities.

New York City has witnessed a decline in pedestrian deaths since the start of the Vision Zero initiative in
2014, with a 42% decline in fatalities by the end of 2016. “Vision Zero uses data shared across agencies
and departments to identify problems, find solutions and ultimately, protect the lives of New Yorkers on
the street” (NYC Office of the Mayor, 2018).

                                  Pedestrians              Bicyclists           Motorcyclists              Motorists and Passengers              Total
                         250

                         200
  Number of fatalities

                         150

                         100

                         50

                          0
                               2000

                                      2001

                                             2002

                                                    2003

                                                              2004

                                                                        2005

                                                                               2006

                                                                                      2007

                                                                                             2008

                                                                                                    2009

                                                                                                              2010

                                                                                                                     2011

                                                                                                                            2012

                                                                                                                                   2013

                                                                                                                                          2014

                                                                                                                                                   2015

                                                                                                                                                          2016
                                                            Figure 1. Fatality Rate, NYC (2000-2016).

Deterrence of speeding is one of the City's principal goals. According to the Vision Zero initiative “Deterring
speeding is critical because the faster a vehicle is moving the harder it is for the driver of that vehicle to
avoid a crash. In fact, a driver at 40 MPH needs 300 feet to perceive, react and brake to an unexpected
event – twice as far as a driver at 25 MPH, who only needs 150 feet. A pedestrian who is struck by a
vehicle traveling at 30 MPH is twice as likely to be killed as a pedestrian struck by a vehicle traveling at 25
MPH”. (NYC Department of Transportation (DOT), 2107).

The following list represents a few strategies that the Vision Zero initiative has taken to deter speeding
(Lemire, 2014):

           •                                                  • Increased Enforcement,
                          Criminal Charges Against Traffic Violators,
           •              Speed Limit Reduction From 30 To 25 • Increase Use Of Speed Cameras,
                          Miles Per Hour (48 To 40 Km/H),     • Repairing Broken Traffic Signals, and
    •                     Slow Zones,                         • Strict Enforcement Of Taxi Drivers.
Recently, the Vision Zero initiative received an additional $400 million in funding from the City Mayor’s
Office to carry out programming over the next 6 years, totaling $1.6 billion through 2021 (NYC Office of the
Mayor, 2017). The NYC Department of Transportation (DOT) plans to continue adding street marks,
improving and adding pedestrian ramps and enhancing crossing signage.

                                                                                                                                                          10
The decision on where to allocate funding is where granularity of data becomes important. To declare any
of the initiative elements a success, an evaluation must be done. This evaluation must be comprehensive
and indicative of the fact that speeding can happen at any location and at any time. The DOT does not
currently have the measures to monitor vehicle speeds at all locations and at all times.
The DOT has reported that speeding has dropped up to 63% in locations where speed cameras are
allowed to operate,1 making them very effective. However, a reported 85% of deaths and severe injuries
occur at times or places where the law prohibits the use of speed cameras to deter speeding (NYC
Department of Transportation (DOT), 2107). Clearly, while there are some methods monitoring the efficacy
of adjustments to traffic policy and design, there is one notable blind spot: identifying areas where the DOT
and NYPD do not currently have a monitoring system in place.
To solve this, the DOT and the New York City Department of Citywide Administrative Services (DCAS)
proposed to install adapters to record information about speed, hard braking and hard acceleration on a
29,000-vehicle fleet. This initiative is mentioned in the Vision Zero 3 year report, and more information is
presented in the 4th year report (NYC Office of the Mayor, 2018).
This effort is one step forward in the right direction. Real-time driver information would allow DOT to gather
useful information from their drivers around NYC and gain a better understanding of how drivers move
through the city. It remediates the DOT blind spots of enforcement while making use of technology. It
answers all the right questions but fails to answer one: If “Data is all around us”, does real-time driver
information already exist elsewhere?
The answer is yes. The model that the city wants to replicate as part of Vision Zero is one that already
exists and has proven successful in the private sector. The next section examines some of the trends in
technology that make use of Information and Communication Technology (ICT) and Location Based
Services (LBS) to harness data generated by users and motor vehicles, how this technological trend has
created a new business model, and how this user-generated data can prove useful when addressing safety
issues.
» TRENDS IN TECHNOLOGY
INFORMATION AND COMMUNICATION TECHNOLOGY & LOCATION BASED SERVICES
The most important use of data shaping transportation policy is the ability to collect and analyze large
amounts of data allowing decision-makers everywhere to cut through potential distortions to discover what
1Speed cameras are placed in school zones to photograph speeding vehicles. They can be operated from an hour before the
school day to an hour after it, as well as from 30 minutes before a night or weekend activity to 30 minutes after it. This includes
vacation times, when classes and activities may still be going on inside the facility. (NYC Office of the Mayor, 2018)
11works. Data for this purpose is gathered and collected through many means, but as stated before, “Not All
Data Is Created Equal”, and public policy has yet to dive into the untapped potential of “user-generated”
data.
The development of Information and communication technology (ICT) and Location Based Services (LBS) is
significantly influencing not only our day-to-day activities but also how data is captured and applied in a
variety of sectors. “Data explosion” is a term used to describe the contemporary state of data production.
Almost every person, organization, and institution produce data daily; often via smartphone technology
through ICTs, and shares it through different platforms to gain access to services.
According to Global Navigation Satellite System (GNSS), the proliferation of GPS-enabled mobile devices -
numbering approximately 4.1 billion in 2016 and expected to rise to 6.1 billion in 2019- has led to the
emergence of new business models leveraging, collecting and processing location data to deliver a wide
range of Location Based Services (LBS) related to transport (Global Navigation Satellite System Agency
(GNSS) , 2017).
The following list is taken from the Organization for Economic Co-operation and Development (OECD)
report on “Data-Driven Transport Policy” shows a variety of data providers classified according to the
transport ‘purpose’ for which data is collected and its application (International Transportation Forum (ITF),
2016).
LOCATION-BASED DATA SOURCES AND ANALYTICS DATA SOURCES
1) Data services for transportation - GPS-based
a. Road navigation: TomTom, Waze, Garmin
b. Multi-modal routing services: Google, HERE
c. Transit-based routing: CityMapper, Moovit, The Transit App
d. Bicycle and running: Strava (also sells the aggregate and anonymised data to governments)
e. Provision of transport services (use of the data for running their business) Taxi/Ride-hailing
apps: Cabify, Lyft and Uber Didi Kuaidi, Easy Taxi, Gett, GrabTaxi, Ola Cabs
2) Non-transport location-based services: Social networks:Instagram, Twitter, Facebook
3) Non-GPS tracking technologies
a. Automatic number plate recognition (ANPR)
b. Transponders/tags: electronic toll collection systems
c. Bluetooth
d. Wi-Fi: Bitcarrier
e. Mobile data: Telecom companies
f. Payment systems: smartcards, contactless payments Data analytics
4) Transport management and operations (traffic and flow data, traffic density):INRIX, TomTom,
Bitcarrier
5) Transport planning data analytics (origin-destination matrices): Streetlight data, INRIX, TomTom
a. Telecom data as a service (TDaaS) using Telco cellular data: Airsage
12CURRENT BUSINESS MODELS
The prospect of a coming boom in autonomous vehicles (AVs, driverless cars or self-driving cars) promises
more than enjoyable, stress-free drives; many believe that they have the potential to be a disruptive
innovation force with major implications for society. Notwithstanding the apparent benefits of increased
vehicle automation, this force comes with some disadvantages that are still being solved. Hence, many
obstacles stand in the way of AVs becoming commercially available (SAS Institute Inc., 2015).
The promise of AVs to deliver safety benefits is appealing to many, and whether it can be achieved through
the technological capabilities of AVs, or through the analysis of the data generated by them and its users it
is unclear. As stated above, technology is still being developed and regulation surrounding it is evolving.
For many, this prospect of still lives in the future and few realize that even though today cars are not fully
autonomous, they are intelligent in many regards.
Vehicles today have about 40 microprocessors and dozens of sensors that collect telematics, driver
behavior data, vehicle’s performance, efficiency, and safety in check. When a car’s sensors indicate that
something is wrong, they trigger a message known as a “trouble code,” which may manifest as a “check
engine” light or another warning on the dashboard. To decode the message, a scanner is plugged into the
On-board diagnostics port (OBD-II available on cars built from 1996 on).
OBD stands for On-Board Diagnostic; it is a system that allows external electronics to interface with a car’s
hardware. Virtually every new car sold in the U.S. since 1996 is OBD compatible with a port for the device.
The data provided by an OBD standardizes vehicle repair and maintenance, giving technicians access to
the car’s mechanisms regardless of make or model (B&B Electronics, 2018).
Recently there has been an increase of companies that use OBD data for the development of applications
and software using dongles -devices that plug into the OBD port and connect wirelessly to a network.
These devices use Wi-Fi and Bluetooth to connect to the OBD II adapters to track and monitor real-time
driving and car diagnostics remotely and turn the car engine into a resource for drivers to help easily
understand a check-engine light, adjust the insurance rate based on how/when the user actually drive,
and create added safety features through tracking and emergency response services (Edelstein, 2017).
Dash Labs, Inc. is a venture-backed start-up based in New York, publisher of one of the most popular
phone-based connected-car platforms that enable telematics features. With nearly 450,000 downloads
since the App launched in 2014, the platform collects real-world data from drivers around the world.
13Figure 2. Dash App highlights
When paired with their smartphone app, Dash collects information via the OBD II port. Phone sensors like
GPS, and supporting data like weather and traffic conditions give its users information on their driving
habits, energy consumption, fuel efficiency and the overall health of the vehicle’s systems.
Figure 3. Dash App screenshots
14» DATA INTEGRATION AND CITY FUNCTION
Data integration of multiple sources can provide more reliable findings than individual data sources alone.
Furthermore, the basic idea that lies behind it is to reach the full potential of data. Companies collect an
astonishing volume and variety of data, but some of the data go unused either because companies lack
the skills and experience needed to identify and gauge the value of these assets or simply because the
analysis of the data is beyond their business model.
Dash Labs, mentioned above, has a steady and growing base of users who drive through the streets of
New York daily and use the information generated by the telematics platform for their personal interest.
However, Dash users also generate useful information that, when aggregated so it is no longer personally
identifiable, can inform about collective driver behavior and the condition of NYC corridors and
intersections.
To prove this concept, the rest of this report explores the possibility of integrating Vision Zero datasets with
proprietary data from Dash Labs to better understand the potential of data integration.
15u DATA & METHODOLOGY
» DOT AND VISION ZERO
Vision Zero catalogs collisions between pedestrians, cyclists and vehicles in New York City. These collisions
are categorized by either fatalities or injuries. This can serve as a proxy for pedestrian, cyclist and driver
safety, but it relies on data reported by the NYPD. This means the dataset is likely not a complete picture
of accidents and collisions in the city. Minor accidents, even those with injuries, may go unreported for a
number of reasons. It also does not serve as a proxy for the perception of safety. A road user perceives the
safety of the road not just by the number of reported collisions, but by their actual experience on the road,
even if no collision occurs. This means close calls may contribute to a road user’s perception of safety, but
is not reported in any dataset.
» DASH
Dash collects users’ data through a proprietary app in two ways. The app leverages the user’s cell phone
sensors when activated, and records GPS position, time and accelerometer and gyrometer data. The app
may also collect data from the vehicle’s onboard sensors when a Bluetooth OBD dongle is plugged in and
a Bluetooth connection is established between the phone and the dongle. In total, the app records 42 data
fields from a combination of cell phone sensors, user input information and OBD sensors.
This study used primarily eleven fields: Unique vehicle ID, vehicle make, vehicle model, vehicle year, date,
time, latitude and longitude, miles per hour, and accelerometer x, y and z. OBD sensors also provide data
on battery usage, fuel usage, engine and oil temperature and airflow and pressure. Data for the eleven
fields used for this study was recorded at one second intervals. By connecting the time and location of
each second of data, individual trips can be extrapolated. The data in this study was recorded from
September 1st, 2017 to March 31st, 2018.
This study is focused on New York City driving and includes any points that fall within the city boundaries
regardless of whether the trip started or ended within the city boundaries. For example, if a trip starts in
New Jersey and ends in Long Island, but passed through Manhattan, Brooklyn and Queens, the segments
of the trip that were within New York City are included in the data for this study, but not the beginning and
ending segments outside the city boundaries.
» USER ANONIMITY
As part of Dash’s user agreement, the data cannot be traceable back to any individual user and must be
anonymized for third party use. The data used in this study has been anonymized by providing only a
randomized ID number, the unique vehicle ID, assigned to each vehicle. This study is also not focused on
individual trips. Instead, the study looks only at data points aggregated per road segment to ascertain
16average and maximum speeds. The unique vehicle ID is used to determine the number of unique vehicles
present in the data we are analyzing.
» DATA LIMITATIONS
Because Dash relies on its proprietary app and connection to the OBD port via a Bluetooth dongle to
collect data, the acquisition of data is limited in two ways: by the number of users and by the frequency of
app use by the users. Data is only collected when a user has activated the app and initiated a trip record.
The largest limitation of this dataset is the small user base. Each month of data had between 92 and 116
unique users and approximately six million seconds of driving recorded. Overall, the data includes 281
unique drivers over the six months data was recorded. This is limiting because many roads are traversed
by only one vehicle making any comparisons insignificant. The maximum number of vehicles that traversed
the same road segment over the six-month study window is 38.
Secondly, because the data is collected voluntarily, there is a strong selection bias. The data is not
collected from randomly selected participants and can therefore not be considered representative of the
city’s drivers at large. This limits the scope of the study to recommending use cases for the data rather
than identifying trends and patterns.
» METHODOLOGY
MEASURING SPEEDING
The Dash app records the current speed the vehicle is moving at one second intervals, as well as the
latitude and longitude of the vehicle. Using these three fields, it can be determined whether a car is
traveling above the speed limit on a given road. The speed limit of the road the vehicle is traveling on can
be identified by joining the location of each driving point to the underlying road in a GIS platform. In this
join, each interval recorded by the app is joined with the road information, including the speed limit of that
road segment. Because latitude and longitude are acquired from the GPS sensor in the user’s cell phone,
the longitude and latitude is not always accurate, or in some cases, it is not recorded at all. A user can
record data without allowing the phone to record location by turning off the phones location services. For
this analysis, all rows of driving data without latitude or longitude records were removed.
When the phone is recording position, the accuracy varies. To account for this variation, a 14 meter buffer
was used for each road in order to capture points that did not fall directly onto a road centerline. This
buffer distance was determined to be the largest buffer distance possible without overlap with buffers
from other road segments. Because this does not ensure a 100% capture rate when joining recording
points to roads, this process results in an approximate 2% loss of data.
Next, a spatial filter is applied using the “rgdal” package in R to filter vehicle point data by the speed limit
of the road segments. The package allows for the subsetting of a point shapefile by its location within or
outside of a polygon. In this case, we wanted to filter the driving data by the speed limits to ascertain the
17speed limit of the road each point falls on and create new point datasets for each class of road speed
limit.
The filter is applied over each month of data for each speed limit resulting in a new shapefile of points
containing only points that overlap the assigned speed limit. From each of these new shapefiles, the points
whose current speed was recorded at least 5 MPH over the assigned speed limit are selected as points
where speeding is occurring.
MEASURING BRAKING
The user’s cell phone is used to record accelerometer and gyrometer data once per second in three axes:
x, y and z. An accelerometer measures the rate of acceleration and makes it possible to detect moments
of hard braking. Because accelerometer readings are dependent on the orientation of the phone within the
vehicle, each unique vehicle will exhibit different readings for the x and y axes, but it is still possible to
derive a hard brake from the z axes. Most previous applications for detecting braking events with
accelerometers have used the Y axis to detected forward or backward forces. This is difficult to do without
having a standardized orientation of the device. The Z axes, which measures the force of gravity on the
device, can be used as a proxy because a sudden brake will quickly reduce the forces applied against
gravity. Detecting spikes in the downward force on the phone can be used to approximate hard braking.
For the purpose of avoiding the standardization of orientation issue, this study only detects hard braking
from one vehicle.
The standard deviation was determined for the z-axis and readings above the 95th percentile were
counted as hard brakes. The accelerometer reading is recorded every second along with latitude and
longitude, allowing for hard brakes to be mapped.
18u RESULTS
We found significant data in the area of speeding and speed mitigation measures. As such, our results
were divided in two categories of analysis: driver behavior and built environment. The first category
describes how drivers move through the city and how it relates to the perception of safety by showing the
location of speeding and hard braking events. The second category describes how the built environment
affects driving behavior and how effective are the interventions of traffic calming strategies by analyzing
areas where Street improvement projects and speed bumps have been implemented.
» DRIVER BEHAVIOR
There is currently a lack in understanding of driving behavior in cities. As such Vision Zero success metrics
are based on the number of fatalities and injuries on a given street. We find that this number is not
complete as it does not account for “near-misses” and is reliant on incidents that are reported rather than
all incidents that occur. There is great a potential for OBD data to enhance our understanding of driving
behavior in cities in order to take more targeted and efficient measures to mitigate problems.
SPEEDING EVENTS
Detecting speeding in New York remotely has long been a point of contention. Speed cameras have been
deployed in certain corridors within city limits, like school zones, but can only record speeding during
certain hours and only at that specific location. Dash data allows for a granular look at speeding without
interruption spatially or temporally. In mapping speeds and aggregating to roads by speed limit, patterns
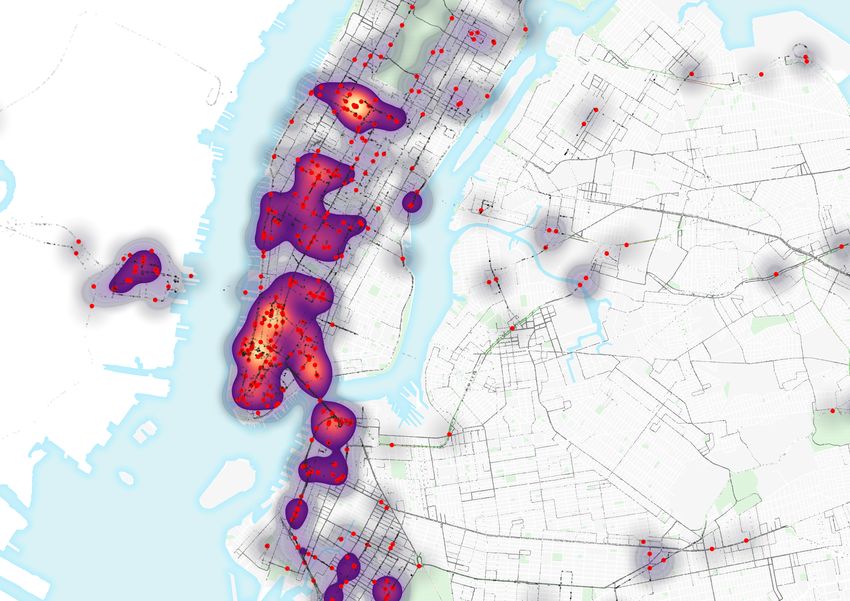
begin to emerge. The following image is a heat map of driving points that were detected as driving at least
5 miles over the speed-limit on the respective road segment.
19Map 1. Hot spots of speeding events
Speeding occurs throughout the city, but is concentrated in certain areas and more common along long
stretches of expressways. The most prominent concentration of speeding exists along the Henry Hudson
Parkway along the Upper West Side of Manhattan. Other parkways like the Belt Parkway and Gowanus
Parkway in Brooklyn and the Brooklyn Queens Expressway are also sites with concentrate speeding.
Parkways and Expressways have speed-limits of 50MPH, but we detected speeds over 100MPH in several
places. When broken down by speed limit, the concentrations of speeding in 25 MPH roads can be
isolated, or perhaps more notably, where it is absent. Speeding on 25 MPH roads occurs mostly in the
20outer boroughs along long stretches of roads, rather than among denser city blocks. Speeding on 25 MPH
roads is absent in denser areas like Lower Manhattan and Downtown Brooklyn.
Vehicle speeds can be aggregated by time of day and day of week to identify temporal patterns. To identify
the severity of speeding across multiple speed limit classifications, the percent of total drive time spent
exceeding the speed limit on a given road can be calculated. The following graph depicts the percent of
travel time spent exceeding the speed limit on all roads. Percent of travel time speeding is calculated as
the percent of points total driving points traveling above zero miles per hour that exceed the speed limit on
the road it falls over. In other words, the percent of moving speeds that exceed the speed limit. As
expected, speeding spikes around midnight each day except Sunday. Sunday nights had both the lowest
overall drive time and points of speeding.
Figure 4. Percent of Vehicle Travel time in NYC spent speeding
Speeding does not occur evenly across all road types however. To better understand this dynamic,
speeding points were aggregated by road type and time of day. The following graphic depicts the percent
of points above zero miles per hour exceeding the speed limit by time of day.
21Figure 5. Percent Speeding by time of day by street speed limit
Speeding is most rare on 25 MPH streets and the percent of time spent speeding is relatively constant
throughout the day. Speeding on 30MPH streets, which include several bridges and roads in Outer Queens
sees drops in speeding during times of congestion at the AM and PM peaks. On 35 MPH roads, which
includes bridges that cross the East River and the Verrazano Bridge also remain relatively constant, with a
spike in speeding during the night. About 40% of drive time during the day on 35 MPH streets is spent
speeding. The highest percentage of drive time spent speeding occurs on 50MPH streets, which are
exclusively expressways, at night when 92% of drive time is spent at speeds in excess of 50 MPH.
Vehicles speeds on different classifications of speed limits can also be aggregated to buckets based on
the percent of the speed limit. The following graph aggregates recorded points to buckets based travel
speed as a percent of the speed limit. For example, if a vehicle is recorded traveling at 38 MPH on a street
22with a 50 MPH speed limit, the vehicle is traveling at 76% the speed limit and the point is aggregated to
the 60%-80% bucket. If the vehicle is recorded traveling at 15 MPH on the same street, it is traveling at
30% of the speed limit and aggregated to the 20-40% bucket. This allows for further contextualization of
speeding by breaking the time at different brackets of the speed limit. Ideally, with no congestion and no
speeding, vehicles should spend the most time traveling between 80% and 100% of the speed limit.
This ideal scenario would optimize travel times while keep vehicles moving at a safe travel speed.
However, the 80%-100% travel speed bucket is the smallest bucket on every road classification except 15
MPH and 35 MPH. Points recorded as traveling over the speed limit outnumber the 80% - 100% bucket on
all roads but 15 MPH and 45 MPH roads. In fact, traveling over the speed limit is the largest bucket on 30
MPH, 35 MPH, 40 MPH and 50 MPH roads. This suggests that speed limits do not limit a vehicle's speed,
rather it is congestion that controls speeding. It appears that vehicles exceed the speed limit when it is
possible, but spend the majority of time driving below 60% of the speed limit.
Figure 6.Travel speed by percent of road speed limit, all cars by road speed limit
23It is possible to test this theory that speed limits do not limit a vehicle’s speed as much as congestion by
measuring the rate of vehicle’s reach the speed limit and continue driving at the speed limit, versus the
rate that vehicles that meet and exceed the speed limit. This is achieved by counting the frequency that a
vehicle reaches the speed limit and continues to exceed the speed limit for each road class.
Figure 7. Proportion of drivers that over speed when reach speed limit
On 25 MPH streets, vehicles that reached speeds above 20 MPH went on to exceed the speed limit 35% of
the time. This suggests a significant portion of vehicles recorded as traveling between 20 MPH and 25
MPH, the optimal travel speed, were accelerating towards higher speeds. This effect is much more severe
on 50 MPH roads, where vehicles that reached 45 MPH went on to exceed the speed limit 52% of the
time. This suggests that over half the vehicles that are able to travel at, or just below, the speed limit on 50
MPH will go on to speed.
Speeding also does not occur evenly across boroughs. The points recorded exceeding the speed limit can
be aggregated to borough level.
24Figure 8. Percent moving time spent speeding by Borough
Speeding can also be aggregated to the type of vehicle being driven. This allows for the detection of
patterns by vehicle make and model. Below is a chart that depicts the percent of travel time spent
speeding by total points recorded, a proxy for drive time. Vehicles falling high on the X axis and low on the
Y axis are vehicles that drive often but seldom speed. Vice versa, vehicles falling high on the Y axis and low
on the X axis are vehicles that seldom drive, but spend a high percentage of their drive time exceeding the
speed limit.
25Figure 9. Percent moving time spent speeding by car type
Ford Fiestas in the dataset exhibit the most drive time and a strikingly low rate of speeding. The top two
vehicles by rate of speeding are both Acura SUVs and have a relatively low total drive time. Most vehicles
fall on this low end of drive time and approximately a 12% rate of speeding.
Max speeds can also be measured by vehicle type and can be useful in identifying patterns of excessive
speeding associated with vehicle characteristics.
Vehicle Maker Vehicle Model Max Speed
Toyota Corolla 134 MPH
Volkswagen Golf R 122 MPH
Toyota Prius 113 MPH
Acura RL 113 MPH
Toyota Highlander 110 MPH
Table 1. Max speed by car, Top 5
26HARD BRAKING EVENTS
Using the vehicle with the most driving time in the city, hard braking events were detected using the user’s
cellphone’s built in accelerometer. Concentrations of hard-braking can be used to determine problematic
areas for both drivers and pedestrians. Hard brake events can be measured in two ways: as exceeding a
predetermined threshold of g-force or as exceeding a certain percentile g-force computed across all
braking events on a per-trip or per-drive basis.
A hard brake is detected by a g-force measuring forward momentum. Determining which axis measures a
forward momentum is determined by the orientation of the users cellphone. Our analysis found that there
were two prominent orientations for users cellphones, portrait and landscape.
Figure 10 .Hard brake detection, phone in portrait position
Figure 11. Hard brake detection, phone in landscape position
27With an algorithm to automate the detection of the phone’s orientation, it would be possible to run a hard
braking analysis on all users. This study is concerned with the application and visualization of hard brake
data, and data from only one vehicle is used in the following map.
The following map displays the top two percent of braking events measure by g-force for this particular
driver and with a kernel density layer to show concentration of hard brakes.
Map 2. Top two percent of braking events
Currently, priority for road interventions are based on reported collisions, injuries and deaths. However,
this does not tell the whole story of the road conditions and driver behavior. For one, reporting collisions is
optional, leaving the city with incomplete data. Secondly, when reported, there is little standardization for
how collisions are reported, causing discrepancies and perhaps bias in existing collision data regarding the
situation, fault and severity of the event. Finally, collisions are not the only metric that influences a road
user’s perception of safety. Near-misses can also influence the perception of safety, even when there are
no reported collisions. Hard-braking can therefore be used as a proxy for road safety. With the correct
thresholds for defining a hard-braking event set, hard-braking analysis detects collisions and near-misses
equally. For example, accelerometer data can detect the forward force from a sudden stop whether a car
brakes quickly or is involved in a collision and comes to a stop.
28WEATHER
Using the “Weather Underground” package for R, hourly rainfall in inches were derived for several months
in 2017 and 2018. The findings did not show significant correlation between speed and rainfall. The
following graphic depicts rainfall in December 2017 compared to speed on 25 mile per hour roads across
all five boroughs.
Figure 12. Speed on 25 MPH Roads & Precipitation, December
29» BUILT ENVIRONMENT
The New York City Department of Transportation (DOT) classifies any major street improvement project as
a “Capital Street Project”. Such projects include street and sidewalks milling and repaving and
reconstruction of sewer and utilities. Capital Street Projects are often undertaken to meet broader city
initiatives such as Vision Zero. Capital Street Projects that are relevant to Vision Zero include traffic
calming infrastructure, school and pedestrian safety design, public plazas, greenways and bicycle lanes.
Currently, the success of these projects is based on traffic counts, reported accidents and recorded
fatalities. If accidents and fatalities decline after the implementation of a Capital Street Project, the project
is deemed a success. Though these metrics can aid in revealing the success of a given project, data from a
program like Dash may be utilized to improve this analysis.
Traffic calming devices such as curb extensions, traffic diverters, median barriers, speed bumps and
raised crossings serve to make street safer by reducing the potential for aggressive driving. These projects
are typically developed based on analysis by the DOT based on street condition or requests from
community members. If funding is available, the project is added to the Agency’s Capital Plan and the DOT
develops a project scope and conceptual design. As the project design is finalized, the DOT compiles a
cost estimate and transfers the project to the Department of Design and Construction. The project is then
taken to the local community board and the Office of Management and Budget for finalization. In the
planning phase, OBD data can be utilized in the identification of problematic streets and intersections and
to provide more robust data to the public to express need for the project.
STREET IMPROVEMENT PROJECTS
Street Improvement Projects are a piece of New York City’s greater Vision Zero plan. In an effort to reach
the goal of 50% fewer traffic fatalities by 2025, the City has begun to identify problematic intersections
and implement traffic calming measures such as enhanced crosswalks, pedestrian islands and enhanced
traffic signaling. Currently, the effectiveness of these projects is measured based on fatality and injury
counts at the intersection level. Though this gives a basic picture of problematic roads and areas of
concern, a City like New York would benefit from the precision and frequency of OBD data in order to both
identify priority areas and to evaluate the success of Street Improvement Projects.
The red lines on Map 4 identify all Street Improvement Projects completed in 2017. They are distributed
across all five boroughs and range in size. Using all Dash data, we are able to demonstrate all trips taken
on those corridors and account for speed based on posted speed limits. Map 5 provides a glance at what
vehicle speeds were along these corridors from January, 2017 through March, 2018.
30Map 3. Street Improvement Projects Map 4. Speeds Along Street Improvement
Completed in 2017 Corridors
Taking a closer look at specific streets along Street Improvement Project corridors, allows up to visualize
what speeding looks like in a given area both prior to and following the implementation of a traffic calming
project. Though there is currently not enough data to make a conclusive statement about speed patterns
and relation to traffic calming projects, the following maps illustrate the potential that data from OBDs has.
With a bigger sample pool, this data could greatly inform decisions on where to target projects and help in
evaluating their success.
Map 5. Queens Boulevard: Before & After Street Improvement Project
31Map 6. 7th Ave: Before & After Street Improvement Project
Map 7. Grand Concourse: Before & After Street Improvement Project
SPEED HUMPS
Granular driving data allows for tracking driving behavior at a much finer rate that traditional sensing
methods like traffic counters or speed radars. We identified quick accelerations on streets with speed
humps, which may serve as a proxy for measures of safety effectiveness of this traffic-calming
intervention. We found that many vehicles accelerate quickly after speed humps, returning to a high
speed. In this way, speed humps are producing only very localized traffic calming.
32The following two maps show the average speed recorded by drivers per section of blocks where speed
humps are present. These two Brooklyn streets, Hancock and President, both clearly exemplify quick
accelerations after passing over speed humps midblock.
Map 8. Speed Bump analysis
When the maximum recorded speeds on blocks with speed humps are compared that are nearby blocks
with no speed humps are compared, we found mean, median and maximum speeds to be very similar, and
33in certain instances, speeds on blocks with speed humps are higher than those without. This could be
because the drivers perceive speed humps as greatly slowing their average speed, and therefore
increasing trip time, and they accelerate to make up time.
While this data is not conclusive given the small sample size, it presents a use case for OBD data in
identifying driving behavior changes on a per second basis. Traditional sensing methods may miss these
small scale behavioral changes because they are only able to record speeds at a given point and it is too
costly deploy many sensors through a neighborhood. It is also not possible to be certain that vehicle
speeds being sensed in two different locations are recorded from the same vehicle.
In a comparison between all 25 MPH streets in all five boroughs and all 25 MPH streets where speed
humps are present, the difference in median speed is marginal at 12.4MPH for streets with speed humps
versus 14 MPH on streets without.
Figure 13. Speed on 25 MPH roads with and without speed humps by neighborhood
Neighborhood Average Speed (MPH) Median Speed (MPH) Max Speed (MPH)
NYC
Speed Humps 13.5 12.4 65
34No Speed Humps 16.1 14 112
Crown Heights
Speed Humps 19.7 19 65
No Speed Humps 12.1 11.8 57
Park Slope
Speed Humps 10.6 10.6 35
No Speed Humps 12 11.8 33
LIC
Speed Humps 8.2 7.6 17
No Speed Humps 9.2 7.6 28
Table 2. Speed Humps Statistics
35u POLICY IMPLICATIONS AND CONCLUSION
In light of the street safety concerns facing New York City, the results of this analysis show that a
combination of public data and real-time user-generated data that is collected and transmitted by
telematics platforms could both improve the current understanding of vehicle activity and enable us to
discover new approaches to better address safety issues. Though the analysis performed in this report
does not contain enough evidence to be conclusive for the city, it can serve as a proof of concept of how
effective real-time user-generated data can be when integrated with public policy.
As technology that facilitates this integration continues to permeate the society and improve, it is
imperative that cities considers taking advantage of this untapped resource in order to make better
informed planning decisions. Expecting that the trend of connected cars and automated vehicles
continues to grow, below are five potential approaches that cities can implement to help create safer
streets, minimize congestion and improve air quality.
» HOLDING TRAFFIC VIOLATORS ACCOUNTABLE
Although moving violations exist to curb behaviors that are considered threats to public safety, they
are loosely enforced by city police. On average, NYPD issues 10 times more parking tickets than moving
violations (Office of the New York City Comptroller, 2017). This pattern is partially the result of policy that
discourages enforcement of moving violations by the local police department. A significant amount of
moving violation revenues are retained by the state government to cover the cost of adjudication, while
revenue from non-moving violation fines, like parking tickets, is collected entirely by the city (Office of the
New York City Comptroller, 2017). Encouraged by this revenue differential, the city police department has
invested heavily in the enforcement of non-moving violations. The current revenue sharing policy should be
modified in order to incentivize local precincts to focus on moving violations as much as non-moving and
other violations. While existing technologies, like traffic cameras, allow for the automated speed detection
and fine issuance, the politics surrounded such technology has slowed its implementation. As
demonstrated by our findings, platforms like Dash allow authorities to access real-time driving data and
more efficiently enforce moving violations. This allows for targeted enforcement that can be more effective
and require less resources to achieve a safer street environment.
» RECLAIMING PARKING SPACES
Free parking spaces incentivize driving and deteriorate the livelihood of a city due to increased
traffic congestion and air pollution. In New York City, there are between 3.3 and 4.4 million on-street
parking spaces and fewer than 2.4 percent have a meter (Weinberger, Seaman, Johnson, & Kaehny,
2008). Free and underpriced parking spaces are associated with a longer duration of parking and a higher
rate of parking space occupancy. The future of cities with the arrival of an automated vehicle will require
fewer parking spaces, as fewer idle cars would need them. Recent trends are signaling a possibility for the
city to begin reclaiming unused parking spaces for other valuable purposes sooner than expected.
Ridership of ride-sharing service is increasing rapidly and car ownership is growing slower (NYC
36Department of Transportation (DOT), 2016). New York City, however, is facing challenges in making
rigorous decisions due to limited information about parking, particularly non-metered on-street parking
spaces. The telematics platform would help eliminate that challenge by providing the city with the needed
data such as real-time parking occupancy. Given a higher accuracy data, the city would be able to adjust
policies like the minimum parking requirement to proportionally fit its demand and repurpose the space to
make the city more livable.
» AUTOMATING VEHICLE INSPECTION PROCESS
Typical manual inspection requires vehicle presence in an inspection facility that takes away the
time that would otherwise be used for other productive means. There are 792,000 registered vehicles in
New York City that are subject to a periodic vehicle inspection. With periodic inspection, additionally, the
city has little control over what occurs after an inspection (NYC Department of Transportation (DOT),
2016). A vehicle might break down and operate below the safety standards before it is due for another
inspection. The telematics platform generates accurate and actual data that enable cities to virtually
monitor vehicles engines in real time. A pilot project involving telematics platform by The Taxi and
Limousine Company has demonstrated a strong interest from the industry to adopt innovative
technologies that bring additional benefits (NYC Taxi and Limousine Commission (TLC), 2015). This
indicates a prospect of an automation of the vehicle inspection process using the telematics platform at
an industry scale. Successful implementation at that scale can generate meaningful lessons that the city
can draw for a larger scale implementation.
» OPPORTUNITIES FOR NEW ROAD PRICING PLANS
Road pricing schemes like congestion pricing commonly involve a collection of fees for vehicles
passing through a facility or designated zone. Such schemes, including the recent congestion pricing
proposal for New York City, are focused on improving traffic congestion conditions but are nearsighted in
their approach as they are often Manhattan-centric. Current trends show that employment is growing
outside Manhattan where real estate is more affordable (Office of the State Deputy Comptroller for the City
of New York, 2018). Job growth in the private sector in Brooklyn and Queens within the period of 2009-
2017 had reached 38 percent and 24 percent, respectively, which outpaced a 20 percent of that in
Manhattan within the same period. This affordability is often tangential to a lack of transit accessibility and
may serve to increase vehicle miles traveled in the area, aiding in congestion. In such areas where
automobile dependency is likely to increase, like the Brooklyn Navy Yard there is an opportunity to use the
data generated by telematics platform to better understand trends and anticipate needs. Access to real-
time vehicle usage would allow the city to tailor new road pricing scheme that targets undesirable driving
behaviors and patterns across the five boroughs.
» LEVERAGING USAGE-BASED INSURANCE
37You can also read


