Impact of airborne cloud radar reflectivity data assimilation on kilometre-scale numerical weather prediction analyses and forecasts of heavy ...
←
→
Page content transcription
If your browser does not render page correctly, please read the page content below
Nat. Hazards Earth Syst. Sci., 19, 907–926, 2019
https://doi.org/10.5194/nhess-19-907-2019
© Author(s) 2019. This work is distributed under
the Creative Commons Attribution 4.0 License.

Impact of airborne cloud radar reflectivity data assimilation
on kilometre-scale numerical weather prediction analyses and
forecasts of heavy precipitation events
Mary Borderies1 , Olivier Caumont1 , Julien Delanoë2 , Véronique Ducrocq1 , Nadia Fourrié1 , and Pascal Marquet1
1 CNRM   UMR 3589, Météo-France, CNRS, Toulouse, France
2 LATMOS,  IPSL, Université Versailles St-Quentin, CNRS, UPMC, Guyancourt, France

Correspondence: Mary Borderies (mary.borderies@meteo.fr)

Received: 25 October 2018 – Discussion started: 12 November 2018
Revised: 4 March 2019 – Accepted: 10 March 2019 – Published: 18 April 2019

Abstract. This article investigates the potential of W-band       of RASTA wind data alone. Generally, the joint assimilation
radar reflectivity to improve the quality of analyses and fore-   of the W-band reflectivity with wind data results in the best
casts of heavy precipitation events in the Mediterranean area.    improvement in the rainfall precipitation forecasts. Conse-
The “1D+3DVar” assimilation method, operationally em-             quently, results of this study indicate that consistent thermo-
ployed to assimilate ground-based precipitation radar data in     dynamic and dynamic cloud conditions in the analysis leads
the Météo-France kilometre-scale numerical weather predic-        to an improvement of both model initial conditions and fore-
tion (NWP) model AROME, has been adapted to assimilate            casts. Even though to a lesser extent, the assimilation of the
the W-band reflectivity measured by the airborne cloud radar      W-band reflectivity alone also results in a slight improvement
RASTA (Radar Airborne System Tool for Atmosphere) dur-            of the rainfall precipitation forecasts.
ing a 2-month period over the Mediterranean area. After ap-
plying a bias correction, vertical profiles of relative humid-
ity are first derived via a 1-D Bayesian retrieval, and then
used as relative humidity pseudo-observations in the 3DVar        1   Introduction
assimilation system of AROME. The efficiency of the 1-D
Bayesian method in retrieving humidity fields is assessed us-     Kilometre-scale numerical weather prediction (NWP) mod-
ing independent in-flight humidity measurements. To com-          els are now able to explicitly resolve convection, and to rep-
plement this study, the benefit brought by consistent thermo-     resent clouds and precipitation with a reasonable degree of
dynamic and dynamic cloud conditions has been investigated        realism (Gustafsson et al., 2018). Doppler radar observations
by separately and jointly assimilating the W-band reflectivity    are particularly well suited to initialize these NWP mod-
and horizontal wind measurements collected by RASTA in            els because they provide wind and reflectivity measurements
the 3 h 3DVar assimilation system of AROME.                       at a comparable spatial and temporal resolution. Conse-
   The data assimilation experiments are conducted for a sin-     quently, observations from ground-based precipitation radars
gle heavy precipitation event and then also for 32 cases. Re-     are operationally assimilated in many kilometre-scale NWP
sults indicate that the W-band reflectivity has a larger im-      models to initialize precipitation areas (Gustafsson et al.,
pact on the humidity, temperature and pressure fields in the      2018). However, ground-based precipitation radars have a
analyses compared to the assimilation of RASTA wind data          very poor sensitivity to clouds. Hence, the increased num-
alone. Besides, the analyses get closer to independent hu-        ber of Doppler cloud-profiling radars (Wolde and Pazmany,
midity observations if the W-band reflectivity is assimilated     2005; Delanoë et al., 2013, 2016; Illingworth et al., 2015;
alone or jointly with RASTA wind data. Nonetheless, the im-       Chahat et al., 2016) is extremely appealing in data assim-
pact of the W-band reflectivity decreases more rapidly as the     ilation to initialize kilometre-scale NWP models in cloudy
forecast range increases when compared to the assimilation        areas. Indeed, cloud-profiling radars, either operating in the

Published by Copernicus Publications on behalf of the European Geosciences Union.
908                                              M. Borderies et al.: Impact of the assimilation of W-band radar reflectivity

Ka-band ( ≈ 35 GHz) or in the W-band (≈ 95 GHz), provide            ing a technique combining a one-dimensional variational
valuable observations on cloud microphysical properties and         (1DVar) assimilation method followed by a four-dimensional
light-to-moderate precipitation (Kollias et al., 2007). In addi-    variational (4DVar) assimilation method, Janisková (2015)
tion, compared to lower-frequency radars, they require small        performed several assimilation experiments with the global-
antennas to provide high spatial resolution measurements,           scale NWP model Integrated Forecasting System (IFS). To
which makes them more easily deployable aboard moving               take full advantage of the W-band reflectivity in cloudy ar-
platforms such as spacecraft or aircraft (Kollias et al., 2007).    eas, Janisková (2015) applied an appropriate bias correction
Besides, recent technological breakthroughs might lead to a         scheme which depends on the altitude and on the tempera-
deployment of lower-cost ground-based W-band radar net-             ture. Results suggest a slight positive impact on the subse-
works (Delanoë et al., 2016).                                       quent forecasts when appropriate bias correction, error es-
    Over the last few years, cloud radar data have been used        timates and quality controls are performed. However, be-
several times for kilometre-scale NWP model validation              cause of the inability of the reflectivity forward operator
(Di Michele et al., 2012; Iguchi et al., 2012; Hashino et al.,      (Di Michele et al., 2012) to simulate the multiple scattering
2013; Borderies et al., 2018), but only a few studies were          effects, observations of the most convective situations were
devoted to evaluate their potential in data assimilation. In        rejected from the assimilation process. Storto and Tveter
particular, within the Japan Meteorological Agency’s (JMA)          (2009) also employed a two-step method consisting of a one-
non-hydrostatic model (JMA-NHM) with an ensemble vari-              dimensional Bayesian retrieval of relative humidity pseudo-
ational method (Aonashi and Eito, 2011), Okamoto et al.             observations, followed by a 3DVar assimilation method in
(2016) performed a direct assimilation of vertical reflectiv-       the ALADIN NWP model (Fischer et al., 2005). Results
ity profiles of the dual-frequency precipitation radar (DPR)        show that, despite the small number of assimilated observa-
reflectivity observations from the Global Precipitation Mea-        tions, the impact of relative humidity pseudo-observations is
surement (GPM) core observatory (Hou et al., 2014) for the          greater in areas poorly covered by the conventional observa-
case of Typhoon Halong in July 2014. The assimilation of            tion networks, such as over the oceans. However, Storto and
DPR data resulted in an improvement in the rain mixing ratio        Tveter (2009) failed to identify a case study for which the
and updraught. However, because of negative model biases            humidity pseudo-observations led to a significant impact on
in the ice regions, observations were discarded in and above        the analysis and on the subsequent forecasts.
the melting layer. Therefore, Okamoto et al. (2016) did not            So far, the impact of the assimilation of W-band radar re-
take advantage of the cloud-affected observations measured          flectivity in a kilometre-scale NWP model, with horizontal
by the Ka-band radar, which are very sensitive to clouds. In        resolutions of less than 3 km, has never been investigated.
addition, ensemble variational methods are costly in terms          Therefore, the primary objective of this article is to inves-
of computing time, which hampers their use in most current          tigate the benefits brought by the assimilation of W-band
operational systems.                                                radar reflectivity measurements to improve the forecasts of
    Assimilating reflectivity with traditional variational assim-   the heavy precipitation events that regularly occur in the
ilation techniques (3DVar and 4DVar) remains challenging.           Mediterranean area. Indeed, the accurate forecasting of the
Indeed, the linearization of the observation forward operator       timing, position and intensity of such mesoscale convective
is not straightforward. In addition, it is necessary to add hy-     systems remains a challenge (Duffourg et al., 2016; Martinet
drometeor contents in the control variables, which requires us      et al., 2017). Doppler cloud radar data also provide valu-
to specify the associated forecast error covariances. Besides,      able information on dynamical cloud properties. Borderies
the assimilation of humidity, wind and temperature variables        et al. (2019) highlighted a positive impact of the assimi-
have a larger impact on the forecasts compared to hydrome-          lation of such data in a kilometre-scale NWP model. The
teor observations (Fabry and Sun, 2010). Consequently, sev-         joint assimilation of W-band reflectivity measurements with
eral studies used indirect assimilation methods to assimi-          wind data measured by Doppler cloud radar is expected to
late cloud radar reflectivity measurements (Storto and Tveter,      provide more consistent thermodynamic and dynamic cloud
2009; Janiskovà et al., 2012; Janisková, 2015). The reflec-         conditions in the initial state. Nonetheless, Bachmann et al.
tivity profiles are first inverted into pseudo-observations that    (2018) suggested that the joint assimilation leads to skill
are closer to the control variables of the NWP model (such          scores which are comparable to the experiments in which
as temperature or humidity) through the use of either a 1-          reflectivity and Doppler velocity observations are assimi-
D variational assimilation technique (Janiskovà et al., 2012;       lated independently. However, their data assimilation exper-
Janisková, 2015) or a 1-D Bayesian retrieval (Storto and            iments were conducted in an idealized setup, and the obser-
Tveter, 2009). These pseudo-observations are then assimi-           vations were provided by ground-based precipitation radar
lated into the variational assimilation system like any other       data. Therefore, to investigate the benefit brought by con-
conventional observation. In most of these studies, cloud pro-      sistent thermodynamic and dynamic cloud conditions in the
filing radar (CPR) data on board CloudSat (Stephens, 2005)          initial state, the W-band reflectivity will be separately and
satellite were assimilated in NWP models running at coarse          jointly assimilated with horizontal wind data measured by a
horizontal resolutions (larger than 10 km). For example, us-        Doppler W-band radar.

Nat. Hazards Earth Syst. Sci., 19, 907–926, 2019                            www.nat-hazards-earth-syst-sci.net/19/907/2019/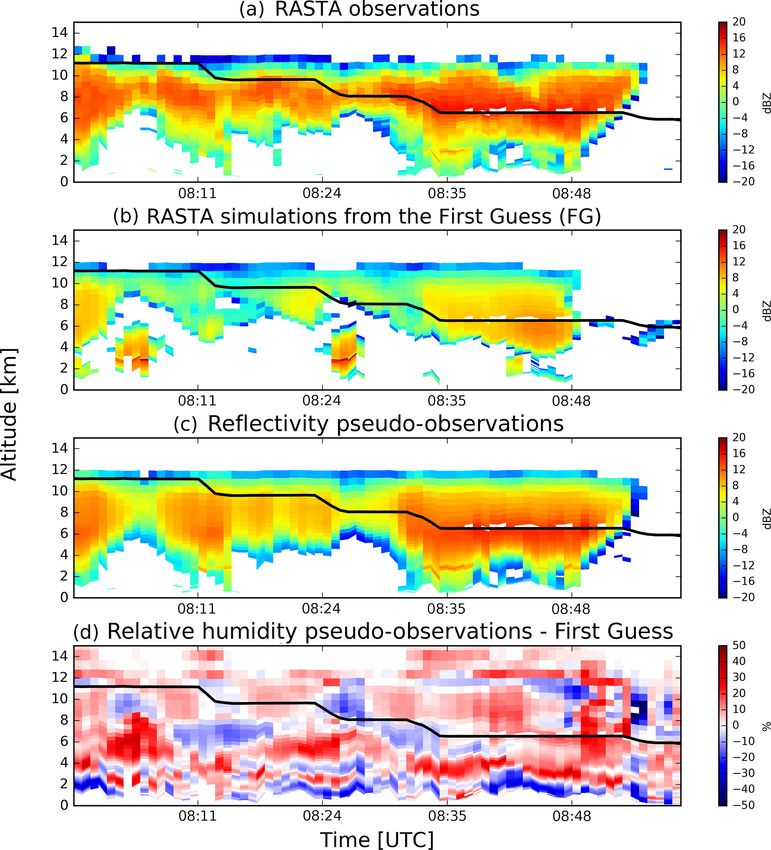
M. Borderies et al.: Impact of the assimilation of W-band radar reflectivity                                                 909

   To assess the potential of Doppler W-band radar data to       2.1   The Doppler W-band radar RASTA during the
improve short-term forecasts of heavy precipitation events,            HyMeX-SOP1
we take advantage of the data collected by the airborne
Doppler W-band radar RASTA (Radar Airborne System Tool           The airborne cloud radar RASTA is a monostatic Doppler
for Atmosphere; Delanoë et al., 2013) in 2012 over the west-     multi-beam antenna system operating in the W band at
ern Mediterranean area during the HyMeX first “special ob-       95 GHz (Bouniol et al., 2008; Protat et al., 2009; Delanoë
serving period” (HyMeX-SOP1; Ducrocq et al., 2014) ded-          et al., 2013). The aircraft platform used is the French Fal-
icated to heavy precipitation events. The W-band reflectiv-      con 20 research aircraft from the SAFIRE unit (Service des
ity and wind measurements collected by RASTA are sep-            Avions Français Instrumentés pour la Recherche en Envi-
arately and jointly assimilated into the 3DVar assimilation      ronnement). RASTA has six Cassegrain antennas to measure
system of a special version, named AROME-WMed (Four-             the reflectivity and radial velocity in three non-collinear di-
rié et al., 2015), of the Météo-France operational convective-   rections above and below the aircraft. The maximum unam-
scale model AROME (Seity et al., 2011). The impact of the        biguous distance is 15 km with an unambiguous velocity of
assimilation of RASTA data in synergy with all other con-        7.8 m s−1 (the pulse repetition frequency equals 10 kHz).
ventional assimilated data is first evaluated for one of the        After processing, the Doppler velocities of the three
most significant rainfall events which occurred during the       upward-looking and downward-looking antennas are com-
“intensive observing period” 7a (Hally et al., 2014, IOP7a)      bined to retrieve the three components of the wind field above
of the HyMeX-SOP1. Next, the experiments are run for 32          and below the aircraft (Bousquet et al., 2016). The measure-
case studies of the HyMeX-SOP1 in which RASTA data are           ments are collected at a time resolution of 250 m s−1 (i.e.
available. The “1D+3DVar” assimilation method of Caumont         1.5 s between two measurements of the same antenna) and
et al. (2010), used operationally to assimilate ground-based     at a vertical resolution of 60 m. In addition, this study takes
precipitation radars in AROME (Wattrelot et al., 2014), is       advantage of the reflectivity measurements collected by the
particularly well suited for vertically pointing radars and is   nadir- and zenith-pointing antennas. The zenith-pointing an-
thus employed to assimilate the W-band reflectivity observed     tenna is slightly less sensitive than the nadir-pointing antenna
by RASTA. Vertical profiles of relative humidity are first de-   (−26 dBZ versus −27 dBZ at 1 km).
rived via a 1-D Bayesian retrieval, and then used as pseudo-        Therefore, this unique instrument allows for the recording
observations in the 3DVar assimilation system of AROME.          of the microphysical and dynamic properties of clouds in the
For the first time, a validation of the 1-D Bayesian retrieval   vertical at a high resolution of 60 m and quasi-continuously
with in situ humidity measurements is performed in this          in time (≈ 1.5 s) during the flights. In particular, during
study.                                                           the HyMeX-SOP1, RASTA collected data during 18 flights
   This article is organized as follows. In Sect. 2, the data    in stratiform (72.6 %), convective (14.3 %) and clear-sky
collected by the RASTA airborne Doppler W-band radar are         (13.1 %) columns over land, sea and complex terrain (Bor-
presented, followed by a brief description of the NWP model      deries et al., 2018). RASTA flight tracks during the HyMeX-
AROME-WMed with its 3 h 3DVar assimilation system. Sec-          SOP1 are represented by the black lines in Fig. 1. Further
tion 3 provides a full description of the 1D+3DVar assimila-     details about the RASTA configuration during the HyMeX-
tion method used to assimilate the W-band radar reflectivity.    SOP1 are given by Bousquet et al. (2016).
The different data assimilation experiments are presented in
Sect. 4. These different experiments are evaluated in Sect. 5,   2.2   The AROME-WMed NWP model
followed in Sect. 6 by an evaluation of the 32 assimilation
cases of the SOP1. Conclusions are drawn in Sect. 7.             This study is performed with a special version of the Météo-
                                                                 France operational kilometre-scale NWP model AROME
                                                                 (Seity et al., 2011), named AROME-WMed (Fourrié et al.,
2   NWP model and radar data                                     2015). AROME-WMed, which covers the entire northwest-
                                                                 ern Mediterranean Basin, was specially designed for the
This study takes advantage of the data collected by the
                                                                 HyMeX-SOP1 and ran in real time to plan the airborne oper-
RASTA Doppler W-band radar during the HyMeX first spe-
                                                                 ations, especially in the mesoscale convective systems. The
cial observing period (HyMeX-SOP1), which took place
                                                                 AROME-WMed domain is displayed in Fig. 1. AROME-
from 5 September to 5 November 2012 over the western
                                                                 WMed runs at a horizontal resolution of 2.5 km with 60 ver-
Mediterranean (Ducrocq et al., 2014). The main goal of the
                                                                 tical levels ranging from approximately 10 m a.g.l. to 1 hPa.
HyMeX-SOP1 was to document the heavy rainfall events
                                                                 The deep convection is explicitly resolved and the micro-
that regularly affect the Mediterranean area.
                                                                 physical processes are governed by the ICE3 one-moment
                                                                 bulk microphysical scheme (Pinty and Jabouille, 1998).
                                                                 Six water species are predicted by AROME-WMed (water
                                                                 vapour, rain, cloud liquid droplets, snow, pristine ice and
                                                                 graupel). The particle size distributions (PSDs) are expressed

www.nat-hazards-earth-syst-sci.net/19/907/2019/                           Nat. Hazards Earth Syst. Sci., 19, 907–926, 2019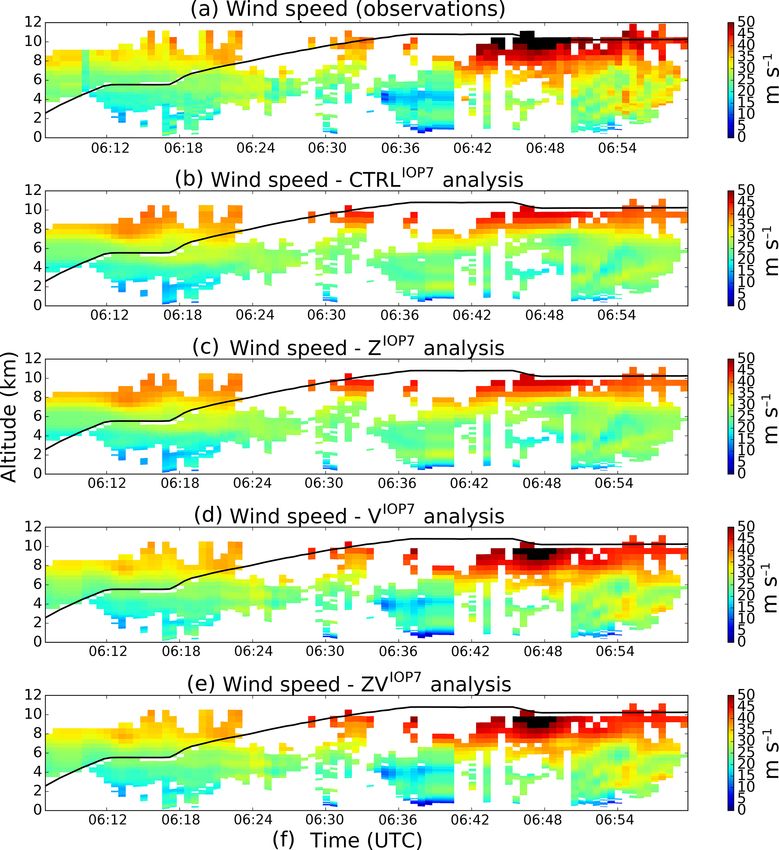
910 M. Borderies et al.: Impact of the assimilation of W-band radar reflectivity
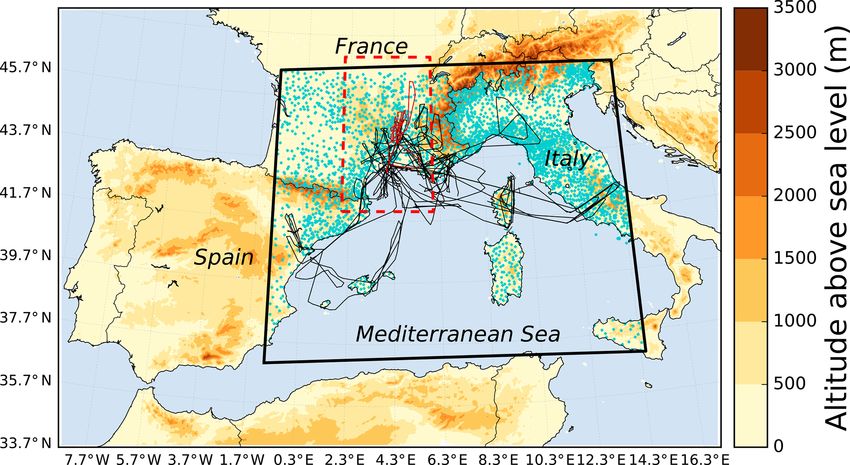
Figure 1. The Falcon 20 flight tracks (black lines) during the HyMeX first special observing period over the AROME-WMed domain. The
Falcon 20 flight track during IOP7a (flight 15) is indicated by the red line. IOP7a case study is delimited by the red box. The altitude of
ground above sea level (in metres) is represented by the colour shades. The rain gauges are represented by the blue markers. The black box
shows the domain used for the impact study in Sect. 6.1.
as generalized gamma distributions multiplied by the total of the zenith- and nadir-pointing antennas. Ground clutter is
number concentrations. PSDs are reduced to exponential dis- also removed. To reduce observation and representativeness
tributions for snow, graupel and rain. errors, RASTA data are interpolated in the model vertical
The analyses of the ARPEGE global operational NWP and horizontal resolutions. For the reflectivity measurements,
model are used to provide boundary conditions. AROME- this interpolation is done by taking the average value (in
WMed has a 3 h 3D variational (3DVar) data assimilation mm6 m−3 ) of all data available along the aircraft track within
system (Brousseau et al., 2014) based on an incremental for- a box of 2.5 km length between the two half model levels
mulation (Fischer et al., 2005). The control variables of this surrounding each model level. From a given range from the
system are temperature, specific humidity, surface pressure, radar, when the aircraft roll and/or pitch angles are greater
vorticity and divergence. The resolution of the analysis grid than a threshold (|roll| > 7◦ at 10 km range), some measure-
is the same as that of AROME-WMed. Following the results ments might come out of the grid box of interest (Borderies
of Brousseau (2012), the incremental analysis update (IAU; et al., 2019). Therefore, these data are removed from the in-
Bloom et al., 1996) is not used for the 3DVar assimilation terpolation. The same interpolation is done for the retrieved
scheme. Background error covariances were computed us- horizontal wind component except that a median filter is em-
ing a period characterized by convective systems in Octo- ployed. Indeed, applying a median filter instead of averag-
ber 2010 over the northwestern Mediterranean region (Four- ing allows us to reduce the influence of outliers, due to the
rié et al., 2015). Every 3 h, an analysis is computed by us- difficulty of having high-quality measurements for airborne
ing all observations available within a ±1 h 30 min assim- Doppler radar (Bosart et al., 2002).
ilation window and a 3 h forecast is produced to provide a After this pre-processing, a thinning is applied to RASTA
background for the next cycle. The assimilation system in- data to decrease observation density and satisfy assumptions
gests a wide variety of observations from satellite, ground- about observation error covariances, which are supposed to
based GPS, aircraft, radiosondes, drifting buoys, balloons be 0 dB2 . It is particularly true for measurements made by
and wind profilers, automatic land and ship weather sta- different instruments, which have independent physical er-
tions, and ground-based precipitation radars of the French rors. However, this hypothesis might be no more valid if the
network ARAMIS (reflectivity and radial velocity). The pur- observations are collected very close to each other by the
pose of this study is to assess the impact of the assimilation same instrument. Applying a thinning to the observations
of RASTA data in addition to this already dense observing is therefore necessary for having satisfactory assumptions
network. about observation error covariances (Rohn et al., 2001; Liu
and Rabier, 2002). Therefore, RASTA data are assimilated
2.3 RASTA data pre-processing every 3 time steps, which is equivalent to a distance of ap-
proximately 5 to 9 km depending on the aircraft speed. The
RASTA data are discarded between 250 m above and 250 m data are not thinned vertically because the vertical forecast
below the aircraft, which is the minimal measuring range
Nat. Hazards Earth Syst. Sci., 19, 907–926, 2019 www.nat-hazards-earth-syst-sci.net/19/907/2019/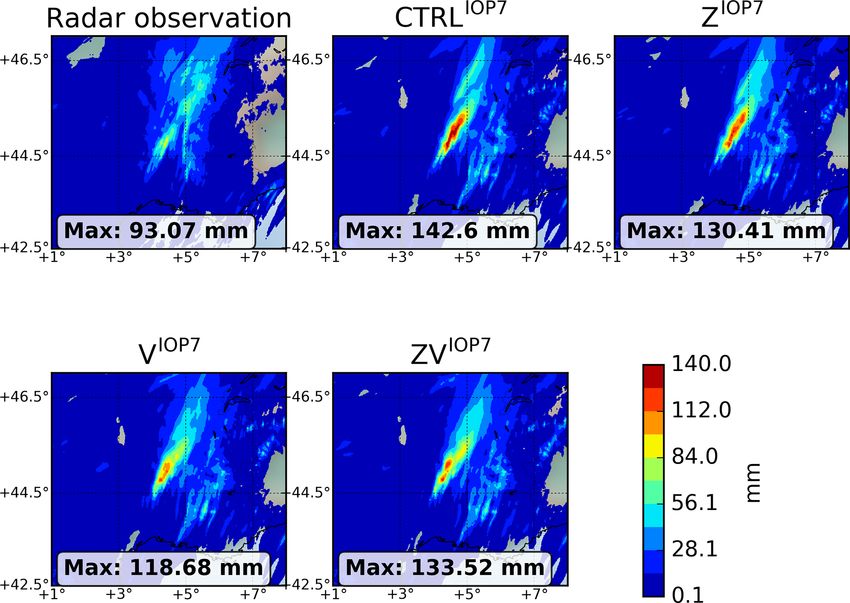
M. Borderies et al.: Impact of the assimilation of W-band radar reflectivity                                                     911

error covariances are less marked than the horizontal ones           – σo is the standard deviation of observation and forward
(Brousseau et al., 2011) and it is thus not useful to apply any        operator errors (in dB).
thinning in that case (Jacques and Zawadzki, 2014).

                                                                      The W-band reflectivity forward operator Hz described by
3     Assimilation method                                          Borderies et al. (2018) is used to simulate the reflectivity. It is
                                                                   consistent with the ICE3 one-moment microphysical scheme
3.1    The 1D+3DVar assimilation method
                                                                   of AROME and takes the hydrometeor contents of the five
Here, we employ the 1D+3DVar assimilation method (Cau-             hydrometeor species (rain, snow, graupel, cloud liquid water
mont et al., 2010; Wattrelot et al., 2014) used operationally to   and pristine ice), temperature, pressure and relative humid-
assimilate ground-based precipitation radar data in AROME.         ity as input parameters. The T-matrix method (Mishchenko
This data assimilation technique allows us to shift a pattern      et al., 1996) is employed to compute the single scattering
that was well simulated by the model but at a wrong loca-          properties. Following the results of Borderies et al. (2018),
tion. It relies on the ability of the model to create consis-      the graupel axis ratio is set to 0.8, snow axis ratio to 0.7 and
tent moisture and reflectivity profiles. Indeed, cloudy areas      pristine ice axis ratio to 1. The forward operator returns the
are generally associated with relative humidity close to the       simulated reflectivity at each range gate from the radar and
saturation and high reflectivity values. This method is partic-    accounts for hydrometeors and water vapour attenuation.
ularly well suited for vertically pointing radars because the         According to Eq. (1), for each observed vertical profile
first step of the assimilation method is based on the differ-      Zo , the vertical column of RH pseudo-observation is a lin-
ences between different vertical profiles of reflectivities. For   ear combination of the neighbouring RH profiles taken from
instance, since March 2016, this assimilation method is op-        the model background xiRH .
erationally employed to assimilate vertical profiles of DPR           The xiRH neighbouring profiles are located in a 160 km
reflectivity data in the Japanese kilometre-scale NWP model        wide square centred on the aircraft location. For the
(JMA-NHM) (Ikuta, 2016).                                           AROME-WMed model, this size is sufficient to reduce the
   The first step consists of a 1-D Bayesian retrieval of the      effects of spatial mismatches between model and observa-
best estimate of relative humidity (RH) profiles, named here-      tions (Borderies et al., 2018) and to gather a database of
after pseudo-observations (PO), given the observed vertical        xiRH which are consistent with the meteorological situation.
profile of reflectivity Zo . For each observed column of reflec-   In addition, the xiRH profiles would become less representa-
tivity Zo , the corresponding vertical profile of RH pseudo-       tive with a larger size since meteorological environments can
observation yPO RH is given by                                     change over ≈ 100 km.
                                                                      In Eq. (1), the xiRH profiles are weighted by a function
                                                                   (JPO ) of the difference between the observed Zo and sim-

                    exp − 21 JPO (xi )
                                                                   ulated Hz (xi ) column of reflectivities (cf. Eq. 2). Thus,
         X
  RH
yPO   =      xiRH P                      ,                (1)
                              1                                    larger weights are given to the neighbouring columns that
          i         j exp   − 2 J PO x j
                                                                   most closely resemble the observations. To ensure equivalent
with                                                               weights regardless of the number of altitude levels used for
            Pno                         2                         each neighbourhood profile, the square difference in Eq. (2)
      1       k   Zok − Hz (xk ) − bk                              is divided by the number of valid data over the observed col-
JPO =                                        ,              (2)
      no                σo2                                        umn of reflectivity.
                                                                      The square difference is also divided by the observation
where                                                              error variance σo2 . A small σo will favour the neighbouring
                                                                   columns that most closely resemble the observation. How-
    – subscript i denotes the index of the model profile in the
                                                                   ever, if there is no simulated profile of reflectivity which is
      vicinity of the observed profile of reflectivity;
                                                                   close enough to the observed one, there will be no retrieval
    – xiRH is the vertical column of relative humidity from the    since the weight tends towards a value close to 0. Hence,
      model background;                                            a small σo either leads to an accurate retrieval or to no re-
                                                                   trieval at all. On the other hand, a large σo would give similar
    – Hz (xk ) is the simulated reflectivity (in dBZ) at the       weights and smooth the neighbourhood xiRH profiles, regard-
      model level k, given the model state xk ; Hz being the       less of the extent to which they resemble the observed profile
      forward operator;                                            of reflectivity (Caumont et al., 2010). Therefore, a sensitivity
    – no is the number of valid observed reflectivity data in      study is performed in Sect. 3.3 to σo values.
      the column;                                                     The Bayesian retrieval is not applied in the case of clear
                                                                   sky, i.e. when all the reflectivities over the whole vertical
    – bk is the bias correction value used at the altitude k (in   column are below the radar sensitivity in both the simula-
      dB), described in Sect. 3.2; and                             tions and the observations. However, if the simulations indi-

www.nat-hazards-earth-syst-sci.net/19/907/2019/                              Nat. Hazards Earth Syst. Sci., 19, 907–926, 2019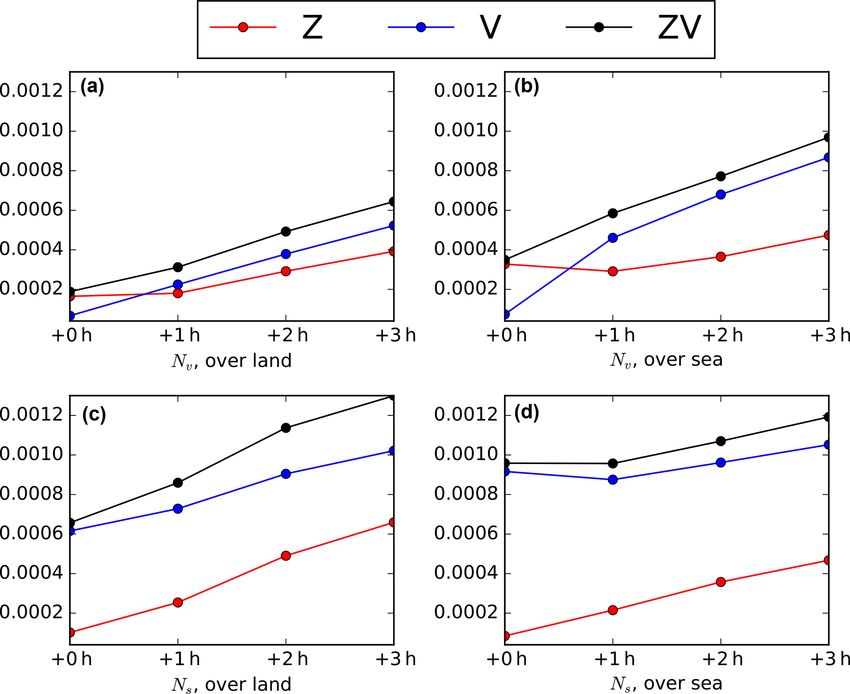
912 M. Borderies et al.: Impact of the assimilation of W-band radar reflectivity
cate cloud or precipitation, the closest “clear-sky” profile in
the vicinity of the radar is selected for the retrieval.
In the second step of the 1D+3DVar assimilation approach,
the retrieved vertical profiles of relative humidity pseudo-
observations yPORH are assimilated in the 3DVar assimilation
system of AROME-WMed, like any other conventional ob-
servations.
3.2 Bias correction
The Bayesian retrieval can also be applied to other variables
using the same weights as those from the retrieval of RH pro-
files (in Eq. 2), for example to retrieve reflectivity pseudo-
Z :
observations yPO
X exp − 12 JPO (xi )
Z
yPO = Hz (xi ) P . (3)
1
i j exp − 2 JPO x j Figure 2. Bias (a) between RASTA reflectivity and the reflectivity
pseudo-observation as a function of the altitude for different values
Z can be used as an of error standard deviation σo (see legend box). Panel (b) shows the
The reflectivity pseudo-observation yPO
number of observations used for the calculations as a function of
indicator to evaluate the quality of the 1-D Bayesian retrieval
the altitude for the different values of error standard deviation σo .
and to estimate the biases that can arise between observations
and simulations. Indeed, in data assimilation it is necessary
to have unbiased quantities and to remove these systematic retrieved profile of reflectivity pseudo-observations to only
errors (Janisková, 2015; Okamoto et al., 2016). These bi- those which most closely resemble the observations.
ases can arise from the observations, the ICE3 microphysical Figure 2 shows that the bias increases with the altitude,
scheme and/or the forward operator formulations. Janisková which is consistent with the existence of model biases in
(2015) showed that the biases between observations and sim- cloudy areas in the ICE3 microphysical scheme of AROME-
ulations depend on the temperature and on the altitude. Since WMed (Borderies et al., 2018; Taufour et al., 2018). Figure 2
this study is focused on one specific area of interest during highlights the fact that, because of the smoothing effect, the
the same season, the bias is mainly a function of the altitude. bias increases with the error standard deviation σo . Indeed, at
The bias is also a function of the error standard deviation approximately 6 km altitude, the bias can reach up to 6 dB if
σo . Indeed, while a small value of σo favours the simulated σo equals 9 dB, and only ≈ 1.5 dB if σo equals 2 dB.
columns that most closely resemble the observations, a larger The effect of the bias correction is shown in Fig. 3, in
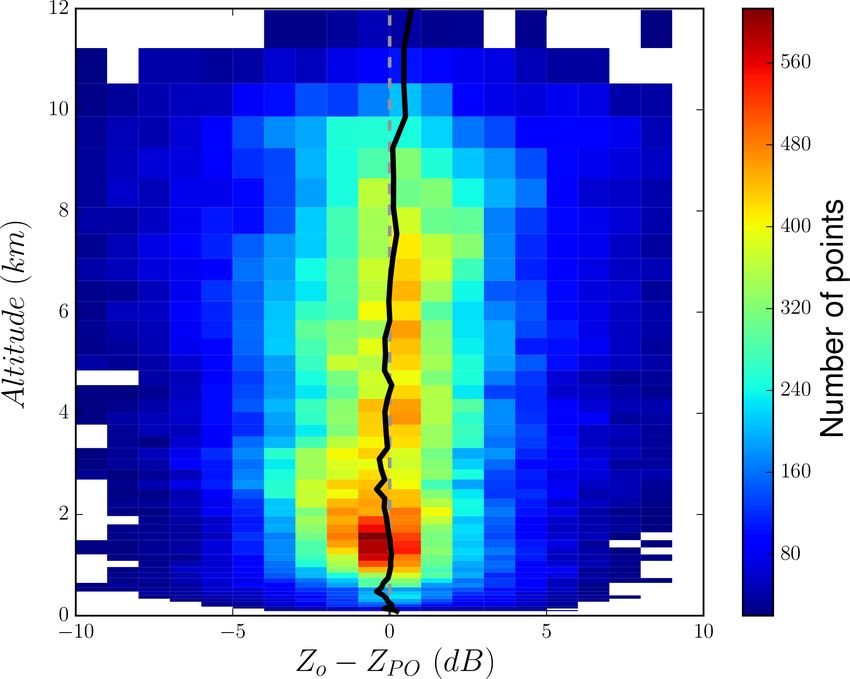
value of σo smooths the simulated reflectivity profiles. which a contoured frequency by altitude diagram (CFAD)
Therefore, a bias b was determined from the statistics of the differences between the observed reflectivity and the
between Zo and yPO Z using the altitude and the error stan-
bias-corrected reflectivity pseudo-observations are shown for
dard deviation σo as predictors. Calculations were performed a σo of 2 dB. The residual bias is indicated by the black line.
for all flights during the HyMeX-SOP1 every 4 time steps. Figure 3 demonstrates that, after applying the bias correc-
The background states of a control (CTRL) experiment tion in Eq. (2), the residual bias is close to 0 dB except above
were used as a reference to simulate the reflectivity pseudo- an altitude of approximately 10 km, which is probably due
observations and to estimate the biases. The CTRL experi- to the smaller number of points used to calculate the bias
ment was run during a 45-day cycled period from 00:00 UTC correction. As explained by Janisková (2015), the use of ad-
24 September 2012 – which is the day when the Falcon 20 ditional predictors, such as temperature or hydrometeor con-
first flew during HyMeX-SOP1 – to 5 November 2012, after tents, could lead to an improvement in the bias correction at
the last flight. It includes all the observations that are opera- higher altitude.
tionally assimilated (see Sect. 2.2).
The bias between RASTA observations and the reflectiv- 3.3 Observation error within the Bayesian inversion
ity pseudo-observations is depicted in Fig. 2 as a function
of the altitude for different values of σo (see legend). Cal- As explained in Eq. (2), the quality of the 1-D Bayesian re-
culations were only performed if both the observation and trieval relies on the specification of standard deviation of ob-
the reflectivity pseudo-observation are above the radar sensi- servation and forward operator errors σo (in dB). In-flight
tivity. The number of observations used for the calculations water vapour mixing ratio measurements, ro , are available at
is also shown in Fig. 2b. This number is smaller for small the flight level and can be used to estimate σo and to evaluate
values of σo (red curve) because it constrains the amount of the quality of the retrieval. These data present the advantage
Nat. Hazards Earth Syst. Sci., 19, 907–926, 2019 www.nat-hazards-earth-syst-sci.net/19/907/2019/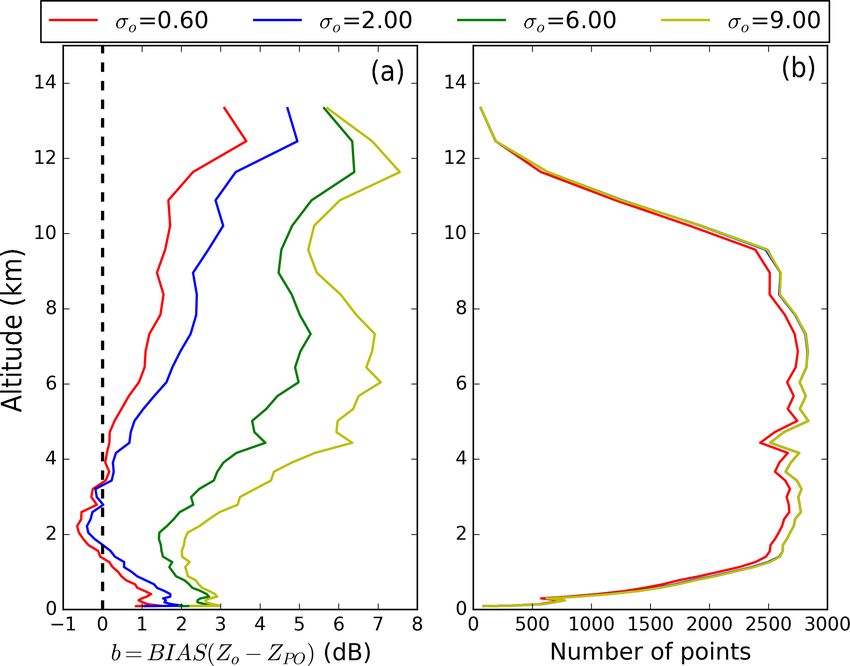
M. Borderies et al.: Impact of the assimilation of W-band radar reflectivity                                                            913

Figure 3. Contoured frequency by altitude diagram (CFAD) of the        Figure 4. Standard deviations (b, in g kg−1 ) and biases (a, in
differences between the observed reflectivity and the bias-corrected   g kg−1 ) of the water vapour mixing ratio differences between in-
reflectivity pseudo-observations. The residual bias after applying     flight measurements, rq , and the retrieved ones, rm (red), as a func-
the bias correction is indicated by the black line.                    tion of the error standard deviations σo (in dB). The standard de-
                                                                       viations and biases before applying the 1-D Bayesian retrieval are
                                                                       represented by the black data points.

of being completely independent from the retrieval and they
allow the evaluation of the humidity pseudo-observations               dard deviation indicates the existence of an optimal value of
which will then be assimilated in the 3DVar assimilation sys-          σo of approximately 2 dB. Indeed, below 2 dB, the standard
tem of AROME-WMed.                                                     deviation increases with decreasing σo . This is due to the ten-
   The 1-D Bayesian retrieval is applied to the CTRL back-             dency of the retrieval to be more selective for small values of
ground states for error standard deviations σo ranging from            σo , which results in using the background state instead of ap-
0.6 to 9 dB. The bias correction, which has been calculated            plying the retrieval. On the contrary, above 2 dB, the standard
for each σo in Sect. 3.2, is applied in Eq. (2). The retrieved         deviation increases with σo . Indeed, a large σo increases the
pseudo-observations, rm , of water vapour mixing ratio at the          number of successful inversions, but smooths them to pro-
flight level are then compared with the in-flight measure-             duce the resulting humidity pseudo-observations. Finally, it
ments, ro , over 32 flights of the HyMeX SOP1. The compar-             should be noted that the bias is also improved with a σo of
ison is done as follows. First, a manual data quality control          2 dB (Fig. 4a). Hence, we decided to use an error standard
is applied to in situ humidity observations in order to remove         deviation σo of 2 dB for the rest of this study.
the poor-quality measurements that can arise from instabil-
ities or periods of malfunctioning during the flights. After
this quality control, 24 flights out of 32 remain. Second, wa-         4   Data assimilation experiments
ter vapour mixing ratio measurements are averaged over 12
time steps to reduce observation noise and representation er-          To assess the potential of RASTA data to improve analy-
rors.                                                                  ses and forecasts of heavy precipitation events, a total of 4
   Figure 4 shows the standard deviations (Fig. 4b) and bi-            experiments is conducted. The CTRL experiment includes
ases (Fig. 4a) between the observed in-flight water vapour             all the observations that are operationally assimilated (see
mixing ratio and the retrieved ones (red curve) as a function          Sect. 2.2). Three additional RASTA experimental designs (Z,
of the error standard deviations σo . The standard deviations          V, ZV) share the same configuration as CTRL, except that
between in-flight measurements and the background water                they also include the assimilation of RASTA data. The re-
vapour mixing ratio are also represented by the black data             flectivity observed by RASTA is assimilated alone in the Z
points.                                                                experiment, and jointly with RASTA horizontal wind com-
   The standard deviation values in Fig. 4 demonstrate that            ponents in the ZV experiment. The 1D+3DVar assimila-
the retrieved water vapour mixing ratios are always in better          tion method described in Sect. 3.1 is employed to assimi-
agreement with the in-flight measurements compared to the              late RASTA reflectivity observations in the Z and ZV ex-
background state. This improvement highlights the ability of           periments. In addition, the V experiment includes the assim-
the 1-D Bayesian method to retrieve humidity fields that are           ilation of RASTA wind data alone. As explained by Bor-
closer to independent observations. The variation in the stan-         deries et al. (2019), the assimilation of RASTA wind data

www.nat-hazards-earth-syst-sci.net/19/907/2019/                                  Nat. Hazards Earth Syst. Sci., 19, 907–926, 2019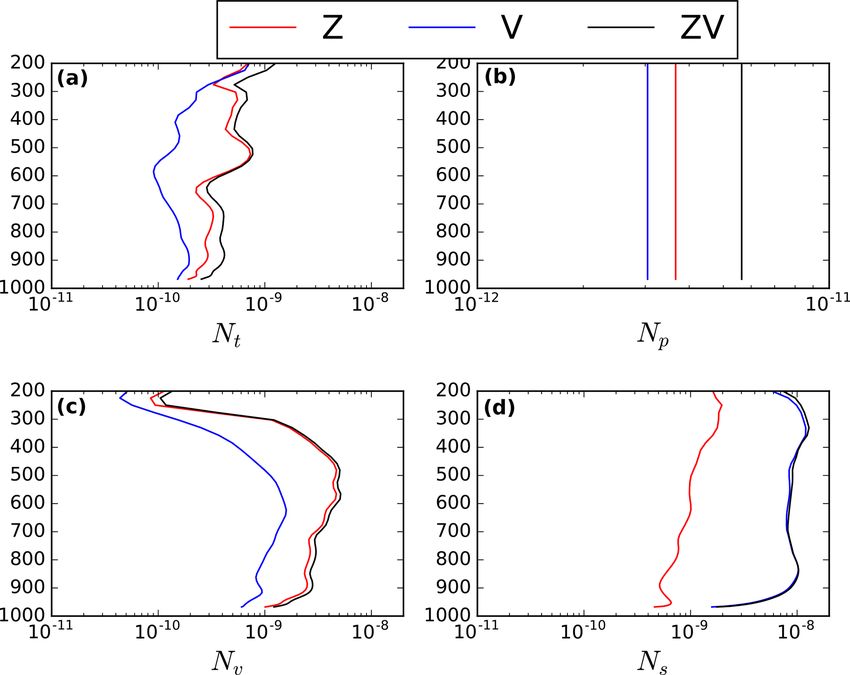
914                                             M. Borderies et al.: Impact of the assimilation of W-band radar reflectivity

Figure 5. Time–height cross section of the reflectivity observed by RASTA (a), simulated from the background (b) and pseudo-
observations (c). The differences between the RH pseudo-observations and the relative humidity from the background state are shown in
(d). Aircraft altitude is indicated by the black line.

is straightforward and does not require the use of a radial          tivity study to the length of the assimilation window by as-
wind observation operator. Indeed, the Doppler multi-beam            similating airborne Doppler wind radar data in the 3DVar as-
antenna system of RASTA allows the retrieval of the hori-            similation system of AROME-WMed. Results indicated that,
zontal wind components (u, v), which are directly linked to          even though the best scores were reached with a 3 h assimila-
two control variables of the AROME model (vorticity and              tion window, a slight positive improvement of the 8 h precip-
divergence).                                                         itation forecasts was also evidenced with a 2 h assimilation
   RASTA data are not measured simultaneously but over               window. Therefore, a 2 h assimilation window is a good com-
the flight leg. Consequently, at each assimilation cycle, the        promise to assimilate a larger number of observations, which
3DVar assimilation system of AROME-WMed ingests all the              are nearly valid at the assimilation time, without adding any
RH pseudo-observations and/or RASTA wind data available              detrimental observation in the assimilation system. Hence,
during a 2 h assimilation window centred on the assimilation         the length of the assimilation window has been set to 2 h in
time T , as if they were valid at time T . A larger assimila-        this study.
tion window increases the number of observations and results            The observation errors for the RH pseudo-observations
in larger coverage. However, since RH pseudo-observations              RH and RASTA wind data are the same as the one used
                                                                     yPO
vary with convective systems, which can evolve quickly in            for the radiosonde measurements. It is set to 12 % for the
time, a larger assimilation window would result in assimilat-        RH pseudo-observations. RASTA wind observation error in-
ing data that are no longer valid at the current assimilation        creases with the altitude from approximately 1.8 m s−1 at
time T . Besides, Borderies et al. (2019) conducted a sensi-         900 hPa to approximately 2.5 m s−1 at 200 hPa. Finally, in

Nat. Hazards Earth Syst. Sci., 19, 907–926, 2019                              www.nat-hazards-earth-syst-sci.net/19/907/2019/
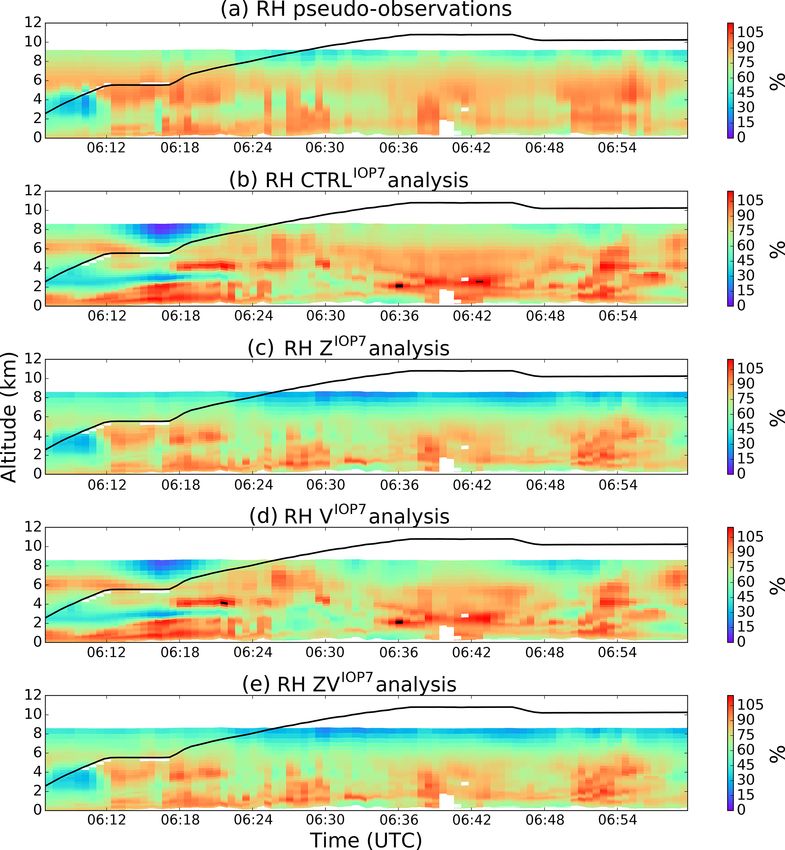
M. Borderies et al.: Impact of the assimilation of W-band radar reflectivity                                                       915

Figure 6. Relative humidity (RH, in %) for (a)–(e): the pseudo-observations, the CTRLIOP7 , the ZIOP7 , the VIOP7 and the ZVIOP7 experi-
ments.

addition to the pre-processing described in Sect. 2.3, a qual-        26 September 2012 and end at 12:00 UTC 26 Septem-
ity control is also performed prior to the assimilation: ob-          ber 2012. Next, in order to study the impact of the assimi-
servations with innovation (observations minus background)            lation of RASTA data in various conditions during the whole
greater than a threshold are rejected. This threshold depends         HyMeX-SOP1, the four experiments are run for the 32 anal-
on both the observation and background errors. It has a               ysis cases in which RASTA data are available. For this con-
constant value of approximately 55 % for the RH pseudo-               figuration, the CTRL experiment is the same as the one
observations. It increases with the altitude for RASTA wind           used in Sect. 3.2, which was run during a 45-day cycled pe-
data because the error standard deviation is a function of the        riod from 00:00 UTC 24 September to 5 November 2012.
altitude (approximately 25 m s−1 at the maximum).                     For the sake of simplicity, the CTRL experiment is named
   The four different experiments are first conducted for a           CTRLSOP1 . The three RASTA experiments are respectively
heavy precipitation event which occurred during the inten-            named ZSOP1 , VSOP1 and ZVSOP1 . In order to disentangle the
sive observing period 7a (IOP7a) over south-eastern France            cycling effect from the impact of the assimilation of RASTA
on 26 September 2012. During this case study, RASTA                   data on the analyses, the ZSOP1 , VSOP1 and ZVSOP1 experi-
data were collected during flight 15 between 06:10 and                ments are not cycled and share the same background fields
09:45 UTC (red line in Fig. 1). Therefore, RASTA data                 as the CTRLSOP1 experiment ones.
are assimilated for the first time at the 06:00 UTC analy-
sis. The different experiments are named CTRLIOP7 , ZIOP7 ,
VIOP7 and ZVIOP7 . They share the same background field to
compute the 06:00 UTC analysis. They start at 00:00 UTC

www.nat-hazards-earth-syst-sci.net/19/907/2019/                                 Nat. Hazards Earth Syst. Sci., 19, 907–926, 2019
916                                               M. Borderies et al.: Impact of the assimilation of W-band radar reflectivity

Figure 7. Wind speed (m s−1 ) for (a)–(e): the observations, the CTRLIOP7 , the ZIOP7 , the VIOP7 and the ZVIOP7 experiments.

5     Impact on the IOP7a case study                                   observation profiles, given the vertical profile of reflectivity
                                                                       observed by RASTA. Since no direct RH observations are
To assess the potential of RASTA observations to improve               available with such a high vertical resolution as the one of
short-term forecasts, focus is first concentrated on one of            RASTA data, the method is validated by comparing the re-
                                                                                                        Z with RASTA Z observa-
                                                                       flectivity pseudo-observations yPO
the most significant precipitation events which occurred dur-                                                               o
ing IOP7a. More than 100 mm of rain was observed between               tions. Figure 5 shows RASTA observations (interpolated on
00:00 UTC on 26 September and 00:00 UTC on 27 Septem-                  the vertical grid model; (a), the simulated profile of reflec-
ber in the area delimited by the red box in Fig. 1 (Hally              tivities from the background (b) and the retrieved reflectiv-
et al., 2014). As mentioned in Sect. 4, RASTA data are as-             ity pseudo-observations (c). The differences between the RH
similated for the first time at the 06:00 UTC analysis in the          pseudo-observations and the background RH profiles are also
ZIOP7 , VIOP7 and ZVIOP7 experiments. Most of these data are           shown in panel (d). Differences are displayed in red (blue) if
located upwind of where the rainfall event took place later in         RH pseudo-observations are larger (smaller) than the back-
the morning at approximately 08:00 UTC. Such a configura-              ground.
tion is required to evaluate the impact of the assimilation of            Figure 5 highlights the capability of the 1-D Bayesian
RASTA data to improve heavy precipitation events.                      method to retrieve profiles which are in better agreement
                                                                       with the observations than the background. For example, at
5.1    1-D Bayesian retrieval                                          approximately 06:30 UTC, the observation profiles indicate
                                                                       clouds below an altitude of 6 km, as opposed to the simulated
As explained in Sect. 3.1, the first step to assimilate the re-        profiles from the background which only indicate clear-sky
flectivity consists of a 1-D Bayesian retrieval of RH pseudo-          profiles. This has been rectified in the reflectivity pseudo-

Nat. Hazards Earth Syst. Sci., 19, 907–926, 2019                                 www.nat-hazards-earth-syst-sci.net/19/907/2019/
M. Borderies et al.: Impact of the assimilation of W-band radar reflectivity 917
Figure 8. The 12 h accumulated rainfall between 06:00 and 18:00 UTC 26 September 2012 (IOP7a) for radar observations, the CTRLIOP7 ,
the ZIOP7 , the VIOP7 and the ZVIOP7 experiments.
observation profiles, and in the corresponding RH pseudo- As shown in Figs. 6a and 7a, the number of RH pseudo-
observation profiles. Indeed, the RH pseudo-observation val- observations which have been assimilated is larger than the
ues are larger than the background RH values (red values number of RASTA wind data. Indeed, contrary to RASTA
in d), and are thus more representative of the presence of wind data, the reflectivity is also assimilated in the case of
cloud. Inversely, at approximately 06:25 UTC, the Bayesian clear sky. Besides, airborne Doppler velocity measurements
retrieval has been able to remove the low-level clouds present are contaminated by the aircraft motion (roll/pitch/drift an-
in the background, and to add clouds above an altitude of gles, ground speed, etc.). Therefore, because of the dif-
about 4 km. Between 06:50 and 07:00 UTC, the reflectiv- ficulty to have high-quality measurements (Bosart et al.,
ity pseudo-observations are also in much better agreement 2002), RASTA wind data have been more frequently rejected
with the observations than the background. The correspond- (cf. between 06:42 and 06:50 UTC in Fig. 7). In addition,
ing RH pseudo-observations values are also larger than the contrary to the W-band reflectivity measurements, RASTA
background, which is consistent with the fact that larger horizontal wind components are obtained through a retrieval,
RH values are usually associated with larger reflectivity val- which might also explain the smaller number of assimilated
ues. Hence, Fig. 5 demonstrates the ability of the Bayesian horizontal wind data. Finally, since RH pseudo-observations
retrieval to pick up vertical profiles in the neighbourhood are assimilated in the same way as radiosonde observations
which are more consistent with the observations. Indeed, are (cf. Sect. 4), they are rejected above an altitude of ap-
this retrieval successfully dried areas associated with low re- proximately 9 km because the values are very small.
flectivity values, and moistened areas associated with high Compared to the RH pseudo-observations in Fig. 6, RH
reflectivity values. These retrieved RH pseudo-observation is overestimated in the CTRLIOP7 and in the VIOP7 analy-
profiles are then assimilated in the 3DVar assimilation system ses. Except at approximately 8 km of altitude, the RH pro-
of AROME-WMed in the ZIOP7 and ZVIOP7 experiments. files are much more similar to the RH pseudo-observations
in the ZIOP7 and ZVIOP7 analyses. Conversely, in Fig. 7, the
5.2 Impact on analyses VIOP7 and ZVIOP7 analyses are in much better agreement
with RASTA wind observations compared to the CTRLIOP7
Figure 6 shows (from the top to the bottom panels), the rela- and the ZIOP7 analyses. Figure 6 shows that the VIOP7 anal-
tive humidity for the pseudo-observations, the CTRLIOP7 , the ysis is very similar to the CTRLIOP7 one in terms of hu-
ZIOP7 , the VIOP7 and the ZVIOP7 analyses. Similarly, Fig. 7 midity. Similarly, in Fig. 7, the ZIOP7 analysis is very sim-
represents the wind speed for the observations and the differ- ilar to the CTRLIOP7 one in terms of wind speed. There-
ent experiments. The four different analyses were computed fore, the assimilation of RASTA wind data (respectively RH
using the same background state. pseudo-observations) does not impact the humidity (respec-
www.nat-hazards-earth-syst-sci.net/19/907/2019/ Nat. Hazards Earth Syst. Sci., 19, 907–926, 2019918 M. Borderies et al.: Impact of the assimilation of W-band radar reflectivity
Figure 9. Temperature NT (a), surface pressure Np (b), humidity Nv (c) and kinetic Ns (d) contribution terms of the exergy distance as a
function of the altitude for the ZSOP1 (red curve), VSOP1 (blue curve) and ZVSOP1 (black curve) analyses.
tively wind) field in the analysis, probably because wind and 6 Results on the HyMeX SOP1
humidity are not highly correlated in the assimilation process
through the background error covariances. However, the joint The impact of the assimilation of RASTA data is now as-
assimilation of the RH pseudo-observations with RASTA sessed over the 32 cases in which RASTA data were assim-
wind data (ZVIOP7 experiment) results in a positive impact ilated during the HyMeX-SOP1. In order to use the same
in terms of both the wind and the humidity fields. background fields, we use the ZSOP1 , VSOP1 and ZVSOP1 ex-
periments, which are not cycled. An exergy-distance-based
approach (Marquet et al., 2019) is first employed to mea-
5.3 Impact on rainfall forecasts sure the relative impact of the assimilation of RASTA obser-
vations on the analysis and forecast fields. Then, the added
value of the assimilation of RASTA data on the analyses
Figure 8 shows the 12 h accumulated rainfall between 06:00 is evidenced by using independent humidity measurements.
and 18:00 UTC 26 September 2012 (IOP7a) for radar obser- Finally, the subsequent forecasts are validated against rain-
vations, the CTRLIOP7 , the ZIOP7 , the VIOP7 and the ZVIOP7 gauge measurements.
experiments.
First, the predicted rainfall pattern is well reproduced in 6.1 Impact study using an exergy-distance-based
the four different experiments. As shown by Borderies et al. approach
(2019), the maximum rainfall accumulation is overestimated
in the CTRLIOP7 experiment (≈ 142 mm versus 93 mm in The moist-air available-enthalpy (exergy) distance (Marquet
the radar observations), but is better reproduced in the ZIOP7 et al., 2019) is first briefly described, and then calculated to
experiment (130 mm). In addition, the assimilation of RH measure the relative impact of the assimilation of RASTA
pseudo-observations jointly with RASTA wind data in the data on analyses and short-term forecasts.
ZVIOP7 experiment also results in a decrease (133.5 mm) of
the predicted maximum rainfall accumulation. Finally, the 6.1.1 The moist-air available-enthalpy (exergy)
experiment in which RASTA wind data are assimilated alone distance
in the VIOP7 leads to the better agreement with the radar ob-
servations. Indeed, the maximum rainfall forecast accumula- Traditionally, the impact of the assimilation of a new ob-
tion has been reduced to only 118 mm. servation type and its synergistic effect with other obser-
Nat. Hazards Earth Syst. Sci., 19, 907–926, 2019 www.nat-hazards-earth-syst-sci.net/19/907/2019/M. Borderies et al.: Impact of the assimilation of W-band radar reflectivity 919
Figure 10. Kinetic (Ns ; c and d) and humidity (Nv ; a and b) contribution terms of the exergy distances as a function of the forecast term
over land (a, c) and over sea (b, d) for the ZSOP1 (red curve), VSOP1 (blue curve) and ZVSOP1 (black curve) experiments.
vations are assessed through verification scores of a long which provides a more general and comprehensive metric
data-denial assimilation experiment (Storto and Randria- between a perturbed thermodynamic state (here the RASTA
mampianina, 2010). These approaches are very expensive experiments) and a reference one (here the CTRL experi-
from a numerical point of view. The new type of observa- ment). It is defined by the integration over the 2-D domain
tion needs to be assimilated in a large number of analysis of the sum of four quadratic terms in horizontal wind com-
cases, which is not affordable for airborne radar measure- ponents U, V (Ns ), temperature T (NT ), surface pressure ps
ments since the availability of the new observations depends (Np ) and water vapour mixing ratio rv (Nv ). The four contri-
on the aircraft flights. By contrast, energy-based approaches bution terms of the exergy distance are then given by
(Ehrendorfer et al., 1999; Marquet et al., 2019) are cost-
effective methods for evaluating the impact of the assim- 2
Cpd Tr T CTRL − T i
Z
ilation of a new observing system in a NWP model. The NT = 2
dD, (4)
idea is to combine thermodynamic variables of the atmo- 2 T CTRL
D
sphere into a model space-based measure (Storto and Ran- 2
Rd Tr psCTRL − psi
Z
driamampianina, 2010), which avoids the use of long data- Np = dD, (5)
2 2
denial experiments and adjoint-based methods that rely on p CTRL
D s
strong linearity assumptions which are not valid at the con- 2
CTRL − rvi
Rv Tr rv
Z
vective scale. These approaches provide a measure of the rel-
Nv = dD, (6)
ative impact of the observations on the analysis and forecast 2 rvCTRL
fields. For example, Storto and Randriamampianina (2010) D
2 2
employed the moist total energy norm (MTEN; Ehrendor- Z
U CTRL − U i + V CTRL − V i
fer et al., 1999) to evaluate the loss of quality in the fore- Ns = dD, (7)
2
casts when an observation type is not assimilated. A sim- D
ilar methodology was employed by Fabry and Sun (2010)
to characterize model errors in winds, temperature, humidity where the superscript i denotes the RASTA experiments
and precipitation. (ZSOP1 , VSOP1 or ZVSOP1 ), Cpd is the specific heat of dry air,
Based on results of Marquet (1993), Marquet et al. (2019) Rd is the dry air constant, Rv is the water vapour gas con-
defined a moist-air available-enthalpy (exergy) distance, stant and Tr is the reference temperature (taken to be 300 K).
www.nat-hazards-earth-syst-sci.net/19/907/2019/ Nat. Hazards Earth Syst. Sci., 19, 907–926, 2019920 M. Borderies et al.: Impact of the assimilation of W-band radar reflectivity
6.1.2 Impact on analyses
The temperature NT , surface pressure Np , humidity Nv and
kinetic Ns contribution terms of the exergy distance are cal-
culated over the domain defined by the black box in Fig. 1.
Figure 9 represents NT (a), Np (b), Nv (c) and Ns (d) as
a function of the altitude for the ZSOP1 (red curve), VSOP1
(blue curve) and ZVSOP1 (black curve) analyses. The differ-
ent contribution terms are averaged over the 32 analyses in
which RASTA data have been assimilated.
First, Fig. 9 demonstrates that the assimilation of RH
pseudo-observations and/or RASTA wind data has a small
impact on the temperature NT (a) and surface pressure Np
(b) contribution terms of the exergy distance. Indeed, even
though there is a correlation between the different variables
through the background error covariance matrix (Fabry and
Sun, 2010), there is a larger impact on the contribution terms
Figure 11. Standard deviation (g kg−1 ) of the water vapour mixing (Nv and/or Ns ) that are associated to the variables (wind
ratio differences between in-flight humidity measurements ro and and/or humidity) directly linked to the assimilated observa-
the analyses rm for the different experiments (CTRLSOP1 , ZSOP1 , tions. On the analyses, the experiment which has the small-
VSOP1 and ZVSOP1 ) over the 24 analyses. The standard deviation est impact on NT (a) and Np (b) is the VSOP1 experiment
differences between the measurements and the background state are (blue curve), followed by the ZSOP1 experiment. However,
also shown by the black data points (N = 6307).
this rank order is reversed after only 1 h forecast (not shown).
The larger impact on NT and Np is obtained if RH pseudo-
observations are assimilated jointly with RASTA wind data
The total exergy distance is then given by the sum of the four
(ZVSOP1 experiment, black curve).
quadratic terms NT , Np , Nv and Ns .
As expected, since RH pseudo-observations are linked to
In Eqs. (4), (5) and (6), the contribution terms of the ex-
the humidity fields, the impact of the assimilation of RH
ergy distance are divided by the weighting factors T CTRL ,
pseudo-observations (ZSOP1 ) is larger on Nv than on the
psCTRL and rvCTRL , which correspond to the average values other contribution terms. Similarly, since RASTA wind ob-
over the 2-D domain of T CTRL , psCTRL and rvCTRL , respec- servations are linked to the horizontal wind components,
tively. Hence, as defined by Ehrendorfer et al. (1999), the their assimilation (VSOP1 ) result in a larger impact on Ns .
weighting factors T CTRL and rvCTRL are a function of the Next, the assimilation of RH pseudo-observations (respec-
altitude, where an arbitrary factor “” was introduced but tively RASTA wind data) does not impact significantly Ns
with unknown values between 0.1 and 10. This arbitrari- (respectively Nv ). Therefore, humidity and horizontal wind
ness is removed by Marquet et al. (2019) where rvCTRL varies data do not seem to be highly correlated with one another,
significantly with height, since the water vapour mixing ra- which is consistent with the results of Sect. 5.2. A larger im-
tio decreases by 3 orders of magnitude between the surface pact on both the Nv and Ns contribution terms is obtained if
and the stratosphere. Therefore, moisture analysis and fore- RH pseudo-observations and RASTA wind data are assimi-
cast impacts between the different atmospheric levels are lated jointly (ZVSOP1 , black curve), along with a larger im-
fully taken into account through the use of these altitude- pact on all the contribution terms. Consequently, this result
dependent weighting factors. Hence, the use of the exergy indicates that the joint assimilation is required to have an im-
distance is expected to more fairly rank the different observ- pact on both the wind and humidity fields in the analyses.
ing systems through the use of more balanced contributions
between wind, temperature and water vapour. 6.1.3 Impact on short-term forecasts
In this study, the four different contribution terms of the
exergy distance will be studied independently in order to Equations (4) and (6) are now integrated over the two-
evaluate the respective impact of the assimilation of the RH dimensional domain and the vertical levels for different fore-
pseudo-observations and/or RASTA wind components on cast terms. Results are only shown for the kinetic (Ns ) and
temperature (Eq. 4), surface pressure (Eq. 5), water vapour humidity (Nv ) contribution terms of the exergy distances be-
mixing ratio (Eq. 6) and wind (Eq. 7) fields. cause the major differences have mainly been evidenced on
these two terms (see Fig. 9). Figure 10 represents Ns (c and d)
and Nv (a and b) as a function of the forecast term over land
(a and c) and over sea (b and d) for the ZSOP1 (red curve),
VSOP1 (blue curve) and ZVSOP1 (black curve) experiments.
Nat. Hazards Earth Syst. Sci., 19, 907–926, 2019 www.nat-hazards-earth-syst-sci.net/19/907/2019/M. Borderies et al.: Impact of the assimilation of W-band radar reflectivity 921
Figure 12. Differences in the average Heidke skill score (HSS) of the 6 h cumulated precipitation forecasts versus rain gauge measurements,
between the three RASTA experiments and the CTRLSOP1 experiment (a) ZSOP1 , (b) VSOP1 and (c) ZVSOP1 . Calculations were performed
over the 32 runs in which RASTA data were assimilated. The error bars represent the 95 % bias-corrected and accelerated (BCa) bootstrap
confidence intervals (see Efron and Tibshirani, 1994).
Generally, Fig. 10 shows that the impact is larger over lighted that RH pseudo-observations have a modest impact
sea (10b and d) than over land (10a and c). Indeed, ground- on the analyses on the humidity field, which vanishes soon
based precipitation radar data (reflectivity and Doppler ve- as the forecast term increases compared to the experiment in
locity) are also assimilated over land. Therefore, there is a which RASTA wind data are assimilated alone. The impact
lack of wind and humidity observations over sea, which is on the subsequent forecasts is more important if both data are
partly compensated by the assimilation of RASTA data. This assimilated jointly. The benefit brought by this impact will be
is particularly evidenced for the humidity contribution term evaluated in the next sections.
Nv of the exergy distance (a and b panels). However, after
2 h forecast term, the impact of the VSOP1 and ZVSOP1 ex- 6.2 Analyses evaluation: comparisons against in situ
periments on Ns is of the same order of magnitude over land measurements
and over sea.
Except at the analysis time on the humidity contribu-
The aim of this section is to assess the added value of the
tion term Nv , the impact of the assimilation of RH pseudo-
assimilation of RASTA data on the analyses. The evaluation
observations (ZSOP1 experiment) is always smaller than the
is not shown against other conventional assimilated observa-
impact of RASTA wind data (VSOP1 experiment). This can
tions, because, as expected, the fit to observations is always
be attributed to the fact that the forecast system seems to
better in CTRLSOP1 than in the RASTA experimental analy-
have a short memory of RH pseudo-observations, which is
ses. However, in-flight humidity measurements at flight level
consistent with the findings of Storto and Tveter (2009). The
are not assimilated in any of the experiments, and are used as
impact of the assimilation of RASTA wind data has a larger
independent observations to assess the impact of the assimi-
impact on the humidity forecasts, probably by adjusting large
lation of RASTA data on the humidity analyses. As explained
structures, and by modifying in return the frontal and/or con-
in Sect. 3.3, poor quality measurements are removed for the
vective features. In addition, the impact is always larger when
comparisons. Hence, after the manual quality control, only
RH pseudo-observations are assimilated jointly with RASTA
24 analysis cases remain. Figure 11 shows the standard devi-
wind data (ZVSOP1 experiment, black curve). This result was
ation between humidity mixing ratio measurements and the
expected because the number of assimilated observations
analysed ones for the different experiments (ZSOP1 , VSOP1
has been increased in the ZVSOP1 experiment. Besides, the
and ZVSOP1 ) during the 24 analysis cases. The standard devi-
ZVSOP1 experiment seems to take the benefits (or disadvan-
ation between the measurements and the water vapour mix-
tages) of both the ZSOP1 and the VSOP1 experiments. The
ing ratios from the background state is also represented by
small impact of the ZSOP1 experiment seems to indicate that
the black data points, which is a constant value because the
it is pointless to assimilate RH pseudo-observations without
same background states are used in all the different experi-
modifying the wind field in a consistent way. Finally, the
ments.
ZVSOP1 experiment leads to a larger impact on the kinetic
First, it should be noted that the analysed water vapour
contribution term Ns than on the humidity contribution term
mixing ratios are always in better agreement with the ob-
Nv . This is can be explained by the fact that the VSOP1 ex-
servations compared to the background field, which is quite
periment has more impact on Ns than the ZSOP1 experiment
reassuring. Next, the standard deviation is slightly larger for
has on Nv .
the VSOP1 than for the CTRLSOP1 experiment. Hence, the as-
To conclude, the relative impact of the assimilation of
similation of RASTA wind data alone (VSOP1 ) does not im-
RASTA data on the analysis and forecasts fields has been
prove the analysis in terms of humidity, which was expected
evidenced using the exergy distance. This impact study high-
because RASTA wind data are only slightly related to hu-
www.nat-hazards-earth-syst-sci.net/19/907/2019/ Nat. Hazards Earth Syst. Sci., 19, 907–926, 2019You can also read