Commissariat général au développement durable - Key figures on climate France and - I4CE
←
→
Page content transcription
If your browser does not render page correctly, please read the page content below
D A
       Annual

                    T              A
       L           A               B
commissariat général au développement durable

Key figures
on climate
France and
Worldwide
2017 EDITION
summary
                                Key figures on climate
                                France and Worldwide

      03 - Part 1: What is climate change?
            This part summarizes the scientific basis of climate change, including indicators,
            causes and possible consequences of global warming.

      19 - Part 2: Which amounts of greenhouse gases are emitted
            globally?
            The focus here is on the most relevant data related to global greenhouse gases
            (GHG) emissions, in particular the geographic distribution of these emissions.

      31 - Part 3: How much greenhouse gas is emitted in Europe and
            in France?
            A complete overview of GHG emissions statistics in Europe and in France is
            presented in this part as well as estimates of the carbon footprint of French people.

      39 - Part 4: What is the sectoral distribution of GHG emissions in
            Europe and in France?
            This part features the detailed evolution since 1990 of GHG emissions in the
            following economic sectors: energy sector, transports, industry, residential and
            tertiary, agriculture, forestry, land use and waste management.

      51 - Part 5: Which climate policies in the world, in Europe and in
            France?
            The main climate policies are described at each level: global, European and French.

Document edited by:
Service de l’Observation
et des Statistiques (SOeS)

  02 – Key figures on climate - France and Worldwide
authors

                      MB
          Manuel Baude
          Meem-CGDD-SOeS
          manuel.baude@
          developpement-durable.gouv.fr

                   FXD                                        ME
          François-Xavier
          Dussud                               Mathieu Ecoiffier
          Meem-CGDD-SOeS                       Meem-CGDD-SOeS
          francois-xavier.dussud@              mathieu.ecoiffier@
          developpement-durable.gouv.fr        developpement-durable.gouv.fr

                          JD                                   CV
          Jérome Duvernoy                      Charlotte Vailles
          Meem-DGEC-ONERC                      I4CE-Institute for
                                               Climate Economics
          jerome.duvernoy@
          developpement-durable.gouv.fr        charlotte.vailles@i4ce.org

                      Key figures on climate - France and Worldwide – 01
Foreword

                 n line with previous years, the 2017

     I
                 edition of “Key figures on climate” has
                 been written in the context of the 22nd
                 Conference of the Parties on Climate
                 Change (COP 22) held in Marrakech
from 7 to 18 November 2016.
This latest version, published as part of the new “datalab”
collection of the General commission for sustainable
development was updated and expanded relative to the
2016 edition. New data sources have been used for the
part on global CO2 emissions. The part on climate
policies was further developed, and notably deals with
the Paris agreement adopted in December 2015 at
COP 21. Moreover, the analysis of climate finance
(current climate investments and climate finance needs)
has been expanded. About the form, and with a goal of
simplification, some data previously displayed in both a
graph and a table is now presented only in a graph.
Data tables are still available on the web version.

—Sylvain Moreau
HEAD OF DEPARTMENT, SOES

  02 – Key figures on climate - France and Worldwide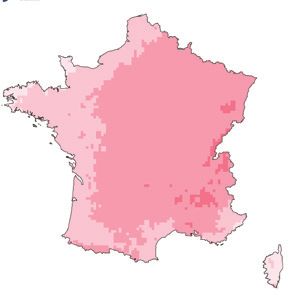
part 1

What is climate
change?

— The concept of global warming refers to a sustainable increase of the
planet average temperature. Additionally to the average sea level which
has increased by more than 15 cm since 1900, numerous other indicators
illustrate this warming.
The conclusions of the scientific community and notably of the
International Panel on Climate Change (IPCC) meet general consensus on
the causes of climate change. The natural climate balance is disrupted by
anthropogenic GHG emissions. The CO2 atmospheric concentration
– the main GHG – has increased by more than 40 % since 1750.
Projections show that global warming could have a severe impact on
sea levels and crop yields in the future.

                                  Key figures on climate - France and Worldwide – 03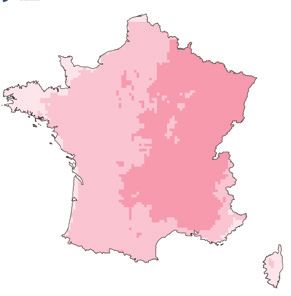
part 1: Climate change

Climate change observations

GLOBAL SURFACE TEMPERATURE CHANGE

               0.8

               0.6

               0.4

               0.2
                                                       1950
         °C

                1850              1900                             2000
              –0.2

              –0.4

              –0.6

              –0.8

     NOAA MLOST            NASA GISS             HadCRUT4     Ten-year average
                                                              for the three data series

Source: NOAA , NASA, Hadley Center

The increase in global average temperatures is very clear. The difference from the
1961-1990 reference period is far below zero until 1940, mostly negative until
1980, then the warming becomes more acute and the difference has almost al-
ways been positive since the early 1980’s. The decade 2001-2010 was 0.21°C
warmer than the decade 1991-2000 and was 0.48°C warmer than the 1961-1990
average. The year 2015, with an average temperature 0.74° over the 1961-1990
average, ranks first among the hottest years since 1850.

  04 – Key figures on climate - France and Worldwide
part 1: Climate change
GLOBAL AVERAGE SEA LEVEL CHANGE COMPARED TO THE
REFERENCE PERIOD 1900-1905
200
Church and White (2011)
150 Jevrejeva et al. (2008)
Ray and Douglas (2011)
Nerem et al. (2010) Satellite measurements
100 Uncertainty
mm
50
0
–50
1900 1920 1940 1960 1980 2000 2010
Source: IPCC, Working Group I, 2013
The global average sea level rose by 1.7 ± 0.3 mm/yr over the period 1901-2010.
The rise has been greater in recent decades, reaching 3.2 ± 0.4 mm/yr over the
period 1993-2010 (satellite data).
GLACIERS MELTING
1.6
Greenland
Antarctica
Greenland & Antarctica
1.2
SLE per year (mm/yr)
0.8
0.4
0
–0.4
1992-1996 1997-2001 2002-2006 2007-2011
Time period
Source: IPCC, Working Group I, 2013
Over the last two decades from 1992 to 2011, the total loss of continental polar
ice is equivalent to a sea level rise of about 11.7 mm (8.4 to 15.1 mm). The most
significant losses were observed over the last decade (2002-2012).
Key figures on climate - France and Worldwide – 05part 1: Climate change
EVOLUTION OF THE AVERAGE ANNUAL TEMPERATURE
IN FRANCE
2.0
1.5
1.0
0.5
°C
0
–0.5
–1.0
1900
1910
1920
1930
1940
1950
1960
1970
1980
1990
2000
2010
–1;5
Deviation from the average Eleven-year moving average
temperature reference from year Y–5 to year Y+5
Source: Météo-France
As worldwide, the average temperature change in metropolitan France has
shown a clear warming since 1900. The speed of this warming has been variable
with a particularly pronounced increase since 1980. Over the period 1959-2009,
the observed trend is roughly +0.3°C per decade. In France, 2004, 2011 and
2015 were the warmest years on record since 1990.
06 – Key figures on climate - France and Worldwidepart 1: Climate change
EXTREME WEATHER EVENTS
A weather event (tornadoes, hurricanes, heat waves, heavy rainfalls) is clas-
sified as extreme when it significantly exceeds reference levels. Climate
change modifies the frequency, intensity, scale, duration and time of occur-
rence of extreme events. It can push the characteristics of these events to
unprecedented levels.
Heat waves in France - 1947-2014 period
32
2-19 august 2003
31 15-21 july 1964
Daily maximum temperatures averaged
15 - 21 august 2012 9-15 july 2003
in Metropolitan France (°C)
30
31 july - 29 june - 7 july 1952
5 august 1990 10-30 july 2006
29 8-12 august 1998 30 july - 8 august 1975
9-31 july 1983
28 19-21 july 1995
23 july -
6-8 august 1992 4 august 1947
27 18-28 june 2005
26 15-27
july 2013
15-24 july 2014
25 26-28 june 1947 29 june-7 july 1957
13-20 august 1947 22 june - 22 july - 9 august 1994
21-25 july 1989 6 august 1976
24
0 5 10 15 20 25
Duration (days)
1947-1980: 7 events 1981-2014: 15 events
Note : The surface of each circle represents the intensity of the heat wave, which depends on
its duration and its maximum temperature
Source: Météo-France
At the French national level, the heat waves recorded since 1947 were twice as
many over the last 34 years than over the previous period. This trend is also shaped
by the occurrence of more severe events (duration, intensity overall) in recent
years. Thus, the 4 longest heat waves and 3 among the 4 most intense waves
occurred after 1981. The heat wave observed in France from 2 to 9 August 2003
is by far the most significant event over the observation period.
Key figures on climate - France and Worldwide – 07part 1: Climate change
CHANGE IN GRAPE HARVEST DATES
21 oct.
Tavel
16 oct.
11 oct.
St-Émilion
6 oct.
1st oct. Alsace
26 sep.
Champagne
21 sep.
16 sep.
Chateauneuf
du Pape
11 sep.
6 sep.
1st sep.
1950 1960 1970 1980 1990 2000 2010
Sources: Inter-Rhône, ENITA Bordeaux, Inra, CICV, Inter-Rhône
Whatever the grape variety or the region, the wine harvest takes place at least
two weeks earlier now than in 1988. If the overall decline in harvest dates is
significant and fairly regular, inter-annual variations remain nevertheless impor-
tant. Thus this indicator illustrates the two aspects of climate variability: Short-
term climate fluctuation (on a yearly basis) and long-term climate change (on a
decade basis).It should however be noted that even if the whole 2014 year was
in France the warmest year since at least 1900, this year is not exceptional for
the wine because July and August temperatures were not particularly high.
08 – Key figures on climate - France and Worldwidepart 1: Climate change
Climate change causes
NATURAL GREENHOUSE EFFECT AND ITS PERTURBATIONS
BY HUMAN ACTIVITIES
Solar
radiation
340 Current energy flows in W/m2
100
76
Reflected Radiation
239
Outgoing Radiation
Radiation
Absorbed by the
Atmosphere
79 Interactions aerosols / clouds Chemical
Reactions
GHG and
Aerosols Chemical Clouds Ozone Large
Reactions Aerosols
185
Latent Heat Reflected
84 Radiation
Emission of Gases
24 342 and Aerosols
Ice / 398
Snow Cover Radiation
161 Emitted
from Surface
Radiation Absorbed 20
by the Surface Sensible
Heat Vegetation
Surface Albedo Changes
Ocean Color Changes
Net Absorption 0.6
Sunlight provides the earth with energy. Part of this energy is directly or indirectly reflected back
towards space, while the majority is absorbed by the atmosphere or by the earth’s surface. The
relatively warm temperatures at the earth’s surface are due to GHGs that reradiate most of the
surface radiation back to the earth.
Source: IPCC, Working group I, 2013
Higher anthropogenic GHG emissions in the atmosphere increase the amount of
energy reradiated to the earth. This results in an imbalance in the system, which
causes the rise of the global temperatures. A change in radiation caused by a
substance, compared to a reference year, is called radiative forcing. A positive
radiative forcing value indicates a positive contribution to global warming. The total
anthropogenic radiative forcing was + 2.55 ± 1.1 W/m2 in 2013 compared to 1750.
Key figures on climate - France and Worldwide – 09part 1: Climate change
GREENHOUSE GASES (GHGS)
Water vapor excepted, GHGs make up less of 0.1% of the atmosphere. Water
vapor, whose concentration in the atmosphere varies between 0.4% and 4%
in volume, is the main GHG. Anthropogenic activities have little impact on the
variations of its concentration but they have a strong impact on the
concentration of other GHGs.
CO2 CH4 N2O HFC PFC SF6 NF3
Atmospheric
concentration
397 ppm 1,823 ppb 327 ppb >157 ppt >6.5 ppt 8.2 ppt
2014 (in 2005 49 ppt) (>4.1 ppt) (5.6 ppt)
between
brackets)
Global Warming
potential (total [1.4; [6,630;
1 28-30 265 23,500 16,100
over 100 14,800] 11,100]
years)
Fossil fuels Landfills,
Agriculture,
combustion, agriculture,
industrial Manufacture
Anthropogenic industrial livestock Aerosols, refrigeration,
processes, of electronic
sources processes and aluminium smelting
use of components
and tropical industrial
fertilizer
deforestation processes
Change in
radiative
forcing due to
anthropogenic
emissions in +1.91 +0.50 +0.19 +0.12
2014 since (+1.66) (+0.48) (+0.16) (+0.09)
1750 (W/m²)
(in 2005
between
brackets)
ppm = parts per million, ppb = parts per billion, ppt = parts per trillion.
Source: IPCC, Working Group I, 2013, NOAA (2016), Agage (2016)
Global warming potential (GWP) is the ratio between the amount of energy
reradiated to the earth by 1 kg of a gas over 100 years and the amount that 1 kg
of CO2 would reradiate. It depends on the gases’ concentrations and lifetimes.
For example, 1 kg of CH4 and between 28 and 30 kg of CO2 will warm up the
atmosphere by the same amount over the century following their emission.
While CO2 is the gas with the lowest global warming potential, it is also the
one that has contributed the most to global warming since 1750, because the
significant amounts emitted.
10 – Key figures on climate - France and Worldwidepart 1: Climate change
CARBON STOCKS AND GHG FLOWS: SIMPLIFIED CO2 CYCLE
IN THE 2,000’S
+ 880]
[2,160
phere
Atmos Land Us
e
Volcan
ism
t Changepart 1: Climate change
IMBALANCE BETWEEN EMISSIONS AND CO2 STORAGE
CAPACITY
Net annual CO2 flows towards the atmosphere by source and reservoir over the period 2000-2009
35
30
Uncertainty
25
20
Gt CO2 / yr
15
10
Land Ocean
5 reservoirs reservoirs
–9.5 –8.4
0
Fossil fuel Land use Net flows
–5 combustion change to the
and cement 4.0 atmosphere
production 14.7
–10 28.6
–15
–20
Source: IPCC, Working Group I, 2013
In the 2000s, of the 32.6 Gt of CO2 annually released by human activities, the
atmosphere absorbed 14.7, land reservoirs (biosphere and subsoil) 9.5 and the
oceans 8.4. The atmosphere is the reservoir most affected by anthropogenic
activities: the amount of carbon stored increased by nearly 40% compared to
pre-industrial levels.
12 – Key figures on climate - France and Worldwidepart 1: Climate change
ROLE OF FORESTS IN THE CO2 CYCLE
Forests are the largest carbon reservoirs on land. They sequester 9.2 Gt of
net CO2 emissions per year, the equivalent of 33% of global GHG emissions.
Deforestation causes GHG emissions through the combustion and decom-
position of organic matter. These gross emissions account for 11% of GHGs
from anthropogenic sources (van der Werf et al., 2009, Nature Geoscience).
In France, the net carbon sequestration in forest biomass is estimated to be
around 70 Mt CO2, or 15% of national fossil carbon emissions (Citepa, 2016).
ATMOSPHERIC CO2 CONCENTRATION
parts per million - CO2
460
450 ppm =
440
Average level
not to be
420 exceeded
by 2100
400
380
360
340
320
300
1980 1985 1990 1995 2000 2005 2010 2015
Source: CMDGS under the authority of the OMM
Since the development of industry, land and ocean reservoirs have absorbed
half of anthropogenic emissions. The remaining emissions are still in the atmos-
phere, leading to an increase in the atmospheric concentrations of GHGs.
Key figures on climate - France and Worldwide – 13part 1: Climate change
Scenarios and climate projections
PROJECTION OF EMISSIONS FROM FOSSIL FUELS ACCORDING
TO THE IPCC’S FOUR REPRESENTATIVE CONCENTRATION
PATHWAYS (RCP)
30
Historical
25
RCP2.6 pathway
RCP4.5 pathway
20 RCP6.0 pathway
RCP8.5 pathway
15
Gt CO2e
10
5
0
–5
1850 1900 1950 2000 2050 2100
Year
Source: IPCC, Working Group I, 2013
The IPCC published its First Assessment Report in 1990. Its fifth report (AR5)
was published in its entirety end of 2014. For each publication, the IPCC
communicates climate projections based on assumptions for the concentration
of GHGs.
For the AR5, four Representative Concentration Pathways (RCP) were defined:
RCP2.6; RCP4.5; RCP6.0; RCP8.5, from the most optimistic to the most pes-
simistic, named after a possible range of radiative forcing values in the year
2100 relative to pre-industrial values (RCP8,5 corresponds to a situation with a
radiative forcing of 8,5 W/m² in 2100.)
These pathways correspond to more or less drastic efforts to reduce global
GHG emissions. Climate simulations and socio-economic scenarios are drawn
up from these projections.
14 – Key figures on climate - France and Worldwidepart 1: Climate change
EVOLUTION OF TEMPERATURES AND SEA LEVELS IN THE IPCC’S
CONCENTRATION PATHWAYS (RCPS)
Global average surface temperature change (relative to 1986–2005)
6.0
Mean over 2081-2100
Historical
4.0 RCP2.6 pathway
RCP4.5 pathway
RCP6.0 pathway
2.0 RCP8.5 pathway
°C
0
–2.0
1950 2000 2050 2100
Source: IPCC, Working Group I, 2013
Global mean sea level rise (relative to 1986–2005)
1.0
Mean over 2081-2100
RCP2.6 pathway
0.8 RCP4.5 pathway
RCP6.0 pathway
0.6 RCP8.5 pathway
(m)
0.4
0.2
0.0
2000 2020 2040 2060 2080 2100
Source: IPCC, Working Group I, 2013
Sea level rise is mainly caused by ocean thermal expansion and the melting of
land-based ice (glaciers, polar ice caps…).
Sea level rise will probably cause massive migration flows, as over one billion
people live in low-lying coastal areas.
Despite progress in recent years, ice melting forecast models still have wide
margins of uncertainty.
Key figures on climate - France and Worldwide – 15part 1: Climate change
CARBON BUDGETS AND TEMPERATURE RISE
Among the four IPCC’s concentration pathways, only the most ambitious, RCP2.6,
has a probability higher than 50% to limit the temperature rise to 2°C in 2100. The
most conservative pathway RCP 8.5 has more than 50% chance of leading to a
temperature rise higher than 4°C.
Carbon budget for a 50% probability to limit temperature rise to a certain value
Cumulative anthropogenic CO2 emissions between 1870 and…
1970 1990 2011
Temperature rise (°C)
3
2
1.5
0 500 1,000 1,500 2,000 2,500 3,000 3,500 4,000 4,500 5,000 5,500
Gt CO2
Note to read the graph: with a 50% probability, a 3°C temperature rise in 2100 implies the
cumulative emission of less than 4,500 Gt CO2. Among GHGs, only CO2 is accounted for in
the graph.
Source: I4CE, based on IPCC, Working Groups, I and III, 2014
A carbon budget is the maximum amount of GHGs which can be emitted to
avoid a temperature rise too important.
For example, IPCC’s simulations indicate that to have a probability higher than
50% to stay below a 2°C increase by 2100, cumulative anthropogenic emissions
have to be lower than 3,000 Gt CO2. As between 1870 and 2011, human acti-
vities already emitted 1,700 Gt CO2, the carbon budget consistent with a 2°C
limit is then 1,300 Gt CO2 from 2011 until the end of the century. This carbon
budget corresponds to around 30 years of 2014 emissions. The combustion of
all current fossil fuel reserves would emit an amount of CO2 much higher (4 to
7 times) than the carbon budget consistent with the 2°C limit.
16 – Key figures on climate - France and Worldwidepart 1: Climate change
CONSEQUENCES ON A GLOBAL SCALE
Summary of projected changes in crop yields due to climate change over the 21st century
compared to the levels at the end of the 20th century
100 Range of
yield change
Percentage of yield projections
80 50 to 100%
Increase 25 to 50%
in yield 10 to 25%
60 5 to 10%
0 to 5%
40 0 to –5%
–5 to –10%
Decrease
–10 to –25%
in yield
20 –25 to –50%
–50 to –100%
0
2010-2029 2030-2049 2050-2069 2070-2089 2090-2109
Source: IPCC, Working Group II, 2014
Climate change, without adaptation measures, is expected to have a negative
impact on the main crop yields (wheat, rice, maize and soy) in tropical and tem-
perate regions. The probability of a negative impact increases with time and the
severity of the warming. After 2050, the decrease in the average crop yields is
expected to go together with a gradual increase of the crop yields interannual
variability in several regions.
CONSEQUENCES FOR FRANCE
Number of additional days with abnormally high temperatures in the future (IPCC’s RCP 4.5, 2014)
Short-term outlook Medium-term outlook Long-term outlook
2021-2040 2041-2070 2071-2100
NBJ
– 50 – 40 – 30 – 20 – 10 0 10 20 30 40 50 60 70 80 90 100 110 120
Source: Drias les futurs du climat, 2014
Key figures on climate - France and Worldwide – 17part 1: Climate change
In France, the number of additional days with abnormally high temperatures
is expected to increase in the future, with possibly more than 100 additional
days per year by 2100, according to the RCP4.5. The southern and eastern
parts of France are expected to be the most exposed to these changes.
Schematic map of the potential impacts of climate change in metropolitan France
by 2050 and beyond
ALL REGIONS:
Warming more pronounced in summer and in the south- Flandres
east quarter: Dunkerque
Nord-Pas-de-Calais
- Sharp increase in the number of days Lille
Picardie
of heat wave in summer
- Evaporation with reduced base flows Normandie Flandres
Normandie Amiens
So Dunkerque
and water resources for agriculture mm
e Nord-Pas-de-Calais
Le Havre Lille
- Effects on crop yields Rouen
Picardie
- Shift in tourist attraction areas Reims
Normandie Metz
Normandie So Amiens
Brest mm Paris
Le Havre e Strasbourg
Nancy
Rouen
Reims
Rennes
LARGE CITIES:
Se
Metz
- More intense heat waves with Brest Paris
Orléans ine
Lo VOSGESStrasbourg
consequences on health and energy Angers ire Nancy Mulhouse
Nantes
consumption Rennes
Se
Tours Dijon
ine
- Increased risk of urban flooding: Pays nantais
Orléans Besançon
Lo VOSGES
overflow of sewerage systems, flooding Nantes
Angers ire JURA Mulhouse
of underground infrastructure Vendée
Centre-Atlantique
Tours Dijon
Pays nantais Besançon
JURA
FORESTS: Vendée Limoges Lyon
Centre-Atlantique Clermont
- Risk of forest fires extended towards Saintonge Ferrand ALPES
MASSIF
the north CENTRAL Grenoble
Bordeaux Limoges Lyon
Rhône
Clermont
MOUNTAINS: Saintonge Ferrand ALPES
MASSIF
- Reduced surface area of ski slopes Ga
ro CENTRAL Grenoble
n
- Increased natural hazards: debris flows Bordeaux ne
Rhône
in some mountain ranges Aquitaine
Nîmes
- Biodiversity: changes in species distribution Ga
ro
nn Toulouse
e
Flandres PACA Nice
COASTLINES:
Dunkerque Aquitaine
Nord-Pas-de-Calais Nîmes
Montpellier
-Accentuated
Lille risk of erosion, submergence and
Picardie Toulouse
PYRÉNÉES Camargue Marseille Toulon
salinisation of aquifers due to rising sea levels PACA Nice
Normandie - M
ore
Amiens
frequent risk of pertial flooding of polders Languedoc-
Montpellier
Normandie So
mm Roussillon
eand barrier beaches PYRÉNÉES Camargue Marseille Toulon
Le Havre
Rouen - Ports and related industries at risk of coastal flooding
Reims Languedoc-
- Changes in the distribution ofMetz fisheries resources with Roussillon
northward
Paris movement Strasbourg Corse
Nancy
Rennes
Se
ine
Corse
Orléans
Lo VOSGES
Angers ire Mulhouse
Nantes
Tours Dijon
Besançon
Centre-Atlantique Source: I4CE, 2015, according to IPCC (2014), Meem (2014 et 2015), Onerc (2010)
JURA
and Météo-France
Limoges Lyon
Clermont
nge Ferrand ALPES
MASSIF
Bordeaux
Key figures on
18 –CENTRAL climate - France and Worldwide
Grenoble
Rhône
Ga
ro
nn
epart 2
Which amounts of
greenhouse gases are
emitted globally?
— Anthropogenic GHG emissions reached 54 Gt CO2eq in 2013, with CO2
emissions accounting for around 73% of this total. Global CO2 emissions
(excluding LULUCF) increased by more than 58% between 1990 and
2014, with trajectories very different depending on the countries. China,
the biggest world emitter in 2014, is an unusual case with its emissions
having increased fourfold since 1990. When it comes to per capita CO2
emissions, the situation is different. In countries such as the United States
or Saudi Arabia, per capita emissions - more than 16 t CO2 per year - are
among the highest, while France is around the world average with
emissions per capita around 5 t CO2.
Key figures on climate - France and Worldwide – 19part 2: Global GHG emissions
Global overview of GHG emissions
GLOBAL DISTRIBUTION OF GHG EMISSIONS (INCLUDING
LULUCF) BY GAS IN 2010
Based on global warming potential at 20 years Based on global warming potential at 100 years
F-gases F-Gases
PFC + HFC + SF6 PFC + HFC + SF6
N 2O (2) N 2O (2)
(4) (5)
CH4
(20)
CH4
(42)
CO2 CO2
(52) (73)
Source: based on IPCC, Working Group III, 2014
CO2: Carbon dioxide;
N2O: Nitrous oxide;
CH4: Methane; HFC: Hydrofluorocarbons;
PFC: Perfluorocarbons;
SF6: Sulphur hexafluoride
The emissions of the six GHGs initially covered by the Kyoto Protocol have
increased by 80% since 1970 and by 45% since 1990, reaching 54 Gt CO2e
in 2013 and 49 Gt CO2e in 2010.
20 – Key figures on climate - France and Worldwidepart 2: Global GHG emissions
REGIONAL DISTRIBUTION OF GHG EMISSIONS PER CAPITA
IN 2012 (INCLUDING LULUCF)
25
Japan, South Korea, Australia and New Zealand 5.7%
20
Europe and former USSR excl. EU 8.2%
t CO2eq. / inhabitant
15
Middle-East 4.6%
Central and South
North America
America 10.9%
10
Other Asia
EU 28
and Oceania 6.9%
13.9%
8.9%
5 China 24.3%
Africa India 5.7%
10.8%
0
0 1 2 3 4 5 6
Cumulative population (billions)
Source: I4CE based on JRC EDGAR and World Bank, 2015
In 2012, average emissions per capita in North America are more than eight
times higher than in India. Besides, these values does not reflect the disparity
within a geographical area (for example, in Middle-East, emissions per capita
are higher than 50 t CO2eq./inhabitant in Qatar, and lower than 2 t CO2eq./
inhabitant in Yemen), and within a country.
REGIONAL DISTRIBUTION OF GHG EMISSIONS PER UNIT OF GDP
IN 2012 (INCLUDING LULUCF)
1.4
kg CO2eq. / USD 2005 PPA
1.2
Europe and former USSR excl. EU 8.2% Japan, South Korea,
Australia and New Zealand
1.0
5.7%
Central and South
0.8
and Océania 6.9%
America 10.9%
Africa 10.8%
0.6
Other Asia
Middle-East 4.6%
India 5.7%
0.4 China 24.3%
North America
0.2 13.9% EU 28
8.9%
0
0 10,000 20,000 30,000 40,000 50,000 60,000 70,000 80,000 90,000
Cumulated GDP (billions USD 2005 PPA)
Source: I4CE based on JRC EDGAR and World Bank, 2015
In 2012, the carbon intensity of GDP is more than four times higher in Africa than
in the EU, meaning that four times more GHGs are emitted per unit of economic
output.
Key figures on climate - France and Worldwide – 21part 2: Global GHG emissions
Global CO2 emissions excluding
LULUCF
GLOBAL CO2 EMISSIONS BY FUEL
40,000
35,000
10%
30,000
18% Other
25,000
Mt CO2
Gas
20,000 31% combustion
15,000 Oil
combustion
10,000
42% Coal
combustion
5,000
0
1970 1975 1980 1985 1990 1995 2000 2005 2010
Note: Emissions listed here are CO2 emissions from fossil fuel use and industrial processes.
This corresponds to total CO2 emissions excluding LULUCF. They account for 85% of all
global CO2 emissions and 65% of GHG emissions .
Source: EDGAR, 2015
In 2014, global CO2 emissions excluding LULUCF amount to 35.7 billion tonnes.
Close to 42% of those emissions are caused by coal combustion, 31% by oil
combustion and 18% by natural gas combustion. Emissions related to industrial
processes, such as cement production, represent 10% of the total.
22 – Key figures on climate - France and Worldwidepart 2: Global GHG emissions
GLOBAL PRIMARY ENERGY MIX
1971 (5,528 Mtoe) 2013 (13,553 Mtoe)
in % in %
Coal: 26 Coal: 29
Oil: 44 Oil: 31
Natural gas: 16 Natural gas: 21
Nuclear: 1 Nuclear: 5
Renewable energies Renewable energies
and waste: 13 and waste: 14
Source: IEA, september 2015
The distribution of emissions by fuels can be linked to the global primary
energy mix. In 2013, fossil fuels (coal, natural gas and oil) account for 81% of
the global total primary energy supply. Globally, between 1971 and 2013, the
share of crude oil in this mix fell by 13 points, in favour of gas (+5 points),
nuclear power (+4 points) and coal (+3 points). Accounting for a 29% share of
the energy mix, coal was the second largest energy source after crude oil in
2013. Yet, it ranked first in terms of CO2 emissions as its emission factor is
considerably higher than those of gas and oil (see page 74). As renewable
energy generation has increased at a rate close to total generation, its share
in the world energy mix has stayed stable in 40 years, around 14 %.
Key figures on climate - France and Worldwide – 23part 2: Global GHG emissions
GEOGRAPHIC DISTRIBUTION OF GLOBAL CO2 EMISSIONS
(EXCL. LULUCF)
2014 share Change (%) Change (%)
In Mt CO2 1990 2013 2014
(%) 2014/2013 2014/1990
North America 5,726 6,315 6,357 17.8 +0.7 +11.0
of which: Canada 448 565 566 1.6 +0.2 +26.2
USA 4,988 5,286 5,335 15.0 +0.9 +6.9
Central and South America 647 1,291 1,306 3.7 +1.1 +101.8
of which: Brazil 217 485 501 1.4 +3.3 +130.5
Europe and former USSR 8,353 6,403 6,142 17.2 –4.1 –26.5
of which: Russia 2,379 1,792 1,766 5.0 –1.4 –25.7
EU-28 4,345 3,608 3,415 9.6 –5.4 –21.4
of which: EU-15 3,282 2,888 2,711 7.6 –6.1 –17.4
Germany 1,008 813 767 2.2 –5.6 –23.9
Spain 227 244 242 0.7 –1.0 +6.5
France 387 353 324 0.9 –8.3 –16.3
Italy 424 366 338 0.9 –7.6 –20.4
United Kingdom 579 456 415 1.2 –8.9 –28.3
13 new EU members 1,063 720 704 2.0 –2.3 –33.8
Africa 667 1,162 1,188 3.3 +2.3 +78.1
Middle East 814 2,193 2,272 6.4 +3.6 +179.1
of which Saudi Arabia 168 463 495 1.4 +7.0 +194.3
Asia 5,378 16,543 16,833 47.2 +1.8 +213.0
of which: China 2,411 10,448 10,541 29.6 +0.9 +337.1
South Korea 268 609 610 1.7 +0.2 +127.6
India 652 2,172 2,342 6.6 +7.8 +258.9
Japan 1,170 1,217 1,235 3.5 +1.5 +5.6
Oceania 304 461 454 1.3 –1.6 +49.4
Annex I countries 14,894 13,937 13,666 38.3 –1.9 –8.2
Non-Annex I countries 6,995 20,431 20,886 58.6 +2.2 +198.6
International bunkers 626 1,109 1,117 3.1 +0.7 +78.2
World 22,516 35,477 35,669 100.0 +0.5 +58.4
Note: International bunkers are emissions from international aviation and shipping. They have
been excluded from national totals.
Sources: SOeS from EDGAR, World Bank, 2015
In 2014, global CO2 emissions (excluding LULUCF) slightly increased by 0.5%,
well below the average yearly increase since 2000 (+2.5%). There is a clear
difference between developing countries (here non-Annex I countries) where
emissions grew by 2.2% and developed countries where emissions decreased
by 1.9%. In 2014, for the first time, India is the country contributing the most to
global emissions growth (+170 Mt CO2).
24 – Key figures on climate - France and Worldwidepart 2: Global GHG emissions
EVOLUTION OF GLOBAL CO2 EMISSIONS BETWEEN 1970
AND 2014
450
China
400
350
India
300
Index base 100 in 1990
World
250
200 United
States
150
France
100
50 EU 28
0
1970 1975 1980 1985 1990 1995 2000 2005 2010
Sources: SOeS from EDGAR, World Bank, 2015
In 2014, Chinese emissions accounted for almost 30% of global CO2 emissions.
China is the first emitting country, followed by the United States (15.0%), the
EU-28 (9.6% of the global total when counted as a block) and India (6.6%).
Between 1990 and 2014, global CO2 emissions increased by 50%. Among the
main emitters, China displays the highest growth rate: its emissions increased
fourfold during the period. As for the United States, its emissions have increased
by 7% since 1990. During the same period, EU-28 emissions decreased by
21% and French emissions by 16%.
Key figures on climate - France and Worldwide – 25part 2: Global GHG emissions
GLOBAL CO2 EMISSIONS PER CAPITA
Change (%) Change (%)
In t CO2 / capita 1990 2013 2014
2014/2013 2014/1990
North America 15.8 13.3 13.2 –0.3 –16.0
of which: Canada 16.2 16.1 15.9 –1.2 –1.9
USA 19.6 16.5 16.5 – –15.8
Central and South America 1.8 2.6 2.6 +0.1 +45.2
of which: Brazil 1.5 2.4 2.5 +2.5 +71.0
Europe and former USSR 9.9 7.1 6.8 –4.5 –31.4
of which: Russia 16.1 12.6 12.4 –1.2 –22.8
EU-28 9.1 7.1 6.7 –5.7 –26.1
of which: EU-15 9.0 7.2 6.7 –6.4 –25.1
Germany 12.5 9.8 9.3 –5.5 –25.9
Spain 5.8 5.2 5.1 –1.3 –12.0
France 6.7 5.5 5.0 –9.1 –25.4
Italy 7.5 6.0 5.5 –7.7 –26.0
United Kingdom 10.1 7.2 6.5 –9.5 –35.4
13 new EU members 9.4 6.7 6.5 –2.1 –30.8
Africa 1.1 1.0 1.0 –0.3 –3.2
Middle East 7.6 12.6 12.8 +1.6 +67.3
of which Saudi Arabia 10.4 16.1 16.9 +5.0 +62.3
Asia 1.8 4.3 4.3 +0.8 +1 33.1
of which: China 2.1 7.5 7.6 +1.3 +261.9
South Korea 6.2 12.4 12.3 –0.3 +97.4
India 0.8 1.7 1.8 +5.9 +125.0
Japan 9.6 10.3 10.1 –2.5 +5.2
Oceania 13.6 15.5 15.0 –3.1 +9.9
Annex I countries 12.9 10.9 10.6 –2.4 –17.5
Non-Annex I countries 1.7 3.5 3.5 +0.9 +106.2
World 4.3 4.9 4.9 –0.7 +15.3
Note: The figures here refer to the CO2 emissions of a territory divided by its population.
The average emissions due to the consumption of an inhabitant are calculated using a different
approach (carbon footprint).
Sources: SOeS from EDGAR, World Bank, 2015
In 2014, global CO2 emissions came to 4.5 t CO2/capita on average, a decrease
of 0.7% compared to 2013. It means that global CO2 emissions growth in 2014
(+0.5%) was lower than demographic growth (+1.2%). Emissions per capita
were highest in North America (over 16 t CO2/capita in the United States), in
the Middle East and in Oceania. Chinese emissions per capita are now 7,6 t CO2/
capita, above the French level of 5.0 t CO2/capita and the average for the EU-28
(6.7 t CO2/capita).
26 – Key figures on climate - France and Worldwidepart 2: Global GHG emissions
EVOLUTION OF GLOBAL CO2 EMISSIONS PER CAPITA BETWEEN
1970 AND 2014
24
United
22
States
20
18 EU 28
16
14 China
t CO2 / capita
12
10
France
8
6
World
4
2
India
0
1970 1975 1980 1985 1990 1995 2000 2005 2010
Sources: SOeS from EDGAR, World Bank, 2015
Since 1990, global average emissions per capita have increased by 15%.
While emissions per capita in non-annex I countries are still three times lower
than in annex I countries, there is an ongoing catching-up process between
those two groups of countries. For instance, since 1990, emissions per capita
have been multiplied by more than 3.5 in China and have more than doubled
in India. Simultaneously, CO 2 emissions per capita have significantly
decreased in the EU (–26%) and to a lesser extent in the United States (–16%).
Key figures on climate - France and Worldwide – 27part 2: Global GHG emissions
GLOBAL CO2 EMISSIONS IN RELATION TO GDP (EXCL. LULUCF)
Change (%) Change (%)
In t CO2 / Million $ 2011 PPP 1990 2013 2014
2014/2013 2014/1990
North America 512 320 315 –1.7 –38.4
of which: Canada 519 384 375 –2.3 –27.7
USA 540 326 321 –1.5 –40.6
Central and South America 194 179 179 +0.1 –7.7
of which: Brazil 145 166 172 +3.6 +18.6
Europe and former USSR 565 316 307 –2.6 –45.6
of which: Russia 829 530 519 –2.1 –37.4
EU-28 365 208 194 –6.7 –46.8
of which: EU-15 312 192 178 –7.3 –42.9
Germany 403 209 191 –8.4 –52.6
Spain 242 165 161 –2.4 –33.5
France 222 144 131 –9.0 –41.0
Italy 243 179 166 –7.3 –31.7
United Kingdom 383 193 171 –11.4 –55.4
13 new EU members 780 306 291 –4.9 –62.7
Africa 551 234 226 –3.4 –59.0
Middle East 388 421 424 +0.7 +9.1
of which Saudi Arabia 294 308 318 +3.2 +8.2
Asia 490 426 411 –3.5 –16.1
of which: China 1,327 656 617 –5.9 –53.5
South Korea 517 371 359 –3.2 –30.6
India 423 331 333 +0.6 –21.3
Japan 321 290 282 –2.8 –12.1
Oceania 528 401 385 –4.1 –27.2
Annex I countries 485 297 287 –3.5 –40.8
Non-Annex I countries 442 382 372 –2.5 –15.7
World 484 353 344 –2.7 –28.9
Note: GDP at constant prices converted to US dollars on a Purchasing Power Parity (PPP)
basis for 2011.
Sources: SOeS from EDGAR, World Bank, 2015
The quantity of CO2 emitted per unit of GDP keeps declining worldwide with
a 2.7 % decrease in 2014. There are strong disparities between countries with
the highest values in China (more than 600 t CO2/ Million $) or in Russia. The
United States (321 t CO2/ Million $) or Japan are slightly below the global
average, while the lowest values are in the EU (194 t CO2/ Million $), in
particular in France (131 t CO2/ Million $).
28 – Key figures on climate - France and Worldwidepart 2: Global GHG emissions
EVOLUTION OF GLOBAL CO2 EMISSIONS IN RELATION
TO GDP BETWEEN 1990 AND 2014
1,600
China
1,400
1,200 United
States
1,000
World
t CO2 / Million $ 2011 PPA
800
EU 28
600
400 India
200
France
0
1990 1995 2000 2005 2010
Sources: SOeS from EDGAR, World Bank, 2015
Since 1990, the quantity of CO2 emitted per unit of GDP has dropped by 29%
worldwide. It has decreased in most countries. The main exceptions are oil-
producing countries such as Saudi Arabia (+8%) or raw materials exporting
countries like Brazil (+18%). China was the country that recorded the sharpest
drop in 24 years, with emissions per unit of GDP down by more than half. The
decline in CO2 intensity in relation to GDP is also significant in the EU (–47%)
and in the United States (–41%).
Key figures on climate - France and Worldwide – 29part 2: Global GHG emissions
Sectorial distribution of global CO2
emissions from fuel combustion
DISTRIBUTION OF CO2 EMISSIONS FROM FUEL COMBUSTION FOR
THE MAIN EMITTERS IN 2013
3% 2%
100%
4% 4% 5%
6% 6% Other sectors
90% 9% 13% (including tertiary)
80% 23%
Residential
34%
70% 32% 26%
60% 19% Transport
50% 8%
10% 13%
8% 6%
40% 6% Industry
and constuction
30%
44% Energy sector
20% 40% 42%
37% outside electricty
10%
Electricity
0% generation
World China United States EU 28
Source: IEA, 2015
Accounting for 40% of global energy-related CO2 emissions, electricity
generation was the first emitting sector in 2013. Next are the transport sector
and industry, respectively accounting for 23 % and 19 % of energy-related
CO2 emissions. In China, electricity generation (44%) and industry (32%)
are responsible for a higher share of emissions than the global average. As
for the transport sector, it is responsible of a higher share than the global
average in the EU (26%) and even more in the United States (34%).
30 – Key figures on climate - France and Worldwidepart 3
How much greenhouse
gas is emitted in
Europe and in France ?
— Within the UNFCCC framework, the European Union and France
report the greenhouse gases emitted on their territory. In 2014, the
EU emitted 4,282 Mt CO2e excluding LULUCF, representing a drop of
24% compared to 1990. In France, emissions excluding LULUCF
reached 459 Mt CO2e in 2014 and have decreased by 16% since
1990. In the EU, the energy sector is the first emitting sector while the
transport sector contributes the most to French emissions. The
footprint approach, complementary to the territorial approach, gives
an estimate of GHG emissions arising from the consumption of
French residents. In 2010, French consumption-based emissions
were over 50% higher than territory-based emissions.
Key figures on climate - France and Worldwide – 31part 3: GHG emissions in Europe and in France
Overview of GHG emissions
in Europe
EU-28 GHG EMISSIONS IN 2014
In Mt CO2eq. Years CO2 CH4 N2O F-gases Total
1990 4,120.5 202.3 31.1 0.0 4,353.9
Energy use
2014 3,211.7 82.7 29.5 0.0 3,323.9
1990 321.5 1.8 117.8 71.1 512.2
Industrial processes and
use of solvents
2014 238.3 2.2 11.2 121.7 373.4
1990 13.9 304.1 229.8 0.0 547.8
Agriculture (excluding
energy use)
2014 10.2 236.9 187.9 0.0 434.9
1990 5.4 229.2 8.6 0.0 243.2
Waste
2014 3.5 131.5 10.7 0.0 145.7
1990 4,469.6 737.3 387.4 71.1 5,665.5
Total excl. LULUCF
2014 3,467.9 453.3 239.2 121.7 4,282.1
1990 –273.3 6.7 5.6 0.0 –255.2
LULUCF
2014 –319.3 5.1 7.0 0.0 –302.6
1990 4,196.3 744.1 398.7 71.1 5,410.3
Total
2014 3,148.5 458.4 250.9 121.7 3,979.5
Note: The waste sector excludes waste incineration with energy recovery (included in
“energy use”).
Source: EAA, july 2016
In 2014, European GHG emissions excluding LULUCF reached 4,282 Mt CO2e
of which 81% are CO2 emissions and 78% are energy-related. European GHG
emissions dropped by 4.1% compared to 2013 and by 24% over the period
1990-2014.
32 – Key figures on climate - France and Worldwidepart 3: GHG emissions in Europe and in France
DISTRIBUTION OF GHG EMISSIONS (EXCL. LULUCF)
IN THE EU IN 2014
In %
Energy sector:
29.1
Agriculture:
10.2
Energy Use: 77.6
Transport: 20.8
Industrial Processes
and use of
solvents: 8.7 Manufacturing industry
and construction: 11.5
Residential-tertiary:
12.2
Waste: 3.4 Other: 4.0
Source: EAA, july 2016
In the EU, energy use was the main source of GHG emissions (78%). The
largest GHG emitting sector was the energy sector (29% of emissions), ahead
of transport (21%).
Between 2013 and 2014, the decline of GHG emissions can largely be ex-
plained by significant decreases in the energy (–7%) and residential-tertiary
(–15%) sectors.
Key figures on climate - France and Worldwide – 33part 3: GHG emissions in Europe and in France
Overview of GHG emissions
in France
FRANCE’S EMISSIONS IN 2014
In Mt CO2eq. Years CO2 CH4 N2O F-gases Total
1990 368.6 12.3 3.3 0.0 384.2
Energy use
2014 313.3 2.6 3.7 0.0 319.6
1990 25.7 0.1 23.8 11.8 61.4
Industrial processes and
use of solvents
2014 18.3 0.1 1.2 20.4 40.0
1990 1.7 41.8 39.6 0.0 83.2
Agriculture (excluding
energy use)
2014 1.9 39.9 37.0 0.0 78.9
1990 2.2 14.3 0.9 0.0 17.4
Waste
2014 1.7 16.8 1.0 0.0 19.5
1990 400.2 68.5 67.5 11.8 548.1
Total excl. LULUCF
2014 336.3 59.3 42.9 20.4 458.9
1990 –34.2 0.9 2.7 0.0 –30.6
LULUCF
2014 –54.0 1.1 2.3 0.0 –50.6
1990 366.1 69.5 70.2 11.8 517.5
Total
2014 282.3 60.4 45.2 20.4 408.3
Source: Citepa, juin 2016
In 2014, French GHG emissions, excluding LULUCF, reached 459 Mt CO2e,
of which 73% are CO2 emissions and 70% are energy-related. French GHG
emissions decreased by 5.7% compared to 2013 and by 16% over the period
1990-2014.
34 – Key figures on climate - France and Worldwidepart 3: GHG emissions in Europe and in France
DISTRIBUTION OF GHG EMISSIONS (EXCL. LULUCF)
IN FRANCE IN 2014
In %
Energy sector:
8.6
Transport: 28.5
Agriculture:
17.2
Energy Use: 69.7
Manufacturing industry
Industrial Processes and construction: 13.1
and use of
solvents: 8.7
Residential-tertiary:
15.8
Other: 3.6
Waste: 4.2
Source: Citepa, juin 2016
As throughout the EU, energy use was the main GHG emission source in
France accounting for 70% of total emissions excluding LULUCF. However,
unlike the EU average, the largest emitting sector in France is transport (29%),
while the energy sector has relatively low emissions (9%), owing to the extent
of nuclear electricity generation. Between 2013 and 2014, the sectors contri-
buting the most to the reduction of French emissions were the energy (–25%)
and residential-tertiary (–16%) sectors.
Key figures on climate - France and Worldwide – 35part 3: GHG emissions in Europe and in France
Carbon footprint and emissions from
imported goods
COMPARISON BETWEEN THE FOOTPRINT APPROACH AND THE
TERRITORIAL INVENTORY APPROACH FOR METROPOLITAN
FRANCE - 2010 - CO2 ONLY
700
572 Mt CO2
600
Emissions from imported
500 goods for final use
380 Mt CO2
Mt CO2
400 Emissions from imported
goods for intermediate Emissions from
consumption exported goods
300
Emissions from domestic Emissions from domestic
200 production (excluding exports) production (excluding exports)
100 Direct emissions from households
Direct emisions from households
in France (cars and heating) in France (cars and heating)
0
Footprint Inventory
Source: SOeS from Citepa, Eurostat, Insee, Customs, IEA, 2016
Two complementary methods allow to estimate a country pressure on global
climate:
- National inventories account for GHGs physically emitted inside a territory.
These national inventories are carried out each year according to UNFCCC
guidelines.
- The carbon footprint approach accounts for emissions from final domestic
demand in the country. It includes direct emissions from households (housing
and cars), emissions from domestic production (excluding exports) and em-
issions from imported goods.
36 – Key figures on climate - France and Worldwidepart 3: GHG emissions in Europe and in France
EVOLUTION OF FRANCE’S CO2 EMISSIONS ACCORDING TO THE
TERRITORIAL APPROACH AND THE FOOTPRINT APPROACH
Carbon footprint National inventory
9.7
700 10
9.1 9.1
8.2 8.3 9
600
8
6.8 6.9 6.8
500 7
6.1
268
279 5.2 6
Mt CO2
t CO2 / capita
400 217 292
167
5
300
4
407 416 3
200 393
380
310 317 324 294 337
2
240
100
1
0 0
1995 2000 2005 2010 2015e 1995 2000 2005 2010 2015p
CO2 emissions inside metropolitan France p: provisional
CO2 emissions from imported goods e: estimation
Domestic CO2 emissions (domestic production for domestic demand + households)
CO2 footprint per capita
CO2 territorial emissions per capita
Source: SOeS from Citepa, Eurostat, Insee, Customs, IEA, 2016
In 2015, the French carbon footprint (CO2 only) amounted to 532 Mt of CO2,
11.7% higher than in 1995. Emissions from imported goods increased by 76%
over the same period.
However, if the increased population is taken into account, the footprint calculated
per capita in 2015 is almost the same as in 1995. Over this period, emissions
inside metropolitan France decreased by 14.4% and the average emissions per
capita by 23%. Both emissions from the territorial inventory and the carbon
footprint have been declining since the middle of the 2000’s.
Key figures on climate - France and Worldwide – 37part 3: GHG emissions in Europe and in France
INTERNATIONAL COMPARISON OF CO2 EMISSIONS FROM FUEL
COMBUSTION ACCORDING TO THE TWO APPROACHES
Absolute emissions Emissions per capita
16 16
OCDE OCDE
14 14 in 1990
in 1990
12 12
EU-28
10 Approach 10
Consumption-based
Territory-based
8 Transfer of Embodied CO2 8
t CO2/capita
Net Import
Gt CO2
Net Export China
Economies
6 6 In transition
EU-28
China
4 4 Middle-East
Economies and Africa
in transition
2 Middle-East 2
and Africa Latin America
Latin America
0 0
1990 1995 2000 2005 2010 2013 1990 1995 2000 2005 2010 2013
Source: I4CE from Global Carbon Budget, 2015
Between 1990 and 2012, CO2 emissions in the OECD increased by 5% according
to the territorial approach, and by 9% according to the footprint approach. In the
EU, over the same period, they dropped by 18% according to the territorial ap-
proach but only by 14% with the footprint approach. In China, they have more
than tripled according to both approaches.
According to the territorial approach, emissions per capita in China are now
close to the EU average. However, according to the footprint approach, emis-
sions per capita in China are still 30% lower than in the EU (and 50% lower than
the OECD average).
38 – Key figures on climate - France and Worldwidepart 4
What is the sectoral
distribution of GHG
emissions in Europe
and in France?
— European and French inventories enable a breakdown of GHG
emissions by economic sectors and subsectors. In Europe and in France,
the decline in emissions since 1990 has been the most significant in the
manufacturing industry followed by the energy sector. Emissions in the
residential and tertiary sectors have also been following a downward trend
in the EU and to a lesser extent, in France. The transport sector is an
exception as the level of emissions in 2014 was higher than in 1990, both
in Europe and in France. However, since the mid 2000s, emissions have
been decreasing in the transport sector at both levels. Emissions from
LULUCF are negative, hence meaning that there is a net sequestration of
CO2 by biomass and soils.
Key figures on climate - France and Worldwide – 39part 4: Sectoral distribution of GHG emissions in Europe and France
GHG emissions from the energy
sector
GHG EMISSIONS FROM THE ENERGY SECTOR IN THE EU
2,000
Public electricity
1,800
GHG emissions (Mt CO2e)
and heat
1,600 production
1,400
Fugitive emissions
1,200
from fuels
1,000
800
Manufacture of
600 solid fuels and other
400
200 Petroleum refining
0
1990 1995 2000 2005 2010 2014
Note: Public electricity and heat production includes waste incineration with energy recovery.
Heat refers here to traded heat only.
Source: EEA,July 2016
GHG EMISSIONS FROM THE ENERGY SECTOR IN FRANCE
100
Public electricity
90
GHG emissions (Mt CO2e)
and heat
80 production
70
Fugitive emissions
60
from fuels
50
40
Manufacture of
30 solid fuels and other
20
10 Petroleum refining
0
1990 1995 2000 2005 2010 2014
Note: Public electricity and heat production includes waste incineration with energy recovery.
Heat refers here to traded heat only.
Source: Citepa,June 2016
40 – Key figures on climate - France and Worldwidepart 4: Sectoral distribution of GHG emissions in Europe and France
CO2 EMISSIONS FROM THE GENERATION OF 1 KWH
OF ELECTRICITY IN THE EU
1,000
Poland
900
800 Germany
700
United
Kingdom
600
g CO2 / kWh
Italy
500
400 EU-28
300
France
200
Sweden
100
0
1990 1995 2000 2005 2010 2013
Note: cogeneration and autoproduction are included
Source: IEA, October 2015
CO2 emissions per unit of electricity generated vary greatly from one country to
another in the EU-28. They are very high (over 400 g CO2/kWh) in countries
where coal remains a major source for electricity production, such as Germany
and some countries in Central and Eastern Europe. They are low in countries
where renewable energy and/or nuclear power have been significantly deve-
loped, such as France (78% nuclear and 12% hydro in 2014) and Sweden (42%
hydro and 41% nuclear).
Key figures on climate - France and Worldwide – 41part 4: Sectoral distribution of GHG emissions in Europe and France
GHG emissions from transport
GHG EMISSIONS FROM TRANSPORT IN THE EU
1,000
800
GHG emissions (Mt CO2e)
Road
60 Other
Rail
40
Aviation
20 Shipping
and inland
waterways
0
1990 1995 2000 2005 2010 2014
Note: Emissions from international aviation and shipping are excluded.
Source: EEA,July 2016
GHG EMISSIONS FROM TRANSPORT IN FRANCE
(INCL. OVERSEAS TERRITORIES)
140
120
GHG emissions (Mt CO2e)
100 Road
Other
8 Rail
6 Aviation
4 Shipping
and inland
2
waterways
0
1990 1995 2000 2005 2010 2014
Note: Emissions from international aviation and shipping are excluded. Emissions from transport
between metropolitan France and French overseas departments are included.
Source: Citepa,June 2015
42 – Key figures on climate - France and Worldwidepart 4: Sectoral distribution of GHG emissions in Europe and France
GHG EMISSIONS BY MODE OF TRANSPORT INSIDE
METROPOLITAN FRANCE
In %
Light commercial vehicule: 19.1
Motorcycles: 1.2
Heavy goods
vehicules:
21.3
Aviation: 3.5
Other:
5.2
Private vehicules: 53.2 Shipping and inland
waterways: 1.0
Other: 0.4
Rail: 0.4
Source: Citepa, June 2016
INTENSITY OF GHG EMISSIONS IN METROPOLITAN FRANCE
110
105 Domestic
Inde base 100 en 1990
100 passenger
95 transport
90
85
80 Domestic
freight
75
70
65
1990 1995 2000 2005 2010 2014
Note: The indicators used for freight and passenger transport are, respectively, GHG emissions
per tonne-kilometre and GHG emissions per passenger-kilometre.
Source: Citepa, June 2016 and SOeS
Key figures on climate - France and Worldwide – 43part 4: Sectoral distribution of GHG emissions in Europe and France
GHG emissions from the manufacturing
industry and the construction sector
GHG EMISSIONS FROM THE MANUFACTURING INDUSTRY
AND THE CONSTRUCTION SECTOR IN THE EU
1,400 Food processing,
GHG emissions (Mt CO2e)
1,200 beverages and
tobacco
1,000 Other
800 manufacturing
600 industries and
construction sector
400 Metal industry
200 Chemicals
0 Non-metallic minerals
1990 1995 2000 2005 2010 2014
Note: emissions from each sector include energy-related emissions and emissions from
industrial processes.
Source: EEA,July 2016
GHG EMISSIONS FROM THE MANUFACTURING INDUSTRY AND
THE CONSTRUCTION SECTOR IN FRANCE (INCL. OVERSEAS
TERRITORIES)
140 Food processing,
GHG emissions (Mt CO2e)
beverages and
120
tobacco
100 Other
80 manufacturing
industries and
60
construction sector
40 Metal industry
20 Chemicals
0 Non-metallic minerals
1990 1995 2000 2005 2010 2014
Note: emissions from each sector include energy-related emissions and emissions from
industrial processes.
Source: Citepa,June 2016
44 – Key figures on climate - France and Worldwidepart 4: Sectoral distribution of GHG emissions in Europe and France
GHG EMISSIONS INTENSITY OF THE MANUFACTURING
INDUSTRY AND THE CONSTRUCTION SECTOR IN FRANCE
GHG emissions per unit of value added
110
100
Index base 100 in 1990
90
80
70
60
50
40
1990 1995 2000 2005 2010 2014
Source: Insee (value added), Citepa (GHG emissions), June 2016
CO2 INTENSITY FOR SEVERAL CO2-INTENSIVE PRODUCTS
IN FRANCE
2
Steel
1.5
t CO2/t product
1 Glass
0.5 Clinker
0
1990 1995 2000 2005 2010 2014
Note: Clinker is a component of cement that results from heating a mixture of silicia, iron
oxide and limestone
Sources: Fédération française de l’acier (FFA), Fédération des chambres syndicales de
l’industrie du verre (FCSIV), Syndicat français de l’industrie cimentière (SFIC), Citepa
Key figures on climate - France and Worldwide – 45part 4: Sectoral distribution of GHG emissions in Europe and France
GHG emissions from the residential
and tertiary sectors
GHG EMISSIONS FROM THE RESIDENTIAL AND TERTIARY
SECTORS IN THE EU
800
700
GHG emissions (Mt CO2e)
600 Tertiary
500
400
300
200 Residential
100
0
1990 1995 2000 2005 2010 2014
Source: EEA, July 2016
GHG EMISSIONS FROM THE RESIDENTIAL AND TERTIARY
SECTORS IN FRANCE (INCL. OVERSEAS TERRITORIES)
1.40
GHG emissions (Mt CO2e)
120
1.20 Tertiary
100
1.00
Index base 1
80
0.80
60 Residential
0.60
40 0.40
20 0.20 Climate
severity
0 0.00 index
1990 1995 2000 2005 2010 2014
Source: Citepa, June 2016 and SOeS from Météo-France, 2016
Emissions from the residential and tertiary sectors vary depending on climate
conditions. Temperatures were particularly mild in 1994, 2002, 2007, 2011 and
2014. This resulted in a reduction in heating consumption and thus in CO2
emissions. In contrast, 1991, 1996 and 2010 were exceptionally cold.
46 – Key figures on climate - France and Worldwidepart 4: Sectoral distribution of GHG emissions in Europe and France
DISTRIBUTION OF CO2 EMISSIONS FROM RESIDENTIAL
BUILDINGS IN METROPOLITAN FRANCE
Distribution of residential emissions Distribution of residential
by usage as % emissions by fuel as %
Cooking: 6 LPG: 5 Coal: 2
Hot water: 10
Fuel
oil: 32
Heating: 84 Gas: 61
Note: only CO2 emissions from fossil fuel combustion are taken into account. The carbon
content of electricity is not measured.
Source: SOeS from Ceren, 2016
Since 1990, natural gas has displaced coal and fuel oil for heating, cooking,
and hot water production in buildings. Combustion of natural gas now
accounts for 61 % of CO2 emissions from residential buildings.
CO2 INTENSITY FOR THE RESIDENTIAL AND TERTIARY SECTORS
IN FRANCE
120
110
Index base 100 in 1990
Tertiary
100 intensity
90
80
70
Residential
60 intensity
50
1990 1995 2000 2005 2010
Note: emissions from the tertiary sector are divided by the value added of the tertiary sector
(excluding transports) while emissions from residential buildings are divided by the total
surface of occupied buildings.
Source: SOeS from Citepa and Insee, 2016
Key figures on climate - France and Worldwide – 47part 4: Sectoral distribution of GHG emissions in Europe and France
GHG emissions from agriculture,
forestry and land use
GHG EMISSIONS FROM AGRICULTURE IN THE EU
700
Energy use
600
GHG emissions
500 Other emissions from
(Mt CO2e)
agriculture excl.
400 energy use
300
Manure management
200 Agricultural soils
100
Enteric fermentation
0
1990 1995 2000 2005 2010 2014
Source: EEA, July 2016
GHG EMISSIONS FROM AGRICULTURE IN FRANCE
(INCL. OVERSEAS TERRITORIES)
100
Energy use
90
80
GHG emissions
70 Other emissions from
(Mt CO2e)
60 agriculture excl.
50 energy use
40 Manure management
30
Agricultural soils
20
10 Enteric fermentation
0
1990 1995 2000 2005 2010 2014
Source: Citepa, June 2016
Agriculture differs from other economic sectors as most of the GHG emissions
are not energy-related. The main GHGs sources are CH4 emitted by livestock
(enteric fermentation) and N2O emitted by agriculture soils and linked to the
nitrogen cycle.
48 – Key figures on climate - France and WorldwideYou can also read