Implementation of Nationally Determined Contributions - 27/2018 Republic of Marshall Islands Country Report
←
→
Page content transcription
If your browser does not render page correctly, please read the page content below

CLIMATE CHANGE

 27/2018

Implementation of
Nationally Determined
Contributions
Republic of Marshall Islands Country Report
CLIMATE CHANGE 27/2018

Environmental Research of the
Federal Ministry for the
Environment, Nature Conservation
and Nuclear Safety

Project No. (FKZ) 3716 4111 80

Implementation of Nationally Determined
Contributions
Republic of Marshall Islands Country Report

by

Florian Mersmann
Wuppertal Institute for Climate, Environment and Energy, Wuppertal
International data and graphs: Hanna Fekete, Lisa Luna
NewClimate Institute, Cologne
Country specific support and review: Dr. Herbert Wade
Bangkok, Thailand

On behalf of the German Environment Agency
Imprint

Publisher:
Umweltbundesamt
Wörlitzer Platz 1
06844 Dessau-Roßlau
Tel: +49 340-2103-0
Fax: +49 340-2103-2285
info@umweltbundesamt.de
Internet: www.umweltbundesamt.de

  /umweltbundesamt.de
  /umweltbundesamt

Study performed by:
Wuppertal Institute for Climate, Environment and Energy
Döppersberg 19
42103 Wuppertal

NewClimate Institute
Am Hof 20 – 26
50667 Cologne

Dr. Herbert Wade
90/40 Bangkapi Condo 'D'
Soi 121 Lad Phrao Road
Bangkok 10240 THAILAND
Country specific support and review

Study completed in:
January 2018

Edited by:
Section I 2.1 Climate Protection
Juliane Berger

Publication as pdf:
http://www.umweltbundesamt.de/publikationen

ISSN 1862-4359

Dessau-Roßlau, November 2018

The responsibility for the content of this publication lies with the author(s).
Implementation of Nationally Determined Contributions: Republic of Marshall Islands

                            Environmental Research of the
                            Federal Ministry for the
                            Environment, Nature Conservation,
                            Building and Nuclear Safety

                            Project number: FKZ 3716 4111 80

                            Report number: [entered by the UBA library]

                            Implementation of Nationally Determined Contri-
                            butions:

                            Republic of Marshall Islands
                            Country Report

                            by

                            Wuppertal Institute for Climate, Environment and Energy
                            Döppersberg 19, 42103 Wuppertal

                            Authors: Florian Mersmann

                            In cooperation with:

                            NewClimate Institute
                            Am Hof 20–26, 50667 Cologne

                            International data and graphs: Hanna Fekete, Lisa Luna

                            and

                            Dr. Herbert Wade

                            90/40 Bangkapi Condo 'D'
                            Soi 121 Lad Phrao Road

                            Bangkok 10240 THAILAND

                            Country specific support and review

                            On behalf of the German Environment Agency

                            Completion date: January 2018
                                                                                      3
Implementation of Nationally Determined Contributions: Republic of Marshall Islands
Introduction to the project
This country report is part of the “Implementation of Nationally Determined Contributions” (NDCs) project
(FKZ 3716 4111 80), which considers NDC implementation in 10 countries: Colombia, Ethiopia, Georgia, In-
donesia, Iran, Kenya, Marshall Islands, Morocco, Peru, and Viet Nam. This project places a special emphasis
on identifying potential barriers to NDC implementation and mitigation potentials which could go beyond
the current NDCs.
The country reports analyze the NDCs in terms of their robustness and coherence with other national or
sectoral plans and targets, and put them into the context of additional mitigation potentials and other na-
tional circumstances. For countries where coal plays a critical role in consumption or national production,
the analysis covers further details on this sector, including the economic relevance and local impacts of coal
production or consumption. The content is based on available literature from research and public sector
information on policies and institutions.
To be able to analyze the content in more detail, the authors focus the research on a number of relevant
fields of action. The fields of action were selected based on historic and projected sectoral emissions devel-
opment, comprehensive literature on GHG mitigation potentials, identified barriers and emissions reductions
as well as feasibility, costs, and co-benefits.
The project was suggested and is financed by the Federal Ministry for the Environment, Nature Conservation,
Building and Nuclear Safety, supervised by the German Environment Agency and carried out by independent
think tanks - NewClimate Institute and Wuppertal Institute. The country reports are a continuation of similar
previous efforts (project numbers 3713 41 102, 3711 41 120, 360 16 022, 364 01 003 and 363 01 128) and
aim to inform policy makers and the interested public about the implementation of NDCs in individual coun-
tries. The choice of countries is based on developing countries with which Germany works closely on climate
change topics.
The country reports are scientific in nature, and all suggestions are derived by the authors from careful anal-
ysis, having in mind the individual backgrounds of countries. They aim to increase knowledge about imple-
mentation of mitigation potentials to meet the globally agreed goal of staying within a temperature increase
of 1.5°C or well below 2°C above preindustrial levels, without intending to prescribe specific policies.
4Implementation of Nationally Determined Contributions: Republic of Marshall Islands
Overview
Overview........................................................................................................................................................... 5
List of figures .................................................................................................................................................... 6
List of tables...................................................................................................................................................... 7
List of abbreviations ......................................................................................................................................... 8
1 Part I: Summary .................................................................................................................................... 10
1.1 Country background ............................................................................................................. 10
1.2 Emissions and energy use ..................................................................................................... 11
1.3 NDC and ongoing activities ................................................................................................... 12
1.4 Mitigation potential and barriers ......................................................................................... 12
2 Part II: Full country analysis .................................................................................................................. 15
2.1 Country background ............................................................................................................. 15
2.2 Institutional set up ................................................................................................................ 20
2.3 MRV of GHG emissions ......................................................................................................... 23
2.4 Description and evaluation of the (I)NDC ............................................................................. 23
2.5 Climate change mitigation policies and strategies ............................................................... 25
2.5.1 National Strategic Plan 2015-2017 (NSP) and Vision 2018 .............................................. 25
2.5.2 National Climate Change Policy Framework (NCCPF) ...................................................... 25
2.5.3 Joint National Action Plan (JNAP)..................................................................................... 26
2.5.4 Majuro Declaration (non-binding) ................................................................................... 26
2.6 Additional mitigation potential............................................................................................. 27
2.6.1 Selection of proposed fields of action.............................................................................. 28
2.6.2 Field of action I: Transport: Low-carbon domestic shipping ............................................ 29
2.6.2.1 Barriers to implementation of low-carbon domestic shipping 30
2.6.2.2 Ongoing activities 30
2.6.3 Field of action II: Waste reduction, disposal and processing ........................................... 31
2.6.3.1 Barriers to implementation of field of action II 32
2.6.3.2 Ongoing activities 32
2.7 Conclusions ........................................................................................................................... 33
References ...................................................................................................................................................... 35
5Implementation of Nationally Determined Contributions: Republic of Marshall Islands
List of figures
Figure 1: Marshall Islands’ emissions profile ..................................................... 11
Figure 2: RMI's primary energy supply profile, 2011......................................... 11
Figure 3: RMI baseline projection and NDC targets .......................................... 12
Figure 4: Selection process for proposed fields of action in RMI ...................... 13
Figure 5: Map of the Republic of Marshall Islands ........................................... 15
Figure 6: Marshall Islands’ emissions profile ..................................................... 17
Figure 7: Emissions and energy use intensity over time ................................... 19
Figure 8: RMI's primary energy supply profile, 2011......................................... 20
Figure 9: Institutional set up for climate action in RMI ..................................... 22
Figure 10: RMI baseline projection and NDC targets .......................................... 24
Figure 11: Selection process for proposed fields of action in RMI ...................... 28
6Implementation of Nationally Determined Contributions: Republic of Marshall Islands
List of tables
Table 1: Key socio-economic figures ................................................................ 16
Table 2: 2014 emissions data from PRIMAP .................................................... 18
Table 3: 2010 emissions data from UNFCCC .................................................... 18
Table 4: Key emissions, energy and environmental data................................. 19
7Implementation of Nationally Determined Contributions: Republic of Marshall Islands
List of abbreviations
ADB Asian Development Bank
AOSIS Alliance of Small Island States
BAU Business as Usual
CDM Clean Development Mechanism
EPA Environmental Protection Agency
EPPSO Economic Policy, Planning and Statistics Office
GDP Gross Domestic Product
GHG Greenhouse gas
GIZ Gesellschaft für Internationale Zusammenarbeit
HDI Human Development Index
IKI International Climate Initiative of the German Federal Ministry for the Environment,
Nature Conservation, Building and Nuclear Safety (BMUB)
INDC Intended Nationally Determined Contribution
IPCC Intergovernmental Panel on Climate Change
JNAP Joint National Action Plan
MoF Ministry of Finance
MoFA Ministry of Foreign Affairs
MRV Monitoring, Reporting, and Verification System
MtCO2e Megatonnes carbon dioxide equivalent
NAMA Nationally Appropriate Mitigation Actions
NCCC National Climate Change Committe
NCCPF National Climate Change Policy Framework
NDC Nationally Determined Contribution
NREL National Renewable Energy Laboratory
NSP National Strategic Plan
OCS Office of the Chief Secretary
OEPPC Office of Environmental Planning and Policy Coordination
OTEC Ocean Thermal Energy Conversion
RMI Republic of Marshall Islands
SPC Secretariat of the Pacific Community
SPREP Secretariat of the Pacific Regional Environment Programme
UNFCCC United Nations Framework Convention on Climate Change
US, USA United States of America
WTE Waste-to-Energy
8Implementation of Nationally Determined Contributions: Republic of Marshall Islands
9Implementation of Nationally Determined Contributions: Republic of Marshall Islands
1 Part I: Summary
1.1 Country background
The Republic of Marshall Islands (RMI) is a small island state. It is home to a population of about
53,000 people, mostly in the two large cities of Majuro (its capital) and Ebeye, which is home to a large
US military base. Due to its very low elevation the country is highly vulnerable to the effects of cli-
mate change, in particular sea level rise.
The country has almost no domestic resources, and therefore has to import almost everything. Its
remote location makes this costly. Domestic production includes goods from fisheries, coconut oil, and
handicrafts.
RMI's political system is a mixed parliamentary-presidential system. Current president Hilda Heine
came into office in January 2016, after the former president Casten Nemra lost a vote of confidence
only two weeks into his presidential term. Legislation lies
with the Nitijela, a unicameral parliament advised by a council
Climate change strategy
of twelve high chiefs. The Nitijela itself has 33 members (one
for each municipality) elected every four years. Energy strategy aligned
with CC/GG strategy
Climate change is one of the most prominent policy areas in
RMI, not least due to the country's high vulnerability. This is Institutional coordination
on climate change
reflected in the country's legislation that integrates climate
change topics in most if not all high-level strategies and poli- Renewable energy targets
cies, including the National Strategic Plan, the country's over- Level of NDC ambition n.a.
arching development strategy. Climate policy is coordinated (CAT rating)
through the Office of Environmental Planning and Policy Coor-
dination (OEPPC), which advises the Marshallese government
on environmental planning, and also houses the National Climate Change Committee, a body com-
prised of representatives of nearly all national ministries.
10Implementation of Nationally Determined Contributions: Republic of Marshall Islands
1.2 Emissions and energy use
Figure 1: Marshall Islands’ emissions profile
Data sources: Gütschow et al. (2016); UNFCCC (2016)
Figure 2: RMI's primary energy supply profile, 2011
Data sources: IEA (2016a, 2016b); RMI (2016)
RMI's emissions have more than doubled since 1990, but are still at an extremely low level at less than
120 ktCO2e/a, and even in terms of per-capita emissions (2.25 tCO2e/cap) are well below industrial-
ised country levels. RMI expects that under a business-as-usual scenario emissions could rise by up to
77.5% between 2000 and 2025 (RMI 2015a).
By far the largest share of emissions stems from the energy sector, to the largest extent from electric-
ity generation (54% of total emissions), as RMI currently relies strongly on diesel generators. Petro-
leum products constitute 92% of RMI's primary energy mix. Until 2020 RMI plans to increase the
share of renewable energy from 3.5% (2012) to 20% in 2020 (RMI 2016b). Transport and emissions
11Implementation of Nationally Determined Contributions: Republic of Marshall Islands
from cooking and lighting contribute significantly less to emissions from the energy sector. Apart from
the energy sector, only emissions generated from waste play a sizeable role in the emissions composi-
tion of the country (RMI 2015b). However, it should be noted that historical emission figures are not
completely certain. RMI is still in the process of developing its emissions inventory system.
1.3 NDC and ongoing activities
Figure 3: RMI baseline projection and NDC targets
Data sources: RMI (2015a, 2015b)
Through its NDC, RMI commits to a quantified economy wide target of a 32% reduction in greenhouse
gases versus 2010 levels. Furthermore, RMI set itself an indicative target of a 45% reduction versus
2010 emission levels by 2030, and intends to achieve net zero emissions by 2050.
In particular, RMI plans to reduce emissions from
► electricity generation: 55% in 2025, 66% in 2030;
► transport, including domestic shipping: 16% in 2025, 27% in 2030;
► waste: 20% by 2030 (no specification for 2025);
► cooking and lighting: 15% by 2030 (no specification for 2025).
According to the NDC, the base year had emissions of about 0.185 MtCO2e (a slightly higher value than
indicated in RMI's second National Communication of the same year), leading to an economy-wide
emissions target of 0.126 MtCO2e by 2025, and 0.101 MtCO2e by 2030. The NDC further indicates pos-
sible interventions to reach the intended reduction target.
1.4 Mitigation potential and barriers
RMI's NDC covers all emission sources in the country. Through a number of policies and strategies,
RMI is already targeting most if not all of potential reduction in the country. By far the largest source
12Implementation of Nationally Determined Contributions: Republic of Marshall Islands
of emissions, electricity generation, is a priority for the country. Plans to increase the share of renewa-
ble energy from currently still low numbers are already in place and are starting to be implemented.
The Energy Action Plan 2016-2019 introduces improved monitoring of implementation progress (RMI
2016).
This report identifies two fields of action where implementation could be strengthened: Low-carbon
domestic shipping, and waste.
Figure 4: Selection process for proposed fields of action in RMI
Source: authors
Low-carbon domestic shipping has so far not often been subject to increased mitigation actions any-
where. RMI however has explicitly included domestic shipping as a sector subject to emissions reduc-
tions. Unfortunately, there is currently still a distinct gap in the emissions inventory for this sector, so
the actual emissions of the sector could not be determined. Based on studies from neighbouring coun-
try Fiji, it can be surmised that emissions from sea transport could actually be higher than those of
land transport on an island state.
During the oil crisis in the late 1970s, a number of highly promising solutions for retrofitting existing
vessels with sails, as well as completely new designs were developed that yielded fuel savings of up to
30%. As fuel prices dropped again, these innovations were discarded because they were not economi-
cally competitive anymore.
A (re-)introduction of such designs would yield a number of additional benefits for the country, e.g.
alleviating RMI's import dependencies, or reduced environmental hazards.
An increased uptake of such options currently faces a number of barriers, not least of which a regula-
tive vacuum on the government level, but to the largest extent financial, as the development and fitting
of ships requires high upfront investments. A recently approved new project financed through Germa-
ny's International Climate Initiative (IKI) to pilot low-carbon shipping options in RMI will go a long
way in alleviating these barriers, but RMI may also consider to strengthen the political framework to
create a stronger enabling environment for low-carbon shipping options.
Another promising field of action is waste reduction and removal. RMI's second National Communi-
cation indicates that 30% of the country's emissions in 2000 were from methane and other GHGs
13Implementation of Nationally Determined Contributions: Republic of Marshall Islands
stemming from waste. The country still faces serious challenges due to non-optimal waste handling,
and a sheer lack of space for waste disposal facilities.
A possible part of the solution may be a waste-to-energy plant, but plans for such a facility have not yet
come to fruition, most likely again because investment and running costs are currently still higher than
electricity generation using diesel generators. The expanding challenges of waste disposal together
with rising oil prices may level the playing field, but the economic barrier is still high.
In the meantime, it is clear that the best way to reduce emissions from waste will be to reduce the
amount of waste overall. RMI, supported by the Secretariat of the Pacific Regional Environment Pro-
gramme, is therefore developing options for sustainable waste management. It has already laid im-
portant groundwork for waste reduction through introducing a ban on cutlery and containers for food
and beverages made from plastic and styrofoam, a step that in our view is worth every country's con-
sideration.
14Implementation of Nationally Determined Contributions: Republic of Marshall Islands
2 Part II: Full country analysis
2.1 Country background
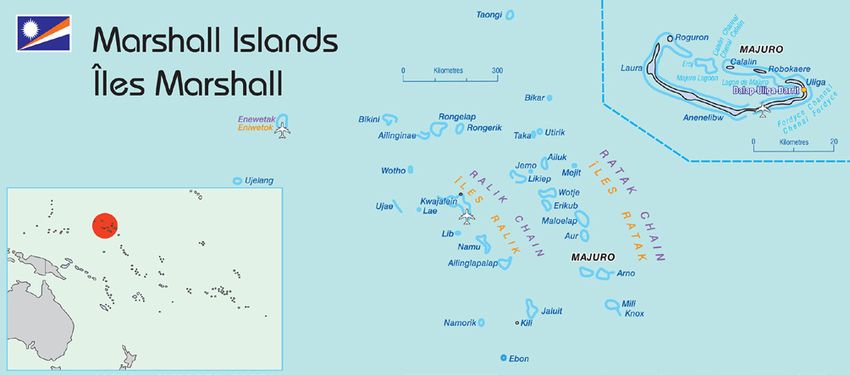
The Republic of Marshall Islands (RMI) is an archipelago of 29 atolls and 5 islands located in the Cen-
tral Northern Pacific. 22 atolls and 4 islands are inhabited. The land has very low elevation, with an
average height above sea level of not more than two metres, and is therefore especially vulnerable to
sea level rise (RMI 2015a). 1
Figure 5: Map of the Republic of Marshall Islands
Source: Secretariat of the Pacific Community, RMI member page (SPC n.d.)
According to its second National Communication in 2015 (ibid.), RMI is home to a population of 53,000
people, mainly concentrated in the two main cities of Majuro, the country's capital (27,800 inhabit-
ants), and Ebeye (11,400 inhabitants). The atolls Arno, Jlauit, and Ailinglaplap are each inhabited by
about 1,700 people. Ebeye, the second-largest city, is located on the Kwajalein atoll, which also serves
as a US military base and missile test range. The islands of Bikini and Enewetak were used as large-
scale nuclear test sites by the USA in the past (ibid.).
RMI is closely tied to the USA through a Compact of Free Association signed in 1986, which gave the
country political independence after almost 40 years under US administration. Under the Compact,
RMI citizens may emigrate to and work in the USA. There are large enclaves of Marshallese in Hawaii
and Arkansas. The USA also provides annual payments of 62.7 million USD, which form a large part of
the country's economic foundation. The financial agreement will continue until 2023, when a common
trust fund of US and RMI contributions is to be formed. RMI's GDP was about 186.3 million USD in
2012. Since independence, external grants (both through the Compact and other foreign aid) have
made up 60% on average of RMI's GDP (Chen et al. 2015).
RMI has not been mentioned in UNDP's annual Human Development Reports since 2009. In that year,
the country was ranked as having a relatively high human development value, at 0.738. However, this
1 We would like to thank our reviewer Dr Herbert Wade for insightful and constructive input to this report. Dr Wade assisted
in the development of the INDC and participated in the development of the first RMI national energy policy in 2008, and
was thus able to provide us with insights that we could not easily have obtained otherwise.
15Implementation of Nationally Determined Contributions: Republic of Marshall Islands
value was calculated using a methodology that has since been changed, so RMI's HDI is not easily com-
parable to the newer figures of other countries, but would likely still fall in the classification of high
human development, similarly to other countries in the region such as Fiji, Tonga, or Samoa.
RMI has very scarce natural resources, necessitating the import of almost everything other than basic
locally produced food (largely coconuts, taro and seafood), at mostly high prices. The largest export-
ing industrial sectors are fisheries and production and processing of copra, the dried kernel of the co-
conut, from which coconut oil is extracted. The rest of the economy largely relies on sales and services.
The government is the largest employer in the country, and the US army base on Kwajalein with its
about 1.000 mostly US citizens is the basis for most of Ebeye's urban economy. The outer islands have
an agrarian-based subsistence economy, with incomes generated mostly through smaller-scale copra
production and handicrafts (RMI 2015a).
Climate change is one of the most prominent policy areas in RMI, not least due to the country's high
vulnerability. The former foreign minister of RMI, Tony de Brum, who passed away in August 2017,
was internationally renowned for his leadership in international climate negotiations. He is commonly
seen as one of the champions of the Paris Agreement, and lead the so-called High Ambition Coalition of
progressive countries that was pivotal in securing the agreement.
Within the international climate negotiations, RMI is part of the Alliance of Small Island States (AOSIS).
Before the prominent role played by the High Ambition Coalition, RMI had not been highly visible
within the international climate negotiations.
RMI's emissions have more than doubled since 1990, but are still at an extremely low level at less than
120 ktCO2e/a, and even in terms of per-capita emissions are well below industrialised country levels
(2.25 tCO2e/cap, about 1/8 of Germany’s per capita levels). RMI expects that under a business-as-
usual scenario emissions could rise by up to 77.5% between 2000 and 2025 (RMI 2015a).
In its NDC, the country has set itself ambitious goals for greenhouse gas (GHG) reductions of 32% be-
low 2010 levels by 2025, striving for 45% below 2010 levels by 2030 - despite their very low total
GHG emissions. The country's National Energy Policy outlines an integrated strategy for RMI's energy
sector, including a 20% energy efficiency improvement in transport sector fuel use, and a 20% share of
renewable energy in power generation by 2020 (RMI 2015b), which would be a sizeable increase from
single digit levels in past years (Chen et al. 2015).
Table 1: Key socio-economic figures
Indicator Marshall Is- % change World Germany Year
lands since 1990
Population [million] 0.053 12 7261 81 2014
GDP [2017 billion USD] 0.183 133 78630 3,879 2014
GDP/Cap [2017 USD/cap] 3462 109 10829 47903 2014
HDI [0 – 1] 0.738 0.702 0.92
n.a. 2014
(2009) (2014)
Electrification rate [%] 89 (2013) 81 85 100 2012
GINI index [0 – 100] n.a. n.a. n.a. 30.1 2014
Corruption index [1 – 6] n.a. n.a. 2.9 2014
Urbanization [% of total] 72 7 53 75 2014
Data sources: ND-GAIN (2017); UNDP (2015); United Nations (2014); World Bank (2017), GDP per capita calculated
based on World Bank (2017)
16Implementation of Nationally Determined Contributions: Republic of Marshall Islands
Figure 6: Marshall Islands’ emissions profile
Data sources: Gütschow et al. (2016); UNFCCC (2016)
17Implementation of Nationally Determined Contributions: Republic of Marshall Islands
Table 2: 2014 emissions data from PRIMAP
Sector Value Unit Share in 2014
Total (excluding LULUCF) 119 ktCO2e 100%
Total energy 110 ktCO2e 93.3%
Industry n.a. ktCO2e
Solvents 0.09 ktCO2e 0.1%
Agriculture n.a. ktCO2e
Waste 7.88 ktCO2e 6.6
Other n.a. ktCO2e
Data sources: PRIMAP database (Gütschow et al. 2016)
Table 3: 2010 emissions data from UNFCCC
Sector Value Unit
Total (excluding LULUCF) 170 ktCO2e
Total energy 134 ktCO2e
Industry n.a. ktCO2e
Solvents n.a ktCO2e
Agriculture n.a. ktCO2e
Waste 36 ktCO2e
Other n.a. ktCO2e
Data sources: RMI (2015a)
PRIMAP data was only available for the period 1990-2014. Emissions according to this source were
lower than those on the National Communication throughout the overlap between 2000 and 2014.
However, PRIMAP data is not completely accurate at this low resolution, representing an average of
regional data rather than "real" emissions of the country. 2 The data provided by PRIMAP was included
here for comparative purposes.
2 It should be noted that PRIMAP data in its newest iteration (1.2. now will include national emissions data of RMI, which
closes the apparent gap between datasets. however, this project uses the current PRIMAP 1.1. database for all country
analyses, as 1.2 is not yet publicly available.
18Implementation of Nationally Determined Contributions: Republic of Marshall Islands
Figure 7: Emissions and energy use intensity over time
Emissions and energy use indicators
1.4
1.2
Indexed to last available year
1.0
0.8
0.6
0.4
Per capita emissions
0.2 Emissions intensity of the economy
1990 1995 2000 2005 2010 2015
Energy intensity is calculated as total primary energy supply/GDP, emissions intensity is calculated as emissions/GDP.
Data sources: Gütschow et al. (2016); IEA (2016b); ND-GAIN (2017); World Bank (2017)
Table 4: Key emissions, energy and environmental data
Indicator RMI % change World Germany Year
since 1990
GHG/cap [tCO2e/cap] 2.25 +51% 6.42 10.76 2014
GHG/GDP [tCO2e/mln 2017 USD] 650 -3% 592.6 224.5 2014
Energy/GDP [ktoe/mln 2017 n.a. n.a. 0.174 0.08 2014
USD]
Global share of emissions [%] 0.00001 0% 100% 1.8 2012
Air pollution index (P2.5) 9 -10% 42 14 2014
Vulnerability index [0 – 1] n.a. n.a. n.a. 0.23 2014
Data sources: Gütschow et al. (2016); IEA (2016b); ND-GAIN (2017); World Bank (2017)
19Implementation of Nationally Determined Contributions: Republic of Marshall Islands
Figure 8: RMI's primary energy supply profile, 2011
Data sources: RMI (2016)
2.2 Institutional set up
RMI's political system is a mixed parliamentary-presidential system. Current president Hilda Heine
came into office in January 2016, after the former president Casten Nemra lost a vote of confidence
only two weeks into his presidential term.
Legislation lies with the Nitijela, a unicameral parliament advised by a council of twelve high chiefs.
The Nitijela itself has 33 members (one for each municipality) elected every four years. While mem-
bers of the Nitijela are officially nonpartisan, most elected members belong to one of the four political
parties currently active in the country.
The judicial branch in RMI consists of a Supreme Court, a High Court, district and community courts,
and a traditional rights court that handles disputes from customary law and traditional practice.
For climate change governance, roles and responsibilities are spread across a number of different gov-
ernmental entities with different roles and responsibilities. Figure 9 below provides an overview of
the general institutional set up for climate action within the Republic of Marshall Islands.
The Office of Environmental Planning and Policy Coordination (OEPPC) acts as advisory body in
matters of environmental planning and policies, including on climate change, to the Office of the Presi-
dent, the RMI Cabinet, the Ministries and other government agencies. It is the focal point for coordinat-
ing, managing and implementing international environment projects and programmes with various
implementing agencies, and also leads negotiations with external partners and financing organisa-
tions. The OEPPC is also involved in strategy development both for mitigation and adaptation. It sup-
ports the Ministry of Foreign Affairs in international climate negotiations, and acts as the Secretariat to
the National Climate Change Committee domestically.
The National Climate Change Committee (NCCC) oversees the progress of RMI's Joint National Ac-
tion Plan (JNAP), and coordinates the integration of new climate change initiatives into the priorities
set by the JNAP. The NCCC is comprised of Secretaries from almost all Ministries, with the Director of
the OEPPC holding the Vice-Chair of the NCCC. It is chaired by the Chief Secretary. The members of the
NCCC also serve as the National Disaster Committee in times of emergency.
The Office of the Chief Secretary (OCS) oversees the functioning of all ministries, and is responsible
to the President. It houses the National Disaster Committee, and the Disaster Office. OCS also serves as
the administrative home to the OEPPC and the Economic Policy, Planning and Statistics Office.
20Implementation of Nationally Determined Contributions: Republic of Marshall Islands
The Economic Policy, Planning and Statistics Office (EPPSO) is responsible for RMI's economic pol-
icy planning, and oversees the implementation of the National Strategic Plan.
The Ministry of Foreign Affairs (MoFA) represents RMI in the international climate negotiations,
supported through OEPPC. Most bilateral grants are negotiated by MoFA.
The Ministry of Finance (MoF) is responsible for multilateral finance, as well as bilateral finance of
the European Union. However, the MoF does not currently have special staff for climate change topics.
Other important ministries in the climate change context include the Ministry of Resources and De-
velopment (MRD), and the Ministry of Public Works (MPW) (RMI 2015a).
According to SPC 2014, RMI's institutional setup faces challenges in coordinating climate change activ-
ities across different institutions, and in fostering information exchange and knowledge management
between governmental entities. Furthermore the report sees large opportunities for strengthening
RMI's approach to climate change mitigation by fostering cross-sectoral programmes, as current activ-
ities often focus on single sectors, thus foregoing possibilities for synergies in different actions.
21Implementation of Nationally Determined Contributions: Republic of Marshall Islands
Figure 9: Institutional set up for climate action in RMI
Source: authors
22Implementation of Nationally Determined Contributions: Republic of Marshall Islands
2.3 MRV of GHG emissions
RMI submitted its second National Communication in 2015. No Biennial Update Report has been sub-
mitted at the time of writing.
The National Greenhouse Gas Inventory included in the second National Communication reports GHG
emissions for the year 2000, and provides estimates for the years 2005 and 2010 for comparison pur-
poses.
The inventory was prepared using the 1996 IPCC guidelines. Data used was compiled by the Office for
Environmental Planning and Policy Coordination, from the National and Regional Energy Database, the
RMI statistics office, available data from ministries and government departments, as well as private
companies. Calculations were made using the IPCC Tier 1 approach. Because no national conversion
and emission factors were available, IPCC default values were used (RMI 2015a).
As the National Communication admits, there are significant data gaps in the inventory. Fuel import
and consumption data is inconsistent and was in some cases not provided by private companies due to
confidentiality reasons (ibid.). The country's emissions inventory system is continuing to develop.
2.4 Description and evaluation of the (I)NDC
RMI communicated its INDC to the UNFCCC in July 2015. The INDC has been resubmitted as an NDC in
April 2016. The country commits to a quantified economy wide target of a 32% reduction in green-
house gases versus 2010 levels. Furthermore, RMI set itself an indicative target of a 45% reduction
versus 2010 emission levels by 2030, and intends to achieve net zero emissions by 2050. While the
targets are not explicitly marked as conditional, the NDC does mention that, while the NDC is consid-
ered a "full national commitment", their achievement will only be possible through continued interna-
tional support. As previously mentioned the country is currently strongly reliant on external budget
support in order to maintain its economy. The intended GHG reductions can therefore be seen as con-
ditional on international support.
According to the NDC, all national emissions are covered. The NDC applies to the waste and energy
sectors; the energy sector is specified as covering electricity generation, transport (land and shipping),
and other (cooking and lighting). According to the document, emissions from all other sectors are neg-
ligible. As reference points, the NDC specifies the sectoral mix of emissions as 54% electricity genera-
tion, 12% land and sea transport, 23% waste, and 11% other (i.e. cooking and lighting) in 2010.
RMI plans to reduce emissions from
► electricity generation: 55% in 2025, 66% in 2030;
► transport, including domestic shipping: 16% in 2025, 27% in 2030;
► waste: 20% by 2030 (no specification for 2025);
► cooking and lighting: 15% by 2030 (no specification for 2025).
According to the NDC, the base year had emissions of about 0.185 MtCO2e. Therefore, the economy-
wide emissions target for 2025 would be 0.126 MtCO2e, and 0.101 MtCO2e by 2030. It is unclear where
the base year emissions level is taken from, as RMI's Second National Communication which was pub-
lished in the same year as the NDC provides a lower figure, 0.169 MtCO2e.
It should be noted that, since these figures are all extremely low, error margins which would not be
significant in countries with higher emissions will appear much more significant here. Still, given that
RMI does not specify an absolute figure for the intended reduction, a potentially inflated baseline fig-
ure does have implications for the targeted reductions. Applying the emissions levels provided by
RMI's National Communication would lead to 0.115 MtCO2e in 2025, and 0.093 MtCO2e in 2030. The
23Implementation of Nationally Determined Contributions: Republic of Marshall Islands
PRIMAP figure for 2010 is already lower than the reduction implied through the provided baseline in
the NDC, but is likely not accurate in this particular case.
The graph below was generated using a data from the National Communication for the reference sce-
nario between 2000 and 2026, and the 2010 emission reference provided in the NDC, as a basis for the
emission reduction points for 2025 and 2030.
Figure 10: RMI baseline projection and NDC targets
Data sources: RMI (2015a, 2015b)
The baseline scenario as communicated by the second National Communication supposes an emis-
sions increase of 77.5% between 2000 and 2025, which may be not completely realistic given the
moderate increase of emissions in the previous years. On the other hand, due to the very low emission
count of the country, even singular infrastructure changes such as a new governmental or factory
building may have strong effects on energy demand, and may cause a significant increase in emissions
if that demand is met with fossil fuels.
Note that the data points in the years 2000, 2005, and 2010 represent historic data taken from the Na-
tional Communication, while the timeline in between represents our own interpolation. Starting from
2011, the data points represent a projection of data by RMI. Since RMI uses a base year for the calcula-
tion of its NDC target, the baseline projection contained in its National Communication does not have a
bearing on the target formulated in the country's NDC.
Again, we want to stress the point that in absolute terms RMI's emissions are extremely low, repre-
senting an almost invisible fraction of the global total. Even though the absolute emission figures may
show some inconsistencies, RMI's commitment to reducing its GHG output by a good margin shows the
seriousness of the country in combating climate change. It goes far beyond what would be expected
from a least developed small island state in its ambition and specificity.
The NDC as a whole is a prime example for a clear and easy-to-understand strategy document. While
short, it provides a wealth of information, and makes reference to other documents if necessary. The
24Implementation of Nationally Determined Contributions: Republic of Marshall Islands
planned actions are clear-cut and logical. They appear to be well-integrated into the country's strategic
framework, and, according to the NDC itself, have been developed in an inclusive stakeholder process
that included "the country's first National Climate Change Dialogue and three rounds of stakeholder
consultations" (RMI 2015b).
2.5 Climate change mitigation policies and strategies
RMI has a number of overarching strategies (cf. RMI 2015a) that are aimed at mainstreaming climate
change aspects into all aspects of policy making. As a low-lying island state, RMI is mostly concerned
with adaptation strategy and disaster risk management. However, GHG reduction plays an increasingly
prominent role, and is reflected in the country's development strategies. In the following, we outline
the country's two most important strategies, as well as the non-binding Majuro Declaration of the Pa-
cific Islands Forum because of its importance for both international climate policy and national low-
carbon development.
2.5.1 National Strategic Plan 2015-2017 (NSP) and Vision 2018
The National Strategic Plan forms the foundation of RMI's development planning. Based on the coun-
try's Vision 2018 strategy endorsed in 2001, it expresses the objective to ensure:
"Sustainable, Equitable and Measurable Development Reflecting the Priorities and Culture of the Mar-
shallese People" (RMI 2014).”
The NSP outlines an overarching development strategy encompassing social development, human re-
source capacity development, infrastructure development, sustainable economic development, good
governance as well as environment, climate change and resiliency.
The latter focuses on vulnerability assessment and disaster risk reduction, disaster management and
response, and conservation resource management. These three strategic areas are used to coordinate
different aspects of RMI's response and resiliency to climate change, which are identified as two of the
most important challenges the country faces. The NSP highlights the specific policies and strategies
RMI has developed to deal with climate change, in particular the National Climate Change Policy
Framework adopted in 2011 (see below).
The NSP is mainly concerned with questions of adaptation, resilience and disaster risk reduction/man-
agement, and less so with mitigation objectives. This reflects the country's priorities as a vulnerable
island nation with low current GHG emissions.
2.5.2 National Climate Change Policy Framework (NCCPF)
The National Climate Change Policy Framework (NCCPF), adopted in 2011, formulates RMI's overarch-
ing approach to climate change. Through it, RMI commits itself to "achieving a low-carbon future"
(RMI NCCPF 2011), and to "implement measures to build resilience, reduce disaster risk, and support
renewable energy and energy efficiency" (ibid.).
The NCCPF formulates five strategic goals for the integration of climate change into governmental poli-
cies:
1. Strengthen the enabling environment for climate change adaptation and mitigation, including
sustainable financing
2. Adaptation and reducing risks for a climate resilient future
3. Energy security and low-carbon future
4. Disaster Preparedness, response and recovery
5. Building education and awareness, community mobilization, whilst being mindful of culture,
gender and youth (ibid.)
25Implementation of Nationally Determined Contributions: Republic of Marshall Islands
Each of the five strategic goals is underpinned by specific objectives and outcomes for the achievement
of both the specific goals and the overarching vision expressed through its Vision 2018 strategy. As an
example, the third goal, concerned with low-carbon development of energy, is to be pursued through
the National Energy Policy 2009, which was updated in 2016. The objective under this goal is the im-
provement of the Marshallese people's quality of life through the provision of "clean, reliable, afforda-
ble, accessible, environmentally appropriate and sustainable energy services" (ibid.); the outcomes in-
clude an effective implementation of the Energy Policy's targets, and support through international
financing for emission reduction, technology transfer and capacity development.
The NCCPF puts in place a National Climate Change Committee as an oversight body to ensure that
these goals are met, and to develop a Climate Change and Disaster Risk Management National Action
Plan (Joint National Action Plan, or JNAP).
2.5.3 Joint National Action Plan (JNAP)
The JNAP builds upon RMI's Disaster Risk Management National Action Plan, incorporating that plan's
approach to disaster risk management in the country and the NCCPF's approach to climate change for
an integrated risk management approach (RMI 2015a).
2.5.4 Majuro Declaration (non-binding)
At the 44th Pacific Islands Forum in Majuro in 2013, 15 Pacific island states endorsed the Majuro Dec-
laration, a call to action on climate change and an expression of political will to lead on climate change
issues nationally and internationally (Pacific Islands Forum 2013). Through the Majuro Declaration,
Pacific island state signees committed to strengthen their approaches to climate protection, and to
transition to renewable, clean and sustainable energy sources. Signatory states submitted their cur-
rent approaches to GHG reduction with a view to strengthen and resubmit them in a scaling-up effort,
similarly to what has now been adopted as the Global Stocktake process under the Paris Agreement.
26Implementation of Nationally Determined Contributions: Republic of Marshall Islands
2.6 Additional mitigation potential
RMI committed to a number of concrete mitigation goals in its 2009 National Energy Policy, the
NCCPF, and the JNAP, and explicitly stated them in the Majuro Declaration, as quoted below:
► A 40% reduction in CO2 emissions below 2009 levels by 2020;
► Electrification of 100% of urban households and 95% of rural atoll households by 2015;
► Improved efficiency of energy use in 50% of households and businesses, and 75% of govern-
ment buildings by 2020;
► A 20% improvement in transportation sector fuel use by 2020;
► Feasibility studies and internationally supported financing plans for innovative 'game-chang-
ing' renewable energy and sustainable development opportunities including Majuro atoll
waste-to-energy and Kwajalein/Ebeye atoll OTEC (Ocean Thermal Energy Conversion) plants
undertaken by 2015 (Pacific Islands Forum 2013).
According to IRENA's renewables readiness assessment for RMI (Chen et al. 2015), the electrification
goal has been almost completely achieved. However, almost all electricity generated is derived from
diesel generators, many of them outdated and highly inefficient. Apart from the larger grids in Majuro
and Ebeye with a combined load of 8.8MW, there are a number of small local grids on other islands, as
well as off-grid diesel generators. Especially the generators in the larger grids are heavily derated, but
cannot easily be taken down because there is little extra capacity to prevent blackouts. The Marshalls
Energy Company (MEC), one of the two semi-autonomous energy providers, generated 6% of its pro-
vided on-grid electricity from solar installations in 2013. On the outer islands, residents already
mostly rely on off-grid solar installations from various electrification projects since 2006. Electricity
generation through renewable energy remains a high priority for the RMI government. To this effect,
the NCCPF sets a goal to increase the share of renewable energy from about 3.5% in 2012 to 20% in
2020. (RMI 2016).
Energy efficiency measures have been introduced in the form of appliance ratings and labelling, as well
as favourable duty rates for energy-efficient appliances, but, according to the updated Energy Policy
only had limited success (ibid.). The Ministry of Finance has proposed an innovative scheme under
which government departments could keep the savings earned from decreased cost for energy in or-
der to incentivise energy efficiency improvements, but the scheme has not yet been put in place (ibid.)
In the transport sector, an uptake of energy efficiency or fuel switching has been very slow, according
to the Energy Policy, not least due to the lack of a dedicated regulatory body or other types of enforce-
ment of testing and maintenance processes for cars and vessels (ibid.).
Other innovative project developments for renewable energy are sparse. According to the analysis,
there is currently one copra mill that provides a 50/50 coconut oil/diesel mix at a lower price than
regular diesel, but otherwise progress has been slow (ibid.).
The Energy Action Plan 2016-2019 takes up the activities outlined in the previous plan that have not
yet been implemented, and adds a monitoring plan to evaluate progress towards its goals (ibid.).
A major step will be the development of an improved data collection system for energy statistics. Ac-
cording to the monitoring plan (ibid.), this should already have taken place, but no information could
be obtained in this as of the writing of this report. Without this data, it is impossible to determine ac-
tual mitigation successes in the country, as a quantification from existing sources is not possible.
27Implementation of Nationally Determined Contributions: Republic of Marshall Islands
2.6.1 Selection of proposed fields of action
Through its policies, strategies, and its NDC, RMI in our view covers most if not all promising avenues
for further mitigation of greenhouse gases within the country. Nevertheless, we see two promising
fields of action where implementation could be strengthened: Low-carbon domestic shipping, and
waste.
Figure 11: Selection process for proposed fields of action in RMI
Source: authors
For RMI, the screening of its NDC, its second National Communication and its various climate related
strategies did reveal that all emission-relevant sectors are covered by the country's own GHG reduc-
tion plans: energy, transport (sea and land), waste, and cooking and lighting.
Transitioning away from diesel generated electricity towards renewable energies is one of the main
pillars of RMI's energy and climate strategies, and seems to already be on its way through a number of
initiatives, even if current levels are still low. We therefore did not consider renewable energy as a
field that has considerable additional potential beyond what is already planned.
There is, however, a cross-sectoral link between energy and waste through waste-to energy technolo-
gies. Waste is a critical issue for multiple reasons. It is also strongly under-represented in terms of
emissions data, and is only represented though a long-term indicative goal in the NDC. Literature
screening reinforced our view that the waste sector may yield additional potential. Consultation with
an expert on pacific island states confirmed this selection.
Transport in island countries is different from many other, larger countries in that domestic sea
transport plays a much stronger role here. RMI's NDC does contain a sea transport goal, and further
research confirmed that it is indeed the only country in the region to have done so. However, judging
from available literature there seemed to be a distinct lack of implementation as well as basic emis-
sions data on current sea transport. Land transport, on the other hand, is well-covered. Sea transport
therefore may potentially have a stronger bearing on future emission reduction options. Again this
was confirmed by an expert.
Cooking and lighting we did not consider because additional mitigation potential beyond planned in-
terventions in this sector is possibly very low, but there is not enough data available to analyse this
28Implementation of Nationally Determined Contributions: Republic of Marshall Islands
further. Most potential for emissions reduction is most probably generated through a cross-sectoral
link with the energy sector, as electricity generation by renewable energies in conjunction with a high
rate of electrification will mean less wood and propane-fuelled cook stoves as well as a stronger up-
take with electric lighting. However, the geographic situation as a dispersed island state puts limits on
how strong this will be.
2.6.2 Field of action I: Transport: Low-carbon domestic shipping
According to RMI's Second National Communication (RMI NatCom 2015), the transport sector was the
second largest source of GHG emissions in the country, at 19%. However, this only covers land-based
transport; emissions from sea-going vessels were excluded due to unavailability of data. This leaves a
potentially large section of emissions uncovered, as it can be surmised that a large portion of transpor-
tation in a dispersed atoll and island state such as RMI will be by sea.
Because of the lack of viable fuel consumption data for most other Pacific countries, Goundar et al.
(2017) point to Fiji as a reference. The country used 67% of its fuel imports for transportation pur-
poses. 23% of the total fuel consumption were used for shipping, 27% for aviation, and 17% for vehic-
ular use (no reference year was given) (Goundar et al. 2017). Thus, it is very much possible that mari-
time transport accounts for more emissions than land-based transport in RMI.
RMI is the only Pacific island state that actually has included domestic shipping in its NDC. The country
has included a possible introduction of solar-charged electric lagoon transport as a mitigation option
in the NDC, and specifically includes domestic shipping in its sub-sectoral target of a 16% reduction by
2025 vs. its 2010 baseline in its target. However, no further specification of GHG levels for the sub-sec-
tor is provided, so it is not entirely clear how this is going to be calculated (RMI 2015b).
RMI's National Energy Policy of 2016 specifies two further activities pertaining to domestic shipping.
The Ministry of Resources and Development and the Ministry of Transport and Communications are to
develop standards or codes on fuel efficient vessels, possibly to be regulated under the Domestic Wa-
ter Craft Act. The status of this activity could not be ascertained. Furthermore, the Ministry of Internal
Affairs is to "develop programs to encourage the use of wind supplementation for intra-atoll transport
and lagoon fishing" (RMI National Energy Policy and Energy Action Plan 2016). This is to be an ongo-
ing process until 2019.
Goundar et al. (2017) point out that Pacific Island countries in general have historically had much ex-
perience with low-carbon shipping options. During the oil crisis in the 1970s a number of pioneering
projects were developed that relied on both retrofitting existing diesel-fuelled ships with sails and rig-
ging, as well as completely new designs especially for smaller freight and passenger ships. Trials of the
designs yielded fuel savings of 20-30%, depending on make (Nuttal et al 2014). After oil prices
dropped again in the mid-1980s, these projects were universally dropped because they were not eco-
nomically competitive anymore, and much of the knowledge is in danger of being lost (ibid.).
However, the continuously high oil price of the last years could render these designs competitive once
again. Given the high dependency on petroleum fuels of the region, it might be argued that a pilot
wharf designated to such designs might even represent a business case for a Marshallese maritime in-
dustry if oil prices continue to rise. 3
The introduction of low-carbon domestic shipping in RMI yields a number of important additional
benefits:
3 A further possibility for lowering emissions from the maritime transport sector is fuel blending with coconut oil,, a practice
already tested in RMI's diesel-fuelled electricity generators. However, coconut oil is a high value export product of RMI,
and according to expert review was not considered a viable option for the sector.
29Implementation of Nationally Determined Contributions: Republic of Marshall Islands
► Any relief from high fuel dependencies will strongly benefit RMI's economic situation, and can
potentially lessen the country's dependence on donor finance.
► On a more local level, low-carbon domestic shipping may alleviate environmental hazards aris-
ing from fuel leakage on ships as well as from oil drums used to store fuel in the outer islands
(Newadra and Gilbert 2002).
► For shorter distances and smaller vessels, a stronger reliance on pure sailing instead of en-
gine/sailing hybrids would get rid of emissions from these vessels altogether, and would fit
well with the cultural heritage of the Pacific islands, as Nuttal et al. (2014) point out, warning
that sailing culture is lost rapidly in the Pacific. Furthermore, sailing would allow continued
inter-island transport even in case of fuel rationing due to price hikes or shortages.
2.6.2.1 Barriers to implementation of low-carbon domestic shipping
A stronger uptake of low-carbon domestic shipping options are currently hindered by a number of dif-
ferent barriers that need to be overcome in order to realise full potential.
In terms of institutional and political barriers, there is currently a regulative vacuum, with unclear
mandates as to which agency or ministry is responsible for implementation. The National Energy Pol-
icy has defined some responsibilities, but many remain to be defined.
A key barrier for a stronger uptake is financial. International climate financing has so far concentrated
on land transport options to a large extent, omitting the special circumstances that island states face
(Nuttal el al. 2014). Sea transport options were mostly concentrated on harbour infrastructure in the
Pacific region as an ADB evaluation report found (ADB 2011). Nuttall et al. (2014) report that in many
discussions with potential donors presented options for a larger efficiency of domestic vessels were
deemed interesting, but were ultimately not funded. Multilateral climate finance tends to favour 'safe'
project options that are already tested elsewhere, which is currently not the case for low-carbon ship-
ping, as Goundar et al. (2017) lament.
On the technical side, no real barrier exists. However, while concepts and designs for efficient vessels
exist in abundance, many have not been actually built and tested, and if so, only in small numbers until
the mid-1980s with most such vessels now out of service (Nuttall et al. 2014). Therefore, existing de-
signs would need to be revisited and adapted to current technologies and local circumstances.
Goundar et al. (2017) note that the option of electrified lagoon transport mentioned in RMI's NDC is
not evaluated yet in terms of usability in RMI waters (Goundar et al. 2017).
In terms of information, RMI needs to quickly build up a reliable database for fuel use and emissions
from the domestic maritime sector. Since there is currently no sub-sectoral data at all, there is also no
baseline to track efficiency improvements and GHG reductions as they are implemented. The introduc-
tion of sound energy statistics using up-to-date data is therefore a much needed requirement for this
sector, but also for the country in general.
2.6.2.2 Ongoing activities
Very recently, a new project funded through the Germany's International Climate Initiative (IKI)
named "Low Carbon Sea Transport" has taken up the issue. In a multi-year programme, the German
Deutsche Gesellschaft fuer Internationale Zusammenarbeit (GIZ) will assist RMI to explore low-carbon
options for domestic shipping. The project will analyse emissions and economic conditions of the sec-
tor, and subsequently develop a new intra-lagoon vessel as well as retrofit an inter-island vessel. Thus,
the project addresses almost all key barriers to the introduction of low-emission shipping options in
RMI (BMUB 2017).
30You can also read