Synopsis of Research Programs that can Provide Baseline and Monitoring Information for Offshore Energy Activities in the Pacific Region: Seabird ...
←
→
Page content transcription
If your browser does not render page correctly, please read the page content below
OCS Study
                                    BOEM 2019-042

Synopsis of Research Programs that
can Provide Baseline and Monitoring
Information for Offshore Energy
Activities in the Pacific Region: Seabird
and Marine Mammal Surveys in the
Pacific Region

US Department of the Interior
Bureau of Ocean Energy Management
Pacific OCS Region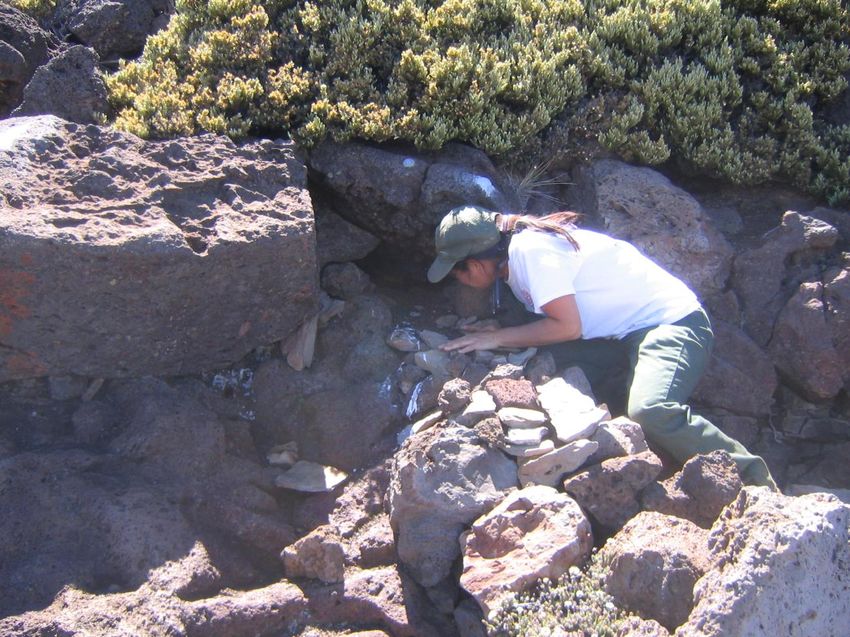
OCS Study
                                                  BOEM 2019-042

Synopsis of Research Programs that
can Provide Baseline and Monitoring
Information for Offshore Energy
Activities in the Pacific Region: Seabird
and Marine Mammal Surveys in the
Pacific Region

June 2019

Authors:
Josh Adams
Kevin D. Lafferty
Emma C. Kelsey
Cora A. Johnston

Prepared under Interagency Agreement M14PG00039
By
US Geological Survey
Western Ecological Research Center
Santa Cruz Field Station
8225 Mission Street
Santa Cruz, CA 95060

US Department of the Interior
Bureau of Ocean Energy Management
Pacific OCS Region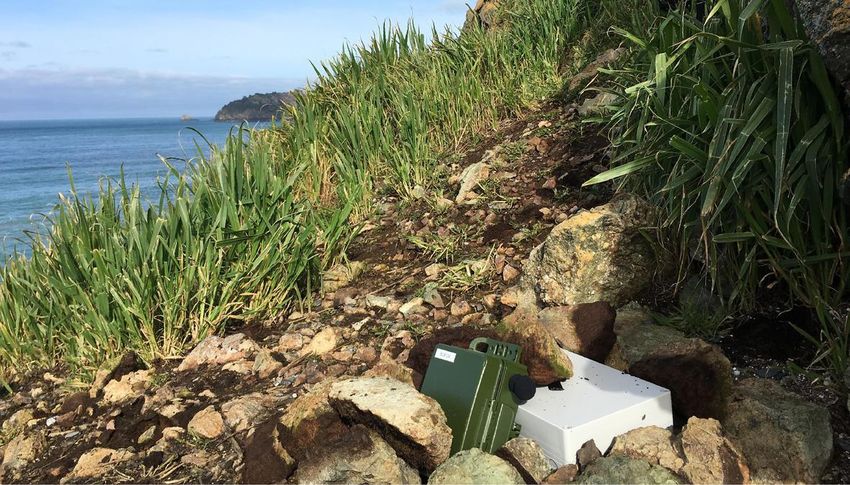
DISCLAIMER
This study was funded, in part, by the U.S. Department of the Interior, Bureau of Ocean Energy
Management (BOEM), Pacific OCS Region, Camarillo, CA, through Intra-Agency Agreement Number
M14PG00039 with the U.S. Geological Survey (USGS). This report has been technically reviewed by
BOEM, and it has been approved for publication. This product has been peer reviewed and approved for
publication consistent with USGS Fundamental Science Practices (http://pubs.usgs.gov/circ/1367/). Any
use of trade, firm, or product names is for descriptive purposes only and does not imply endorsement by
the U.S. Government.

                                  REPORT AVAILABILITY
To download a PDF file of this report, go to the U.S. Department of the Interior, Bureau of Ocean Energy
Management’s Recently Completed Environmental Studies webpage (https://www.boem.gov/Pacific-
Completed-Studies/) and click on the link for 2019-042. Data summarized in this report are available at
(https://doi.org/10.5066/F7X0669S).

                                            CITATION
Adams, J., Lafferty, K.D., Kelsey, E.C., and Johnston, C.A. 2019. Synopsis of Research Programs that
   can Provide Baseline and Monitoring Information for Offshore Energy Activities in the Pacific
   Region: Seabird and Marine Mammal Surveys in the Pacific Region. U.S. Department of the Interior,
   Bureau of Ocean Energy Management, Pacific OCS Region, Camarillo, CA. OCS Study BOEM
   2019-042. 14 Figures, 20 Tables, 54 p.

                                     ABOUT THE COVER
Cover photo: Two humpback whales viewed by ship in the Santa Barbara Channel, November 2017.
(Credit: Kevin Lafferty, USGS-WERC. Public domain.)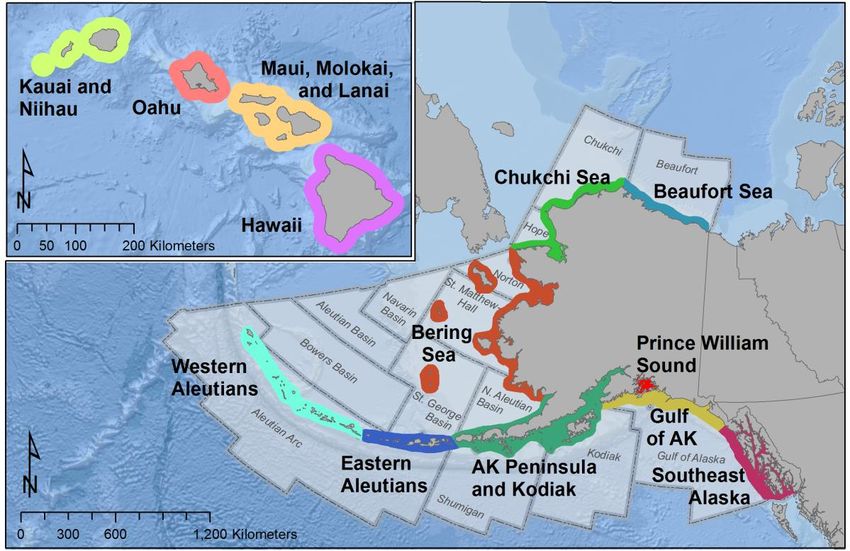
ACKNOWLEDGMENTS
This survey database effort was supported by BOEM through Intra-Agency Agreement Number
M14PG00039 with the U.S. Geological Survey. We would like to thank D. Nguyen, R. Lugo, P. Yu,
E. Sanchez-Chopitea, and J. Felis (USGS) for assistance with creating the outward looking, web-enabled
survey for seabird research and monitoring programs, and map representations. D. Schroeder (BOEM)
helped initiate the study and together with D. Pereksta (BOEM) provided constructive advice. We also
thank the regional coordinators for the Pacific Seabird Group (PSG) for assisting with survey
dissemination. S. Mallette (Virginia Aquarium and Marine Science Center Foundation) provided
guidance to parameterize marine mammal study methods and data types. Members of the PSG Seabird
Monitoring Technical Committee (R. Kaler, H. Renner) kindly provided feedback early on. Special
thanks to all the 64 people, so far, who responded to our calls and agreed to share valuable information
about their organizations and their data describing marine birds and mammals in the Pacific OCS:
A. Borker, D. Anderson, C. Bailey, L. Ballance, S. Baumann-Pickering, J. Beck, B. Becker, K. Bensen,
H. Bewley, P. Boveng, P. Capitolo, R. Carle, D. Causey, S. Codde, R. Corcoran, A. DeVogelaere,
G. Drew, R. Duerr, D. Esler, S. Euing, A. Fuller, C. Gibble, K. Goodenough, S. Hampton, M. Hanson,
J. Harvey, S. Hatch, B. Hatfield, B. Henry, J. Hildebrand, J. Isaacs, J. Jancke, D. Jaques, T. Johanos-Kam,
K. Laidre, M. Lammers, R. LeValley, K. Lindquist, D. Mazurkiewicz, H. Nevins, K. Parker, J. Parrish,
S. Pearson, J. Penniman, M. Powers, A. Raine, M. Raphael, H. Robinson, J. Roletto, T. Russell, T. Seher,
V. Seher, S. Shaffer, A. Sirovic, S. Stephenson, C. Strong, R. Suryan, W. Sydeman, L. Torres,
E. VanderWerf, M. VanZandt, J. Weddell, A. Weinstein, L. Young, and J. Zamon.
Contents
List of Figures ............................................................................................................................................. i
List of Tables ............................................................................................................................................. ii
List of Abbreviations and Acronyms ......................................................................................................... iv
Abstract ..................................................................................................................................................... 1
1 Background ................................................................................................................................................ 2
2 Introduction ................................................................................................................................................ 2
3 Methods...................................................................................................................................................... 5
3.1 Marine bird survey format and solicitation .......................................................................................... 5
3.2 Marine mammal survey format and solicitation .................................................................................. 7
4 Results ..................................................................................................................................................... 10
4.1 Marine Bird Research and Monitoring Programs .............................................................................. 10
4.1.1 California .................................................................................................................................... 21
4.1.2 Oregon and Washington ............................................................................................................ 26
4.1.3 Alaska ........................................................................................................................................ 29
4.1.4 Hawaii and the Pacific Islands ................................................................................................... 32
4.2 Marine Mammal Research and Monitoring Programs ...................................................................... 36
4.2.1 California .................................................................................................................................... 37
4.2.2 Oregon and Washington ............................................................................................................ 43
4.2.3 Alaska ........................................................................................................................................ 43
4.2.4 Hawaii and the Pacific Islands ................................................................................................... 44
5 Summary of spatial distribution of marine bird and mammal research and monitoring efforts ................ 45
6 Conclusions .............................................................................................................................................. 50
7 References ............................................................................................................................................... 52
List of Figures
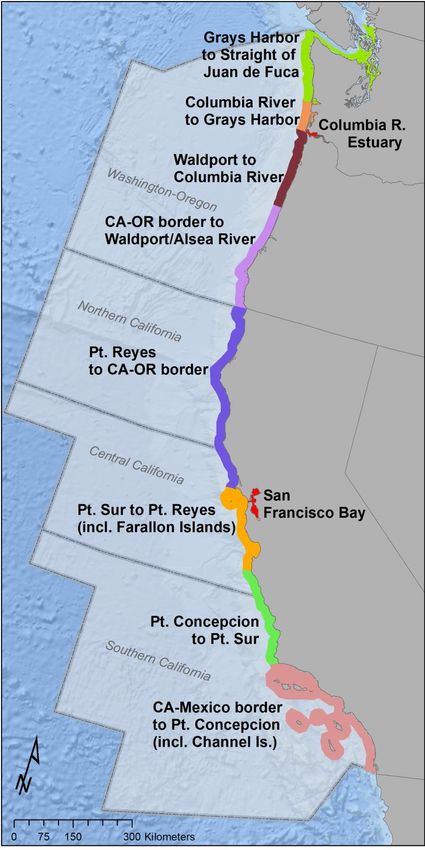
Figure 1. Western US Pacific offshore continental shelf regional areas ....................................................... 3
Figure 2. Alaskan and Hawaiian US Pacific offshore continental shelf regional areas ................................ 4
Figure 3. Screen capture image of the online data gathering survey ........................................................... 7
Figure 4. Sea otter researcher .................................................................................................................... 10
Figure 5. Horned Puffin ............................................................................................................................... 12
Figure 6. Passive, digital acoustic recording unit ........................................................................................ 22
Figure 7. University of Washington graduate student ................................................................................. 26
i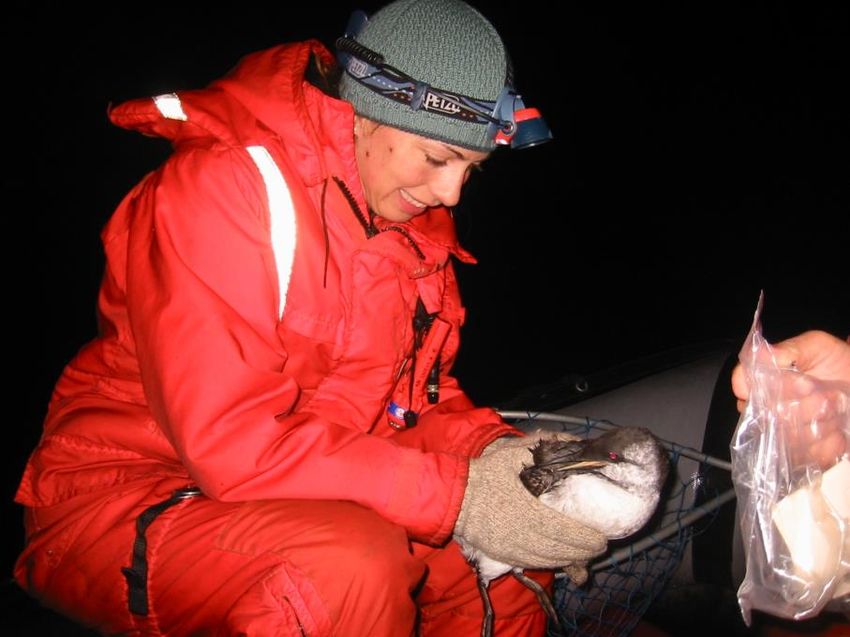
Figure 8. Monitoring Hawaiian Petrels in Haleakala National Park ............................................................ 33
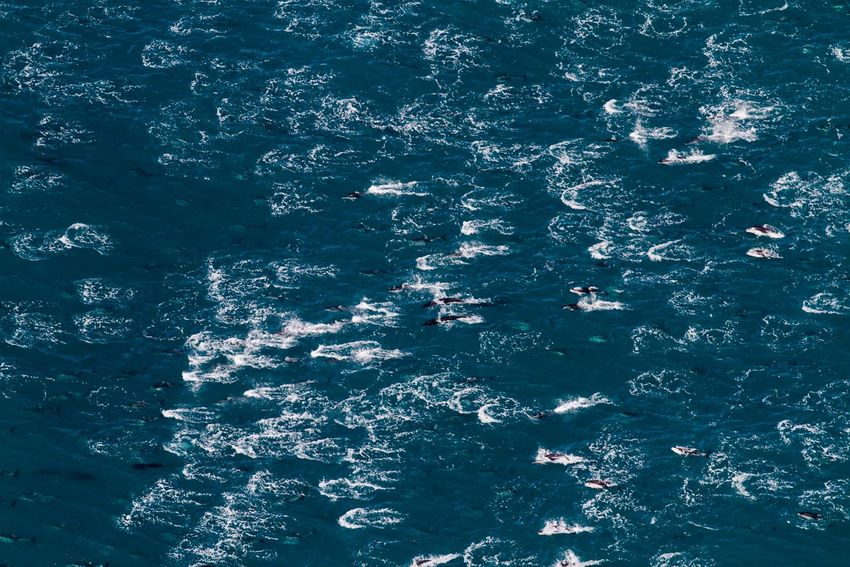
Figure 9. Mixed dolphin herd....................................................................................................................... 39
Figure 10. Summary of database records ................................................................................................... 45
Figure 11. Marine mammal (blue) and bird (red) monitoring in US states and territories of the Pacific ..... 46
Figure 12. Geographic extent of research and monitoring ......................................................................... 47
Figure 13. Geographic distribution of focal data types collected for marine mammals .............................. 48
Figure 14. Geographic distribution of focal data types collected for marine birds ...................................... 48
List of Tables
Table 1. List of parameters and their descriptions collected for describing marine bird and mammal
research and monitoring programs or efforts throughout the Pacific OCS ................................................... 8
Table 2. List of 46 specific marine birds (listed alphabetically by Family then by Common Name) identified
by survey respondents who indicated their organization collects information for research or monitoring in
California, Oregon, Washington, Alaska, Hawaii and the Pacific Islands ................................................... 11
Table 3. List of the research or monitoring parameters identified in programs associated with collecting
data about marine birds (N = 28 parameters) ............................................................................................. 13
Table 4. List of the research or monitoring parameters identified in programs associated with marine
mammal (N = 24 parameters) taxa ............................................................................................................. 17
Table 5. List of parent organizations or organization type and affiliates contributing survey information
regarding marine bird research and monitoring programs in California ..................................................... 23
Table 6. California marine bird research and monitoring parameters (data collected for each species,
listed in alphabetical order) ......................................................................................................................... 25
Table 7. List of parent organizations or organization type and affiliates contributing survey information
regarding marine bird research and monitoring programs in Oregon and Washington ............................. 27
Table 8. Oregon & Washington marine bird research and monitoring parameters (data collected for each
species, listed in alphabetical order) ........................................................................................................... 28
Table 9. List of parent organizations or organization type and affiliates contributing survey information
regarding marine bird research and monitoring programs in Alaska .......................................................... 29
Table 10. Alaska marine bird research and monitoring parameters (data collected for each species, listed
in alphabetical order) ................................................................................................................................... 30
Table 11. List of parent organizations or organization type and affiliates contributing survey information
regarding marine bird research and monitoring programs in Hawaii and the Pacific Islands ..................... 32
Table 12. Hawaii and Pacific Islands marine bird research and monitoring parameters (data collected for
each species, listed in alphabetical order) .................................................................................................. 34
Table 13. List of 25 specific marine mammals and 3 taxonomic groupings (Beaked Whales, Toothed
Whales, and All pinnipeds) identified by survey respondents who indicated their organization collects
information for research or monitoring in California, Oregon, Washington, Alaska, Hawaii and the Pacific
Islands ......................................................................................................................................................... 36
ii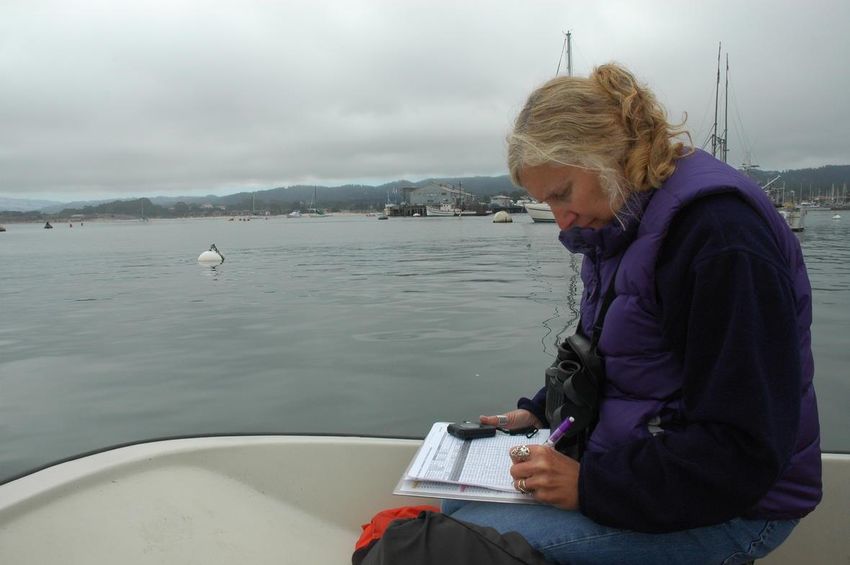
Table 14. List of parent organizations or organization type and affiliates contributing survey information
regarding marine mammal research and monitoring programs in California .............................................. 37

Table 15. Eastern North Pacific marine mammal research and monitoring parameters (data collected for
each species, listed in alphabetical order) .................................................................................................. 40

Table 16. List of parent organizations or organization type and affiliates contributing survey information
regarding marine mammal research and monitoring programs in Oregon and Washington ...................... 43

Table 17. List of parent organizations or organization type and affiliates contributing survey information
regarding marine mammal research and monitoring programs in Alaska .................................................. 44

Table 18. List of parent organizations or organization type and affiliates contributing survey information
regarding marine mammal research and monitoring programs in Hawaii and the Pacific Islands ............. 44

Table 19. Distribution of monitoring records by taxa and state ................................................................... 46

Table 20. North Pacific marine mammals ................................................................................................... 49

                                                                       iii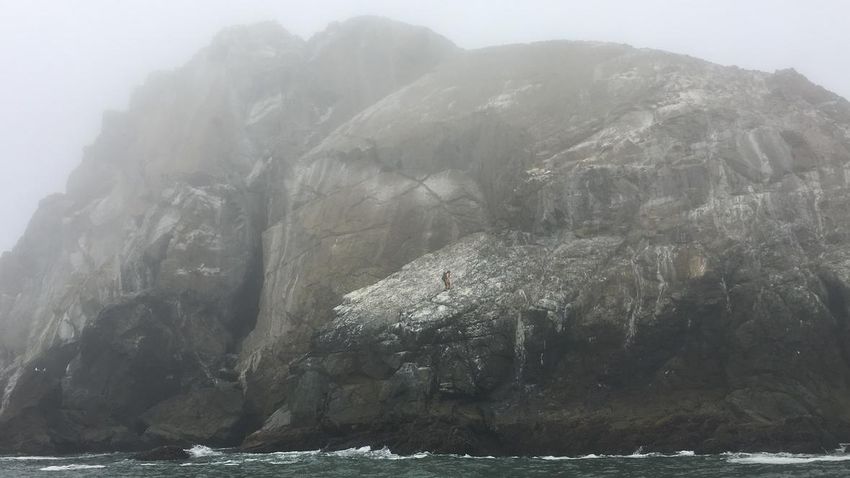
List of Abbreviations and Acronyms

AK             Alaska
AMNWR          Alaska Maritime National Wildlife Refuge
AWEA           American Wind Energy Association
BLM            Bureau of Land Management
BOEM           Bureau of Ocean Energy Management
CA             California
CCP            Comprehensive Conservation Plan
CDFW           California Department of Fish & Wildlife
DOC            Department of Commerce
DOD            Department of Defense
DOE            Department of Energy
DOI            U.S. Department of the Interior
EIS            Environmental Impact Statement
ESA            Endangered Species Act
HI             Hawaii
IMP            Inventory and Monitoring Plan
MMPA           Marine Mammal Protection Act
NGO            Non-Governmental Organization
NM             Nautical Miles
NOAA           National Oceanic and Atmospheric Administration
NPS            National Park Service
NSP            National Seabird Program
NWR            National Wildlife Refuge
OCS            Outer Continental Shelf
OR             Oregon
POCS           Pacific Outer Continental Shelf
PSG            Pacific Seabird Group
SEFI           Southeast Farallon Islands
USDA           U.S. Department of Agriculture
USFWS          U.S. Fish & Wildlife Service
USGS           U.S. Geological Survey
WDFW           Washington Department of Fish & Wildlife
WERC           Western Ecological Research Center

                                        iv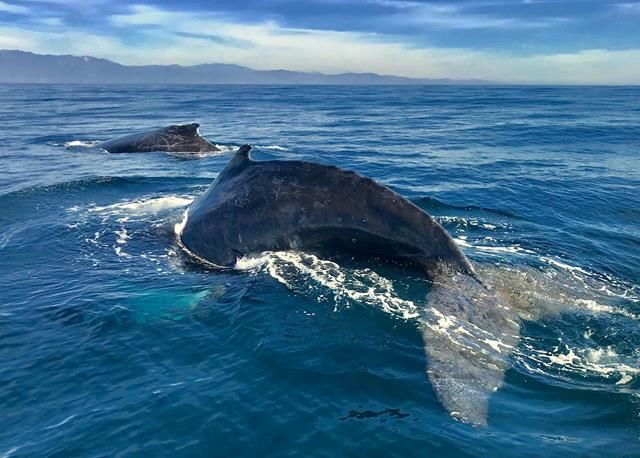
USGS WERC scientist Emma Kelsey
At False Klamath Rock, CA doing seabird monitoring research. (Credit: Jonathan Felis, USGS WERC. Public
domain.)

                                                       v
Abstract
We assembled and tabulated information about marine bird and mammal research and monitoring
programs that could provide data needed to support environmental risk assessments. This included
identifying ongoing or completed research programs that contain information on species and habitats
sensitive to offshore energy activities and that could provide baseline and monitoring data to understand
and mitigate potential impacts of offshore energy development in the Southern California Planning Area,
Washington-Oregon Planning Area, and the Hawaiian OCS of the Bureau of Ocean Energy Management
(BOEM). When available, we also included information regarding programs in Alaska, but the catalog for
Alaska is not comprehensive. We included programs that assessed the distribution, abundance, or biology
of marine birds (seabirds, waterbirds, or sea ducks) and marine mammals (cetaceans, pinnipeds, and sea
otters), some of which are protected species under the Endangered Species Act (ESA of 1973) or the
Marine Mammal Protection Act (MMPA of 1972). We canvassed data providers with spreadsheet or web-
based survey forms. The marine bird survey returned information on research and monitoring efforts for
28 parameters across 46 species from 36 entities. The marine mammal survey returned information on
research and monitoring efforts for 24 parameters across 22 marine mammal species from 22 entities. We
tabulated the parameters by species to show which parameters are most commonly measured and where
there might be information gaps. Both marine bird and marine mammal research and monitoring are
widespread throughout the Pacific, with 535 entries for marine mammals and 1,911 entries for marine
birds. Although we provide summaries of key aspects within research and monitoring programs, the
associated database can be further queried in several ways. Versioning of this database format essentially
creates a “living database” that can be updated in the future as new information becomes available.

                                                    1
1 Background
The mission of the U.S. Geological Survey (USGS) is to provide reliable scientific information to
describe and understand the Earth, minimize loss of life and property from natural disasters, manage
water, biological, energy, and mineral resources, and enhance and protect the quality of life. To this end,
the USGS collects, monitors, analyzes, and provides scientific understanding about natural resource
conditions, issues, and problems. The USGS Western Ecological Research Center (WERC) provides its
clients and partners with the research, scientific understanding, and technology needed to support
management of Pacific ecosystems.
As with all human use of the marine environment, understanding the potential impacts of offshore energy
infrastructure on the marine ecosystem is an integral part of offshore energy research (Desholm 2009,
Vaissière et al. 2014). BOEM requires both baseline and monitoring data for marine ecosystems, habitats,
and species-of-interest. Baseline data describe existing conditions and define reference points to monitor
trends among potentially impacted resources. Monitoring data are used to assess effects of industry
activities, and to determine effectiveness of mitigation measures contained within offshore energy lease
stipulations and conditions of permit approval. Several other entities have established research programs
that collect environmental data within areas of ongoing or prospective energy development. BOEM seeks
to understand if these ongoing or completed datasets can also be used to satisfy BOEM’s information
needs and thereby provide timely and cost-effective information to decision-makers regarding the
offshore and coastal environment.
2 Introduction
The USGS-WERC was requested by BOEM to create a database that describes marine bird and mammal
research and monitoring programs that exist throughout the Pacific Offshore Continental Shelf (POCS),
including California, Oregon, and Washington (Figure 1). Conventional energy infrastructure and
production in offshore waters has documented effects on marine resources through oil spills (Troisi et al.
2016), noise pollution, light pollution (Wiese et al. 2001, Black 2005), and habitat alteration (Hamer et al.
2014, Beyer et al. 2016). Furthermore, there is an increasing need for renewable energy sources within the
United States and globally. To help meet this need, the United States set a goal for 20% of the country’s
overall electricity production to come from wind-power by 2030 (DOE 2008). The production capacity of
wind energy facilities in the United States has already grown by an order of magnitude in the last 1.5
decades (4,147 MW generated in 2001 to 84,944 MW in 2017; AWEA 2017). Looking forward, offshore
wind-energy has the potential to produce a significant proportion of the power needed to reach the 20%
wind-energy goal (Musial and Ram 2010). The DOI and the States of California, Oregon, and Hawaii
have received proposals to develop commercial-scale offshore renewable energy capacity within state and
federal waters. The vulnerability of seabirds to offshore wind energy infrastructure has been addressed in
the Atlantic along the eastern seaboard (Robinson Willmott et al. 2013) and for the California Current
System off the west coast of the US (Adams et al. 2016, Kelsey et al. 2018).
California, Oregon, and Washington already are among the top-six leading wind-energy states in the
country and all three states have set goals to generate a significant portion of their states’ energy from
renewable energy sources by the 2020s (AWEA 2013). Herein, we also address Hawaii (Figure 2)
because there is industry interest in offshore wind-energy and Hawaii has set the state’s goal for 100%
renewable energy by 2045 (Hawaii State Legislature 2015). Although environmental assessments have
been initiated addressing Hawaiian marine resources (Costa and Kendall 2016) potentially affected by
offshore renewable energy development including seabirds and marine mammals, vulnerability
2Figure 1. Western U.S. Pacific offshore continental shelf regional areas
These polygon areas were defined by physical geographic breaks and used to aggregate seabird and marine
mammal research and monitoring programs in the associated database.
3Figure 2. Alaskan and Hawaiian U.S. Pacific offshore continental shelf regional areas
These polygon areas were defined by physical geographic breaks and used to aggregate seabird and marine
mammal research and monitoring programs in the associated database. Regions not shown here, but included in the
database include other inland areas, the Northwest Hawaiian Islands, Guam, and other Pacific Islands.
assessments for Hawaiian seabird species (similar to the California Current effort) are not yet complete
because they require better information supported by several efforts now underway quantifying breeding
seabird distribution in the main Hawaiian Islands (USGS, unpublished data, BOEM NSL #PC-17-03, see
also, Pyle and Pyle 2017), and ranging behaviors at sea (USGS, unpublished data, BOEM NSL #PC-13-
03). Several Hawaiian seabird species, including Endangered Hawaiian Petrels (Pterodroma
sandwichensis), are killed by terrestrially-sited wind turbines in Hawaii (J. Charrier, USFWS unpublished
data, communication 22 November 2016) and future turbine infrastructure at sea and marine cable-laying
operations pose strike, grounding, and mortality risks to free-ranging seabirds that nest in Hawaii.
Potential future renewable energy sources include power generation infrastructure and support activities
that would be located within continental shelf waters, and potentially within deeper waters off the US
Pacific coast and beyond state waters (i.e., outside three nautical miles [NM]). BOEM has received
expression of interest from industry for renewable energy projects off the coasts of California, Oregon,
and Hawaii. Several other Federal, State, academic and non-governmental organizations (NGOs) have
research programs that collect environmental data within areas of ongoing or prospective energy
development. BOEM seeks to understand if these continuing research and monitoring efforts and their
associated datasets can also be used to satisfy information needs to provide timely and cost-effective
information to decision-makers regarding the offshore and coastal environments.
The overall goal of this study was to collect and tabulate for BOEM, information about marine bird and
mammal research and monitoring programs that could provide data needed to support environmental risk
assessments, environmental impact statements (EIS), and other decision documents related to ongoing
and foreseeable offshore energy projects in the POCS. Specific objectives included (1) identifying
4ongoing or completed research programs that contain information on species and habitats sensitive to
offshore energy activities and (2) compiling a review of the capability of these programs to provide
baseline and monitoring data to understand and mitigate potential impacts of offshore energy
development in the POCS. In the POCS, there are three areas with ongoing or prospective development of
offshore energy projects: Southern California Planning Area, Washington-Oregon Planning Area, and the
Hawaiian OCS (Figure 1). Based on survey responses and programs that span several regional areas, we
also included some information from Alaska (Figure 2) monitoring programs because they include
monitoring programs that address similar marine birds and mammals as those studied in the three other
Pacific regions.
Our strategy was to tabulate and review programs that can provide baseline or monitoring data that could
be used to help inform (1) ongoing conventional energy projects within the Southern California Planning
Area, (2) prospective renewable energy projects within the Southern California Planning Area, (3)
prospective renewable energy projects within the Washington-Oregon Planning Area and, (4) prospective
renewable energy projects on the Hawaiian OCS. Research and monitoring programs of interest included
those that have one or more of the four components:
• Programs are managed by another Bureau within Department of the Interior (e.g., USGS; National Park
Service; U.S. Fish and Wildlife Service’s National Wildlife Refuges; Bureau of Land Management’s
National Monuments, etc.).
• Programs assessed the distribution, abundance, or biology of marine birds (seabirds, waterbirds, sea
ducks, or shorebirds).
• Programs assessed the distribution, abundance, or biology of protected species under the Endangered
Species Act (ESA of 1973) or the Marine Mammal Protection Act (MMPA of 1972).
• Programs collected information used to generate ecological indices that describe salient features of
sensitive or pristine habitats and ecosystems with the Planning Areas of interest.
Evaluation of tabulated research programs and datasets will assist BOEM with understanding the
strengths and weaknesses of program efforts according to the Bureau’s information needs, define the
temporal and spatial scope of research and monitoring efforts, and help identify the ecosystem
components, habitats, and species of interest pertinent to either ongoing conventional energy or
prospective renewable energy. Furthermore, a comprehensive database of research and monitoring
programs would facilitate research networking and shed light on information gaps that exist for certain
study regions, marine birds, and marine mammals.
3 Methods
3.1 Marine bird survey format and solicitation
On 26 January 2015, USGS-WERC met with the California seabird research and monitoring community
at the annual California Seabird Coordination Meeting in Davis, CA. At this meeting USGS circulated a
paper questionnaire that initiated the first voluntary collection of data describing past and current seabird
monitoring efforts. These data were used to construct an “outward facing” web survey form (Figure 3)
that could be distributed via email so that willing voluntary participants could enter a standardized set of
information describing their research and monitoring (Table 1). On 21 August 2015, the first email
request for information was sent to the California seabird research and monitoring community. The
original email provided the following information:
5Greetings folks,
You may remember at last January's meeting I proposed an effort to coordinate, collect, and
share information about on-going seabird monitoring efforts. Some of you filled out a similar
questionnaire on paper that helped us simplify this on-line survey.
Please check out the following link and spend 5 minutes or so filling in the blanks and hitting the
submit button!
http://www.werc.usgs.gov/seabirds/ (this link is no longer functional, and will redirect to USGS-
WERC)
Background: Catalog of seabird research programs in the North East Pacific
Many people monitor seabirds using regular counts or other measures. However, coordination
and sharing of mutual knowledge among seabird monitoring programs often are limited. BOEM
and USGS are partnering on a study (1) to identify ongoing or completed research programs that
contain information on seabird species, and (2) to review the capability of these programs to
provide baseline and monitoring data to understand change. The overall strategy is to
summarize the main components of each research program, identify spatial and programmatic
gaps, and to assess whether a research program could easily be enhanced to better address
information needs through additional support. Our first step is to catalog descriptions of seabird
monitoring programs and to share these with you and the seabird community, to foster greater
visibility of seabird monitoring and hopefully expand opportunities for funding and collaboration.
Here, we ask some simple questions.
If you have multiple programs (by species or region), or if this form does not accommodate your
info, please consider filing out multiple survey questionnaires.
If you have any questions, please email:
josh_adams@usgs.gov
This email initiated the first responses and was used to contribute new information to the data that we
collected in person at the first meeting in Davis. Once the remote data capture capacity was established,
we were able to troubleshoot the survey data acquisition and create appropriate response criteria for OR,
WA, AK, and HI (e.g., standardized regions, appropriate species, etc.). The request to the California
seabird research and monitoring community was made a second time on 28 December 2016 (N = 46
email addresses). On 22 September 2015, we solicited the Oregon seabird research and monitoring
community with a similar email (N = 6 email addresses) and specifically requested that members “Please
share this with other folks in Oregon”. On 24 September 2015, we solicited the Washington seabird
research and monitoring community (N = 12 email addresses) and specifically requested that members
“Please share this with other folks in Washington”. A second request was sent to the OR and WA seabird
community on 4 January 2017 (N = 15 email addresses). During June 2016, email solicitation for AK and
HI also were generated by the Pacific Seabird Group regional executive representative members who
maintain the most complete list of email contacts (Alaska: AK.RU_Rep@pacificseabirdgroup.org [Robb
Kaler] and Hawaii: SoCA.HI.LA_Rep@pacificseabirdgroup.org [Yuri Albores-Barajas]. A second
request was sent to the HI community on 5 January 2017 (N = 36 email addresses). To acquire and
complete missing seabird information for Oregon and Washington, Adams (USGS) contacted Shawn
Stephenson (USFWS) and Scott Pearson (WDFW) during August 2018.
6Figure 3. Screen capture image of the online data gathering survey
This survey was shared with seabird monitoring communities throughout the POCS. Data were captured in a secure
SQL database maintained by USGS-WERC.
3.2 Marine mammal survey format and solicitation
The marine mammal survey database was established in January 2017. Candidate species lists were
compiled from Pacific regional resources, and the geographic area, study design, and data format fields
were parameterized according to the previously established marine bird survey (Table 1). A specialist in
marine mammal research and monitoring was consulted during the parameterization of mammal-specific
database components, especially study method and data type collected. The database was formatted into a
spreadsheet populated with drop-down menus containing a fixed set of options for each component.
Initial participants were identified through literature authorship and via online keyword and agency
searches; subsequent contributors were identified by collaborators or through research facilities and
organizations. Any contributors to the marine bird database who indicated the collection of marine
mammal data were also contacted for details regarding their marine mammal monitoring. For each
identified potential contributor, data entries were initiated based on online reporting detailing research
activities. Initial entries were then emailed to the candidate contributor for verification and completion
using the following email:
[Researcher name]:
We are helping BOEM collate a list of marine mammal monitoring in the Pacific. Based on our
searches, we have identified you as a contact person for [name] marine mammal monitoring or
research program. We want to be sure that we have the correct information about your program
in our list of marine mammal monitoring programs to be shared with potential funders and
colleagues. To ensure that we have correct information about your program, please take a quick
look at how we describe your work to help us correct errors and fill in missing information
(directions appended below).
If you are not the appropriate contact person, but know who is, we’d appreciate your forwarding
our message to that contact person.
7A note on the purpose of this BOEM database:
By identifying ongoing or completed research programs that contain information on marine
mammal species, this monitoring list will help determine the capability of these programs to
provide baseline and monitoring data to understand change while fostering greater visibility of
monitoring and hopefully expanding opportunities for funding and collaboration.
To modify your program’s information in our database:
There are two tabs of data for you to examine: one contains metadata about your agency and the
basics about its monitoring efforts, the second contains the details of individual monitoring
programs (e.g., per species, region, etc.). Each monitoring program is entered in a separate
column. For guidance, a completed example is included on each tab.
For easy modification, fields in the database are primarily filled via drop-down menus; to change
any response, you can simply click on a cell, click on the small arrow that appears in the right
corner to open the drop-down menu, and then select the appropriate option. The few fields that
require manual filling will have a yellow pop-up note to direct you. You can clear any cell by
simply highlighting it and then hitting the “backspace” key.
If you do additional monitoring (of other species or in other regions) that we have missed, you
may add column(s) of responses characterizing those efforts. Redundant information can be left
blank or copied into adjacent cells using the green square in the lower right corner of a field (the
standard Excel drag to copy function).
If you have any questions, please email coraann.johnston@gmail.com, cc: klafferty@usgs.gov.
Finally, if you have collaborators or know of other researchers who should be included in our
database, we would appreciate your suggestions of who to contact.
Thank you for helping us validate your research records.
On behalf of BOEM,
Cora Johnston, Ph.D.
Post-doctoral research scientist
U.S. Geological Survey & UC Santa Barbara
Kevin Lafferty, Ph.D.
Marine Ecologist
Western Ecological Research Center
U.S. Geological Survey
Entry confirmations (N = 65 email addresses) were collected between March and November 2017.
Table 1. List of parameters and their descriptions collected for describing marine bird and
mammal research and monitoring programs or efforts throughout the Pacific OCS.
Parameters collected Description of parameters collected
Contact Name Person responsible for information about the program (usually the person
submitting the information)
Contact Email Email address for Contact Name
Taxa Set Either “Seabird” or “Mammal”
8Parameters collected Description of parameters collected
Taxa Broad taxonomic group (e.g., avian Family, mammalian Order, etc.)
Common Name Standardized common name for taxa of interest (at species-level)
Scientific Name Currently recognized North American Latin binomial nomenclature
Alpha Code 4-character alpha code commonly used to identify marine birds and
mammals in related data sets
Notes on species Any user-specified notes regarding species selected
Study Region Geographic study regions where research or monitoring activities occur
(can be multiple listings)
State Name State name for planning area reference; States encompass Study
Regions
Monitor Site Unique geographic names if participants wanted to indicate specific
research or monitoring sites
Jurisdiction1 Geographic/management jurisdiction for region or habitats where specific
research or monitoring occurs or is related to (can be multiple listings)
Organization Specific organization, group, entity or individual associated with a given
Affiliation
Affiliation2 14 parent organizations or entities encompassing specific Organizations
Data Collected 45 parameters describing the types of information collected for each
species or taxa group (See Table 3)
Survey Method For seabirds and mammals, methodological description used to specify
greater detail
Other Methods For mammals, methodological description used to specify greater detail
for Data Collected and/or Survey Method
Start Year Year group or researcher-initiated data collection
End Year Ending Year group or researcher finished data collection
Missing Year List of any years where data were not collected
Data Collection Seasons Season when research or monitoring occurs (can be multiple listings)
Data Collection Frequency Approximate frequency at which research or monitoring occurs (can be
multiple listings
Notes Any general applicable notes added by participants used to clarify any of
the responses describing specific parameters collected
1
Specific jurisdictions available included: State Waters (inland and to 3 NM offshore), State MPAs, National
Park/Seashore, State Park/Beach, City, National Monument, State Reserve, County, National Marine Sanctuaries,
Military/Coast Guard, National Wildlife Refuge, Private Land, and Federal Land (VA).
2
Specific parent organization affiliations included: California Department of Fish & Wildlife, California Sea Grant,
California State Parks, College or University, DOC National Oceanographic and Atmospheric Administration, DOD
Marine Corps, DOI Bureau of Land Management, DOI National Park Service, DOI U.S. Fish & Wildlife Service,
DOI U.S. Forest Service, DOI U.S. Geological Survey, NGO For-profit, NGO Independent, and NGO Non-profit.
9Figure 4. Sea otter researcher records behavior
A researcher at the Monterey Bay Aquarium, records sea otter behavior on data sheets as part of a study with the
USGS and the University of California at Santa Cruz on sea otter behavior. (Credit: Tania Larson, U.S. Geological
Survey. Public domain.)
4 Results
4.1 Marine Bird Research and Monitoring Programs
Survey participants who indicated their organization collects information for research or monitoring in
California, Oregon, Washington, Alaska, Hawaii and the Pacific Islands indicated a total of 47 specific
marine birds of 13 Families (Table 2). Participants indicated 28 research or monitoring parameters were
collected (Table 3), with the oldest data collected beginning in 1960 (Band-rumped Storm-Petrel,
Hawaiian Petrel, and Newell's Shearwater data collected by the National Park Service) and the most
recent data indicated in 2017. The complete database is available online (Lafferty et al. 2019;
https://doi.org/10.5066/F7X0669S).
10Table 2. List of 46 specific marine birds (listed alphabetically by Family then by Common Name)
identified by survey respondents who indicated their organization collects information for
research or monitoring in California, Oregon, Washington, Alaska, Hawaii and the Pacific Islands.
Respondents also indicated “All Birds” and “Other Birds”. Non-marine waterbirds (e.g. herons)
and shorebirds (e.g. Black Oystercatcher) were rarely indicated and are not included in this table.
Taxa (Family) Common Name Scientific Name Alpha Code
Alcidae Ancient Murrelet Synthliboramphus antiquus ANMU
Cassin's Auklet Ptychoramphus aleuticus CAAU
Common Murre Uria aalge COMU
Horned Puffin Fratercula corniculata HOPU
Kittlitz's Murrelet Brachyramphus brevirostris KIMU
Marbled Murrelet Brachyramphus marmoratus MAMU
Parakeet Auklet Aethia psittacula PAAU
Pigeon Guillemot Cepphus columba PIGU
Rhinoceros Auklet Cerorhinca monocerata RHAU
Scripps's Murrelet Synthliboramphus scrippsi SCMU
Tufted Puffin Fratercula cirrhata TUPU
Diomedeidae Black-footed Albatross Phoebastria nigripes BFAL
Laysan Albatross Phoebastria immutabilis LAAL
Fregatidae Great Frigatebird Fregata minor GRFR
Gaviidae Red-throated Loon Gavia stellata RTLO
Hydrobatidae Ashy Storm-Petrel Oceanodroma homochroa ASSP
Band-rumped Storm-Petrel Oceanodroma castro BSTP
Black Storm-Petrel Oceanodroma melania BLSP
Leach's Storm-Petrel Oceanodroma leucorhoa LESP
Fork-tailed Storm-Petrel Oceanodroma furcata FTSP
Laridae Aleutian Tern Onychoprion aleuticus ALTE
Arctic Tern Sterna paradisaea ARTE
Black Noddy Anous minutus BLNO
Black-legged Kittiwake Rissa tridactyla BLKI
California Gull Larus californicus CAGU
Caspian Tern Hydroprogne caspia CATE
Elegant Tern Thalasseus elegans ELTE
Glaucous-winged Gull Larus glaucescens GWGU
11Taxa (Family) Common Name Scientific Name Alpha Code
Least Tern Sternula antillarum LETE
Mew Gull Larus canus MEGU
Western Gull Larus occidentalis WEGU
White Tern Gygis alba WHTT
Pelecanidae Brown Pelican Pelecanus occidentalis BRPE
Phaethontidae Red-tailed Tropicbird Phaethon rubricauda RTTR
White-tailed Tropicbird Phaethon lepturus WTTR
Phalacrocoracidae Brandt's Cormorant Phalacrocorax penicillatus BRAC
Double-crested Cormorant Phalacrocorax auritus DCCO
Pelagic Cormorant Phalacrocorax pelagicus PECO
Red-faced Cormorant Phalacrocorax urile RFCO
Podicipedidae Western/Clark’s Grebe Aechmophorus occidentalis/clarkii WEGR/CLGR
Procellariidae Christmas Shearwater Puffinus nativitatis CHSH
Hawaiian Petrel Pterodroma sandwichensis HAPE
Newell's Shearwater Puffinus newelli NESH
Wedge-tailed Shearwater Ardenna pacifica WTSH
Stercorariidae Parasitic Jaeger Stercorarius parasiticus PAJA
Sulidae Brown Booby Sula leucogaster BRBO
Red-footed Booby Sula sula RFBO
Figure 5. Horned Puffin
One of the species affected by a recent seabird die-off in the Pribilof Islands, AK. Near Chisik Island in
Lower Cook Inlet, Alaska. (Credit: Sarah Schoen, U.S. Geological Survey, Alaska Science Center. Public
domain.)
12Table 3. List of the research or monitoring parameters identified in programs associated with collecting data about marine birds (N = 28
parameters). Contributors were asked to identify specific species or grouped taxa for each parameter measured.
Value for informing potential effects of
Parameter Description offshore energy activities
Acoustics methods and devices used to collect sonic moderate – high. Depending on the context,
information (e.g. directional hydrophones for acoustic monitoring techniques can be one of
marine mammals, acoustic sound recorders the only tools available for measuring the
deployed on islands to record bird relative abundance of cryptic nocturnal
vocalizations, recording stations to archive species such as petrels and storm-petrels.
sonic tags deployed on marine animals)
Adult Diet samples, either collected or observed, that low
describe the diet or food habits of adult
animals
Adult Morphometrics measurements used to describe the size of an moderate. Measurements of individuals may
adult animal already be available for certain species and
are important for describing aspects related to
flight behavior and maneuverability including
aspect ratio and wing-loading.
At-sea Behavior discrete or categorical information that high. Although behavior at sea can be difficult
describes some behavior exhibited by animals to measure, behaviors exhibited by birds at
while at sea (e.g., diving, feeding, flying, etc.) sea can influence their vulnerability to
offshore energy activities either affecting
collision vulnerability or displacement
vulnerability
At-sea Count From Shore counts of animals at sea or on land made low
from a land-based vantage point
At-sea Distribution/Abundance Vessel counts or recorded locations of animals at sea high. Although logistically complex and
made from a vessel such as a boat, aircraft, expensive, vessel surveys at sea are the only
or autonomous vessel (e.g., drone) way to measure the distribution and
abundance of seabirds and marine mammal
at sea. Surveys can be modified to achieve
appropriate temporal and spatial resolution to
address site-specific needs.
Beach Carcass Surveys surveys conducted on beaches or along moderate. Beach carcass surveys provide
waterfronts that describe the location, and index to seasonal and annual trends in
species, and counts for animal carcasses seabird mortality and can also signal events
deposited on shore that cause exacerbated mortality and
deposition. There are several regional, long-
term programs on the west coast of the US.
13Value for informing potential effects of
Parameter Description offshore energy activities
Blood/Feather/Tissue Sampling collection of blood, feathers, or other tissues low
from birds
Breeding Success quantified information related to reproductive low
success (e.g., number chicks fledged per nest
for birds or number of pups weened for
pinniped population)
Chick Diet samples, either collected or observed, that low
describe the diet or food habits of chicks or
nestlings (birds)
Chick Growth/Morphometrics measurements (usually repeated) used to low
describe the change in size (growth) of
individual birds from hatching to fledging.
Colony Behavior discrete or categorical information that low
describes some behavior exhibited
collectively by animals in a colony (e.g.,
flushing or fleeing in response to disturbance)
Colony Count counts of animals located within a discrete moderate – high. Systematic colony count
colony (e.g. seabird breeding colony or data among species that are at greater
pinniped breeding colony) vulnerability associated with offshore energy
activities (i.e., offshore wind energy
infrastructure) based on colony location,
together with information from reference site
locations, could provide information to colony
specific changes in abundance.
Contaminants information related specifically to the low
evaluation of chemicals or chemical exposure
among animals, tissues, or eggs
Disturbance information related to disturbance or low
harassment of birds or marine mammals
Fledging Success quantified information related to reproductive low
success (e.g., number chicks fledged per nest
for birds or number of pups weened for
pinniped population)
Hatching Success quantified information related to reproductive low
success (e.g., number eggs hatched per
number of eggs laid)
Mistnetting a fine mesh netting method used for capturing low
birds
14Value for informing potential effects of
Parameter Description offshore energy activities
Necropsy/Tissue Archival procuring, storing, or archiving animals or low
animal tissue samples collected during post-
mortem examination
Nest/Burrow Occupancy quantified information used to calculate the moderate – high. Systematic nest or burrow
proportion of nests or burrows (for burrow- occupancy data among species that are at
nesting seabirds) available within a sample greater vulnerability associated with offshore
that are occupied by a breeding adult or energy activities (i.e., offshore wind energy
breeding adult pair (birds only) infrastructure) based on colony location,
together with information from reference site
locations, could provide information to colony
specific changes in abundance.
Nest Count number of nest sites (or burrows for burrow- moderate – high. Systematic nest count data
nesting seabirds) per sample (count data) among species that are at greater
vulnerability associated with offshore energy
activities (i.e., offshore wind energy
infrastructure) based on colony location,
together with information from reference site
locations, could provide information to colony
specific changes in abundance.
Phenology information related to the seasonal timing of low
animal life history events (nesting season,
pupping season, dispersal or migration timing)
Photography information collected using cameras, can low
include nest counts, counts at sea, species
identification, nest site activity or visitation on
land
Predation information related to depredation of seabirds. low
For example, are seabirds taken as prey by
mammals, or other birds?
15Value for informing potential effects of
Parameter Description offshore energy activities
Radar radar is used to detect and map flight moderate – high. Measuring the flight
trajectories among seabirds – usually behavior and transiting movements among
associated with flyways and site-specific seabirds can be difficult, especially at night or
colony attendance during periods of poor visibility. Radar offers a
convenient method to measure flight
trajectories (flight height and speed)
associated with offshore energy activities.
Data may be useful for determining the effect
of activities or infrastructure on flight behavior
and movements.
Roosting/Haulout Count number animals counted at roosting sites low
(birds) or at haulout locations (pinnipeds)
(count data)
Subadult/Adult Survival information collected to record, document or moderate – high. Among long-lived seabirds
calculate survival of sub-adult or adult with low reproductive output, adult survival
members of a population rates are important to measure because small
changes in adult survival over time translate
to changes in population growth rates.
Telemetry/Sensors devices usually attached to animals that are moderate. Telemetry and bird-borne sensors
used to measure or record an individual provide a convenient way to track the
animal’s location, trajectory, movement, movements and behavior of seabirds at sea.
physiology, or information about an animal's GPS technology allows relatively hi-resolution
habitat or environment spatial information (several m) and can also
be useful for assessing flight heights, and
behaviors (resting, transiting) among different
species
16Table 4. List of the research or monitoring parameters identified in programs associated with marine mammal (N = 24 parameters) taxa.
Contributors were asked to identify specific species or grouped taxa for each parameter measured.
Value for informing potential effects of offshore
Parameter Description energy activities
Abundance records of the number of individuals per sample or high. An understanding of the distribution and
in a study area abundance among species in areas potentially
affected by offshore energy activities is key
information.
Acoustics records of species presence, identity, and/or moderate – high. Depending on the context, acoustic
activity inferred from acoustic recording devices monitoring techniques can be an effective method
including devices used to document species for measuring the presence/absence or abundance
presence, identity, and/or activity. Some devices of diving cetaceans.
are left unattended (e.g., at buoys) and retrieved
at intervals for data download; others are
collected in real time (e.g., by towing behind a
vessel)
Beach Carcass Surveys surveys conducted on beaches or along moderate. Beach carcass surveys provide and index
waterfronts that describe the location, species, to seasonal and annual trends in seabird mortality
and counts for animal carcasses deposited on and can also signal events that cause exacerbated
shore mortality and deposition. There are several regional,
long-term programs on the west coast of the US.
Behavior observations or recordings of behavior, including moderate – high. Depending on the context, marine
inter- and intra-species interactions, foraging, mammal behavior can provide information about
diving, mating, ship evasion, etc. individuals reactions to modified environments or
stressors. Normal behavioral observations yield
information about timing or habitats of importance
(e.g., mating, resting, or feeding areas).
Blood/Tissue Sampling collection of blood or other tissues from marine low. Tissue sampling may be important for genetic
mammals species ID or population structure analyses
Density Recordings of number of individuals per unit area moderate – high. Similar to Abundance, an
(similar to abundance). understanding of the distribution and abundance
among species in areas potentially affected by
offshore energy activities is key information
17Value for informing potential effects of offshore
Parameter Description energy activities
Diet or foraging or contaminants Observations or measurements of food low – moderate. Depending on context, information
consumption, diet composition, and related intake regarding feeding behavior or distribution of key
of contaminants. forage species can provide important information
about important areas at sea for marine mammals.
Distribution or range Evaluation or observations of the spatial extent of moderate – high. Similar to Abundance and Density,
species occurrence. an understanding of the distribution and range
among species in areas potentially affected by
offshore energy activities is key information.
Disturbance Records of conflict between wildlife and sources moderate – high. Depending on context, information
of disturbance, including beach users, ship traffic, regarding disturbance to marine mammals caused
etc. by anthropogenic factors associated with offshore
energy activities (e.g., benthic surveys, construction
and operational noise under water, sub-surface
cabling or infrastructure hazards, etc.).
Habitat occupancy Records of species presence in or association moderate. Information that describes habitat
with a given habitat type. associations among marine mammals can be
important for evaluating siting and potential effects
associated with offshore energy activities.
Haulouts Records of pinniped emergence along shorelines. low. Unless haulouts are associated with offshore
energy infrastructure.
Morphometrics Measures of body attributes that characterize low.
size, shape, or condition.
Mortality Observations of mortality events or records of low. Unless associated with offshore energy
dead individuals and associated causes. activities.
Movement or migration or dispersal Observations or estimates of individual mobility at low – moderate. Depending on context, identification
small (movement) and large (migration) scales. of key movement corridors could be important
related to offshore energy activities
Necropsy/Tissue Archival procuring, storing, or archiving animals or animal low.
tissue samples collected during post-mortem
examination
18Value for informing potential effects of offshore
Parameter Description energy activities
Occurrence Records of species encounter across space and low – high. Similar to Abundance, Density, and
habitats. Generally, at less resolution then actual Distribution or Range, an understanding of the
quantification of abundance or density. occurrence among species in areas potentially
affected by offshore energy activities is key
information.
Pathology Observations or evaluations of symptoms or low.
disease and causes thereof.
Physiology information to help explain marine mammal body low. Unless associated with offshore energy
function including diving and locomotion, nutrition activities.
and energetics, reproduction, sensory systems,
and environmental interactions
Population structure or individual ID estimates of population size, age distribution, or moderate. Demographic information that can be
composition of known individuals developed associated with population growth or vulnerability
primarily from tagging, observational, and genetic (i.e., survival rates) is important for determining
approaches. population structure and status.
Predation information related to depredation of marine low.
mammals. For example, are marine mammals
taken as prey by other marine mammals or
sharks?
Reproduction records of the occurrence of mating or production low.
and survival of offspring
Strike or stranding or entanglement records of injured or distressed animals evidently high.
resulting from encounters with agents of
disturbance (vessels, etc.), disease, or similar
Subadult/Adult Survival information collected to record, document or moderate – high. Among long-lived marine
calculate survival of sub-adult or adult members of mammals with low reproductive output, adult survival
a population rates are important to measure because small
changes in adult survival over time translate to
changes in population growth rates.
19You can also read