Genetic Diversity and Connectivity in Plant Species Differing in Clonality and Dispersal Mechanisms in Wetland Island Habitats
←
→
Page content transcription
If your browser does not render page correctly, please read the page content below
Journal of Heredity, 2021, 1–14
                                                                                                             doi:10.1093/jhered/esaa059
                                                                                                                     Symposium Article
                                                                                             Advance Access publication February 8, 2021

Symposium Article

Genetic Diversity and Connectivity in Plant

                                                                                                                                               Downloaded from https://academic.oup.com/jhered/advance-article/doi/10.1093/jhered/esaa059/6130806 by guest on 12 February 2021
Species Differing in Clonality and Dispersal
Mechanisms in Wetland Island Habitats
Sissi Lozada-Gobilard, Christian Schwarzer, Rodney Dyer,
Ralph Tiedemann*, and Jasmin Joshi*
From the Unit of Evolutionary Biology/Systematic Zoology, University of Potsdam, Karl-Liebknecht-Str. 24–25, 14476
Potsdam, Germany (Lozada-Gobilard and Tiedemann); Sissi Lozada-Gobilard is now at The Botanical Garden, School of
Plant Sciences and Food Security, G.S. Wise Faculty of Life Science, Tel Aviv University, Israel; Plant Systematics and
Biodiversity, Humboldt University of Berlin, Späth-Arboretum, Späthstr. 80/81, 12437 Berlin, Germany (Schwarzer); Center
of Environmental Studies, Virginia Commonwealth University, Richmond, VA 23284 (Dyer); Institute for Landscape and
Open Space, Eastern Switzerland University of Applied Sciences, Seestrasse 10, 8640 Rapperswil, Switzerland (Joshi); and
Berlin-Brandenburg Institute of Advanced Biodiversity Research (BBIB), Altensteinstr. 6, 14195 Berlin, Germany (Joshi).

*These authors contributed equally to this work.

Address correspondence to S. Lozada-Gobilard at the address above, or e-mail: sissi.lozada@gmail.com.
Received February 1, 2020; First decision April 22, 2020; Accepted December 15, 2020.

Corresponding Editor: Maria Orive

Abstract
In plants, long-distance dispersal is both attenuated and directed by specific movement vectors,
including animals, wind, and/or water. Hence, movement vectors partly shape metapopulation
genetic patterns that are, however, also influenced by other life-history traits such as clonal growth.
We studied the relationship between area, isolation, plant-species richness, reproduction, and
dispersal mechanisms with genetic diversity and divergence in 4 widespread wetland plant-species
in a total of 20 island-like kettle-hole habitats surrounded by an intensive agricultural landscape. Our
results showed that genetic parameters reflect the reproduction strategies with the highest genetic
diversity being observed in the non-clonal, outcrossing Oenanthe aquatica compared to the clonal
Lycopus europaeus, Typha latifolia, and Phragmites australis. Lycopus showed a positive relationship
between genetic diversity and kettle-hole area, but a negative relationship with the number of
neighboring kettle holes (less isolation). Genetic diversity increased with plant-species richness in
the clonal species Phragmites and Lycopus; while it decreased in the non-clonal Oenanthe. Finally,
genetic divergence and, therefore, connectivity differed between alternative dispersal strategies,
where wind-dispersed Typha and Phragmites had a higher gene flow between the analyzed kettle
holes compared with the insect-pollinated, hydrochorous Lycopus and Oenanthe. Our study provides
information on genetic patterns related to reproduction and dispersal mechanisms of 4 common
wetland species contributing to the understanding of the functioning of plant metacommunities
occurring in kettle holes embedded in agricultural landscapes.

Subject Area: Conservation Genomics
Key words: Lycopus europaeus, Oenanthe aquatica, Phragmites australis, Typha latifolia, dispersal, breeding systems, clonal
growth, metapopulations, genetic diversity, genetic divergence, landscape factors, kettle holes, wetlands

© The American Genetic Association. 2021. All rights reserved. For permissions, please e-mail: journals.permissions@oup.com
                                                                                                                                           1
2 Journal of Heredity, 2021, Vol. XX, No. XX
In plants, movement of individuals and their genes are mediated by reproduction (e.g., Jónsdóttir et al. 1999; Stevens et al. 2007). In
dispersal of seeds and pollen (Cousens et al. 2008), as well as by macrophytes, population differentiation can be the result of re-
asexual reproduction through vegetative fragments (Barrett et al. stricted gene flow (Barrett et al. 1993), despite dispersal of both
1993). The effective dispersal of propagules (seeds and pollen) sexual and asexual propagules mediated by water (Bornette and
among habitat patches in a landscape has been defined as “plant Puijalon 2011) or animals (especially by birds; Figuerola and Green
functional connectivity” (Auffret et al. 2017), and an increase in 2002; Santamaría 2002). Therefore, how clonality together with dis-
functional connectivity through corridors or stepping stones has persal mechanisms influence genetic diversity and population differ-
been shown to have a positive effect on population persistence, par- entiation is not completely understood.
ticularly in fragmented landscapes (e.g., Tewksbury et al. 2002; Van In the present study, we aimed to identify the relationship be-
Downloaded from https://academic.oup.com/jhered/advance-article/doi/10.1093/jhered/esaa059/6130806 by guest on 12 February 2021
Rossum and Triest 2012). High connectivity has also been positively tween reproduction, habitat area, isolation, plant-species richness,
associated with an increase in genetic diversity within populations, and dispersal vectors with genetic diversity and genetic divergence
with individual fitness, and with a decrease in genetic differentiation in 4 selected macrophytes distributed in island-like aquatic habitats
among populations (e.g., Leimu et al. 2006). called kettle holes surrounded by an unsuitable agricultural matrix
Dispersal by biotic and abiotic vectors is one of the most im- (Brose 2001; Tiner 2003; De Meester et al. 2005). The 4 selected plant
portant factors influencing plant movement (Damschen et al. 2008). species (Oenanthe aquatica, Lycopus europaeus, Typha latifolia,
To study plant gene-flow within an isolation–with–migration frame- Phragmites australis) differ in clonality and dispersal strategies.
work and to understand the effects of seed and pollen dispersal Whereas Oenanthe aquatica is considered “non-clonal,” Lycopus
by vectors such as wind or animals, a combination of theoretical europaeus possesses clonal growth through stem tubers produced at
models (e.g., Nathan et al. 2002; Soons et al. 2004; Zhu et al. 2016), the end of hypogeous rhizomes that can expand 0.1–0.25 m year−1
long-term surveys (e.g., Soons et al. 2016; Schermer et al. 2018), and is therefore classified as “clonal.” Typha latifolia and Phragmites
as well as genetic techniques (e.g., Aavik et al. 2014) are useful to australis show clonal growth through hypogeous rhizomes gener-
provide insights on plant functional connectivity and the import- ally expanding more than 0.25 m year−1 and are therefore classified
ance of both biotic and abiotic dispersal vectors. Reproduction sys- as “fast clonal spreaders” (see details in Supplementary Table S11).
tems are also strongly related to dispersal strategies and vary from Regarding dispersal mechanisms, Oenanthe aquatica and Lycopus
fully clonal to exclusively sexual reproduction, which itself varies europaeus are pollinated by insects and seeds are mainly dispersed
from self-fertility to complete outbreeding (Cousens et al. 2008). In by water; while pollen and seeds of Typha latifolia and Phragmites
addition, a range of external factors such as resource availability, australis are mainly transported by wind.
disturbance, pathogen/herbivore attack, or competition between We addressed the following questions: 1) How are levels of
plants also influence plant-species movement (Damschen et al. 2008; inbreeding, population genetic diversity, and genetic differentiation
Auffret et al. 2017). related to the type of reproduction in 4 selected common wetland
Clonal growth is an important life-history trait that can provide species? 2) How do patch size and the degree of isolation affect pat-
plants with a higher probability of persistence, as well as competitive terns of genetic diversity within each species? A lack of gene flow
advantages related to the ability to deal with disturbances (resistance may either reflect dispersal limitations across a landscape or be the
and resilience), nutrient acquisition, and reproduction (Bazzaz 1996; result of habitat filtering and recruitment limitations of dispersed
Stueffer et al. 1996; Klimešová et al. 2012, 2017, 2018). In conse- seeds (Lozada-Gobilard et al. 2019). We therefore analyzed 3) the
quence, clonal expansion is expected to be associated with higher effect of dispersal vectors (wind and insects) on population genetic
competitive ability due to more flowering shoots and greater repro- diversity and divergence in each of the 4 selected species.
ductive capacity; however, there is also an increased probability of Our expectations were 1) to find in the clonal species high
geitonogamy or self-pollination between flowers of the same indi- inbreeding, higher population differentiation and a lower within-
vidual or clone (Vallejo-Marín et al. 2010) putatively reducing seed population genetic diversity due to the longevity of the once estab-
viability (e.g., Husband and Schemske 1996) and causing loss of lished clones, compared with non-clonal species (e.g., Merwin et al.
population genetic diversity. 2012); 2) we expected an increasing population genetic diversity
Clonal growth is widely distributed in all biomes. It is present with increasing patch size and decreasing isolation. Larger kettle
in 51% of angiosperms from temperate regions, and particularly holes might provide more suitable patches for the plants to establish
common in wetland habitats (Barrett et al. 1993; Klimešová et al. and reproduce, while a higher number of neighboring kettle holes
2012, 2018). Most wetland habitats can be regarded as island-like might increase the possibility of colonization events, thus decreasing
systems whose units are spatially and temporally isolated and as sys- population differentiation. However, more suitable and connected
tems where connectivity highly depends on the size and proximity patches might increase species diversity and interspecific competi-
of the isolated units (MacArthur and Wilson 1967; Itescu 2018). tion. A negative association between local plant-species richness and
Macrophytes restricted to aquatic insular ecosystems have therefore a population genetic diversity has been postulated due to plant compe-
lower chance than habitat generalists to reach a suitable germination tition (e.g. Silvertown et al. 2009), and experimental evidence from
site at a landscape scale after sexual reproduction. Clonal reproduc- biodiversity experiments suggests that genetic diversity is likely to
tion, however, additionally allows for vegetative dispersal within a be lower in plant communities with a higher number of interspecific
suitable patch, being advantageous for local population growth and competitors, due to smaller species-specific effective population sizes
persistence (Ottaviani et al. 2017; Klimešová et al. 2018; Schwarzer and a subsequently higher probability of genetic drift (Nestmann
and Joshi 2019), but putatively disadvantageous by decreasing gen- et al. 2011). Therefore, assuming that clonal species are good com-
etic diversity within habitats. However, previous studies on clonal petitors due to their fast asexual growth, we expected a positive re-
aquatic or wetland plants were ambiguous, showing indeed limited lationship between species richness and genetic diversity in Typha,
genetic variation within and high differentiation among populations Phragmites, and Lycopus, whereas a negative relationship was ex-
of some species such as wild rice (Gao 2005), while other clonal pected in Oenanthe. 3) In the bee-pollinated Oenanthe and Lycopus,
species exhibited high genetic diversity despite predominantly clonal wild bee abundance was expected to affect plant-populationJournal of Heredity, 2021, Vol. XX, No. XX 3
genetic divergence, while in the wind-dispersed species Typha and in Typha latifolia and Phragmites australis pollen and seeds are
Phragmites, plant-population genetic divergence should be affected adapted to wind dispersal (Kühn et al. 2004; Kleyer et al. 2008).
by wind speed and direction. Occasionally, seeds can be dispersed by animals, mainly water birds
through exozoochory in Typha and Phragmites and endozoochory
in Lycopus and Oenanthe (Hroudova et al. 1992; Green et al. 2008;
Methods Brochet et al. 2009; Kleyheeg et al. 2015). Hereafter, species are re-
Studied Species ferred by their genus.
Oenanthe aquatica L. (Fine-Leaved Water Dropwort, Apiaceae) is
a colonizer species distributed in Eurasia, typically occurring on the Study Area
Downloaded from https://academic.oup.com/jhered/advance-article/doi/10.1093/jhered/esaa059/6130806 by guest on 12 February 2021
margins of shallow pools, ponds, and ditches (Westberg et al. 2010). The study area was located approx. 100 km North of Berlin
It is an annual, biennial, or perennial species well-adapted to natur- (Germany, Brandenburg) in the Uckermark near Prenzlau in the
ally nutrient-rich habitats with unpredictable fluctuations of water so-called “AgroScapeLab Quillow.” This agricultural landscape la-
levels, sometimes overgrowing and becoming an undesirable weed boratory is an open research platform established by the Leibniz
under optimal conditions (Hroudova et al. 1992). It can both out- Centre for Agricultural Landscape Research (ZALF), Müncheberg,
cross and self (Kühn et al. 2004); however, it was recently identified Germany. This area comprises around 290 km2 with intensive agri-
as mainly outcrossing (Favre-Bac et al. 2016). Although adventitious culture (65% of the land use) of maize, wheat, and rapeseed and a
roots have been observed in Germany (Rothmaler 2011), it is not high density of kettle holes (up to 2 per km2). The water regime of
considered clonal (Klimešová and Klimes CLO-PLA3 Database). the kettle holes in this region is influenced by a sub-humid climate
This species is diploid with 2n=22 chromosomes (Kühn et al. 2004). with precipitation of 450–600 mm year−1 and potential evapotrans-
In the study area, Oenanthe aquatica is restricted to kettle holes. piration of 600–650 mm year-1 (Kalettka and Rudat 2006). In total,
Lycopus europaeus L. (Gypsyworth, Lamiaceae) is a perennial 20 kettle holes were selected to sample populations of the 4 selected
species distributed from Europe to Eastern Asia (China, Japan) and species (Figure 1, Table 1).
North Africa and naturally occurring along the banks of flowing-
water ditches (Favre-Bac et al. 2016). It is a facultative xenogamous Sampling
species (mainly outcrossing, but selfing is possible), with a com- The selection of the kettle holes was based on an existing data set
petitor/stress tolerator ecological strategy (cs, Kühn et al. 2004). of ~40 kettle holes that are part of a long-term monitoring project
Lycopus europaeus is clonal producing mainly stem tubers at the since 2013 by ZALF (Leibniz Centre for Agricultural Landscape
end of the hypogeous rhizome that can expand 0.1–0.25 m year−1. Research) distributed in localities with previous agreement with
Like O. aquatica, L. europaeus is diploid with 2n=22 chromosomes local farmers (Kalettka, unpublished data). From this list of poten-
(Kühn et al. 2004). In the study area, Lycopus europaeus is restricted tial kettle holes, we selected those where at least one of our selected
to kettle holes. species was present and also distributed to ensure a maximum con-
Typha latifolia L. (broadleaf cattail, Typhaceae) is world-wide nectivity by wind (Figure 1, Table 1). Leaf samples from 9–27 in-
distributed, considered native in North and South America, Europe, dividuals per species were collected in summer 2016 in a total of
Eurasia, and Africa, and reported as an invasive species in Hawaii and 20 kettle holes. The occurrence and number of individuals varied
Australia (Champion et al. 2007; Gucker 2008). This species grows in among the kettle holes (Table 1). Entire leaves were collected from
fresh and brackish water, deep marshes, or shallow roadside ditches Oenanthe and Lycopus, whereas between 5 and 10 cm tips were
(Tsyusko et al. 2005). Typha latifolia is an effective outcrossing spe- cut from Typha and Phragmites. Sample material was dried with
cies (Pieper et al. 2017) with an “initial seedling recruitment” (ISR) silica gel prior to the laboratory work. Oenanthe and Lycopus grow
ecological strategy (Kühn et al. 2004; Tsyusko et al. 2005). Typha in clearly defined patches within the kettle hole while Typha and
latifolia shows clonal growth through hypogeous rhizomes, gener- Phragmites usually grow in a single patch occupying a large frac-
ally expanding more than 0.25 m year−1 and is therefore considered a tion of the kettle hole (e.g., Supplementary Figure S7). For Oenanthe
“fast clonal spreader” in this study. This species is diploid with 2n=30 and Lycopus, we carried out an extensive search within the kettle
chromosomes (Kühn et al. 2004). In the study area, Typha latifolia is hole and collected samples (whenever possible) from all the patches
not restricted to the kettle holes occurring also in small and big lakes. where these species occurred. For the other 2 species, Typha and
Phragmites australis (Cav.) Trin. ex Steud. (Common Reed, Phragmites, that grew in contiguous large patches, we subdivided the
Poaceae) is a cosmopolitan grass species occurring mainly in wet- large patches in 5 regions each with a minimum pairwise distance of
lands, with native populations distributed in temperate zones on 6 meters among regions where leaves were sampled.
every continent except Antarctica. Some genotypes introduced from
Europe have become invasive in North America (Saltonstall et al.
2007; Packer et al. 2017). This species is a perennial helophyte with DNA Isolation and Microsatellite Genotyping
an extensive system of stout, underground stolons and long rhizomes For DNA isolation, 12–20 mg of dried plant material was dis-
expanding more than 0.25 m year-1 and considered “a fast clonal rupted using a high-speed shaking instrument (TissueLyser
spreader” as well. P. australis reproduces both vegetatively and by QIAGEN) at 26.5 hertz for 4 min. Genomic DNA was extracted
seeds (Packer et al. 2017). The species is polyploid with diploid, trip- using the NucleoSpin 96 plant II kit (MACHEREY-NAGEL, Duren,
loid, tetraploid, and octaploid individuals (n = 12), with tetraploids Germany). The main steps of the standard protocol started with a
being most common worldwide (Kühn et al. 2004; Saltonstall et al. washing step in 400 μl of Buffer PL1 and 10 μl of RNase A and incu-
2007). In the study area, Phragmites australis is not restricted to bation at 65° for 10 min. Subsequent clearing of impurities and filter
kettle holes occurring also in small and big lakes. was performed with 450 μl of Buffer PC and washing with 400 μl
In Oenanthe aquatica and Lycopus europaeus, pollen transfer is buffer PW1. For the final elution of DNA, 50 µl Buffer PE were
mediated by insects and seed dispersal is mediated by water, while added to the NucleoSpin Plant II Column and DNA concentration4 Journal of Heredity, 2021, Vol. XX, No. XX
Downloaded from https://academic.oup.com/jhered/advance-article/doi/10.1093/jhered/esaa059/6130806 by guest on 12 February 2021
Figure 1. Study area: Agricultural Landscape Laboratory “AgroScapeLab Quillow” in the Quillow catchment area located in north-eastern Germany (Brandenburg).
This agricultural landscape is characterized by a high density of kettle holes. Points denote our selected kettle holes. The wind rose on the upper right shows
the speed and wind directions in the area. Main wind direction is from SW to NE with a maximum speed of 4.6 m s−1. Percentage of land use in the area is 65%
cropland, 17% forest, 9% grassland, 5% water, and 4% urban.
was measured with a NanoDrop instrument (NanoDrop 1000 spec- 6.503; Peakall and Smouse 2012), or using package “adegenet ” in
trophotometer, Peqlab). R for allelic richness. Since we lacked information on which alleles
For microsatellite amplification, we used already published belonged to which genome for the allopolyploid Phragmites, this spe-
species-specific primers (Supplementary Table S2). We tested different cies was treated as an autopolyploid and the data was analyzed ac-
primers in a subset of 10–15 samples per species collected from kettle cordingly (Meirmans et al. 2018). Following Meirmans et al. (2018),
holes distributed within a distance of 10–15 km until achieving a we assessed genetic diversity by calculating the expected heterozy-
minimum of 10 polymorphic markers per species. All the primer pairs gosity analogous to diploid species by considering and weighting the
that worked in the test were selected and the forward primer of each different possible allelic combinations of partial heterozygotes to cal-
pair was fluorescent labeled (M13-FAM). Locus-specific pairs of pri- culate observed heterozygosity. Specifically, observed heterozygosity
mers combined with 1 µl of DNA were used for the Polymerase Chain was calculated based on the concept of “gametic heterozygosity”
Reactions (PCR) using GoTaq polymerase. PCR reactions varied ac- where the frequency of heterozygotes among randomly sampled
cording to the specific references where the primers were taken from diploid gametes is estimated based on the 4 allele copies at a locus,
(Supplementary Table S2). PCR products were sequenced using an taking into account full and partial heterozygotes (Meirmans et al.
“ABI Prism 3130xl Genetic Analyser” to confirm the presence of re- 2018). Genetic parameters of expected heterozygosity (HE) and ob-
petitive motifs. Afterwards, PCR products were diluted 1:20 or 1:40 served heterozygosity (HO), as well as inbreeding coefficient (FIS) were
according to concentrations of PCR product in the agarose gel, 0.25 μl calculated retaining the repeated multilocus genotypes due to very
dye-labeled size standard LIZ® was added and sequenced with 3130xl high number of clones per site (Supplementary Table S3).
Genetic Analyser (Applied Biosystems® GeneticAnalyzers). Finally, al- To assess the extent of clonality, multilocus genotype matches
lele size scoring was performed using GeneMapper® Software with among all individuals were counted considering 2 model levels: 0
the corresponding library of “bins” and double-checked by eye. The and 1. Model zero denotes only completely matching genotypes
allelic data was exported to the software Excel (Microsoft Excel 2015 being assigned to the same clone (genet) whereas model 1 allows for
Version 15.13.4). Due to the polyploid nature (mostly tetraploid) of a single allele mismatch to be considered the same genet. Samples
Phragmites, we found 1 to 4 alleles per locus. Prior to the statistical with missing data for a locus were assigned to those genotypes they
analyses, individuals with genotype information missing 3 or more matched at the other loci.
microsatellite loci were excluded. Considering the levels of error models 0 and 1, we calculated
the number of genets and ramets per population. Genets are defined
Genetic Diversity and Genotypic Richness as individuals that develop from one original zygote and during
General genetic diversity measures of mean number of alleles, observed vegetative growth produce one or more ramets (Scrosati 2002). The
and expected heterozygosity were calculated using GenAlEx (Version total number of unique genotypes (G) corresponds to the number ofJournal of Heredity, 2021, Vol. XX, No. XX 5
Table 1. Landscape characteristics and number of individuals per species sampled in the kettle holes
n Population ID_N Locality Longitude Latitude Area [m2] Neighboring Plant species Bee Number of samples
(patch kettle holes richness abundance
size) (isolation) Pa Tl Oa Le
1 Boi_28 28 Boisterfelde 13.528872 53.317754 4896 12 8 11 -- 23 25 9
2 Buc_1598 1598 Buchenhain 13.553018 53.308537 3007 19 20 61 -- 25 19 12
3 Buc_1604 1604 Buchenhain 13.551442 53.306172 1534 13 4 7 15 22 -- 26
4 Buc_2565 2565 Buchenhain 13.558765 53.306179 7097 20 11 22 -- -- 13 33
Downloaded from https://academic.oup.com/jhered/advance-article/doi/10.1093/jhered/esaa059/6130806 by guest on 12 February 2021
5 Dam_892 892 Damerow 13.651345 53.406355 3831 18 25 115 25 -- -- --
6 Dam_907 907 Damerow 13.638137 53.405524 574 17 12 25 -- 9 -- 5
7 Dam_910 910 Damerow 13.641936 53.407186 1020 13 14 44 -- -- 25 --
8 Dam_911 911 Damerow 13.640171 53.408547 2328 13 13 20 -- 24 -- 22
9 Fal_183 183 Falkenhagen 13.742717 53.367470 327 12 19 80 25 -- -- --
10 Fal_190 190 Falkenhagen 13.727117 53.362444 2651 5 10 25 23 -- -- 20
11 Kra_805 805 Kraatz 13.662017 53.394665 3198 21 11 38 24 10 25 12
12 Kra_807 807 Kraatz 13.665798 53.397377 1470 17 11 41 -- -- 25 --
13 Raa_1189 1189 Raakow 13.618345 53.353518 1049 24 14 41 -- -- 25 --
14 Raa_2484 2484 Raakow 13.623681 53.352275 2448 22 7 28 25 25 -- --
15 Raa_607 607 Raakow 13.631487 53.347977 3914 29 5 9 25 -- -- --
16 Rit_258 258 Rittgarten 13.707032 53.382468 4284 14 10 25 -- -- 27 --
17 Rit_259 259 Rittgarten 13.706979 53.384092 1045 17 11 20 25 -- 25 --
18 Rit_275 275 Rittgarten 13.709487 53.385975 4398 22 16 156 -- 16 25 --
19 Wil_235 235 Wilhelmshof 13.721543 53.327811 1446 6 9 39 -- -- 26 --
20 Wil_236 236 Wilhelmshof 13.721488 53.328479 440 6 9 32 -- -- 12 --
Total 187 154 272 139
Kettle-hole location and environmental factors important for connectivity are shown. Listed are the abiotic factors area in m2, patch size, and the degree of
isolation measured as the number of kettle holes occurring in a 500-m buffer as well as the biotic factors plant-species richness and bee abundance per kettle hole.
Occurrence of our studied species Phragmites australis (Pa), Typha latifolia (Tl), Oenanthe aquatica (Oa), and Lycopus europaeus (Le) varied among kettle holes.
genets present in a population. A genet can be unique without any al- diversity (GD), and genotypic richness (R) per population and tested
lele matches to other individuals (individual without further ramets) for the effect of 1) Kettle-hole area, 2) number of neighboring kettle
or can match one or more individuals (which are presumed to be holes within a buffer of 500 m (degree of isolation), as the distance
ramets, Supplementary Table S3). Taking these numbers, we calcu- that was previously found to have a positive correlation with plant
lated the average number of ramets per genet and genotypic richness diversity (Lozada-Gobilard et al. 2019), and 3) species richness of
R = (G-1)/(n-1) where G = unique genotypes and n = is the number plants occurring in the kettle holes. We calculated kettle-hole size
of individuals sampled per population (Dorken and Eckert 2001). and the degree of isolation as the number of neighboring kettle holes
A maximum genotypic richness of 1 means a complete absence of within a radius of 500 m using ArcGIS 10 (Esri 2011) on ZALF of-
individuals of the same clone (ramets). In addition, to assess the re- ficial maps of the sites surveyed in 2016. Plant-species richness was
lationship between clonal individuals within populations, we con- recorded as presence and absence of all plant species occurring in the
verted our codominant allelic genotypes into single genotypes. This amphibian and terrestrial zone of the kettle holes (following Lozada-
approach explicitly takes into account the clonal inheritance of en- Gobilard et al. 2019). We analyzed correlations using the “cor.test”
tire genotypes, analogous to the single locus clonal inheritance of or- function from the R package “stats” due to the low amount of data
ganelle genomes (mt/cp genomes). Using this dataset, we calculated per species per population (12 and 8, respectively). All statistical
gene diversity (GD), which estimates the likelihood that the com- tests were performed in R version 3.14 (R Core Team 2019).
posite genotypes of 2 individuals randomly taken from the popu-
lation are different (Nei 1978; Waples et al. 2018). This measure Inbreeding Coefficient (FIS), Multilocus Linkage
is mathematically identical to expected heterozygosity or haplotype Disequilibrium (rd), and Hardy-Weinberg Equilibrium
diversity, just replacing “allele” resp. “haplotype” by “composite Inbreeding coefficients (FIS) were calculated using GenAlEx (Version
genotype” (Nei 1978; Waples et al. 2018). This composite geno- 6.503; Peakall and Smouse 2012) and tested for a positive devi-
type dataset was further used to evaluate gene differentiation (FST ation from zero (P < 0.05) by comparing observed values to those
and AMOVA). Since the general pattern among species of average obtained from 10 000 random permutations, as implemented in
number of ramets/genet, R and GD differed only slightly between Arlequin (Version 3.5.2.2; Excoffier and Lischer 2010). Tests of
models (Supplementary Figure S1, Supplementary Table S3), only Hardy-Weinberg equilibrium (HWE) per locus were performed in
data corresponding to model zero is reported. Arlequin and Multilocus Linkage Disequilibrium (rd) was assessed
using the software Multilocus (Agapow and Burt 2001). Multilocus
Relationship Between Genetic Diversity With Area, Linkage Disequilibrium (rd) was separately calculated per species for
Isolation, and Plant-Species Richness each population based on 2 datasets: 1) microsatellite data of the
Genetic diversity was calculated as the mean expected heterozy- 3 diploid species and 2) a binary conversion of this dataset to in-
gosity (HE), observed heterozygosity (Ho), allelic richness (Ar), gene clude the tetraploid species Phragmites australis. Binary data was6 Journal of Heredity, 2021, Vol. XX, No. XX
taken from microsatellites data converting values of size of alleles Arlequin (Version 3.5.2.2; Excoffier and Lischer 2010) using the
into 0–1 presence/absence. The level of significance for rd was ad- composite genotype dataset.
justed by a Bonferroni correction. Since results between rd calcu- To further evaluate population structure within the studied
lated from microsatellite and binary data did not differ in Oenanthe, species, we analyzed the original allele data set with a Bayesian
Lycopus, and Typha (Supplementary Figure S2), only rd from binary clustering algorithm implemented in STRUCTURE to explore popu-
data, including Phragmites is reported. Calculation of rd was con- lation structure (Pritchard et al. 2000) following an “Admixture
ducted only for unique genotypes at model zero (i.e., a complete Model” with correlated allele frequencies. The range of possible
allele match to be assigned to the same genotype). clusters (K) was set from 1 to 11. The length of the burn-in period
was set to 100 000, followed by 2,000,000 iterations with 30 repli-
Downloaded from https://academic.oup.com/jhered/advance-article/doi/10.1093/jhered/esaa059/6130806 by guest on 12 February 2021
AMOVA and Structure Analyses cates at each K (Porras-Hurtado et al. 2013). Structure output was
To partition the genetic variation within and among kettle holes, analyzed using STRUCTURE HARVESTER (Earl and VonHoldt
an Analysis of Molecular Variance (AMOVA) was performed using 2012), which estimates the optimal number of clusters by identifying
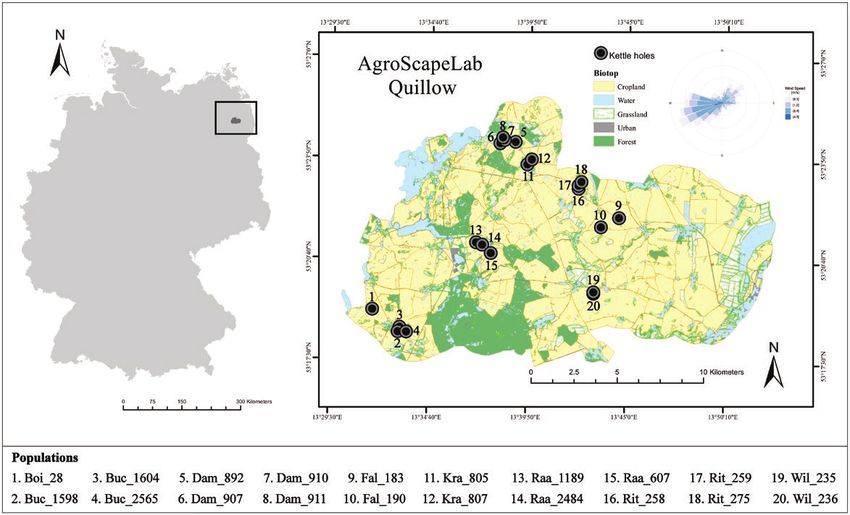
Figure 3. Relationship between allelic richness (Ar) and observed heterozygosity (HO) with kettle hole area (A, B), degree of isolation (depicted as the number
of ponds occurring in a 500-m buffer) (C, D), and plant-species richness measured as the presence/absence of plant species occurring in the kettle holes (E, F).
Nonparametric Spearman correlations are shown separated by species with their corresponding rho estimates (R) and P-values (p).Table 2. Sample size (N) and summary of basic genetic diversity parameters of Oenanthe aquatica (Oa), Lycopus europaeus (Le), Typha latifolia (Tl), and Phragmites australis (Pa)
n MNA Ar HO HE G R GD Ramets/genets FIS rd
Oa Boi_28 25 3.7 ± 0.4 2.7 ± 1.0 0.3 ± 0.05 0.4 ± 0.05 24 0.96 1.00 1.0 0.21*** 0.027***
Buc_1598 19 5.0 ± 0.6 3.9 ± 1.5 0.6 ± 0.1 0.6 ± 0.04 19 1.00 1.00 1.0 0.14** 0.007**
Buc_2565 13 4.5 ± 0.6 3.7 ± 1.6 0.6 ± 0.1 0.6 ± 0.1 13 1.00 1.00 1.0 0.12* 0.000
Dam_910 25 5.7 ± 0.7 4 ± 1.6 0.6 ± 0.1 0.6 ± 0.04 25 1.00 1.00 1.0 0.01 0.004*
Kra_805 25 6.6 ± 0.8 4.6 ± 1.9 0.6 ± 0.04 0.7 ± 0.03 25 1.00 1.00 1.0 0.07* 0.008**
Kra_807 25 5.1 ± 0.7 3.7 ± 1.3 0.6 ± 0.05 0.6 ± 0.03 24 0.96 1.00 1.0 0.07(*) 0.002
Raa_1189 25 5.9 ± 0.9 4.2 ± 2.0 0.6 ± 0.1 0.6 ± 0.05 25 1.00 1.00 1.0 0.01 0.000
Rit_258 27 6.7 ± 0.8 4.7 ± 1.7 0.7 ± 0.04 0.7 ± 0.04 27 1.00 1.00 1.0 0.04 0.001
Rit_259 25 5.9 ± 0.5 4.5 ± 1.2 0.7 ± 0.04 0.7 ± 0.03 22 0.88 0.95 1.3 0.06 0.005*
Rit_275 25 5.5 ± 0.6 3.8 ± 1.3 0.5 ± 0.05 0.6 ± 0.05 25 1.00 1.00 1.0 0.07* 0.002
Wil_235 26 5.6± 0.7 4 ± 1.4 0.6 ± 0.04 0.6 ± 0.04 24 0.92 0.98 1.1 0.08* 0.000
Journal of Heredity, 2021, Vol. XX, No. XX
Wil_236 12 4.2 ± 0.5 3.2 ± 1.1 0.6 ± 0.04 0.6 ± 0.04 12 1.00 1.00 1.0 0.00 0.000
Le Boi_28 9 3.3 ± 0.3 2.3 ± 0.8 0.6 ± 0.1 0.5 ± 0.1 8 0.88 0.97 1.1 −0.03 0.074***
Buc_1598 12 2.7 ± 0.3 2.2 ± 0.5 0.4 ± 0.1 0.5 ± 0.05 9 0.73 0.94 1.3 0.29** 0.204***
Buc_1604 26 2.7 ± 0.2 2 ± 0.6 0.4 ± 0.1 0.4 ± 0.1 16 0.60 0.89 1.9 0.02 0.084***
Buc_2565 33 3.9 ± 0.3 2.6 ± 0.6 0.3 ± 0.1 0.5 ± 0.04 20 0.59 0.85 2.1 0.43*** 0.074***
Dam_907 5 2.2 ± 0.2 1.6 ± 0.5 0.4 ± 0.1 0.3 ± 0.1 5 1.00 1.00 1.0 −0.12 0.475***
Dam_911 22 3.3 ± 0.4 2.2 ± 0.6 0.5 ± 0.1 0.5 ± 0.05 17 0.76 0.92 1.5 −0.01 0.073***
Fal_190 20 2.7 ± 0.3 1.8 ± 0.3 0.4 ± 0.1 0.4 ± 0.04 16 0.79 0.85 1.5 −0.08 0.085***
Kra_805 12 2.4 ± 0.3 2.1 ± 0.9 0.2 ± 0.1 0.4 ± 0.1 11 0.91 0.98 1.1 0.60*** 0.189***
Tl Boi_28 23 2.5 ± 0.6 1.9 ± 1.2 0.2 ± 0.1 0.2 ± 0.1 13 0.55 0.83 1.9 0.24** 0.138***
Buc_1598 25 2.0 ± 0.2 2.1 ± 1.3 0.5 ± 0.1 0.3 ± 0.1 14 0.54 0.89 1.9 −0.51*** 0.158***
Buc_1604 22 2.8 ± 0.5 1.5 ± 0.4 0.2 ± 0.1 0.3 ± 0.1 16 0.71 0.93 1.4 0.21** 0.090**
Dam_907 9 1.7 ± 0.3 1.4 ± 0.6 0.3 ± 0.1 0.2 ± 0.1 4 0.38 0.58 2.3 −0.35(*) 0.333***
Dam_911 24 2.1 ± 0.4 1.6 ± 0.7 0.3 ± 0.1 0.2 ± 0.1 12 0.48 0.82 2.0 −0.15*** 0.212***
Kra_805 10 1.4 ± 0.2 1.1 ± 0.3 0.2 ± 0.1 0.2 ± 0.1 4 0.33 0.53 2.5 −0.42*** 0.455*
Raa_2484 25 2.2 ± 0.5 1.7 ± 0.8 0.1 ± 0.1 0.2 ± 0.1 13 0.50 0.90 1.9 0.49*** 0.088***
Rit_275 15 1.6 ± 0.3 1.3 ± 0.6 0.2 ± 0.1 0.2 ± 0.1 8 0.50 0.89 1.8 −0.32*** 0.064
Pa Buc_1604 15 4.4 ± 1.7 2.7 ± 0.9 0.5 ± 0.3 0.7 ± 0.2 5 0.31 0.74 3.8 0.30 0.168***
Dam_892 25 2.3 ± 1.0 1.3 ± 0.3 0.5 ± 0.3 0.5 ± 0.3 3 0.08 0.42 5.0 −0.15 0.244**
Fal_183 25 2.0 ± 0.9 1.3 ± 0.4 0.4 ± 0.3 0.4 ± 0.3 1 0.00 0.41 8.3 −0.14 0.195***
Fal_190 23 3.1 ± 1.1 2 ± 0.6 0. 5 ± 0.2 0.5 ± 0.2 7 0.29 0.77 2.1 0.06 0.209***
Kra_805 24 4.4 ± 2.2 2.6 ± 1.3 0.5 ± 0.3 0.6 ± 0.2 11 0.43 0.79 2.7 0.23 0.144***
Raa_607 25 4.7 ± 2.4 2.6 ± 1.3 0.4 ± 0.3 0.6 ± 0.3 10 0.38 0.80 4.0 0.00 0.172***
Raa_2484 25 3.1 ± 1.8 1.9 ± 0.8 0.4 ± 0.4 0.4 ± 0.3 3 0.08 0.75 3.6 0.24 0.370***
Rit_259 24 2.1 ± 1.2 1.3 ± 0.5 0.4 ± 0.3 0.3 ± 0.3 4 0.13 0.58 4.2 −0.07 0.296***
Genetic diversity parameters analyzed include mean number of alleles (MNA), Allelic richness (Ar), observed (HO) and expected heterozygosity (HE). Number of unique genotypes (G) and the genotypic richness R = (G−1)/
(n−1), as well as gene diversity (GD) and average number of ramets per genets, were calculated considering a complete match between genotypes (Model zero). An inbreeding coefficient (FIS) was calculated to measure de-
partures from panmixia within populations, and significance values correspond to populations deviating from Hardy–Weinberg equilibrium. Due to polyploidy of P. australis, tests of significance were not calculated. For
P. australis, multilocus linkage disequilibrium rd was calculated based on binary data.
7
Significance levels are indicated with asterisks: ***P< 0.001, ** P< 0.01, * P< 0.05, “(*)”P =0.05.
Downloaded from https://academic.oup.com/jhered/advance-article/doi/10.1093/jhered/esaa059/6130806 by guest on 12 February 20218 Journal of Heredity, 2021, Vol. XX, No. XX
the highest DeltaK value (Evanno et al. 2005). To estimate the op- heterozygosity (HO), and expected heterozygosity (HE) varied sig-
timal clustering, as well as the individual membership within clus- nificantly among species with the highest values found in Oenanthe
ters, CLUMPAK (Cluster Markov Packager Across K) was used (Table 2). Direct comparisons among species are, however, com-
(Kopelman et al. 2015). promised by the fact that different sets of markers with putatively
Since P. australis is an allotetraploid with a disomic inheritance different mutation rates were genotyped in the respective species.
pattern (Soltis and Soltis 2000; Saltonstall 2003), we recoded allele Allelic richness (Ar) and observed heterozygosity (HO) showed
codes as follows: 1) 1 allele at a locus counted as 4 identical alleles; species-specific significant correlations in relation to area, isolation,
2) 2 alleles at a locus counted as each allele occurring twice; 3) 3 and plant species richness (Supplementary Table S4). In Lycopus,
alleles at a locus counted as each allele occurring once and a 4th al- allelic richness significantly increased with the area of the kettle
Downloaded from https://academic.oup.com/jhered/advance-article/doi/10.1093/jhered/esaa059/6130806 by guest on 12 February 2021
lele as missing data; and 4) 4 alleles at a locus counted as each allele holes and with plant-species richness (Figures 3A,E); while HO sig-
occurring once following Fér and Hroudová (2009). This enabled us nificantly decreased with the number of neighboring kettle holes
to analyze our data with STRUCTURE, which can handle tetraploid (Figure 3D). In Typha, allelic richness was not significantly correl-
data (Pritchard et al. 2000). ated with any factor, but HO significantly decreased with the kettle-
hole area (Figure 3B). Allelic richness in Phragmites did not show
Analysis of Dispersal Vectors and Genetic any significant correlations, but HO was positively correlated with
Divergence plant-species richness (Figure 3F). Finally, the non-clonal Oenanthe
showed a significant decrease of HO with plant-species richness
Pairwise FST was calculated as a measure of genetic divergence be-
(Figure 3F).
tween populations based on the composite genotype dataset. To
evaluate if the geographic distance between kettle holes was cor-
related with genetic distance between populations (isolation-by- Inbreeding Coefficient FIS and Multilocus Linkage
distance, IBD), we applied Mantel tests with 10 000 permutations. In Disequilibrium
addition, we evaluated the effect of wind and the abundance of pol- In Oenanthe, 7 out of 12 populations showed significantly positive
linators (bees) on population differentiation in the 2 wind-dispersed (albeit low) FIS values, indicating some within-population inbreeding.
species (Phragmites and Typha) and the insect-pollinated species Multilocus Linkage Disequilibrium (rd) values in Oenanthe were
(Lycopus and Oenanthe), respectively. Wind data was taken from the close to zero in Oenanthe (0.004 ± 0.007, Mean ± SD). In Lycopus,
weather station in Dedelow with a 10 min resolution of 3 consecu- only 3 out of 8 populations showed significantly positive FIS and
tive years 2015–2017 for the period between June and October to a higher variation in rd (0.16 ± 0.14). Typha was characterized by
account for both pollen (between June and July) and seed dispersion significant and mostly negative FIS in 5 out of 8 populations and in
(August–October), of Typha and Phragmites. For an approximation also variable rd (0.20 ± 0.14). Phragmites also presented a variable
of pollinator availability, abundances of bees were taken from a par- rd (0.22 ± 0.07) and mostly positive FIS in 5 out of 8 populations
allel study sampled in the kettle holes during June and July of 2017 (Figure 2, Table 2); but significance tests on FIS could not be per-
using color pan traps (Lozada-Gobilard, unpublished data). Lists of formed due to the tetraploid ploidy of this species.
bee and plant species can be found in Supplementary Table S1. We
compared estimates of FST of Typha and Phragmites to a weighted AMOVA and Structure analyses
matrix based on direction and speed of wind (Supplementary Table AMOVA results in Oenanthe showed the highest percentage of vari-
S9), and FST of Oenanthe and Lycopus to a weighted matrix based ation within populations (82%) and lower variation among popu-
on abundances of bee species (Supplementary Table S10). lations (18%). In Lycopus, variation within populations (55%)
was slightly higher than among populations (45%), while slightly
higher variation among populations compared to within popula-
Results tions were found in Typha (57% vs. 43%) and Phragmites (58%
A total of 20 kettle holes was sampled, but not all study species were vs. 42%, Table 3). Again, these percentages are not directly compar-
present in each kettle hole (Table 1). From the 20 kettle holes, 752 able among species, as different sets of markers with putatively dif-
individuals were genotyped with a minimum of 8 and a maximum ferent mutation rates were genotyped in the respective species. The
of 12 populations per species (Table 1). The number of genets and Bayesian Structure analyses suggested K=8 and K=7 number of gen-
ramets was calculated considering a complete match between geno- etic clusters in the insect-pollinated species Oenanthe and Lycopus,
types (Model 0) and allowing for one allele mismatch (Model 1). respectively; while K=2 was found in the wind dispersed Typha and
Allowing for one allele mismatch inevitably increased the number of Phragmites (Supplementary Figures S3–S6).
ramets per genets (Supplementary Table S3), but the general genetic
diversity pattern among species did not vary (Supplementary Figure Population Differentiation and Relationship With
S1). Clonal individuals were found in all 4 species with the lowest Dispersal Vectors
number in Oenanthe followed by Lycopus, Typha, and Phragmites Pairwise FST between populations were all significant at PJournal of Heredity, 2021, Vol. XX, No. XX 9
the genetic parameters mainly reflected the reproduction strategy
“clonal versus non-clonal” with the highest genetic diversity found
in the non-clonal Oenanthe, compared with the clonal Lycopus,
Typha and Phragmites. In addition, geographically limited dispersal
was found in the insect-pollinated Oenanthe and Lycopus, but not in
the wind-dispersed Typha and Phragmites suggesting a higher con-
nectivity between populations of the latter 2 species.
Relationship Between Clonal Reproduction, Genetic
Downloaded from https://academic.oup.com/jhered/advance-article/doi/10.1093/jhered/esaa059/6130806 by guest on 12 February 2021
Diversity, FIS, and LD
The detection of genetically identical individuals indicates that all
4 investigated species can reproduce clonally. The low percentage
of clonal individuals in Oenanthe (2%) suggests that this species is
mainly reproducing sexually. Although Oenanthe aquatica was pre-
viously classified as self-compatible, with a breeding system where
outcrossing and self-fertilization are equally common (Kühn et al.
2004), our results showed a high genetic diversity within popu-
lations (AMOVA, Table 3). These results suggest sufficiently fre-
quent outcrossing, as was also concluded by Favre-Bac et al. (2016)
in populations in France and confirmed by a consistent lack of
Multilocus Linkage Disequilibrium and inbreeding coefficients FIS~0
(Figure 2B,C).
A combination of significant Linkage Disequilibrium with nega-
tive inbreeding coefficients (FIS) is an indication of sustained clonal
growth, which has been described to cause such a pattern due to the
accumulation of somatic mutations and reduced sexual recombin-
ation (Halkett et al. 2005). High rates of asexuality might also lead
to varying FIS ranging from negative to positive values (Stoeckel and
Masson 2014). Indeed, high variation in FIS values was found in the
clonal species Lycopus, Typha, and Phragmites (Table 2, Figure 2B)
as well as significant Multilocus Linkage Disequilibrium (Table 2,
Figure 2C) confirming a high prevalence of clonal reproduction in
these species, in accordance to our expectations.
In the clonal species Lycopus, Typha, and Phragmites, inbreeding
coefficients (FIS) showed positive and negative values in different
populations (Table 2). Heterozygous individuals that only reproduce
clonally can retain the observed heterozygosity causing negative FIS
values over time, as it was suggested for Carex limosa after hybrid-
ization events between different chromosomal lines (Schwarzer and
Joshi 2019). Therefore, clonality can maintain both heterozygous
and homozygous conditions, leading to highly negative or posi-
tive FIS, in both cases simply reflecting deviations from the Hardy-
Weinberg expectations of genotype frequencies due to lack of sexual
reproduction and hence Mendelian segregation.
Specifically, the mean FIS found in Lycopus (FIS = 0.14) could
be attributed to selfing within flowers or geitonogamous pollin-
ation between ramets as it was observed in alpine clonal tussocks
plants (Ning et al. 2018). However, in many clonal perennial spe-
Figure 2. Genetic parameters of the analyzed populations of Oenanthe
cies, including Typha, Scirpus, and Sparganium, a synchronization of
aquatica, Lycopus europaeus, Typha latifolia, and Phragmites australis. sexual function among ramets occurs, leading to temporal dioecism
Genetic diversity measured as allelic richness (A), FIS = Inbreeding coefficient that limits inter-ramet geitonogamy (Cruden 1988) and facilitates
(B), and rd = Multilocus Linkage Disequilibrium (C). outcrossing, that is, reproduction among different genets. The posi-
tive mean FIS in Phragmites (FIS = 0.062) also suggests a deficit of
heterozygotes and probable self-fertilization within the same ramet
Discussion (Lambert and Casagrande 2007). However, this should be con-
The aim of the present study was to evaluate the relationship be- sidered carefully due to the lack of significance tests for FIS in this
tween genetic diversity and genetic differentiation with reproduction polyploid species (Table 2).
strategies, kettle-hole area, degree of isolation, local plant-species Variation between species in partitioning among and within popu-
richness, and dispersal vectors (wind and pollinator abundances) in lation diversity (AMOVA) likely reflected the effect of clonal versus
4 common wetland plant-species occurring in an insular system of non-clonal reproduction strategies. The largest difference among
kettle holes within an agricultural landscape matrix. We found that and within populations was found in the outcrossing non-clonal10 Journal of Heredity, 2021, Vol. XX, No. XX
Table 3. Summary of the Analysis of Molecular Variance (AMOVA) based on composite genotypes of Oenanthe aquatica, Lycopus
europaeus, Typha latifolia, and Phragmites australis
Sp Source of variation df Sum of squares Variance components Percentage of variation Fixation Index
FST
Oenanthe Among populations 11 965.5 3.2 17.9 0.18***
Within populations 260 3862.5 14.9 82.1
Lycopus Among populations 7 1221.6 9.7 45.3 0.45***
Within populations 131 1539.3 11.8 54.7
Downloaded from https://academic.oup.com/jhered/advance-article/doi/10.1093/jhered/esaa059/6130806 by guest on 12 February 2021
Typha Among populations 7 582.6 4.2 56.8 0.57***
Within populations 146 469.0 3.2 43.2
Phragmites Among populations 7 1295.5 7.7 58.2 0.58***
Within populations 179 990.4 5.5 41.8
Analysis of Molecular Variance among and within populations and global Fixation Index FST are shown.
Significance levels are indicated with asterisks (***P< 0.001).
Oenanthe (18% vs. 82%), compared to Lycopus (45% vs. 55%), competitors (Logue et al. 2011). These complex interactions are also
Typha (57% vs. 43%), and Phragmites (58% vs. 42%, Table 3). Low expected to have an effect on genetic diversity.
variation among populations in the non-clonal and insect-pollinated Therefore, we expected to find a positive relationship between
species suggests lower population differentiation and more genetic genetic diversity and habitat area and/or the number of neighboring
exchange compared to the clonal species. In general, outcrossing kettle holes (less isolation). A significant decrease in genetic diversity
species possess a diversity partition not larger than 20% (FST ~0.2), (HO) with kettle-hole area was found in Typha and with number
whereas selfing species show about 50% (FST ~0.5) (Hamrick and of neighboring kettle holes in Lycopus (Figure 3B, 3D). In Typha,
Godt 1996; Mattner et al. 2002), which generally fits with our global a decrease in heterozygosity with kettle-hole area suggests that in
FST results of 0.18 in the outcrossing species Oenanthe versus 0.45, larger habitats clonal spread was an advantage and that a phalanx
0.57 and 0.58, respectively in the clonal species Lycopus, Typha, strategy (Bona et al. 2015) dominated in these habitats which locally
and Phragmites (Table 3). However, such comparisons should be limited the mixing of ramets of different clones making self-fertiliza-
taken with caution as FST is strongly influenced by within popula- tion more likely causing a substructure of the populations resulting
tion diversity, which may vary not only for biological reasons, but in positive FIS and a reduction in genetic diversity. In contrast to
also for technical ones, as different marker sets may exhibit different our expectations, we found a negative relationship between HO and
levels of polymorphism (see, e.g., Waples et al. 2018). The influence number of neighboring kettle holes in Lycopus. Decreasing HO with
of within population diversity can be compensated for by calcu- decreasing isolation is surprising and might be related to a gener-
lating FSTadjusted (Waples et al. 2018; identical to G’ ST sensu Hedrick ally low probability of pollinators (or seed dispersers) to find neigh-
2005). For our study, this would yield global FSTadjusted values of 0.46 boring kettle holes since they can be surrounded by tall Typha and
in the outcrossing species Oenanthe versus 0.80, 0.74, and 1, re- Phragmites populations or by a dense tree layer (e.g., Supplementary
spectively in the clonal species Lycopus, Typha, and Phragmites. The Figure S7). As a response to a lack of pollinators (or seed dispersers),
observed difference among outcrossing and clonal species remains, self-pollination might occur in combination with clonal growth
but these adjusted values are not very widely used such that studies increasing homozygosity.
for comparison are scarce. At least for Typha latifolia, considerably The relationship between species richness and population gen-
lower FSTadjusted=G’ ST values have been reported in a recent study in etic diversity—the so-called species-genetic diversity correlation
northeastern North America (G’ ST below 0.2; Pieper et al. 2020), (SGDC)—has been theoretically explored and investigated in several
despite of similar levels of within-population diversity (HeS = 0.23 in field studies. A positive correlation of local species richness with neu-
this study (cf. Table 2) vs. HeS = 0.27 in Pieper et al. 2020 [calculated tral genetic diversity was predicted (Antonovics 1976) based on the
from their Supplementary Table S3]). A possible explanation could assumption that variable environmental conditions promote both
be a higher tendency towards clonal reproduction in our study area, species richness and genetic diversity (He et al. 2008) and was mostly
relative to those of the North-American study, where sexual repro- found in island-like systems such as forest patches or isolated sand
duction and outcrossing regularly occurred (Pieper et al. 2020). dunes (Vellend 2004; He and Lamont 2010; Taberlet et al. 2012;
Vellend et al. 2014; Pfeiffer et al. 2018). However, interspecific com-
Relationship Between Genetic Diversity, Area, petition increases the probability of reduction in population size and
Isolation, and Plant-Species Richness of genetic drift and therefore a negative association between local
Within a meta-community framework of wetland habitats, plant- plant-species richness and population genetic diversity can also be
species richness has been shown to be positively affected by expected (Silvertown et al. 2009; Nestmann et al. 2011).
increasing area, less isolation, and habitat heterogeneity (Shi et al. A significant negative association between genetic diversity
2010; Schöpke et al. 2019; Supplementary Figure S8). However, (HO) and local plant-species richness was found in Oenanthe;
this relationship is highly influenced by abiotic (i.e., water depth, while a positive relationship between genetic diversity (allelic rich-
drainage) and biotic factors such as dispersal-related traits ness) and local plant-species was found in Lycopus and Phragmites
(Lozada-Gobilard et al. 2019; Schöpke et al. 2019) as well as by (Figure 3E,F). These results suggest that Oenanthe might suffer
colonization-competition trade-offs where successful colonizers but from interspecific competition, which could cause a reduction in
poor competitors are outcompeted by poor colonizers but successful population size and genetic drift. In contrast, Lycopus, Typha, andJournal of Heredity, 2021, Vol. XX, No. XX 11
Table 4. Summary of the Mantel tests to evaluate the relationship between genetic distance and dispersal vectors
Oenanthe aquatica Lycopus europaeus Typha latifolia Phragmites australis
Pearson r P-value r P-value r P-value r P-value
Mantel FST
IBD 0.5212 Journal of Heredity, 2021, Vol. XX, No. XX
linkage disequilibrium (rd), which is in line with a non-clonal, References
outcrossing type of reproduction in this species. In contrast, low genetic
Aavik T, Holderegger R, Bolliger J. 2014. The structural and functional con-
diversity, variable FIS and significant rd are likely the outcome of clonal nectivity of the grassland plant Lychnis flos-cuculi. Heredity (Edinb).
reproduction in Lycopus europaeus, Typha latifolia, and Phragmites 112:471–478.
australis. Even though the non-clonal, outcrossing species showed very Agapow P-M, Burt A. 2001. Indices of multilocus linkage disequilibrium. Mol
high genetic diversity overall, a negative trend with increasing plant- Ecol Notes. 1:101–102
species richness suggests locally smaller effective population sizes with Ahee JE, Van Drunen WE, Dorken ME. 2015. Analysis of pollination neigh-
increasing interspecific competition. In contrast, genetic diversity in the bourhood size using spatial analysis of pollen and seed production in
2 clonal species Lycopus and Phragmites showed a positive trend with broadleaf cattail (Typha latifolia). Botany. 93:91–100.
Downloaded from https://academic.oup.com/jhered/advance-article/doi/10.1093/jhered/esaa059/6130806 by guest on 12 February 2021
Antonovics J. 1976. The Input from Population Genetics : “The New Eco-
increasing kettle-hole area and with plant-species richness indicating
logical Genetics.” Syst Bot. 1:233–245
pronounced competitive abilities, probably through rapid clonal ex-
Auffret AG, Rico Y, Bullock JM, Hooftman DA, Pakeman RJ, Soons MB, Suárez‐
pansion. Finally, our results suggest higher gene flow in the wind-
Esteban A, Traveset A, Wagner HH, Cousins SA. 2017. Plant functional
dispersed species compared with the hydrochorus and insect-pollinated connectivity – integrating landscape structure and effective dispersal. J Ecol.
ones. Our findings are important for a functional understanding of 105:1648–1656.
plant metacommunities occurring in threatened wetlands (kettle holes) Barrett SCH, Eckert CG, Husband BC. 1993. Evolutionary processes in
distributed in agricultural landscapes. Our study also provides insights aquatic plant populations. Aquat Bot. 44:105–145.
on how genetic parameters are related to environmental biotic and abi- Bazzaz F. 1996. Plants in changing environments: linking physiological, popu-
otic factors that can serve as relevant information for an appropriate lation and community ecology. Cambridge (UK): Cambridge University
conservation strategy, such as a higher need for assisted migration to Press.
Bellavance ME, Brisson J. 2010. Spatial dynamics and morphological plasticity
new kettle-hole habitats for Oenanthe aquatica in comparison to the
of common reed (Phragmites australis) and cattails (Typha sp.) in fresh-
other plant species investigated.
water marshes and roadside ditches. Aquat Bot. 93:129–134.
Bona A, Kulesza U, Jadwiszcak KA. 2015. Clonal diversity, gene flow and seed
production in endangered populations of Betula humilis Schrk. Tree Gen-
Supplementary Material
etics & Genomes. 15:50.
Supplementary material is available at Journal of Heredity online. Bornette G, Puijalon S. 2011. Response of aquatic plants to abiotic factors:
A review. Aquat Sci. 73:1–14.
Brochet AL, Guillemain M, Fritz H, Gauthier‐Clerc M, Green AJ. 2009. The
Funding role of migratory ducks in the long-distance dispersal of native plants and
the spread of exotic plants in Europe. Ecography (Cop). 32:919–928.
This work was supported by Deutsche Forschungsgemeinschaft
Brose U. 2001. Relative importance of isolation, area and habitat heterogen-
(DFG), in the framework of the BioMove Research training group
eity for vascular plant species richness of temporary wetlands in east-
(DFG-GRK 2118/1). German farmland. Ecography (Cop). 24:722–730.
Champion PD, Hofstra DE, Clayton JS. 2007. Border control for potential
aquatic weeds. Stage 3. Weed risk management. Sci Conserv. 271:1–41.
Acknowledgments Charalambidou I, Santamaría L, Jansen C, Nolet BA. 2005. Digestive plasticity
We would like to thank Sandra Jönsson for her help in the laboratory, Marco in mallard ducks modulates dispersal probabilities of aquatic plants and
Donat for his interest resulting in his master project about Typha latifolia; crustaceans. Funct Ecol. 19:513–519.
Frenze Geiger, Jeter Geiger, Carlos Landivar, Carlos Acame, Gabriela Onandia Cousens R, Dytham C, Law R. 2008. Dispersal in Plants: A populations per-
for their valuable help in the field, Benito Schöpke for plant identification, spective. Oxford University Press. p. 220.
Gernot Verch and Joerg Haase for providing wind data and to Gabrielle Cruden RW. 1988. Temporal dioecism: systematic breadth, associated traits,
Schiro for providing the code to plot it. To Rok Cestnik for his help on clone and temporal patterns. Bot Gaz. 149:1–15.
determination and analyzing the wind data and heterozygosity. To members Damschen EI, Brudvig LA, Haddad NM, Levey DJ, Orrock JL, Tewksbury JJ.
of Regenec Workshop 2018 (Sucre, Bolivia) for their helpful discussions and 2008. The movement ecology and dynamics of plant communities in frag-
valuable suggestions. We thank Florian Jeltsch and 2 anonymous reviewers for mented landscapes. Proc Natl Acad Sci U S A. 105:19078–19083.
their valuable comments and suggestion to the manuscript. De Meester L, Declerck S, Stoks R, Louette G, Van De Meutter F, De Bie T,
Michels E, Brendonck L. 2005. Ponds and pools as model systems in con-
servation biology, ecology and evolutionary biology. Aquat Conserv Mar
Freshw Ecosyst. 15:715–725.
Authors’ Contributions Dorken ME, Eckert CG. 2001. Severely reduced sexual reproduction in
S.L.G. and J.J. designed the study. S.L.G. collected the data in the northern populations of a clonal plant, Decodon verticillatus (Lythraceae).
field. S.L.G., R.T., C.S., and J.J. analyzed the data and discussed the J Ecol. 89:339–350.
results; S.L.G., R.T., C.S., R.D., and J.J. wrote the article, contributed Earl DA, VonHoldt BM. 2012. Structure Harvester: a website and program
for visualizing Structure output and implementing the Evanno method.
critically to the drafts and gave final approval for publication.
Conserv Genet Resour. 4:359–361.
Esri. 2011. ArcGIS Desktop: Release 10. Redlands (CA): Environmental
Systems Research Institute, Inc.
Data Availability Evanno G, Regnaut S, Goudet J. 2005. Detecting the number of clusters of in-
The dataset of microsatellites supporting the conclusions of this dividuals using the software STRUCTURE: a simulation study. Mol Ecol.
14:2611–2620.
article is available in the [ZALF] repository, [https://www.doi.
Excoffier L, Lischer HE. 2010. Arlequin suite ver 3.5: a new series of programs
org/10.4228/ZALF.DK.110].
to perform population genetics analyses under Linux and Windows. Mol
Ecol Resour. 10:564–567.
Favre-Bac L, Mony C, Ernoult A, Burel F, Arnaud JF. 2016. Ditch network
Conflict of Interest
sustains functional connectivity and influences patterns of gene flow in an
The authors declare that there is no conflict of interest. intensive agricultural landscape. Heredity (Edinb). 116:200–212.You can also read