Population genetics and evolutionary history of the endangered Eld's deer (Rucervus eldii) with implications for planning species recovery - Nature
←
→
Page content transcription
If your browser does not render page correctly, please read the page content below
www.nature.com/scientificreports
OPEN Population genetics
and evolutionary history
of the endangered Eld’s deer
(Rucervus eldii) with implications
for planning species recovery
Mirza Ghazanfarullah Ghazi, Surya Prasad Sharma, Chongpi Tuboi, Sangeeta Angom,
Tennison Gurumayum, Parag Nigam & Syed Ainul Hussain*
Eld’s deer (Rucervus eldii) with three recognised subspecies (R. e. eldii, R. e. thamin, and R. e.
siamensis) represents one of the most threatened cervids found in Southeast Asia. The species
has experienced considerable range contractions and local extinctions owing to habitat loss
and fragmentation, hunting, and illegal trade across its distribution range over the last century.
Understanding the patterns of genetic variation is crucial for planning effective conservation
strategies. This study investigated the phylogeography, divergence events and systematics of Eld’s
deer subspecies using the largest mtDNA dataset compiled to date. We also analysed the genetic
structure and demographic history of R. e. eldii using 19 microsatellite markers. Our results showed
that R. e. siamensis exhibits two divergent mtDNA lineages (mainland and Hainan Island), which
diverged around 0.2 Mya (95% HPD 0.1–0.2), possibly driven by the fluctuating sea levels of the Early
Holocene period. The divergence between R. e. eldii and R. e. siamensis occurred around 0.4 Mya (95%
HPD 0.3–0.5), potentially associated with the adaptations to warm and humid climate with open
grassland vegetation that predominated the region. Furthermore, R. e. eldii exhibits low levels of
genetic diversity and small contemporary effective population size (median = 7, 4.7–10.8 at 95% CI)
with widespread historical genetic bottlenecks which accentuates its vulnerability to inbreeding and
extinction. Based on the observed significant evolutionary and systematic distance between Eld’s
deer and other species of the genus Rucervus, we propose to classify Eld’s deer (Cervus eldii) in the
genus Cervus, which is in congruent with previous phylogenetic studies. This study provides important
conservation implications required to direct the ongoing population recovery programs and planning
future conservation strategies.
Small populations are susceptible to loss of genetic diversity as a consequence of founder events, genetic bot-
tlenecks, and inbreeding, accelerated by the cumulative impacts of natural and anthropogenic f actors1. Species
characterised by fragmented and isolated populations are increasingly prone to factors that can lead to reduced
levels of genetic diversity and loss of evolutionary potential which, in turn, limit the populations’ ability to adapt
to the changing environment2,3 and as a consequence, elevate the risk of local extinctions4,5. Therefore, preserva-
tion and maintenance of adequate amount of genetic diversity in natural populations of threatened species is
crucial for their long-term survival in the wild6.
Eld’s deer or brow-antlered deer (Rucervus eldii) is a localised and endangered tropical Southeast Asian
cervid7. It was once widely distributed across South and Southeast Asia, extending from Manipur in Northeast
India to Myanmar, Thailand, Cambodia, Vietnam up to Hainan Island in C hina8,9. Over the past 200 years of
known history, the species has witnessed severe range contraction across its historical distribution range. Over-
exploitation of natural resources, habitat loss and fragmentation, hunting, and illegal trade are the major cause
of its population d ecline7,10. The species at present is listed as endangered by the IUCN Red L ist7. It is classified
into three subspecies; Manipur’s brow-antlered deer (R. e. eldii), Burmese brow-antlered deer (R. e. thamin),
Wildlife Institute of India, Chandrabani, Post Box #18, Dehra Dun, Uttarakhand 248002, India. *email: hussain@
wii.gov.in
Scientific Reports | (2021) 11:2564 | https://doi.org/10.1038/s41598-021-82183-7 1
Vol.:(0123456789)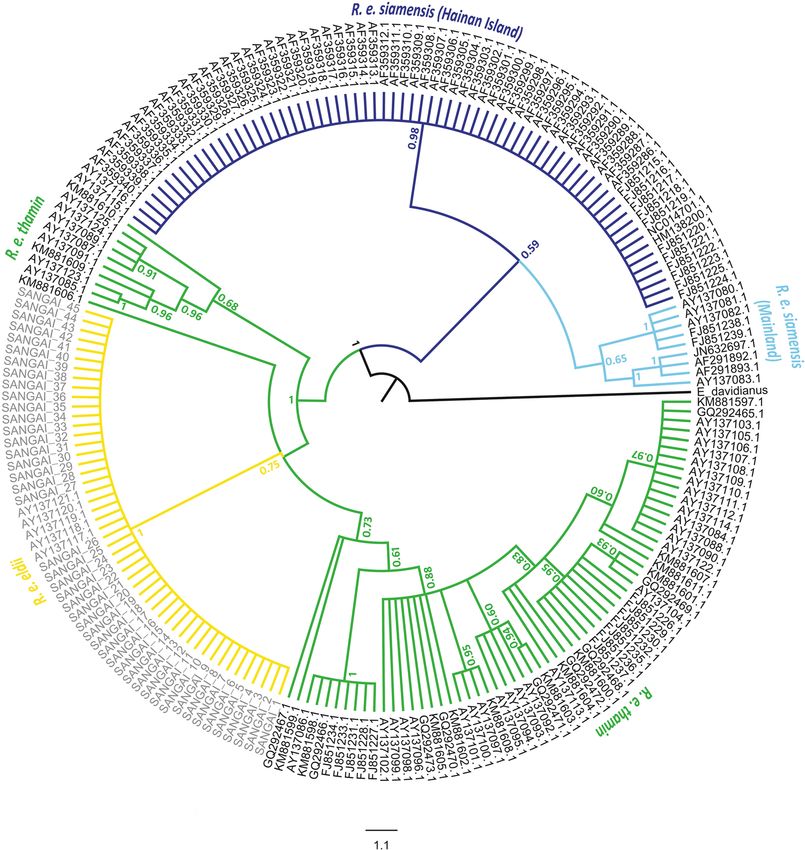
www.nature.com/scientificreports/
Figure 1. Map showing the geographical distribution of Eld’s deer (Rucervus eldii) obtained from the IUCN
Red List7. Sampling locations are represented as NZ National Zoological Park, New Delhi; AZ Alipore
Zoological Garden, West Bengal; GZ Assam State Zoo, Assam; MZ Manipur Zoological Garden, Manipur;
KLNP Keibul Lamjao National Park, Manipur. The map was created using ArcGIS v.10.3.1 software developed
by ESRI (https://www.esri.com).
and Siamese Eld’s deer (R. e. siamensis)7. However, the Hainan Island (HI) population of R. e. siamensis is, at
times, considered to be the fourth subspecies of Eld’s d eer11,12. The current distribution of Eld’s deer subspecies
is highly fragmented (Fig. 1), with several regional exterminations from its former distribution range7. The
Manipur’s brow-antlered deer (R. e. eldii) was declared extinct in 1951, and the current wild population in Keibul
Lamjao National Park (KLNP) in Manipur, India has recovered from 14 individuals rediscovered in 1 97513. It
represents the most threatened subspecies of Eld’s deer which is highly susceptible to local extinction compared
to R. e. thamin and R. e. siamensis, due to its small population size and restricted habitat in KLNP14. Despite its
vulnerability to inbreeding and extinction due to stochastic and demographic factors, limited information is
available on the genetic status of this subspecies to assist its population management programmes. R. e. siamensis
underwent a significant decline across its distribution range during the last century and was declared extinct
from Thailand and Vietnam. Presently, the subspecies occurs in scattered populations in Lao PDR and Cambodia
and Hainan Island in C hina7. R. e. thamin has also witnessed severe range contractions and is considered extinct
from Thailand. Presently, this subspecies represents the largest population of Eld’s deer in the wild with localised
populations in Myanmar and introduced populations in Thailand7,15.
Thailand is considered as the historical centre of the geographical distribution range of Eld’s d eer16. It is
also an area of biogeographical importance as it facilitated the historical migration of large mammals between
South China and Java. The oldest fossil record of Eld’s deer is known from the Quaternary reddish clay deposits
of Middle Pleistocene in north-eastern Th ailand16,17. Another fossil form of Eld’s deer was discovered in the
Island of Java, Indonesia, dating back to around 3000 years before present (Ybp)18 indicating the historical
distribution of Eld’s deer in this region which is presently isolated due to the rise in eustatic sea levels. Evidence
of faunal compressions and local extinctions due to the increased sea levels has been reported in the Isthmus of
Kra region, which divides the Indochinese and Sundaic sub-regions18,19. These changes together with dynamic
climatological and vegetational conditions facilitated the diversification of many ruminant species20–23 and would
have influenced the patterns of genetic diversity, divergence and evolutionary history of Eld’s deer subspecies.
A taxonomic conundrum of assigning Eld’s deer to either genus Cervus or Rucervus still persists. Eld’s deer
share morphological similarities with swamp deer (Rucervus duvaucelii) and the extinct Schomburgk’s deer
(R. schomburgki)24. Based on these affinities, all three species are currently classified together in the genus
Scientific Reports | (2021) 11:2564 | https://doi.org/10.1038/s41598-021-82183-7 2
Vol:.(1234567890)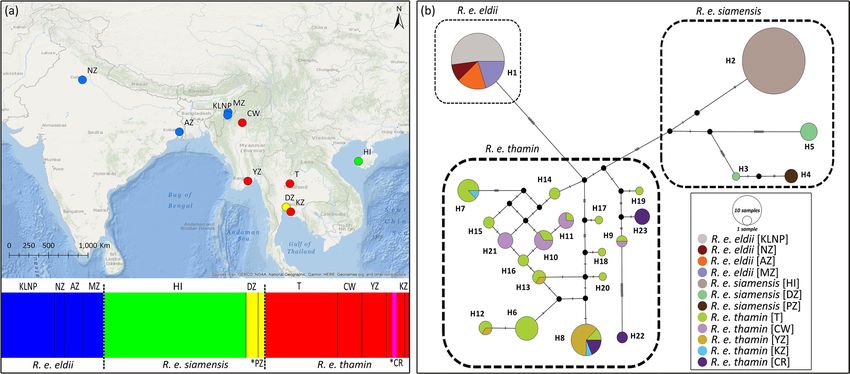
www.nature.com/scientificreports/
Figure 2. (a) Bayesian analysis of population structure (BAPS) of Eld’s deer (Rucervus eldii) subspecies
identified four genetic clusters using 200 mitochondrial control region sequences. Clusters are represented by
colours. The dashed black lines separate subspecies and solid black lines separate populations. The map was
created using ArcGIS v.10.3.1 software developed by ESRI (https://www.esri.com). (b) Median-joining haplotype
network for 23 control region haplotypes identified among the three Eld’s deer subspecies. Three major clusters
were recovered and are indicated by subspecies names. Circle size represents the frequency of individuals, and
colour defines the populations. Small black circles represent median vectors. Mutational steps are shown by bar
on the respective branches. The populations are abbreviated as KLNP Keibul Lamjao National Park, Manipur;
NZ National Zoological Park, New Delhi; AZ Alipore Zoological Garden, West Bengal; MZ Manipur Zoological
Garden, Manipur; HI Hainan Island, China; DZ Dusit Zoo, Thailand; *PZ Paris Zoo, France (not shown in
map); T Thailand; CW Chatthin Wildlife Sanctuary, Myanmar; YZ Yangon Zoo, Myanmar; KZ Khao Khew
Open Zoo, Thailand; *CR Conservation & Research Centre, USA (not shown in map).
Rucervus24,25. However, previous molecular studies assigned Eld’s deer to the genus Cervus26–29 but Grubb8 revived
Thomas’s30 classification and assigned the species to genus Rucervus which is currently adopted by the IUCN
Species Survival Commission. Despite the species being globally endangered, few studies have attempted to
assess its genetic status12,29,31. Studies on microsatellite genetic variation are limited to the HI population of R. e.
siamensis11. Lack of adequate information on the spatial genetic structure and levels of genetic variability among
different populations of Eld’s deer subspecies is an impediment for planning effective conservation breeding and
population management strategies.
In this study, we integrated the available mitochondrial DNA (mtDNA) control region dataset to assess the
patterns of genetic diversity, phylogeography and phylogenetic relationships among the Eld’s deer subspecies.
We analysed the complete mitochondrial genomes of R. e. eldii and R. e. siamensis to estimate the age of these
subspecies and the major divergence events within the Eld’s deer group. To resolve the taxonomic dilemma of
assigning Eld’s deer to either genus Rucevus or Cervus, we reconstructed the phylogenetic association of species
of tribe Cervini using Bayesian analysis of complete mitochondrial genomes. We also estimated the microsatel-
lite genetic diversity, contemporary and ancestral effective population size (Ne), and demographic history of R.
e. eldii using microsatellite markers. Due to logistical and legal constraints of range-wide biological sampling
of Eld’s deer subspecies, we confined the microsatellite analyses to R. e. eldii. The findings of this study will
provide insights into the patterns of genetic association among the subspecies with a deeper understanding of
the evolutionary history of Eld’s deer, which is essential for planning conservation and management strategies.
Results
Phylogeography and genetic differentiation. A total of 23 haplotypes were observed in the control
region (447 bp) of three subspecies of Eld’s deer segregated by 126 polymorphic sites with an overall haplo-
type diversity; (Mean ± SD) hd = 0.805 ± 0.020 and low nucleotide diversity; Pi = 0.023 ± 0.0005. All the three
subspecies of Eld’s deer contain unique control region haplotypes localized within the populations of the
respective subspecies (Fig. 2b). The captive and wild populations (n = 71) of R. e. thamin contain 18 haplotypes
(hd = 0.908 ± 0.018) out of the total 23 haplotypes observed in all the three subspecies. R. e. siamensis exhibited
four control region haplotypes (n = 9) with hd = 0.639 ± 0.126. Interestingly, we observed no haplotype sharing
among the populations of R. e. siamensis. All the identified haplotypes in R. e. siamensis were unique to their
respective populations with one haplotype (H2) observed in the Hainan Island, two haplotypes (H3 and H5)
in Dusit Zoo, Thailand, and one haplotype (H4) in Paris Zoo, France. All the unique individuals of the captive
(n = 23) and wild populations of R. e. eldii (n = 27) identified using 19 microsatellite loci shared a single control
region haplotype.
Scientific Reports | (2021) 11:2564 | https://doi.org/10.1038/s41598-021-82183-7 3
Vol.:(0123456789)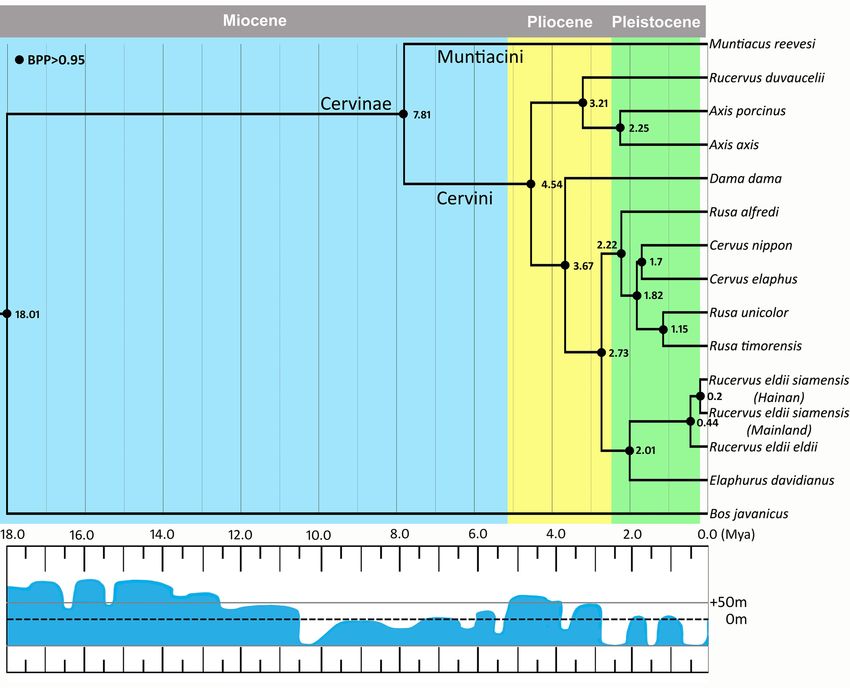
www.nature.com/scientificreports/
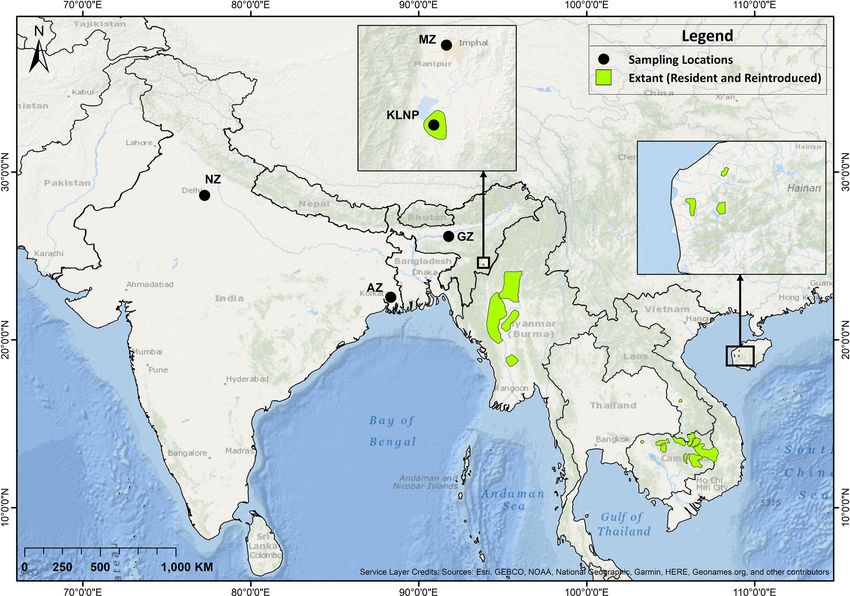
Figure 3. Phylogenetic tree of three Eld’s deer (Rucervus eldii) subspecies obtained from the Bayesian analysis
of mitochondrial control region sequences (447 bp). Bayesian Posterior Probability (BPP) values are provided at
respective nodes.
The median-joining network revealed three haplotype clusters among the Eld’s deer subspecies (Fig. 2b). R.
e. eldii was separated from R. e. thamin and R. e. siamensis by a minimum of 9 and 16 mutational steps, respec-
tively. Moreover, the haplotype network differentiated the mainland and HI populations of R. e. siamensis by ten
mutational steps. In comparison, mainland populations of R. e. siamensis were separated by 13 mutational steps
from R. e. thamin. Furthermore, the HI population showed a sequence variation of ~ 2.7% with both the mainland
populations of R. e. siamensis and R. e. thamin at the control region (see Supplementary Table S1 online). Bayesian
Analysis of Population Structure (BAPS) based on non-spatial clustering with admixture analysis using control
region sequences recovered four major genetic clusters among the Eld’s deer subspecies (Fig. 2a). Interestingly,
the mainland and HI populations of R. e. siamensis were segregated into two genetic clusters. The identified
clusters were significantly differentiated with Fst values ranging from 0.347 to 1.00 (see Supplementary Table S1
online). Phylogenetic analysis of the control region based on the Bayesian approach recovered two statistically
supported clades and recovered non-monophyletic relationships among Eld’s deer subspecies (Fig. 3). The first
clade of R. e. siamensis comprised of two sub-clades with mainland and HI populations nested as sister groups.
The second clade suggested an ambiguous association as R. e. eldii was nested within the R. e. thamin populations.
Divergence times and phylogenetic analyses. Sequencing of the complete mitochondrial genome of
R. e. eldii obtained a sequence of 16,357 bp comprised of 13 Protein Coding Genes (PCGs), 22 tRNA genes,
two rRNA genes, and a non-coding control region (see Supplementary Fig. S1 online). All the three subspecies
of Eld’s deer exhibit unique control region haplotypes with no haplotype sharing across the subspecies. Subse-
quently, the mitogenomes obtained from the GenBank were assigned to their respective subspecies based on the
geographic range and signatures of the mtDNA control region. We identified all the three sequences obtained
from GenBank to be of R. e. siamensis (Accession No. JN632697, NC014701 and HM138200). Further, the HI
and mainland populations of R. e. siamensis also exhibited unique control region haplotypes. Therefore, we
Scientific Reports | (2021) 11:2564 | https://doi.org/10.1038/s41598-021-82183-7 4
Vol:.(1234567890)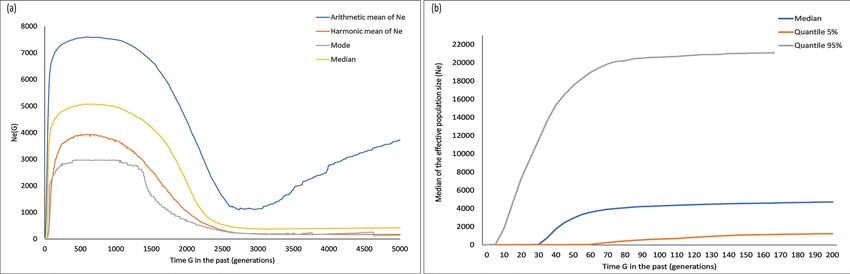
www.nature.com/scientificreports/
Figure 4. Time-calibrated phylogenetic tree of the tribe Cervini extending from 18 Mya to present based
on Bayesian analysis of mitochondrial genomes. Approximate estimates of the eustatic sea level changes
are presented under the chronogram35. The current sea levels are represented by the dashed line (0 m). The
geological time scale was acquired from the Geological Society of America.
assigned two mitogenomes to the HI population (NC014701 and HM138200) and one to the mainland popula-
tion based on the similarity indices of the blast search and estimated the divergence between these populations
of R. e. siamensis. The obtained value for the index of substitution saturation (Iss)32 for the analysed mitogenome
dataset was 0.4093 and the critical Iss.c values for the symmetrical and asymmetrical trees were 0.8424 (P < 0.001)
and 0.6743 (P < 0.001), respectively. Both the values of Iss.c were significantly higher than the observed Iss values.
Therefore, the complete mitogenome dataset was found suitable for phylogenetic and divergence analysis.
Divergence times. The divergence time estimation based on Bayesian analysis of 13 PCGs, two rRNA genes
(12S and 16S), and control region sequences obtained a strongly supported time-calibrated tree, which is con-
sistent with the previous phylogenetic studies26,27 (Fig. 4). Approximations of time to the most recent common
ancestor (TMRCA) with 95% Highest Posterior Densities (HPD) is provided in Supplementary Table S2 online.
The details of parameter convergence of divergence analyses are provided in Supplementary Fig. S2 online. The
estimates of molecular divergence revealed simultaneous diversification of two evolutionary lineages within the
tribe Cervini. We recovered an early divergence of common ancestors of the genera Axis and Rucervus ~ 4.5 mil-
lion years ago (Mya) (95% HPD 3.6–5.4) from the main phylogenetic stock of tribe Cervini. The split between
Eld’s deer and the Cervus-Rusa group occurred around 2.7 Mya (95% HPD 2.1–3.3) during the Late Pliocene.
Subsequently, the diversification of Cervus and Rusa species took place around 1.8 Mya (95% HPD 1.4–2.2).
However, early separation of Philippine spotted deer (Rusa alfredi) from the common ancestors of the Cervus/
Rusa group around 2.2 Mya (95% HPD 1.7–2.7) indicates that R. alfredi is the oldest form of living rusine deer.
Simultaneously, the divergence of Elaphurus davidianus and R. eldii took place ~ 2.0 Mya (95% HPD 1.5–2.5)
during the Early Pleistocene period. Within R. eldii, we obtained two diversification events. The divergence of
R. e. eldii from R. e. siamensis which occurred ~ 0.4 Mya (95% HPD 0.3–0.5), followed by the divergence of HI
and the mainland populations of R. e. siamensis ~ 0.2 Mya (95% HPD 0.1–0.2).
Phylogenetic analysis. Phylogenetic reconstruction of tribe Cervini based on 13 PCGs, two rRNA genes
and control region sequences using the Bayesian approach yielded a statistically supported phylogenetic tree of
tribe Cervini (see Supplementary Fig. S3 online). Bos javanicus was nested at the root of the phylogenetic tree as
Scientific Reports | (2021) 11:2564 | https://doi.org/10.1038/s41598-021-82183-7 5
Vol.:(0123456789)www.nature.com/scientificreports/
Figure 5. Estimates of effective population size (Ne) of R. e. eldii in KLNP based on 19 microsatellite loci using
approximate likelihood MCMC approach in VarEff v.1.2 package in R (a) Ne estimates from present to 5000
generations in the past and (b) present to 200 generations in the past.
an out-group. Within tribe Cervini, we recovered the genera Axis, Cervus, and Dama to be monophyletic (Bayes-
ian Posterior Probability, BPP = 1). Fallow deer (Dama dama) and Persian fallow deer (Dama mesopotamica),
chital (Axis axis) and hog deer (Axis porcinus) were allied together as sister species in their respective clades.
Within the genus Cervus, all three species; red deer (Cervus elaphus), sika deer (Cervus nippon) and white-lipped
deer (Cervus albirostris) were monophyletic (BPP = 1). However, the genus Rucervus and Rusa were observed
to be paraphyletic. R. duvaucelii was nested with the genus Axis (BPP = 1) while R. eldii was associated with
Pére David’s deer (Elaphurus davidianus) as a sister group. The monophyly of genus Rusa was disrupted by the
disjunct position of R. alfredi, which was allied to the clade comprised of species of the genus Cervus and Rusa
(R unicolor/R. timorensis).
Microsatellite genetic variation in R. e. eldii. We successfully genotyped 66 out of total 79 faecal pellet
samples, with 48 samples from KLNP and 18 samples from captive populations including Manipur Zoological
Garden (n = 6), Assam State Zoo (n = 8) and National Zoological Garden (n = 4). The remaining samples from
Manipur Zoological Garden (n = 4) and Alipore Zoological Garden (n = 9) failed to amplify, therefore excluded
from the microsatellite analysis (see Supplementary Table S3 online). Based on multi-locus match, we identi-
fied 24 unique individuals out of 48 samples genotyped from KLNP and 18 individuals from 18 samples from
captive populations. Therefore, a total of 42 samples (Wild = 24 and Captive = 18) were further used to perform
population genetic analyses. We obtained low levels of microsatellite genetic variation in captive populations
(Mean ± SE) (Ho = 0.13 ± 0.04; He = 0.31 ± 0.05) compared to the wild population of R. e. eldii (Ho = 0.31 ± 0.05;
He = 0.47 ± 0.03) in KLNP (see Supplementary Table S4 online). The mean allelic richness for the wild population
was 2.68 ± 0.15 and for the captive population was 2.11 ± 0.21. All the 19 microsatellite loci were polymorphic
for the wild population of KLNP and obtained a total of 51 alleles. However, four loci (RT1, DF/R, BM4107, and
AF232760) were monomorphic in the captive populations with a total of 40 alleles observed across 19 microsat-
ellite loci. Most of the loci showed significant deviation from the Hardy–Weinberg equilibrium (HWE), which
can be attributed to heterozygosity excess and inbreeding. The Bayesian clustering analysis using STRUCTU
RE revealed the presence of two genetic clusters based on ΔK statistics (see Supplementary Fig. S4 online). The
KLNP individuals were assigned to the first cluster whereas all the individuals of captive origin were assigned
to the second cluster (see Supplementary Fig. S5 online). The genetic differentiation estimates between the cap-
tive and wild populations of R. e. eldii obtained low to moderate levels of differentiation based on the fixation
measures (Fst = 0.26; P < 0.001); Gst = 0.15 (P < 0.001) and allelic differentiation (Jost’s D = 0.12; P < 0.001). The
estimates of the inbreeding coefficient (F) were 0.342 ± 0.100 and 0.566 ± 0.098 in the wild and captive popula-
tions, respectively.
Past population changes in R. e. eldii. The bottleneck detection using heterozygosity excess showed
strong signature of genetic bottleneck. The one-tailed Wilcoxon test for heterozygosity excess was significant
for all the three mutation models (P < 0.001), viz. Infinite Allele Model (IAM); Two-phase Model (TPM) and
Stepwise Mutation Model (SMM) (see Supplementary Table S5 online). The allelic frequency distribution also
recovered a mode-shift curve, which confirms that the wild population of R. e. eldii has gone through a genetic
bottleneck.
Estimates of past effective population size based on the approximate likelihood Markov chain Monte Carlo
(MCMC) method obtained low Ne estimates until ~ 3000–5000 generations ago (median = 383–420) with a stable
population trend until ~ 3000 generations (Fig. 5a). Subsequently, the population showed a massive increase
in the effective population size for ~ 3000 generations until the recent bottleneck event was detected at ~ 300
generations ago (median = 4876) (Fig. 5a). The ancestral effective population size as inferred from the esti-
mates of the posterior distribution revealed a large population size during the past ~ 300–1000 generations
(median 4281–4978) which corresponds to around 1500–5000 Ybp, considering the generation time of R. e.
eldii as 5 years7. The posterior distribution of time to the most recent common ancestor ( TMRCA) supported the
Scientific Reports | (2021) 11:2564 | https://doi.org/10.1038/s41598-021-82183-7 6
Vol:.(1234567890)www.nature.com/scientificreports/
demographic estimates with the first peak observed at ~ 50 generations and a second peak at ~ 3000 generations,
indicating the time at which the population underwent genetic bottlenecks (see Supplementary Fig. S6 online).
Assessment of the contemporary effective population size of wild population of R. e. eldii showed that the
population underwent a steady decline during the past ~ 100–200 generations (median 4281–4717) (Fig. 5b)
around 500–1000 Ybp. During the last ~ 30 − 100 generations, the decline accelerated and the population expe-
rienced a sudden, steep and continuous drop in the population size (median 45–4281), which accounts for a
substantial decline in the effective population size of R. e. eldii during this period. However, the estimates of
contemporary effective population size based on the linkage disequilibrium method were comparatively lower
(median = 7.5, 95% CI 4.7–10.8) than those obtained using the MCMC approximation method (median = 20)
(see Supplementary Table S6 online).
Discussion
Demographic, environmental, and genetic factors profoundly affect the viability of p opulations33. Genetic diver-
sity has potential impacts on the persistence and adaptation of populations to environmental c hanges34. Small
populations generally exhibit low genetic variation due to population bottleneck and founder effects induced by
natural as well as anthropogenic f actors1. Eld’s deer occur in small and fragmented populations, and its manage-
ment largely depends on human-assisted maintenance of genetic diversity through population reintroductions.
Hence, information on the genetic variability of Eld’s deer populations across its distribution range is of prime
importance for planning conservation strategies. This study examines the most extensive mtDNA control region
dataset available to date, to provide information on the levels of genetic diversity, phylogeographic and phylo-
genetic patterns of Eld’s deer subspecies.
Additionally, this is the first attempt to estimate the divergence events among the Eld’s deer subspecies using
complete mitochondrial genomes. Due to the unavailability of biological samples from other subspecies, we
restricted the microsatellite analyses to R. e. eldii and delivered a comprehensive insight into the demographic
history and past effective population size of this subspecies. The results of this study, combined with low popula-
tion densities and increasing anthropogenic threats, raise serious conservation concerns and indicate increased
susceptibility of Eld’s deer to genetic, demographic, and stochastic factors.
Phylogeography, divergence times and phylogenetics of R. eldii. The phylogeographic analyses
based on the control region (447 bp) indicated the presence of genetic structure among the Eld’s deer subspecies.
Consistent with the wide geographical distribution, persistence in multiple populations, and comparatively sta-
ble demographic history, R. e. thamin exhibited the highest number of haplotypes (18) followed by R. e. siamensis
(4) and R. e. eldii (1) which occurs in small and isolated populations (Fig. 2b). We observed no segregation of
haplotypes based on sampling locations in R. e. thamin and R. e. eldii. However, in R. e. siamensis the haplotypes
were unique to their respective analysed populations. Further, the captive and wild populations of R. e. eldii
showed complete homogeneity in 447 bp of the control region. Contrary to previous phylogenetic s tudies29,31,
our phylogenetic analysis did not support the monophyly of Eld’s deer subspecies (Fig. 3). Instead, we observed a
close phylogenetic association between R. e. eldii and R. e. thamin, which is consistent with the close geographi-
cal distribution of these two subspecies. Despite its phylogenetic affinity to R. e. thamin, R. e. eldii possesses
splayed hooves, a unique morphological adaptation for marshy h abitats24. The presence of unique control region
haplotypes and the observed patterns of phylogeographic structuring (Fig. 2) indicate a substantial amount of
genetic differentiation between the mainland and HI populations of R. e. siamensis. Phylogenetic reconstruction
based on the control region also supported the reciprocal monophyly of HI and mainland populations of R. e.
siamensis (Fig. 3). Additionally, the genetic differentiation measures (Fst) and nucleotide sequence variation
indicated significant differentiation between these isolated populations of R. e. siamensis (see Supplementary
Table S1 online).
Divergence analysis based on mitochondrial genomes also supported the differentiation patterns observed
between the HI and mainland populations of R. e. siamensis. This subspecies exhibits two divergent mitochon-
drial lineages corresponding to the HI and mainland populations, which diverged during the Late Pleistocene
~ 0.2 Mya (95% HPD 0.1–0.2) (Fig. 4). The low sea levels during this p eriod35 resulted in the emergence of land
bridges, which would have facilitated the dispersal of R. e. siamensis from mainland China to Hainan Island. A
rise in the eustatic sea levels during Holocene35 interrupted the terrestrial connectivity and would have resulted
in isolating the Hainan Island from the mainland populations of R. e. siamensis (Fig. 4). During the periods of
low sea levels of Plio-Pleistocene, the emergence of land bridges comprising of tropical forests and savannah cor-
ridors facilitated faunal dispersion between Indochina, Southeast Asia and the Sundaic i slands36 possibly through
the Siva-Malayan, Sino-Malayan and Taiwan-Philippine Archipelago c orridors37. These events are supported by
the patterns of genetic differentiation observed in this study between the isolated HI and mainland populations
of R. e. siamensis. Therefore, intermixing the HI and mainland populations of R. e. siamensis to ameliorate the
levels of genetic diversity is not a pragmatic proposal; instead, increasing the population size and establishment
of meta-populations in the wild would practically benefit its long-term survival in the wild.
The divergence between R. e. eldii and R. e. siamensis took place around 0.4 Mya (95% HPD 0.3–0.5). During
the Late Pleistocene and Early Holocene period, Northeast India was dominated by open grassland habitats38, 39,
which would have facilitated the dispersal of grassland dependent species during the period. The dynamic influ-
ences of climatic and environmental factors during the Pleistocene have significantly driven the divergence and
phylogeographic structure of several s pecies40. We hypothesise that different ecological niches occupied by the
Eld’s deer subspecies might have facilitated their diversification. Overall, the mitochondrial genomes investigated
in this study revealed two major divergence events among the Eld’s deer subspecies during Late Pleistocene.
Scientific Reports | (2021) 11:2564 | https://doi.org/10.1038/s41598-021-82183-7 7
Vol.:(0123456789)www.nature.com/scientificreports/
However, one limitation of our study is the unavailability of the complete mitochondrial genome of R. e. thamin,
which would have provided more profound insights into the evolutionary history of Eld’s deer.
Further, our results indicated diversification of two evolutionary lineages in tribe Cervini which occurred
around 4.5 Mya (95% HPD 3.6–5.4) during Pliocene. The first lineage gave rise to species of the genus Rucervus
and Axis, and the latter radiated into the genera Rusa, Cervus, Dama, and Elaphurus including the Eld’s deer
(Fig. 4). Eld’s deer is presently classified in the genus Rucervus based on the morphological similarities with R.
duvaucelii and the now-extinct R. schomburgki24. However, these morphological similarities possibly characterise
convergence rather than phylogenetic r elatedness41. Moreover, our divergence and phylogenetic analyses revealed
an ancestral divergence of Axis and Rucervus sp. from the main phylogenetic stock of tribe Cervini (Fig. 4 and
Supplementary Fig. S3 online). Therefore, based on the significant evolutionary and systematic distance of Eld’s
deer from other species of the genus Rucervus, we propose to assign Eld’s deer to genus Cervus as Cervus eldii
together with E. davidianus and all four species of genus Rusa (R. unicolor, R. timorensis, R. alfredi, and R. mari-
anna) (see Supplementary Fig. S3 online). These recommendations are in agreement with the previous molecular
phylogenetic studies26,27. The classification proposed in this study will resolve the taxonomic perplexity of Eld’s
deer and other species of tribe Cervini to its phylogenetically most appropriate genus.
Microsatellite genetic variation in R. e. eldii. The microsatellite analyses revealed low levels of genetic
diversity in both captive and wild populations of R. e. eldii based on 19 microsatellite loci (see Supplementary
Table S4 online). However, the wild population exhibits relatively higher levels of microsatellite genetic diversity
compared to the captive populations, which is consistent with KLNP being the source population of all the cap-
tive stock. The population structure analysis using microsatellite revealed the presence of two genetic clusters
(K = 2) and assigned the captive and wild populations to separate genetic clusters (see Supplementary Fig. S5
online). The captive population of R. e. eldii was established at Alipore Zoological Garden, West Bengal in 1956,
by acquiring a pair of wild individuals from KLNP. All the existing populations in captivity are derived from the
captive stock of Alipore Zoological Garden and have never been supplemented with individuals from the w ild42.
Hence, the assignment of all the captive individuals in a single cluster supports the evidence that all the captive
populations are derived from the initial captive stock of Alipore Zoo. Further, no gene flow between the wild
and captive populations and a small number of founder individuals of captive stock would have resulted in the
observed patterns of genetic distinctiveness between the captive and wild populations of R. e. eldii.
The populations of R. e. siamensis in Datian, Bangxi, and Ganshiling Nature Reserves of Hainan Island were
reported to exhibit low mean heterozygosity and genetic polymorphism estimates with Ho = 0.34 ± 0.03, 0.33 ± 0.01
and 0.36 ± 0.03 and He = 0.28 ± 0.01, 0.32 ± 0.00 and 0.36 ± 0.03, respectively11. The observed Ho and He for R. e.
eldii in KLNP were estimated to be Ho = 0.31 ± 0.05 and He = 0.471 ± 0.033 (see Supplementary Table S4 online)
which indicates that R. e. eldii in KLNP and R. e. siamensis in Hainan Island exhibit similar levels of microsatellite
diversity. Both these subspecies have experienced severe range contraction during the last century and recovered
from a small number of founder i ndividuals7, therefore exhibit low levels of genetic polymorphism. Moreover,
a recent study43 based on similar microsatellite markers estimated the mean heterozygosity (Ho = 0.42 ± 0.02
and He = 0.51 ± 0.03) of A. porcinus, which co-occurs with R. e. eldii in KLNP sympatrically. Both A. porcinus
and R. e. eldii exhibit low to moderate levels of microsatellite genetic variability, which can be attributed to their
single, small and isolated populations, inhabiting the space-constraint habitat in KLNP. Most of the selected
microsatellite loci significantly deviated from the HWE, possibly due to the small population size, non-random
mating, and impacts of inbreeding44 in R. e. eldii. In summary, the existing wild and captive populations of R.
e. eldii exhibit low levels of microsatellite genetic diversity. The wild population in KLNP is highly susceptible
to inbreeding because of the increased probability of interbreeding of related individuals due to its small and
geographically isolated population.
Past population changes in R. e. eldii. The low estimates of effective population size are congruent with
the genetic bottleneck events detected in this study. The one-tailed Wilcoxon test for heterozygosity excess and
allelic frequency distribution indicated that the wild population of R. e. eldii has gone through genetic bottleneck
(see Supplementary Table S5 online). Posterior distribution of time to the most recent common ancestor ( TMRCA)
indicated two genetic bottleneck events (see Supplementary Fig. S6 online). The first event occurred ~ 3000 gen-
erations ago, which resulted in a mild fluctuation in the number of individuals (Fig. 5a). Subsequently, a massive
upsurge in the effective population size was observed, indicating a range expansion event. Based on the genera-
tion time of Eld’s deer (5 years)7, we assume that this event took place ~ 15,000 Ybp.
During the Late Pleistocene-Early Holocene, Northeast India had experienced dynamic fluctuations in cli-
matic conditions, significantly affecting the past vegetation structure of the region45–47. The existing population
of R. e. eldii inhabits the floating meadows of KLNP situated in the southern fringes of Loktak Lake in Manipur.
The existing lake is the remnant of the original lake, which once occupied almost the entire Manipur valley39
and is known to have originated around 25,000 Ybp48. Since the course of its formation, the Loktak Lake under-
went a prolonged phase of hydrodynamic and morphological c hanges48. Therefore, we presume that the lake
during this period would have remained uninhabitable for R. e. eldii. The low estimates of effective population
size during ~ 3000–5000 generations ago (median 383–420) around 15,000–25,000 Ybp are therefore consistent
with the biogeographical history of the region. Subsequently, the appearance of open grasslands with aquatic
herbaceous associates in the Loktak Lake region during Late Holocene38,39 indicates the emergence of extensive
habitat conditions favourable for grassland dependent species, such as R. e. eldii. As shown in our results, an
increase in the ancestral population size during the past ~ 2500–300 generations (median 540–4876) (Fig. 5a),
signifies a range expansion event which would have been triggered due to the increased habitat availability during
this period. Range expansion events and genetic drift often have negative impacts on the genetic diversity of the
Scientific Reports | (2021) 11:2564 | https://doi.org/10.1038/s41598-021-82183-7 8
Vol:.(1234567890)www.nature.com/scientificreports/
species49,50. Furthermore, our results indicated a second genetic bottleneck ~ 1500 Ybp (~ 300 generations ago;
median = 4876), which caused a steady decline in the population size till past ~ 100 generations (median = 4281)
(Fig. 5b). Subsequently, the population underwent a rapid reduction in the effective population size during the
past ~ 35–100 generations (median 791–4281). During this period, the Manipur valley underwent a drastic
climatic transition, and warm and dry conditions replaced the prevailing warm and humid climatic conditions.
Consequently, a reduction in the Loktak Lake dimensions along with the associated aquatic vegetation38 possibly
reduced the habitat available for R. e. eldii which potentially resulted in a reduction in the effective population
size. The intensification of human activities during the Late Holocene period is likely to accelerate the reduc-
tion and fragmentation of the suitable habitats of Eld’s deer in the region. We hypothesise that the cumulative
impacts of these factors would have influenced the demographic history of Eld’s deer and consequently resulted
in the reduction of genetic diversity.
Implications for conservation and management. The findings of this study provide significant impli-
cations for planning conservation of Eld’s deer across its distribution range. Our results demonstrate that R. e.
siamensis exhibits two divergent mitochondrial lineage, with long divergence history and substantial amount of
genetic differentiation. However, due to sampling restrictions, we were unable to either confirm or invalidate the
subspecies status of Hainan’s Eld’s deer. We recommend a combined assessment of genetic variability between
these populations to confirm the patterns of mtDNA variation highlighted in this study. If confirmed, the HI
populations might represent a separate subspecies of Eld’s deer. Until then, we recommend to identify the HI and
mainland populations of R. e. siamensis as distinct units for conservation and suggest to prevent any intermixing
of these lineages. As proposed by Zhang et al.11, we support the reintroduction and recovery programs for R. e.
siamensis within the historical distribution range throughout the Hainan Island.
Low levels of genetic diversity, past effective population size, and widespread genetic bottleneck events in R.
e. eldii accentuate its vulnerability to loss of evolutionary potential due to resulting genetic erosion, therefore
necessitating immediate conservation interventions. The contemporary estimates of the effective population size
of R. e. eldii are low (median = 7.5, 4.7–10.8 at 95% CI), far below the minimum threshold required to prevent
inbreeding depression (Ne > 100) and to maintain long-term evolutionary potential (Ne > 1000) as proposed by
Frankham et al.51. The HI populations of R. e. siamensis also contain low genetic diversity11, but large population
size, which will undoubtedly benefit its population recovery in the wild. Unlike the HI populations, R. e. eldii
exists as a single isolated wild population in a space-constrained habitat in KLNP with low population abundance
in the wild14. Therefore, R. e. eldii is exceedingly susceptible to extinction as any further reduction in the number
of breeding individuals will have detrimental effects on the viability of the population. Given these factors, it is
crucial that improved conservation efforts with overarching strategies are implemented with immediate objectives
to maintain population abundance in the wild as well as restoration of genetic diversity. Based on the observed
patterns of genetic diversity and population genetic structure of R. e. eldii, we recommend initiating the conserva-
tion breeding using individuals from both captive and wild populations. Subsequently, the captive-bred founder
stock can be used to ameliorate the levels of genetic diversity of the wild population by restocking the existing
population in KLNP and establishing alternative populations to ensure its long-term persistence in the wild.
Furthermore, high human population density and increasing resource dependence, together with encroach-
ment and changing land-use patterns in and around KLNP and Loktak Lake are leading to overexploitation
of natural resources, thereby affecting the ecological integrity of the P ark14. Therefore, planning immediate
conservation strategies to mitigate the prevalent anthropogenic pressures, and arrest any further change in the
existing land-use regime will benefit in protecting the ecological integrity of the Loktak Lake including KLNP,
thereby ensuring the long-term survival of R. e. eldii in the wild. Any further delay in mitigating these conserva-
tion challenges may lead to an irreversible damage to the genetic diversity of the species.
The long-term survival of Eld’s deer in the wild largely relies on human-assisted maintenance of genetic
diversity through population reintroductions, restocking, and conservation breeding. However, the lack of range-
wide information on genetic variation raises apprehensions on the effectiveness of these strategies. The need for
mapping the spatial genetic variation using an extensive set of mitochondrial and nuclear markers cannot be
overstated, especially given the critical status of Eld’s deer across its distribution range. The information gener-
ated in this study will aid in evaluating the efficacy of the ongoing population recovery programs adopted for
Eld’s deer subspecies. Moreover, a collaborative approach among various institutions and policymakers across
Eld’s deer range countries is crucial to support the conservation efforts for ensuring the long-term survival of
this species in the wild.
Materials and methods
Sampling and DNA extraction. We collected non-invasive biological samples of R. e. eldii includ-
ing freshly defecated faecal pellets from Keibul Lamjao National Park (KLNP), Manipur (n = 48) and captive
populations (n = 31) of Alipore Zoological Garden, West Bengal (n = 9), Manipur Zoological Garden, Manipur
(n = 10), Assam State Zoo, Assam (n = 8) and National Zoological Park, New Delhi (n = 4) during 2006–2009
(see Supplementary Table S3 online). We also collected tissue samples (n = 3) from the remains of dead animals
from KLNP during 2019 (see Supplementary Table S7 online) (Fig. 1). Tissue and faecal pellet samples were
stored in absolute ethanol at − 20 °C for DNA extraction. Total genomic DNA from tissue and faecal samples
were extracted using QIAamp DNA Blood and QIAamp DNA Stool kit (QIAGEN) respectively following the
manufacturer’s protocols. Tissue samples were used to sequence the complete mitochondrial genomes and fae-
cal pellets for sequencing the mtDNA control region and microsatellite analyses of R. e. eldii. The tissue samples
were obtained from remains of naturally dead animals and therefore, did not require the approval of the animal
ethical committee. The samples were collected with due permissions from the Principal Chief Conservator of
Scientific Reports | (2021) 11:2564 | https://doi.org/10.1038/s41598-021-82183-7 9
Vol.:(0123456789)www.nature.com/scientificreports/
Forests and the Park administration of Manipur. All the field and laboratory experiments were executed under
the pertinent guidelines.
PCR and sequencing. We sequenced the control region (447 bp) using Cerv.tPro: 5′-CCACYATCAACA
CCCAAAGC-3′ and CervCRH: 5′-GCCCTGAARAAAGAACCAGATG-3′29. Sequencing of the mitochondrial
genome was performed using 23 pairs of primers (see Supplementary Table S8 online) described by Hassanin
et al.52 with an overlapping region of 80–120 base pairs to remove any gaps among the amplicons. Due to the
hyper-variable nature of the control region, bi-directional sequencing using both forward and reverse primers
was performed. Polymerase Chain Reactions (PCR) for both control region and mitogenome amplifications were
carried out in 20 µL volumes containing 10–20 ng of the total genomic DNA, 10 µL of 2× PCR buffer (Applied
Biosystems), 0.2 mg/mL Bovine Serum Albumin (BSA), 0.3 µM dNTPs, 0.3 µM of forward and reverse primers
with 0.1 µL (0.5 units) of DreamTaq DNA Polymerase (ThermoFisher Scientific). PCR conditions followed an
initial denaturation at 94 °C for 5 min, followed by 35 cycles at 95 °C for 35 s, 55 °C for 45 s, and 72 °C for 1 min
30 s. Reactions were terminated with a final extension of 10 min at 72 °C. We used positive and negative controls
to monitor the efficacy and reliability of the reactions. PCR products were visualised for positive amplicons
using 2% agarose gel electrophoresis using ethidium bromide and were examined under UV illuminator. Posi-
tive amplicons of control region and 23 fragments of the mitochondrial genomes were sequenced using Sanger
sequencing in ABI 3500XL Genetic Analyser using BigDye v.3.1 sequencing kit (Applied Biosystems).
Microsatellite amplification and genotyping. We used 19 microsatellite loci53–63 (see Supplementary
Table S4 online) for assessing the genetic variability in the wild (n = 48) and captive populations of R. e. eldii
(n = 31) using non-invasively collected fresh faecal pellet samples. PCR was performed in 10 µL reaction volumes
with 2.0–3.0 µL of total genomic DNA, 5 µL of QIAGEN Multiplex PCR Buffer Mix (QIAGEN) and 0.2 µM of
each labelled forward and 0.2 µM of the non-labelled reverse primers. PCR cycles of the microsatellite loci were
performed at an initial denaturation at 94 °C for 15 min followed by 40 cycles of 94 °C for 30 s with annealing
temperatures ranging from 48 to 60 °C for 45 s, 72 °C for 40 s, and final elongation at 72 °C for 30 min. The
products were then genotyped in ABI 3130 Genetic Analyser using LIZ 500 Size Standard (Applied Biosystems).
Positive and negative controls were used to monitor the efficacy and reliability of the reactions.
Data analyses
Phylogeography and genetic differentiation. We obtained a global alignment of 200 control region
sequences (447 bp) representing all the three subspecies of Eld’s deer (see Supplementary Table S3 online). The
dataset was comprised of published control region sequences downloaded from GenBank (n = 150) along with
24 unique individuals identified in the wild population of R. e. eldii out of total 48 faecal pellet samples collected
from KLNP and captive populations (n = 23) from Alipore Zoological Garden (n = 9) Manipur Zoological Gar-
den (n = 10) and National Zoological Park (n = 4) using 19 microsatellite markers. We also included the control
region sequences (n = 3) obtained from the complete mitochondrial genomes sequenced in this study. The faecal
pellet samples obtained from Assam State Zoo (n = 8) were excluded from phylogeographic analysis because
they failed to amplify at the control region. The control region sequences were aligned using the CLUSTAL W
algorithm64 in program MEGA X 65. Haplotype (hd) and nucleotide diversities (Pi) were calculated using pro-
gram DnaSP v.5.1066. Haplotypes were derived by removing non-informative sites, and gaps were considered.
The spatial relationship among the haplotypes was reconstructed using the median-joining network in PopART
v.1.767. Bayesian Analysis of Population Structure (BAPS) v.6.068,69 was used to identify the number of genetic
clusters. We performed the non-spatial clustering with admixture analysis using an assumed number of clusters
(K) ranging from 1 to 30 with ten replicates for each value of K and 500 iterations. Pairwise genetic differentia-
tion (Fst) of the identified clusters were calculated using program DnaSP v.5.1066. Phylogenetic relationships
among the Eld’s deer subspecies were reconstructed using the partial fragment of the control region based on
the Bayesian approach as implemented in program MrBayes v.3.270. The most appropriate model for nucleotide
substitution was selected based on the Akaike Information Criterion (AIC)71 values using program jModelTest
v.2.1.372,73. We performed two MCMC chains of 30 million simulations sampling at every 10,000 generations
and discarded the initial 3 million runs as burn-in. The output tree topologies were edited using FigTree v.1.4.2
(http://tree.bio.ed.ac.uk/sofware/fgtree/).
Divergence times and phylogenetic analyses. The complete mitochondrial genome of 16, 357 bp
sequenced from three individuals of R. e. eldii were obtained by aligning the 23 overlapping sequence fragments
using SeqScape software v.3.0 (Applied Biosystems). The alignments were visualised manually and Phred Qual-
ity Score of each nucleotide variation (Q ≥ 20) was selected as a threshold for considering the variable sites (https
://apps.thermofisher.com/apps/spa/#/apps). The mitochondrial genome annotation was performed in CGView
Server74. The complete mitochondrial sequences were submitted to GenBank (Accession No: MT555112–
MT555114). Further, we included the published complete mitogenomes of 10 species of tribe Cervini, Bos
javanicus, and Muntiacus reevesi obtained from GenBank to estimate the divergence events and reconstruct
the accurate phylogenetic position of Eld’s deer (see Supplementary Table S7 online). We used 13 PCGs, two
rRNA genes and control region sequences to perform the divergence and phylogenetic analyses. All the analysed
mitochondrial genes were aligned separately using CLUSTAL W algorithm64 in program MEGA X65. Gaps were
considered in the sequence alignments of each gene because of the variable lengths of PCGs and control region
sequences among the analysed species. The aligned sequences of the mitochondrial genes were concatenated in
MEGA X65 to obtain the final alignment for performing further data analyses. The degree of substitution satura-
tion was calculated using program DAMBE to test whether the observed entropy is significantly lower than the
Scientific Reports | (2021) 11:2564 | https://doi.org/10.1038/s41598-021-82183-7 10
Vol:.(1234567890)www.nature.com/scientificreports/
entropy of full substitution saturation in the analysed sequences32,75. Divergence times were estimated using the
Bayesian approach as implemented in program BEAST v.1.8.276. PartitionFinder77 was used for selecting the
most appropriate data partitioning scheme of nucleotide substitution for evolutionary rate heterogeneity. Greedy
algorithm with linked branch length along with Bayesian Information Criterion as implemented in Partition-
Finder was used. Substitution models were selected with separate model estimation for 13 PCGs using different
codon positions and individually for rRNA and control region sequences. We used fossil information of the
oldest known fossils of (1) Cervidae (18.4 Mya)78 for the Bovidae/Cervidae split and tribe Muntiacini (8 Mya)79
as calibration points. We used the lognormal uncorrelated relaxed-clock model and Yule speciation process with
normally distributed prior parameters. We performed two independent divergence analyses with 50 million
generations, sampling at every 1000 generations with a 10% burn-ins.
Phylogenetic analysis to reconstruct the molecular phylogeny of tribe Cervini based on 13 PCGs, two rRNA
and control region sequences was executed in MrBayes v.3.270. The best suitable model for nucleotide substitu-
tion was obtained based on the lowest AIC values using jModelTest v.2.1.372, 73. We ran two MCMC chains of
50 million simulations sampling every 10,000 generations. We discarded the initial 5 million runs as burn-ins.
Parameter convergence and effective sample size (> 400) for divergence and phylogenetic analyses were analysed
in program TRACER v.1.6. TREEANNOTATOR v.1.8.2 (BEAST package) was used for annotating the output
tree with a burn-in of 10%. The output tree topologies were visualised and edited in FigTree v.1.4.2 (http://tree.
bio.ed.ac.uk/sofware/fgtree/).
Microsatellite genetic variation. We performed the identification of alleles using GeneMarker v.2.7.480.
The likelihood of two unrelated individuals and siblings sharing the same genotype (probability of identity, PID
and probability of identity for siblings, PID-Sibs) was executed in Gimlet v.1.3.381. The overall summary statistics
comprising of the total number of alleles per locus (Na), observed (Ho) and expected (He) heterozygosity, and
deviations from the Hardy–Weinberg equilibrium (HWE) were calculated in GenAlEx v.6.082. The Polymorphic
Information Content (PIC) values were estimated in program CERVUS v.3.0.783. We used model-based hierar-
chical Bayesian clustering approach implemented in program STRUCTURE v.2.3.484 to identify the presence of
genetic structure in R. e. eldii populations. We used an assumed number of clusters (K) ranging from 1 to 10. For
each K, we executed ten iterations with a burn-in of 50,000 followed by 5,00,000 MCMC simulations under the
admixture model with correlated allele frequencies. The optimal number of clusters in the sampled populations
were determined following Evanno et al.85 approach executed in the web version of STRUCTURE HARVESTER
v.0.6.9486. The assignment probability plot using individual membership coefficient was produced using pro-
gram DISTRUCT v.1.187. Further, the genetic differentiation estimates Fst, Gst and Jost’s D among the identified
clusters were estimated using program strataG88 package in R with 1000 bootstrap iterations.
Past effective population size. To detect the signatures of bottleneck events, we performed the transient
heterozygosity excess and mode-shift tests in program BOTTLENECK v.1.2.0289 assuming that microsatellite
mutations followed the Infinite Allele Model (IAM), Stepwise Mutation Model (SMM) or Two-phase Model
(TPM). In TPM we used 95% single-step mutational events at 12% variance89. We also performed the one-tailed
Wilcoxon test to determine the significance of the heterozygosity excess. The allelic distribution curve was ana-
lysed to determine whether the population is under mutation-drift equilibrium (L shaped curve) or not (mode
shift)90, 91.
We implemented the linkage disequilibrium m ethod92–94 to estimate the contemporary effective population
size using the bias-corrected version in program NeEstimator v.295. The linkage disequilibrium approach is the
most suited method for microsatellite data which has been proven to be relatively robust in assessing the effective
population size94. We also implemented the approximate likelihood MCMC approach using VarEff v.1.2 package
in R (https://qgsp.jouy.inra.fr/)96 to estimate the past changes in effective population size. This approach imple-
ments coalescence theory to generate posterior distributions of effective population size using an approximation
of likelihood based on different prior demographic parameters. It implements the distribution of motif distance
frequencies between alleles at the tested microsatellite loci96, 97. This method allows recovering the posterior
distribution of the time to the most recent common ancestor ( TMRCA) between two alleles and provides the time
of the bottleneck events in the number of generations in the past. We implemented a Two-phase Mutation Model
(TPM) to estimate the past changes in the population size with proportion for multi-step mutations of c = 0.2 and
an average microsatellite mutation rate (μ) of 2.0 × 10⁻³ per g eneration98–103. We estimated the effective population
size from present to 5000 generations in the past, assuming the generation time (G) of 5 years for Eld’s deer7.
Priors for past effective population size were derived from global estimates of Theta (θ = 4Neμ) executing the
Theta function in VarEff96. MCMC runs were performed using 10,000 batches with sampling at every ten batches
and a burn-in of 10,000. We performed trial runs by changing the analysis parameters and finally selected the
parameters recommended by Nikolic and C hevalet96 (see Supplementary Table S9).
Data availability
The sequence data generated in this study is submitted to the GenBank database, National Centre for Biotech-
nology Information under Accession Nos. MT555259–MT555301, MW033296–MW033299 and MT555112–
MT555114. The genotyping data used in this study is available in the supplementary section.
Received: 17 July 2020; Accepted: 18 January 2021
Scientific Reports | (2021) 11:2564 | https://doi.org/10.1038/s41598-021-82183-7 11
Vol.:(0123456789)You can also read