Digital trends in Europe 2021 - ICT trends and developments in Europe, 2017-2020 ITUPublications
←
→
Page content transcription
If your browser does not render page correctly, please read the page content below
ITUPublications           International Telecommunication Union
Europe region

     Digital trends in Europe 2021
     ICT trends and developments                  EUROPE

     in Europe, 2017-2020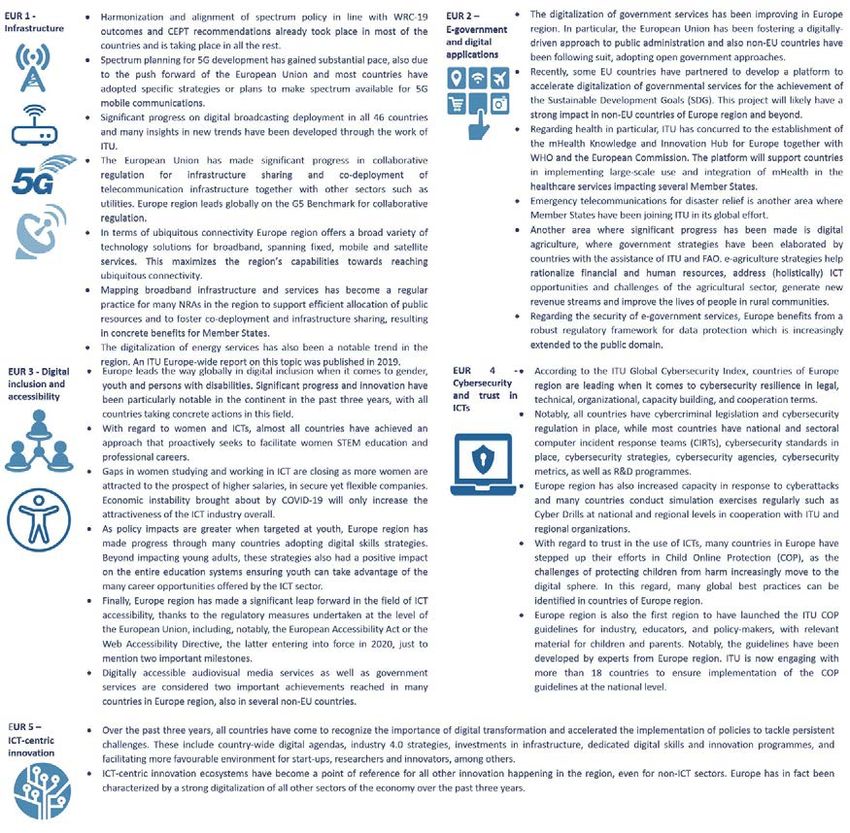
Digital trends in Europe 2021
   ICT trends and developments
           in Europe, 2017-2020
DISCLAIMER

The designations employed and the presentation of the material in this publication do not imply
the expression of any opinion whatsoever on the part of ITU concerning the legal status of any
country, territory, city or area or of its authorities, or concerning the delimitation of its frontiers
or boundaries.1 Dotted and dashed lines on maps represent approximate border lines for which
there may not yet be full agreement.

The mention of specific companies or of certain manufacturers’ products does not imply that they
are endorsed or recommended by ITU in preference to others of a similar nature that are not
mentioned. Errors and omissions excepted, the names of proprietary products are distinguished
by initial capital letters.

All reasonable precautions have been taken by ITU to verify the information contained in this
publication. However, the published material is being distributed without warranty of any kind,
either expressed or implied. The responsibility for the interpretation and use of the material lies
with the reader.

The opinions, findings and conclusions expressed in this publication do not necessarily reflect
the views of ITU or its membership.

ISBN

978-92-61-32991-4 (Paper version)

978-92-61-33001-9 (Electronic version)

978-92-61-33011-8 (EPUB version)

978-92-61-33021-7 (Mobi version)

1
    When lists of countries in the text are not in alphabetical order, they refer to indexes shown in corresponding
    figures and images.

                     Please consider the environment before printing this report.

                                                   © ITU 2021

Some rights reserved. This work is licensed to the public through a Creative Commons Attribution-Non-
Commercial-Share Alike 3.0 IGO license (CC BY-NC-SA 3.0 IGO).

Under the terms of this licence, you may copy, redistribute and adapt the work for non-commercial purposes,
provided the work is appropriately cited. In any use of this work, there should be no suggestion that ITU
endorse any specific organization, products or services. The unauthorized use of the ITU names or logos is
not permitted. If you adapt the work, then you must license your work under the same or equivalent Creative
Commons licence. If you create a translation of this work, you should add the following disclaimer along
with the suggested citation: “This translation was not created by the International Telecommunication Union
(ITU). ITU is not responsible for the content or accuracy of this translation. The original English edition shall
be the binding and authentic edition”. For more information, please visit https://creativecommons.org/
licenses/by-nc-sa/3.0/igo/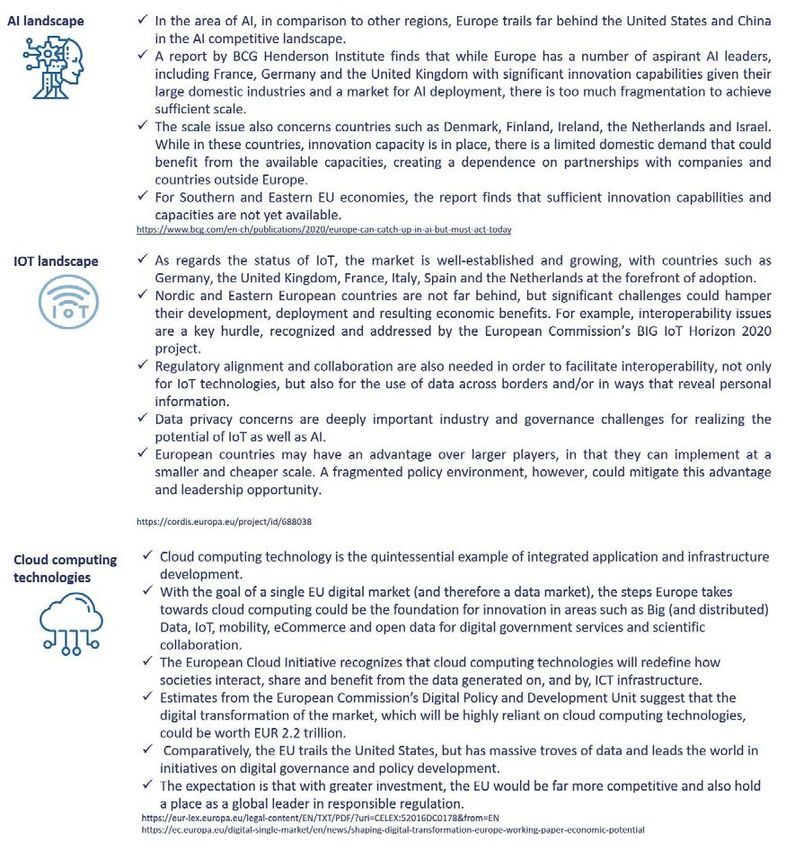
Summary

This report provides an overview of trends and developments in ICT infrastructure, access and
use in the Europe region, which includes 46 ITU Member States and is home to a population
of 686 million people. The report highlights changes in ICT adoption since the last World
Telecommunication Development Conference in 2017 (WTDC-17) and during the COVID-19
pandemic, tracks the evolution of regulation, and reviews progress and challenges of the ITU
regional initiatives for Europe. Its objective is to serve the ITU membership as a reference for
reviewing progress and identifying ICT development priorities in the Europe region.

                                               iii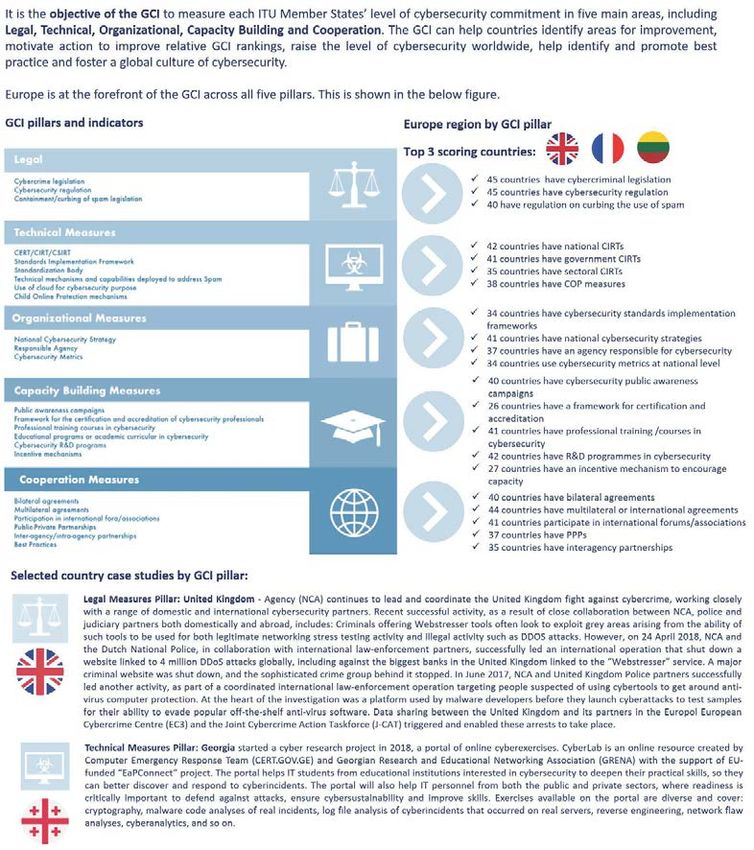
Table of Contents
Summary��������������������������������������������������������������������������������������������������������������������������������������������� iii
1. Overview ������������������������������������������������������������������������������������������������������������������������������������ 1
2. Digital trends in Europe ���������������������������������������������������������������������������������������������������������� 3
2.1 Mobile market developments�������������������������������������������������������������������������������������� 4
2.2 Satellite broadband developments ���������������������������������������������������������������������������� 6
2.3 Fixed-broadband market���������������������������������������������������������������������������������������������� 6
2.4 Internet access, use, skills, and gender����������������������������������������������������������������������� 8
2.5 ICT prices�����������������������������������������������������������������������������������������������������������������������12
2.6 Telecommunication revenues and investment��������������������������������������������������������13
2.7 Developments regarding cybersecurity ������������������������������������������������������������������15
2.8 ICT infrastructure developments and integrated technologies ���������������������������17
3. Regulatory trends in Europe �������������������������������������������������������������������������������������������������22
3.1 New collaborative regulatory paradigm ������������������������������������������������������������������22
3.2 The G5 Benchmark for regulatory excellence���������������������������������������������������������24
3.3 Maturity of ICT regulatory frameworks in Europe region���������������������������������������26
3.4 Economic contribution of broadband, digitization and ICT regulation
in Europe ���������������������������������������������������������������������������������������������������������������������������������30
4. Opportunity and challenges of digital transformation �����������������������������������������������������32
4.1 Developments under the regional initiatives for Europe���������������������������������������33
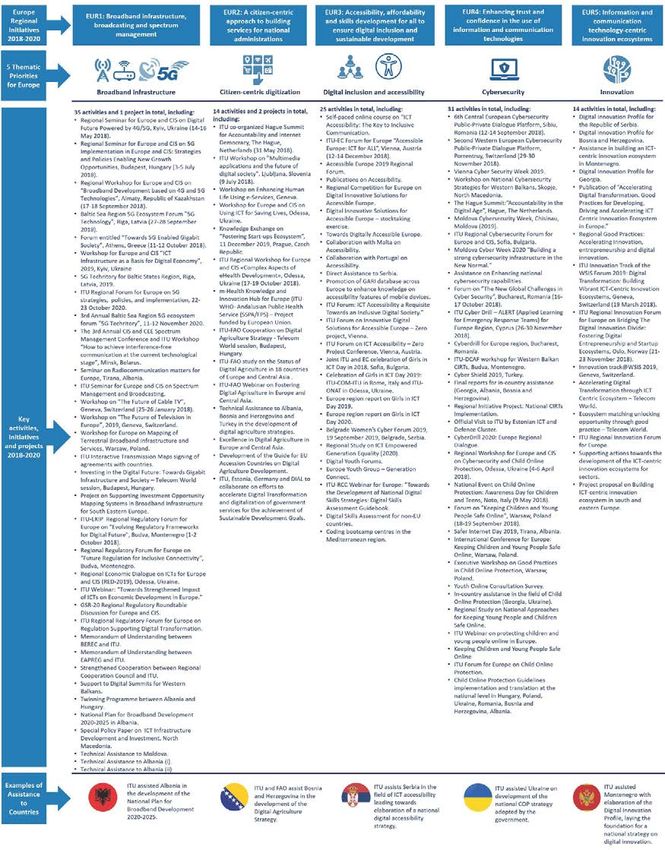
4.2 Regional initiatives: Areas of progress����������������������������������������������������������������������35
4.3 Regional initiatives: Areas of challenge��������������������������������������������������������������������36
5. Conclusion��������������������������������������������������������������������������������������������������������������������������������37
References�����������������������������������������������������������������������������������������������������������������������������������������38
iv
List of Figures and Boxes

Figures

   Figure 1: Global ICT indicators 2019 and 2020 where available (per 100
   inhabitants and per cent) and compound annual average growth rate (CAGR)
   for 2017-2019, 2017-2020 where available���������������������������������������������������������������������������� 1
   Figure 2: Accelerating impact of COVID-19 on digital transformation������������������������������ 2
   Figure 3: Key ICT statistics, ITU Europe region 2017-2020�������������������������������������������������� 4
   Figure 4: Mobile cellular subscriptions 2019, 45 European countries ������������������������������� 5
   Figure 5: Active mobile broadband subscriptions per 100 inhabitants, 2019,
   45 European countries��������������������������������������������������������������������������������������������������������������� 5
   Figure 6: Satellite broadband subscriptions 2017-2018, Europe region �������������������������� 6
   Figure 7: Fixed-broadband subscriptions per 100 inhabitants, 2019, Europe������������������ 7
   Figure 8: Kbit/s per Internet user, 2019 and CAGR 2015-2019 for selected
   countries in Europe��������������������������������������������������������������������������������������������������������������������� 8
   Figure 9: Household access, individuals using the Internet, total and by
   gender, 2019, Europe and world��������������������������������������������������������������������������������������������� 8
   Figure 10: Percentage of individuals using the Internet 2019 and CAGR 2017-
   2019����������������������������������������������������������������������������������������������������������������������������������������������� 9
   Figure 11: Proportion of households with Internet access, 2019 and CAGR
   2017-2019 in brackets���������������������������������������������������������������������������������������������������������������� 9
   Figure 12: Individuals using the Internet by gender, European countries, 2019*���������� 10
   Figure 13: Basic, standard and advanced ICT Skills, 2017-2019, European
   countries������������������������������������������������������������������������������������������������������������������������������������� 11
   Figure 14: Mobile-data prices as a percentage of GNI p.c. and monthly data
   allowance, Europe, 2019���������������������������������������������������������������������������������������������������������� 12
   Figure 15: Fixed-broadband prices as a percentage of GNI p.c., speeds and
   caps, Europe, 2019������������������������������������������������������������������������������������������������������������������� 13
   Figure 16: Total telecommunication investments and revenues by European
   country where available, 2017-2018�������������������������������������������������������������������������������������� 14
   Figure 17: Percentage share of telecommunication investments in
   telecommunication revenues, European countries, 2018�������������������������������������������������� 14
   Figure 18: Heatmap of national cybersecurity commitment and GCI scores
   Europe, ITU GCI 2018��������������������������������������������������������������������������������������������������������������� 16
   Figure 19: Europe region AI, IoT and cloud technologies landscape������������������������������ 18
   Figure 20: Evolution of the generations of ICT regulation, Europe, 2007-2019������������� 27
   Figure 21: Economic impact of fixed and mobile broadband and digitization,
   2019��������������������������������������������������������������������������������������������������������������������������������������������� 30
   Figure 22: Overview on Europe Regional Initiatives, thematic priorities and
   country examples 2018-2020�������������������������������������������������������������������������������������������������� 34
   Figure 23: Regional initiatives - Areas of progress��������������������������������������������������������������� 35
   Figure 24: Regional initiatives - Areas of challenges����������������������������������������������������������� 36

                                                                        v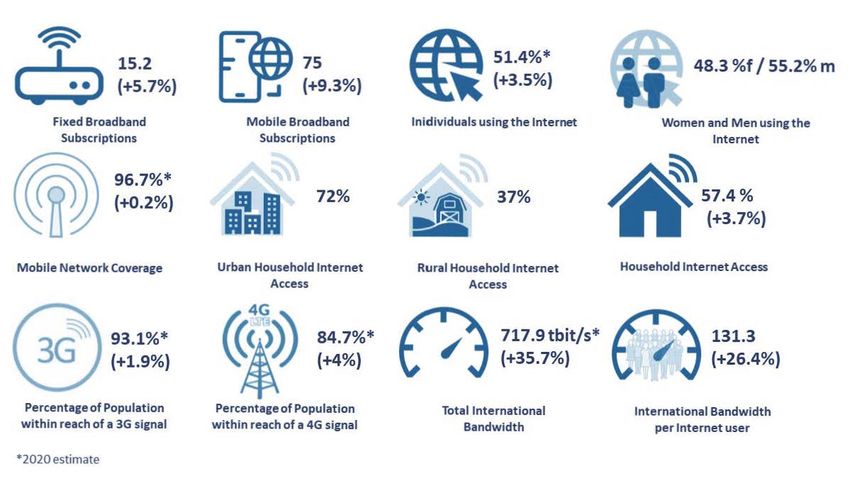
Boxes

   Box 1: ITU definition of different ICT skills levels������������������������������������������������������������������ 11
   Box 2: Measuring ICT prices at ITU����������������������������������������������������������������������������������������� 13
   Box 3: Investment efforts to mitigate the impact of COVID-19������������������������������������������ 15
   Box 4: ITU Global Cybersecurity Index: Europe Region – A closer look��������������������������� 16
   Box 5: COVID-19 impact on digital development in Europe��������������������������������������������� 19
   Box 6: Collaborative regulation - a forward-looking concept�������������������������������������������� 23
   Box 7: ITU G5 Benchmark in a nutshell ��������������������������������������������������������������������������������� 25
   Box 8: Voices from the region - France on the journey towards collaborative
   regulation����������������������������������������������������������������������������������������������������������������������������������� 28
   Box 9: Digital Regulation Handbook and Platform�������������������������������������������������������������� 29
   Box 10: COVID-19 Regulatory framework initiatives for Europe region��������������������������� 31
   Box 11: Europe Regional Initiatives – Definition and Objectives��������������������������������������� 33

                                                                      vi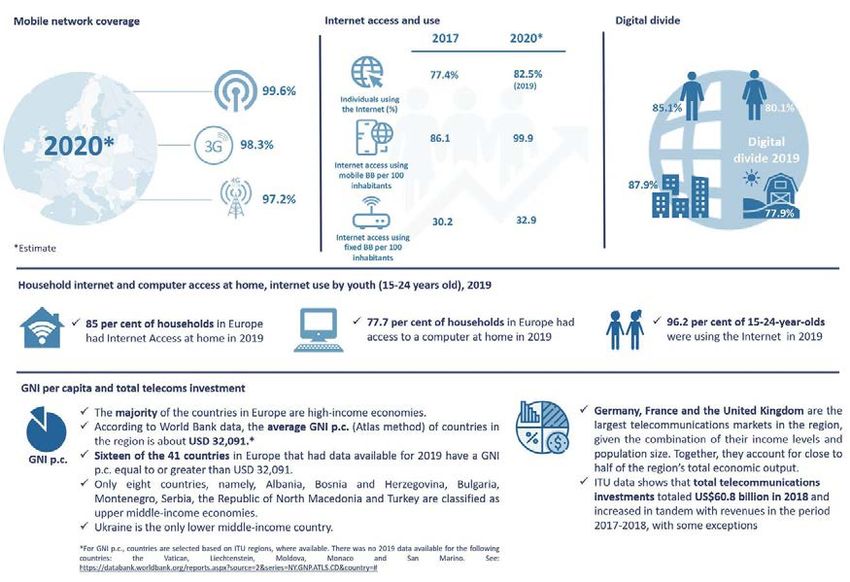
Digital trends in Europe 2021
1. Overview
While COVID-19 has dominated the headlines throughout 2020, consistent development and
deployment of ICT infrastructure and its concomitant services has meant a continued trend
towards digital transformation for societies, businesses and governments alike. Since the last
World Telecommunication Development Conference in 2017 (WTDC-17), information and
communication technologies (ICTs) have continued to spread. ITU data show that in 2019
Internet use surpassed the 50 per cent mark (51.4 per cent globally by the end 2019), 75 per
cent of the total world population had an active mobile broadband subscription, and fixed
broadband subscription had grown to just over 15 per cent. Over 57 per cent of households
today have Internet access at home. Moreover, given the increase in demand for data due to
increasingly bandwidth-intensive services, international bandwidth has, on average, grown at a
compound annual growth rate (“CAGR”) of 36 per cent between 2017 and 2020, with a CAGR
for international bandwidth per Internet user of 26 per cent between 2017 and 2019. Yet,
the digital divide persists. While almost all urban areas in the world are covered by a mobile
broadband network, many gaps persist in rural areas. The gender divide remains a reality, with
still fewer women than men benefiting from Internet use (Figure 1).
Figure 1: Global ICT indicators 2019 and 2020 where available (per 100 inhabitants and
per cent) and compound annual average growth rate (CAGR) for 2017-2019, 2017-2020
where available
Source: Based on ITU WTI Database from 2017, 2019, and 2020 where available
As most countries across the world grapple with the effects of the COVID-19 pandemic, the
role of ICTs and services, and the digital infrastructure that they ride and scale on has become
central to continued economic and societal activity and to lessening the pandemic’s impact.
An Economic Experts Roundtable organized by ITU and held in June 20201 concluded that
countries with top connectivity infrastructure could mitigate up to half of the negative economic
shock of the pandemic. Overall, the impact of the pandemic has been to accelerate digital
1
The Economic Experts Roundtable was held on 26 June 2020 https://www.itu.int/en/ITU-D/Conferences/
GSR/2020/Pages/default.aspx
1
Digital trends in Europe 2021
transformation, as businesses move towards distributed models of employment and digital
delivery of services and products. Individuals forego travel and socializing and turn towards
digital entertainment and communication platforms but also, increasingly, to e-commerce.
Schools move to online learning and digital classrooms, and governments increasingly rely on
and need data on citizens, health, and economic indicators to establish policies.
While research on the contribution of digitization to soften the impact of pandemics is limited,
emerging evidence is compelling about its accelerating effects across all areas of people’s
lives and sectors of the economy. For example, consumer and business surveys show that the
COVID-19 pandemic has pushed consumers and businesses alike to adopt digital services and
technologies, accelerating digital transformation in consumer behaviour and business activity
by several years (Figure 2).
Figure 2: Accelerating impact of COVID-19 on digital transformation
Source: ITU, based on insights from 2020 McKinsey consumer and enterprise surveys at https://www.mckinsey.com/
business-functions/mckinsey-digital/our-insights2
Generally, the pandemic has forced a greater demand for digital reliance across the board,
and this outcome is likely here to stay in the “new normal” as the utility of more abundant data
and the lowering transaction costs of using that data impact how entrepreneurs, policy-makers
and professionals make decisions. The pandemic, however, is just one driver of current trends.
Climate responsibility, continued economic development, demographic shifts and social well-
being are also other key drivers.
In the light of these global trends, policy development focused on inclusion, access, security,
skills and sustainability in terms of emerging technologies and their benefits is poised to become
one of the defining characteristics of the 2020s. This is mirrored in the ITU thematic priorities for
Europe that remain highly relevant going forward.3 Artificial intelligence, the Internet of Things,
cloud computing, distributed ledger technology, precision medicine, digital trade, autonomous
mobility, and many more evolving technological arenas will shape the future of the world, and
Europe in it. Europe has the opportunity to set an example for the world in policy development
2
https://www.mckinsey.com/business-functions/mckinsey-digital/our-insights/europes-digital-migration
-during-covid-19-getting-past-the-broad-trends-and-averages, and https://www.mckinsey.com/business
-functions/marketing-and-sales/our-insights/a-global-view-of-how-consumer-behavior-is-changing-amid
-covid-19 and https://www.mckinsey.com/business-functions/strategy-and-corporate-finance/our-insights/
how- covid- 19- has- pushed- companies- over- the- technology- tipping- point- and- transformed- business- forever
3
https://www.itu.int/en/ITU-D/Regional-Presence/Europe/Pages/ActivitiesandProjects.aspx
2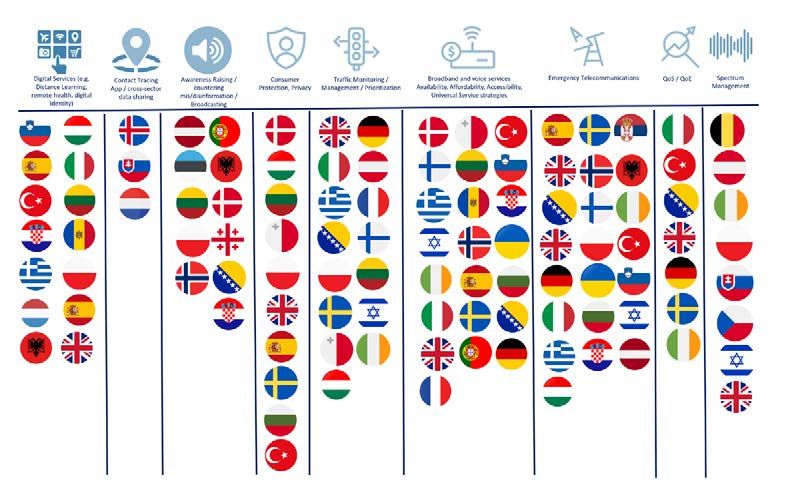
Digital trends in Europe 2021
and implementation, given its top spot in many ICT indicator rankings and considering that
it also leads other regions in the ITUG5 Benchmark for regulatory excellence4. For example,
the increasing demand for digital transformation affects a broad range of stakeholders, and
a collaborative regulatory response could set a responsible policy development approach
not only for ICT regulation, but also for all emerging technologies that depend on the ICT
infrastructure foundation.
Ultimately, at the heart of this historical transformation, ICT infrastructure is the predominant
enabler, along with fit-for-purpose policy, of Europe’s future competitiveness and global
leadership. We cannot lose sight of the fact that improving ICT infrastructure is more than a
goal for operators and consumers. It does much more than facilitate mobile and broadband
connections. It facilitates the backbone for global supply chain integration, the innovative
use of critical health information, the opportunity for citizens to improve their options in the
workforce, the ability for students to gain skillsets previously unavailable to them, and many
more positive externalities that are changing the course of history. Indeed, it will be history that
looks back at this early era of technological development to see how policies and governance
approaches reinforced the resilience and responsiveness of societies, all the while assessing
for risks, protecting consumers and enabling positive outcomes for citizens.
2. Digital trends in Europe 5
Over the last four years, the Europe region6, which includes 46 Member States and has a
population of 686 million, has seen continued growth in most areas of ICT infrastructure, access,
and use. Europe’s mobile cellular coverage, which refers to the percentage of the population
that lives within reach of a mobile cellular signal, is estimated by ITU to be close to 100 per
cent. Just over 98 per cent of the population is now within reach of a 3G signal and 97.2 per
cent is within reach of an LTE mobile-broadband signal. The percentage of individuals using
the Internet has increased from 77.4 per cent in 2017 to 82.5 per cent at the end of 2019, with
households that have Internet access at home increasing from 80.9 per cent in 2017 to 85 per
cent at the end of 2019. Both, fixed and mobile broadband markets have shown growth over
the last four years, with active mobile broadband subscriptions outpacing fixed broadband
subscriptions. A gender gap and a rural/urban divide persist: In 2019, there were 80.1 per cent
of women and 85.1 per cent of men that used the Internet. Moreover, 77.9 per cent of rural
households and 87.9 per cent of urban households had access to the Internet in 2019 (Figure
3). In the age group of 15- to 24-year-olds, 96.2 per cent used the Internet in 2019, well above
the world average which stood at 69 per cent (Figure 3).7
4
https://www.itu.int/en/ITU-D/Regulatory-Market/Pages/Policy-%26-Regulatory-Frameworks.aspx
5
Mostly 2019 data with some 2020 preliminary data/estimates. Disaggregated data will be reported when
available and relevant (gender, age, rural/urban). Europe averages vs global will be reported when relevant.
6
This Report uses the ITU Europe region as defined under ITU country classifications, see: https://www.itu.int/
en/ITU- D/S
tatistics/P
ages/d
efinitions/r egions. aspx . Where data were only available for a subset of countries,
this is indicated.
7
Measuring digital development, Facts and Figures 2020, https://w ww. itu. int/e
n/I TU- D/S
tatistics/P
ages/f acts/
default.aspx
3Digital trends in Europe 2021
Figure 3: Key ICT statistics, ITU Europe region 2017-2020
Source: ITU, WTI Database and World Bank data (for GNI data)
2.1 Mobile market developments
The European mobile market is very advanced, with mobile cellular subscriptions far in excess
of 100 subscriptions per 100 inhabitants in 38 out of 45 countries. Only seven countries
have subscription rates of less than 100 per 100 inhabitants, including Monaco, Moldova,
Albania, Serbia, Turkey, North Macedonia and Belgium. For Europe region, the 2020 average
subscription rate is estimated by ITU at 122.7 per 100 inhabitants, which is well above the world
average of 105 subscriptions per 100 inhabitants (Figure 4).
Active mobile broadband subscriptions per 100 inhabitants reached 99.9 per 100 inhabitants
in 2019, outstripping the world average of 75 per 100 inhabitants by just under 25 per cent.
One-third of countries in the Europe region, including Poland, Estonia, Finland, Denmark, Latvia,
Liechtenstein, San Marino, Iceland, Sweden, Cyprus, Israel, Lithuania, Slovakia, Bulgaria, Ireland
and Spain, have mobile broadband subscription rates in excess of 100 per 100 inhabitants, with
Poland (185.8), Estonia (166.8) and Finland (154.6) being significant outliers (Fig. 4). Countries
that lie below the world average include Turkey, Hungary, Serbia, North Macedonia, Albania,
Andorra, Bosnia and Herzegovina, and Moldova. Ukraine is trailing behind, with a subscription
rate of 47.2 per 100 inhabitants (Figure 5).
4Digital trends in Europe 2021
Figure 4: Mobile cellular subscriptions 2019, 45 European countries
Source: Based on ITU WTI Database, July 2020 edition
Figure 5: Active mobile broadband subscriptions per 100 inhabitants, 2019, 45
European countries
Source: Based on ITU WTI Database, *2020 estimate
5Digital trends in Europe 2021
2.2 Satellite broadband developments
Satellite broadband in Europe, as in other regions, offers an effective means to close the digital
divide and address remaining connectivity gaps. Satellite broadband is available in all EU
member states and some non-EU countries 8 ITU data for satellite broadband subscriptions9 is
only available for a subset of countries, with the biggest markets including the United Kingdom,
Germany, Turkey, Greece and Ireland. Most of the markets show a small declining trend for
the period 2017-2018 but several others, including the United Kingdom, Ukraine, Turkey,
Switzerland, Sweden and Albania show increases in satellite subscriptions (Figure 6).
Figure 6: Satellite broadband subscriptions 2017-2018, Europe region
Source: ITU, based on ITU WTI Database
2.3 Fixed-broadband market
Compared with other regions, Europe has the highest fixed-broadband subscription rates. ITU
estimates a fixed-broadband penetration level of 32.9 per cent for Europe as a whole in 2020,
a figure more than twice as high as the global average of 15.2 per cent. Within the region, all
countries, except Albania, have achieved a level of fixed-broadband penetration greater than the
global average (Figure7). Eleven countries, including Monaco, Andorra, France, Liechtenstein,
Malta, Switzerland, Denmark, the Netherlands, Germany, Norway and Iceland, have reached
fixed broadband subscriptions rates of more than 40 per 100 inhabitants (Figure 7).
8
https://ec.europa.eu/digital-single-market/en/broadband-all-satellite
9
Satellite broadband subscriptions refers to the number of satellite Internet subscriptions with an advertised
download speed of at least 256 kbit/s. It refers to the retail subscription technology and not the backbone
6Digital trends in Europe 2021
Figure 7: Fixed-broadband subscriptions per 100 inhabitants, 2019, Europe
Source: ITU, based on ITU WTI Database, *2020 estimate
Between 2015 and 2019, Europe regionally achieved a CAGR of 3.3 per cent in fixed-broadband
subscriptions per 100 inhabitants. Albania experienced the fastest growth of 15.9 per cent in
fixed-broadband subscriptions per 100 inhabitants during this period. Other countries that
have progressed significantly between 2015 and 2019 with a CAGR above 8 per cent include
Montenegro at 12.3 per cent and Georgia with 10.5 per cent, Turkey with 9 per cent and Ukraine
with 8.5 per cent. Serbia, Slovakia, Moldova, Greece, North Macedonia, Cyprus, Bulgaria and
Bosnia and Herzegovina progressed at rates of between 5 per cent and 9 per cent. Overall, the
fixed-broadband market in Europe still has some potential for expansion.
The availability of international bandwidth continues to be an important area for policy and
investment, especially given the rising amount of data-intensive applications, cloud-based
services and increasing numbers of Internet users desiring better international connectivity.
Total international bandwidth has more than doubled over the last four years from 61.8 Tbit/s
in 2017 to 153 Tbit/s in 2020. At the individual user level, kbit/s per Internet user in Europe
amounted to 211.2 in 2019, as compared to 131.3 kbit/s per Internet user globally.
At the country level, kbit/s per Internet user have increased across all of the countries, where
data were available for 2019, with the exception of North Macedonia. More than half of the
countries shown in Figure 8 had CAGRs in excess of 20 per cent including Albania, Serbia,
Monaco, Turkey, Andorra, Croatia, Lithuania, Bulgaria, Montenegro and Cyprus.
7Digital trends in Europe 2021
Figure 8: Kbit/s per Internet user, 2019 and CAGR 2015-2019 for selected countries in Europe
Source: ITU, based on ITU WTI Database
2.4 Internet access, use, skills, and gender
Europe is leading in Internet access at the global level, with 85 per cent of households estimated
by ITU to have had Internet access in 2019, compared to 57.4 per cent globally. The proportion
of individuals that was using the Internet in 2019 totalled 82.5 per cent in Europe and 51.4 per
cent globally (Figure 9).
Figure 9: Household access, individuals using the Internet, total and by gender, 2019,
Europe and world
Source: Based on ITU WTI Database, *2020 estimate
8Digital trends in Europe 2021
The percentage of individuals using the Internet has increased in almost every European country
over the period 2017-2019 (Figure 10). In eight countries, namely Denmark, Norway, Sweden,
the Netherlands, Switzerland, the United Kingdom and Belgium, more than 90 per cent of
individuals were using the Internet in 2019. In 40 per cent of the countries, percentages of
individual Internet users were between 80 per cent and 90 per cent (Figure 10).
Figure 10: Percentage of individuals using the Internet 2019 and CAGR 2017-2019
Source: ITU, based on ITU WTI Database for 2017 and 2019
In terms of households with Internet access, Europe leads other regions and the world average,
with an average penetration rate of 85 per cent. Taking a closer look at the individual country
level, more than half of the countries have a proportion of households with Internet access
between 80 per cent and 90 per cent; eight countries, Norway, the Netherlands, Sweden,
Denmark, the United Kingdom, Switzerland, Germany and Estonia, are nearing 100 per cent
and, five countries are trailing at rates between 70 per cent and 80 per cent, with only Moldova
at 60.8 per cent (Figure 11).
Figure 11: Proportion of households with Internet access, 2019 and CAGR 2017-2019
in brackets
Source: ITU, based on ITU WTI Database for 2017 and 2019
In terms of the digital divide, a gender gap remains in Europe, albeit decreasing, and less
pronounced than compared to the world average. While on average 80.1 per cent of women
and 85.1 per cent of men used the Internet in Europe in 2019, globally 48.3 per cent of women
and 55.2 per cent of men used the Internet that year. Data also show that in Europe, more men
than women were using the Internet in 33 out of 39 countries in 2019 (Figure 12). The digital
9Digital trends in Europe 2021
divide is most pronounced in Ukraine, Albania, Moldova, Bosnia and Herzegovina, Turkey, Italy,
Croatia, North Macedonia, the Czech Republic, Serbia, Austria and Germany, where differences
in usage surpass or equal five percentage points. Countries that are almost at parity (equal to
or less than one percentage point difference) include Iceland, Denmark, Luxembourg, Sweden,
Malta, Estonia and Cyprus. Spain is the only country where men and women are using the
Internet at equal rates.
Figure 12: Individuals using the Internet by gender, European countries, 2019*
Source: Based on ITU WTI Database 2019, *figures for Ukraine, North Macedonia, Luxembourg, Italy, Ireland and
Iceland are for 2018
The levels reached in basic, standard and advanced ICT skills over the last three year vary
significantly across Europe, with Denmark, Iceland, Sweden and Luxembourg leading in advanced
skills with levels between 10 per cent and 15 per cent. Levels of standard and basic skills are
well above 50 per cent (see Box 1 for definitions of skill levels). Thirteen countries have attained
levels of basic skills above 60 per cent, including Denmark, Iceland, Luxembourg, Switzerland,
Finland, Austria, the Netherlands, Andorra, Germany, Slovenia, Belgium, Montenegro and
Slovakia. In relation to standard skills, 10 countries have achieved levels above 50 per cent,
including Denmark, Iceland, Sweden, Luxembourg, Switzerland, the United Kingdom, Finland,
Austria and the Netherlands, and seven countries including Croatia, Estonia, Spain, Andorra,
Ireland, Germany and Belgium, have achieved levels of between 40 per cent and 50 per cent.
Only five countries, namely Bosnia and Herzegovina, Bulgaria, Georgia, Romania and Albania
have standard skills levels of below 20 per cent (Figure 13).
10Digital trends in Europe 2021
Figure 13: Basic, standard and advanced ICT Skills, 2017-2019, European countries
Source: Based on ITU WTI Database
Box 1: ITU definition of different ICT skills levels
For each economy, the value for basic skills is the average value of the available
recent data for the following four computer-based activities: copying or moving a
file or folder, using copy and paste tools to duplicate or move information within
a document, sending e-mails with attached files, and transferring files between a
computer and other devices.
The value for standard skills is the average value of the available recent data for the
following four computer-based activities: using basic arithmetic formula in a spreadsheet;
connecting and installing new devices; creating electronic presentations with presentation
software; and finding, downloading, installing and configuring software.
The value for advanced skills is the value for writing a computer program using a
specialized programming language.
11Digital trends in Europe 2021
2.5 ICT prices
ITU data show that telecommunication and ICT services are becoming more affordable and
prices have generally followed a downward trend over the last four years across the world,
including for mobile-voice, mobile-data and fixed-broadband. At the regional level, Europe has
the most affordable prices, closely followed by the Commonwealth of Independent States (CIS)
region. The ITU report “Measuring Digital Development: ICT Price Trends 2019”10 provides a
detailed examination and discussion of ICT price trends.
Europe is the region with the most affordable mobile-data baskets relative to income11, with 32
countries having a basket costing less than 1 per cent of gross national income per capita (GNI
p.c.) and all countries below 2.1 per cent of GNI p.c. Only Moldova is borderline with regard to
the Broadband Commission target, which stipulates that ICT services should not cost more than
2 per cent of GNI p.c. Monthly data allowances included in the relevant plans in the region are
high, at least 5 GB in more than half of the countries (Figure 14). Finland is a global leader with
no data limit applied. Israel, Lithuania, Romania and Switzerland are also worth mentioning, all
offering a 30 GB data cap.
Figure 14: Mobile-data prices as a percentage of GNI p.c. and monthly data allowance,
Europe, 2019
Source: ITU, adapted from “Measuring Digital Development, ICT Price Trends 2019”
As regards affordability of fixed services, Europe is the region with the lowest fixed-broadband
basket price as a percentage of GNI p.c. (1.5 per cent). The only six countries, where the fixed-
broadband basket costs more than the Broadband Commission target of 2 per cent of GNI
p.c. are Slovenia, Bosnia and Herzegovina, Serbia, Georgia, North Macedonia and Moldova
(Figure 15). In almost all countries, the advertised download speed is 10 Mbit/s or more. In
10
https://www.itu.int/en/mediacentre/Pages/pr08-2020-Measuring-Digital-Development-ICT-Price-Trends
-2019.aspx
11
Data-only plans are not be very common in developed countries, as most people have a data-and-voice
bundle.
12Digital trends in Europe 2021
five countries, namely Croatia, Belgium, Turkey, Iceland and North Macedonia, monthly data
allowances are capped.
Figure 15: Fixed-broadband prices as a percentage of GNI p.c., speeds and caps, Europe,
2019
Source: ITU, adapted from “Measuring Digital Development, ICT Price Trends 2019”
Box 2: Measuring ICT prices at ITU
The International Telecommunication Union (ITU), its partners and stakeholders devote
considerable time and effort to developing and refining price methodologies, in particular
through the Expert Group on Telecommunication/ICT Indicators (EGTI). ITU maintains a
set of different price baskets to reflect different usage patterns and behaviour. In 2017,
ITU updated and adjusted its price baskets to reflect current developments in the fixed
and mobile broadband markets. The price baskets cover three different technologies:
mobile- voice, mobile-data and fixed-broadband.
In addition, the 2017 revision introduced combined data-and-voice baskets, as a
first attempt to monitor the prices of bundled services, which is now a very common
commercial practice.
The ITU mobile-data-and-voice baskets include voice, text messages and data for two
different consumption levels. The low-consumption mobile-data-and-voice basket
includes 70 voice minutes, 20 SMSs and 500 MB of broadband data while the high-
consumption mobile-data-and-voice basket includes 140 voice minutes, 70 SMSs and
1.5 GB of broadband data.
Source: From ITU, “Measuring Digital Development, ICT Price Trends, 2019”
2.6 Telecommunication revenues and investment
In Europe, ITU estimates that total telecommunication investments amounted to USD 60.8 billion,
or 24.8 per cent of total European telecommunication revenues in 2018. Total telecommunication
revenues and investments increased from 2017 to 2018 in 22 of the countries, where data were
available. Both in Turkey and Sweden, revenues and investments declined over the period
2017-2018, whereas in the Netherlands, Estonia and Iceland, investments increased despite
13Digital trends in Europe 2021
falling revenues over the same period. In Portugal and Luxembourg, investments declined while
revenues increased (Figure 16).
Figure 16: Total telecommunication investments and revenues by European country
where available, 2017-2018
Source: Based on ITU WTI Database
The percentage share of investments in revenues was highest in Iceland with 41.5 per cent,
followed by Montenegro, Ukraine, Slovakia, Slovenia, Italy, Norway, France and Sweden, all of
which had shares above 30 per cent. Lowest levels of investments as a share of revenue were
committed in Bosnia and Herzegovina and in Latvia, with 14.3 per cent and 14.6 per cent,
respectively (Figure 17).
Figure 17: Percentage share of telecommunication investments in telecommunication
revenues, European countries, 2018
Source: Based on ITU WTI Database
14Digital trends in Europe 2021
Box 3: Investment efforts to mitigate the impact of COVID-19
Despite the global economic recession expected to follow the COVID-19 crisis, and
confirming the importance of connectivity in time of pandemics, telecommunication
operators are reporting increased efforts to invest in additional capacity and deploying
new network infrastructure and technologies. For example, Turkcell reported an
increase of 10 per cent in expected investments for 2020, including plans to uphold
the 5G launch and to deploy new fibre-to-the-home connections.1
Source: ITU News 03
1
https://www.itu.int/en/myitu/Publications/2020/09/09/13/13/ITU-News-Magazine-No3-2020
2.7 Developments regarding cybersecurity
Cybersecurity is key to trusted and sustainable digital transformation. This is particularly evident
during situations of crisis such as the COVID-19 pandemic, where many of an organization’s
activities and communication move online and where cyberdefences might be lowered
due to the shift of focus to the health crisis. Based on an Interpol assessment of the global
landscape on COVID-19 cyberthreats12, there were significant increases across all cybercrime
domains, including online scams and phishing, data-harvesting malware, disruptive malware/
ransomware, as well as exploitation of vulnerabilities of systems, networks and applications
used by businesses, governments and schools to support staff who are now working remotely.
ITU estimates that at the end of 2019, the cost of cybercrime totalled USD 2 trillion globally.13
Therefore, fit-for-purpose cybercrime legislation, strategies and frameworks, as well as computer
emergency response teams, capabilities, awareness and capacities are key to progressing
sustainable economic and socio-economic development.
Since 2015 ITU publishes the Global Cybersecurity Index (GCI) to measure the commitment
of each ITU Member State to cybersecurity across five pillars (see Box 4 for a description of
these pillars). GCI is an initiative of ITU involving experts from different backgrounds and
organizations. Europe region is well advanced in its commitment to ensuring that the use of
ICTs is safe and secure and outpaces all other regions with regard to cybercrime preparedness
and commitment across all GCI cybercrime pillars. GCI 2018 shows that all European countries
have cybercriminal legislation and cybersecurity regulation in place. Moreover, more than two-
thirds of Europe region countries fall into the highest category of commitment (Figure 18). Only
10 countries, namely Moldova, Ukraine, Cyprus, Serbia, Montenegro, Albania, Liechtenstein,
Greece, Malta and Iceland fall into the medium commitment category. The United Kingdom,
France and Lithuania have obtained the top three scores in the Europe region across all five
GCI pillars (Figure 18).14
12
https://www.interpol.int/en/content/download/15217/file/Global%20landscape%20on%20COVID-19
%20cyberthreat.pdf
13
https://www.itu.int/en/ITU-D/Cybersecurity/Pages/global-cybersecurity-index.aspx
14
https://www.itu.int/en/ITU-D/Cybersecurity/P
ages/g
lobal- cybersecurity- index. aspx, see GCI Report 2018 p.
30
15Digital trends in Europe 2021
Figure 18: Heatmap of national cybersecurity commitment and GCI scores Europe, ITU
GCI 2018
Box 4: ITU Global Cybersecurity Index: Europe Region – A closer look
16Digital trends in Europe 2021
2.8 ICT infrastructure developments and integrated technologies
While ITU does not collect data for indicators on emerging technologies such as the application
of AI, the status of the IoT (except for M2M SIM cards) or developments in relation to cloud
technologies at this point in time, it is an increasingly important area of ICT development that
thrives through the work of all the three ITU Bureaux. As the infrastructure evolves globally, it
is likely to do so in a way that accommodates co-dependent hardware and software. Figure
19 provides an overview of the AI, IoT and cloud technologies landscape in Europe region.
17Digital trends in Europe 2021
Figure 19: Europe region AI, IoT and cloud technologies landscape
18Digital trends in Europe 2021
Box 5: COVID-19 impact on digital development in Europe
The COVID-19 Pandemic has had an accelerating impact on digital development.
While research on the contribution of digitization to mitigate the impact of pandemics
is limited, emerging evidence is compelling about its positive effects. For example,
anecdotal evidence published by ITU in “Facts and Figures 2020” shows an impact
on activities undertaken online by individuals using the Internet in Austria, Ireland and
Norway, and an impact on daily data traffic on fixed networks in Italy.
To better understand and explore whether COVID-19 has accelerated digitalization
and how consumers and businesses concretely responded to the pandemic, McKinsey
conducted a number of surveys during 2020. A survey of 20 000 European consumers
on “Europe’s digital migration during COVID-19”1 finds that digital adoption among
European consumers jumped from 81 per cent to 95 per cent as a result of the
COVID-19 crisis. McKinsey surveyed which digital services and channels were used
by respondents for the first time during COVID-19 across a number of industries,
including banking, insurance, grocery, apparel, entertainment, social media, travel,
telecommunications, utilities, and the public sector. The findings highlight differences
in the magnitude of the impact across the countries surveyed, driven by the severity
of restrictions imposed in different markets on people’s movement and business
operations and by the digital maturity of those markets. They also show a discernable
uplift in digital adoption across all markets, narrowing the digital gap that existed
between European countries.
1
https://www.mckinsey.com/business-functions/mckinsey-digital/our-insights/europes-digital
-migration-during-covid-19-getting-past-the-broad-trends-and-averages
19Digital trends in Europe 2021
Countries with relatively low digital adoption rates before COVID-19 showed the
highest uplifts (e.g., Germany and Romania), with Finland and Denmark topping the
chart. The survey also provides insights into the industries that were accessed the most
by users (some of them for first time) during COVID-19. Banking, entertainment and
social media had the highest scores. And on the question of the digital actions that
were performed the most while online, looking for information was the most frequent
answer, highlighting that increased traffic did not translate automatically into increased
e-commerce and sales.
A second survey published by McKinsey in October 2020 explored the extent to which
companies had reached the technology tipping point and found that responses to
COVID-19 have accelerated the adoption of digital technologies by several years,
in particular as regards interaction with consumers and their supply-chains through
online channels and internal operations.
20Digital trends in Europe 2021
Source: McKinsey 2020 “How COVID-19 has pushed companies over the technology tipping point – and
transformed business forever”1
ITU finds in its GSR-20 Discussion Paper “Economic Impact of COVID-19 on Digital
Infrastructure”2 that in the medium term (e.g., 2021), countries with top connectivity
infrastructure could mitigate up to half of the negative economic impact of the COVID-19
pandemic. However, there are also factors that limit the capacity of digitization to
improve social and economic resilience. These include the digital divide where it still
persists, and demand-side barriers, such as limited affordability and digital illiteracy.
Furthermore, the paper emphasizes that the benefits of digital infrastructure for dealing
with the pandemic is limited to those industries that are well on their way to digital
transformation, such as logistics. To address these barriers and increase the mitigation
value of digitization, the paper makes a number of recommendations, stressing that
the digital infrastructure sector needs to re-examine some of the digital sector basic
fundamental premises that were held before COVID-19. These premises include:
• Concrete, actionable measures in the telecommunication sector to enable the
private operators to provide universal access to quality digital infrastructure
networks for all and support the development of a digital economy.
• Adoption of a much broader, holistic view by governments of investment in high-
speed broadband networks, considering the economic, social and environment/
climate benefits and costs of investment.
• Possible adjustment of regulatory frameworks to stimulate investment whilst
maintaining a sensible level of competition, shifting from a purist to a pragmatic
viewpoint on State-aid regulations.
• Harnessing the opportunity to use COVID-19 as a catalyst for the adoption
of digitization in sectors where it had not occurred before, especially in more
business-oriented applications.
ITU has called into life various COVID-19 initiatives, activities and partnerships to
help understand the impact of the crisis better and develop guidance for countries,
including “Connect2Recover”, the Global Network Resiliency Platform “REG4COVID”,
the WSIS ICT Case Repository, and CYB4COVID. Partnerships include the Ad hoc
Group on digital technologies for COVID health emergency “AI for Health”, the UN
Broadband Commission’s Agenda for Action and others. For more information see
https://www.itu.int/en/Pages/covid-19.aspx.
1
https://w
ww. mckinsey. com/b usiness- functions/s trategy- and- corporate- finance/o
ur- insights/h
ow
-covid-19-has-pushed-companies-over- the- technology- tipping- point- and- transformed- business
-forever
2
https://www.itu.int/en/ITU-D/Conferences/GSR/2020/Pages/default.aspx
21Digital trends in Europe 2021
3. Regulatory trends in Europe
The right regulatory framework is key to successful digital transformation that is inclusive and
sustainable, and minimizes the emergence and manifestation of unwanted consequences
for market structures and consumers. As the COVID-19 crisis has laid bare, inequalities are
increasing within and between countries, not least because current governance and regulatory
frameworks and their implementing mechanisms are failing to deliver more equitable outcomes.
As the pace of digital transformation accelerates, formulating an effective regulatory approach
therefore becomes a defining moment. Through complementary ITU regulatory metrics, the now
established ICT Regulatory Tracker and the new Benchmark of Fifth Generation Collaborative
Regulation (G5 Benchmark (ITU, 2019))15, ITU has identified the broad tracks for regulatory
reform and has pinpointed how countries can accelerate progress towards the next regulatory
generation. “
3.1 New collaborative regulatory paradigm
A new regulatory paradigm has emerged – the “gold standard” for collaboration among
regulators and policy-makers 16 – that seeks to fast forward digital transformation for all. This
new paradigm is embodied in collaborative regulation (see Box 6 for a definition of the general
concept), which must engage a broad and diverse range of stakeholders in informed, evidence-
based rulemaking and decision making, with both social and economic impact in mind – and
with priority granted to the latter. Collaborative regulation applies readily to multiple areas
of regulatory work; infrastructure sharing, and co-deployment are no exception and can
substantially benefit from the introduction and effective use of collaborative governance and
data-driven regulatory instruments.
ITU forged the concept of “collaborative regulation” in 2016 and has since tested it annually at
every Global Symposium for Regulators (GSR). While the concept continues to evolve, it can
best be cast in 2020 as a framework to discuss the evolution of regulatory pattern and policy
while charting the way ahead for industry and regulators as one constituency, towards digital
transformation.
15
Note that the term “G5” used in relation to the Benchmark should not be confused with “5G” which refers
to wireless technology.
16
https://w
ww.itu.int/en/mediacentre/Pages/PR06-2020-Global-ICT-Regulatory-Outlook-G5-Benchmark.aspx
22Digital trends in Europe 2021
Box 6: Collaborative regulation - a forward-looking concept
What is collaborative regulation?
Collaborative regulation or 5th generation regulation (G5) is a broad notion that
ITU has defined based on the concept of generations of ICT regulation. It marks a
fundamental shift in the way regulation is executed, its holistic policy ground and
the stakeholders that it brings together – from policy-makers, single-sector and
cross-sector regulators to market players of any size. It also shifts regulatory focus on
behaviours and impact on markets and development.
Collaborative regulation puts a new emphasis on consumer benefits and protection
and leverages the resources of government institutions and industry to deliver them,
through organic consultation, collaboration and conciliation. Collaborative regulation
is driven by leadership, incentive and evidence rather than by command-and-control
schemes. The concept also refers to the set of new tools used by regulators to tackle
the issues related to digital transformation and the data economy.
Why do we need collaborative regulation?
All roads now point to more collaboration, better channels and more bandwidth. But
while the case for collaboration is irrefutable, progress has been stalled by power
battles, lack of resources and misconceptions. Good progress towards inclusive,
collaborative regulation is needed for the good of all users of digital services, now
and into the future – a need borne out by four fundamentals:
• Digital transformation is a game changer – especially in “the new normal” amid
the current global pandemic
ICTs have become the foundation for every economic sector and a sine qua non of
business performance, national growth and more recently –resilience. Regulators
need to ensure that regulation achieves its objectives in the most effective and
efficient manner, in particular network resilience and enhancing both the capacity and
coverage of networks without imposing disproportionate, redundant or overlapping
burden on the market.
• The new digital world needs a new take on regulation
ICTs can dramatically transform education, health care, environmental management,
agriculture, trade and entrepreneurship, the provision of government services – and
so much more. For this to happen, enabling frameworks of policy and regulation, and
the right networks and services need to be put in place.
23Digital trends in Europe 2021
• Holistic and harmonized approach can deliver greater impact
Silo-style ICT sector regulation is not viable in the digital world. Collaborative regulation
will mirror the interplay between digital infrastructure, services and content across
industries and national borders. It will also harmonize rules and ensure consistent
implementation of policy and regulatory frameworks that have evolved independently
in many sectors over the years.
• Development and inclusion have become a primary focus of regulation
Collaborative regulation is people-centred regulation – it looks at sustainability and
long-term gains as opposed to industry profit maximization and exclusive economic
growth. Collaborative regulation champions are also engaged in connecting
marginalized individuals, persons with disabilities, low-income communities,
communities challenged by educational impoverishment, and remote or isolated
populations which may also lack basic infrastructure such as electricity – so there is a
need to be much more innovative and collaborative in the approach to policy-making.
The 5 Generations of ICT Regulation – conceptual framework
Source: ITU, 2020
3.2 The G5 Benchmark for regulatory excellence
To afford perspectives on the regulatory road already travelled as well as on the pathways
into the future, ITU developed the G5 Benchmark for regulatory excellence, which is based on
GSR Best Practice Guidelines17 and ITU research and analysis. First conceptualized in 2019 to
set out new goals for regulatory excellence, the Benchmark is built around an extensive and
varied set of indicators and will soon cover all of the ITU Member States18. The indicators are
clustered into three tracks, including collaborative governance, policy design principles and the
G5 toolbox. The cross-sector regulatory frameworks captured through the various indicators
17
See in particular GSR Best Practice Guidelines 2019 “Fast forward digital connectivity for all”, and 2020 “The
gold standard for digital regulation”, which set out key principles and recommendations regarding regulatory
thought leadership for digital transformation.
18
The G5 Benchmark will be expanded to cover all ITU Member States leveraging the new refined
methodological framework and a new edition will be released ahead of the World Telecommunication
Development Conference 2021 (WTDC-21).
24Digital trends in Europe 2021
are pivotal in creating a digital marketplace that is inclusive, sustainable and pro-development
and a cornerstone of digital transformation. Box 7 sets out the ITU G5 Benchmark in a nutshell.
More in-depth information on the G5 Benchmark can be obtained in the “Global Regulatory
Outlook 2020” report (GIRO 2020).19
Box 7: ITU G5 Benchmark in a nutshell
What is it?
The G5 Benchmark is a new tool for policy-makers and regulators. It fast tracks
collaborative, cross- sector regulation – the best and quickest means to leverage
digital transformation for the benefit of everyone. It uses a brand-new three-lens
approach which focuses in on collaborative regulation – and offers insights that are
both surprising and of high-value. The G5 Benchmark is the new gold standard for
collaboration amongst regulators.
What does the G5 Benchmark do?
It is a powerful, straightforward tool that makes sense of shifts in regulatory frameworks
as policy- makers and regulators navigate a complex digital landscape. It delivers on
additional aspects of high-value for policy-makers and regulators:
• Sets out new goals for regulatory excellence.
• Highlights shortcomings in the pursuit of SDGs and proposes solutions.
• Dives deep into policy trends.
• Enriches global policy debate.
Why is the G5 Benchmark different?
First, it uses a brand-new three-lens approach, which focuses in laser-sharp on
collaborative regulation.
Second, three features combined make it especially powerful:
1. Scope: Most of ITU Member States, all regions, 2018-2019 data.
2. Ease-of-use: straightforward methodology, three regulatory tracks and easy-to-
measure indicators. Policy-makers can check and update country data, compare
with others and run “what-if” projections. Easy interplay with ICT Regulatory
Tracker. Easy assessment of cross- sector regulatory frameworks and quick
identification of “win” opportunities.
3. Objectivity: built on latest data, factual evidence.
19
https://itu.foleon.com/itu/global-ict-regulatory-outlook-2020/home/
25You can also read