Widespread occurrence of hybrid internal-terminal exons in human transcriptomes
←
→
Page content transcription
If your browser does not render page correctly, please read the page content below
bioRxiv preprint doi: https://doi.org/10.1101/2021.05.27.446076; this version posted May 29, 2021. The copyright holder for this preprint (which
 was not certified by peer review) is the author/funder, who has granted bioRxiv a license to display the preprint in perpetuity. It is made
 available under aCC-BY-NC-ND 4.0 International license.

Widespread occurrence of hybrid internal-terminal exons in
human transcriptomes
Ana Fiszbein1,2*, Michael McGurk1, Ezequiel Calvo-Roitberg3, GyeungYun Kim2,
Christopher B. Burge1*, Athma A. Pai3*
1
 Department of Biology, Massachusetts Institute of Technology, Cambridge, USA.
2
 Department of Biology, Boston University, Boston, USA
3
 RNA Therapeutics Institute, University of Massachusetts Medical School, Worcester, USA
* Corresponding authors: anafisz@bu.edu, cburge@mit.edu, athma.pai@umassmed.edu

Abstract
Alternative RNA processing is a major mechanism for diversifying the human
transcriptome. Messenger RNA isoform differences are predominantly driven by alternative
first exons, cassette internal exons and alternative last exons. Despite the importance of
classifying exons to understand isoform structure, there is a lack of tools to look at isoform-
specific exon usage using RNA-sequencing data. We recently observed that alternative
transcription start sites often arise near annotated internal exons, creating “hybrid” exons
that can be used as both first or internal exons. To investigate the creation of hybrid exons,
we built the HIT (Hybrid-Internal-Terminal) exon pipeline that systematically classifies
exons depending on their isoform-specific usage. Using a combination of junction reads
coverage and probabilistic modeling, the HIT index identified thousands of hybrid first-
internal and internal-last exons that were previously misclassified. Hybrid exons are
enriched in long genes with at least ten internal exons, have longer flanking introns and
strong splice sites. The usage of hybrid exons varies considerably across human tissues, but
they are predominantly used in brain, testis and colon cells. Notably, genes involved in RNA
splicing have the highest fraction of intra-tissue hybrid exons. Further, we found more than
100,000 inter-tissue hybrid exons that changed from internal to terminal exons across
tissues. By developing the first method that can classify exons according to their isoform
contexts, our findings demonstrate the existence of hybrid exons, expand the repertoire of
tissue-specific terminal exons and uncover unexpected complexities of the human
transcriptome.

Page 1 of 34
bioRxiv preprint doi: https://doi.org/10.1101/2021.05.27.446076; this version posted May 29, 2021. The copyright holder for this preprint (which
 was not certified by peer review) is the author/funder, who has granted bioRxiv a license to display the preprint in perpetuity. It is made
 available under aCC-BY-NC-ND 4.0 International license.

Introduction
The composition of mRNAs in a eukaryotic cell is highly dynamic and diverse. Greater than 95%
of multi-exonic mammalian genes express multiple mRNA isoforms and isoform usage is often
regulated in a tissue and context-specific manner. Despite the recent focus on alternative splicing
mechanisms, it was recently observed that isoform differences across human tissues are
predominantly driven by alternative mRNA start and end sites (1–3). Alternative splicing of internal
exons was estimated to explain tissue-dependent transcript differences for only ~35% of the genes,
while alternative transcription start and end sites accounted for the majority of tissue-dependent
isoform usage (1). The modulated of transcripts through usage of alternative mRNA start and end
sites is highly conserved during evolution, with alternative terminal exon usage occurring for most
genes across yeast, plant, insect and mammalian species (4–6). Further, accumulating evidence
suggests that a significant fraction of internal exons is used as first (FEs) or last exons (LEs) in
different cell contexts (7, 8). The usage of polyadenylation sites in introns can lead to the conversion
of an internal exon into a 3′ terminal exon (7) and cryptic promoters that arise during evolution may
lead to conversion of internal exons to first exons (8). However, much less is known about the
prevalence, usage, and evolution of this class of hybrid exons.

The usage of alternative transcription start and end sites can contribute to the regulation of the
transcriptome and proteome in many ways. Unlike other exon types, relatively few alternative
terminal exons directly code for alternative protein sequences. Instead, alternative first or last exons
are more likely to influence the open reading frame through introduction of alternative start codons
or induce protein truncation with premature stop codons. However, the vast majority of alternative
terminal exons contribute to alternative 5’ or 3’ untranslated region (UTR) composition and
consequent regulation of post-transcriptional mRNA processes (9–11). Although UTRs do not
directly contribute to protein sequence, they harbor crucial regulatory sequences (including those
for RNA-binding proteins and miRNAs (12)) and are thus modulators of mRNA subcellular
localization (13), stability (14) and translation (15) in vivo. Unsurprisingly, given the many ways
that alternative terminal exons can influence mRNA and protein diversity, the dysregulation of
transcription start and end sites has been associated with several human diseases, including cancers,
and neurological disorders (16, 17). Further, the usage of alternative terminal ends are dynamically
regulated after exposure to environmental or immune stimuli (18, 19), suggesting that these
mechanisms may also play an important role in cellular responses and remodeling. Given the central
role of terminal exon composition in the regulation of both the transcriptome and the proteome, it
is crucial to be able to properly classify which exons are used as terminal or internal exons across
cell types and cellular contexts.

Many experimental strategies have been developed to specifically identify transcription starts and
ends by anchoring on the 5’ 6-methyl-guanosine cap (ie. CAGE-seq) or the 3’ polyA-tail (ie. 3p-
seq). However, these experiments have limited utility, since they are unable to simultaneously
quantify expression of mRNA molecules or provide information about the isoforms associated with
the terminal site usage. Furthermore, these specialized protocols are laborious, making them less
practical than RNA-sequencing (RNA-seq) for general use across cell types and cellular conditions.
Given the widespread use and availability of RNA-seq datasets, there is significant interest in using
RNA-seq data to identify and quantify the usage of alternative terminal events (20–23). However,
despite many efforts in the past few years, identifying terminal exons from short-read
transcriptomic alignments and quantifying their usage remain challenging. Of specific interest is
how to uniquely classify exons as first, internal and last, which we refer to as the unsolved “exon
type problem”. These issues are especially problematic for hybrid exons, which would be classified
as internal in RNA-seq data and terminal in data from the specialized terminal end sequencing
techniques highlighted above, despite being used as both terminal and internal exons in different

Page 2 of 34
bioRxiv preprint doi: https://doi.org/10.1101/2021.05.27.446076; this version posted May 29, 2021. The copyright holder for this preprint (which
 was not certified by peer review) is the author/funder, who has granted bioRxiv a license to display the preprint in perpetuity. It is made
 available under aCC-BY-NC-ND 4.0 International license.

transcripts within a cell type. Even the newest classification and quantification algorithms (23–25)
are not able to differentiate between purely terminal exons and exons with hybrid features, let alone
quantify the proportional usage as a terminal or internal exon.

Here, we introduce the Hybrid-Internal-Terminal (HIT) index, developed to systematically identify
and classify exons as hybrid, internal, or terminal based on short-read RNA-seq data. By modeling
the ratio of exon-exon splice junction reads (SJRs), the HIT index pipeline reliably classifies exons
and identifies thousands of hybrid first-internal or hybrid internal-last exons. By comparing HIT
index exon classifications with classifications from specialized techniques to identify transcript
ends, we show that our approach accurately classifies exons based on their isoform-specific usage.
After applying the HIT index to RNA-seq data across human tissues, we are able to characterize
features that differentiate hybrid terminal exons. Overall, the widespread identification of hybrid
exons expanded the repertoire of tissue-specific isoforms and highlighted the diversity of the human
transcriptome.

Results
The regulation of mature RNAs can occur at multiple levels within cells, including quantitatively
by varying gene expression levels and qualitatively by varying isoforms through alternative
transcription start site, splice site, and/or cleavage site usage. Advances in high-throughput RNA-
seq have provided unprecedented insights into mRNA levels across cell types, the internal structure
of isoforms, and novel alternatively spliced exons. However, it is still challenging to use short-read
RNA-seq data to also identify novel terminal ends of mRNAs - specifically, 5’ transcription start
sites and 3’ transcription end or polyadenylation sites - or quantify their alternative usage. This is
particularly difficult for hybrid terminal exons, which can be used as either terminal and internal
exons in the same cell type. The ability to measure terminal site usage simultaneously with mRNA
levels and isoform usage would enable a complete picture of the dynamics of both alternative
untranslated regions and internal coding exons. To overcome these challenges, we set out to develop
an approach that robustly identifies and quantifies hybrid exons, internal exons, and exons used
only as terminal exons.

The HIT index classifies exons based on their isoform-specific usage
We developed the Hybrid-Internal-Terminal (HIT) index, the first metric that leverages informative
SJRs in short read polyA RNA-seq data to classify exon positioning and usage within an isoform.
SJRs in RNA-seq data can be used to discern the connectivity between two exons that have been
spliced together. Internal exons should have approximately the same number of SJRs connected to
both upstream and downstream flanking exons. On the other extreme, the SJR distribution around
terminal exons should be skewed such that there are only junctions connected to gene-proximal
flanking exons (downstream flanking exons for FEs, or upstream flanking exons for LEs,). Thus,
we rationalized that hybrid exons should have an intermediate distribution between FE and internal,
or between internal and LE, with both upstream and downstream SJRs present, but a skew towards
more gene-proximal SJRs depending on the terminal positioning of the hybrid exon. Building on
these assumptions, the HIT index calculates the bias in upstream and downstream SJRs for each
annotated exon (Figure 1A). The HIT index pipeline involves 3 primary steps: (1) annotating meta-
exons from a transcript annotation, (2) extracting overlapping upstream and downstream SJRs for
each exon, and (3) calculating the HIT index, classifying exons, and estimating percent spliced in
values for alternative terminal exons. Since exact exon boundaries are confounded by imprecision
in or alternative transcription start sites (TSS), 3’ and 5’ splice sites, and/or transcription end sites
(TES), we use non-redundant metaexons (generated by collapsing all overlapping annotated exons)
with an added buffer region. Statistical significance for the HIT index metric is estimated using a

Page 3 of 34
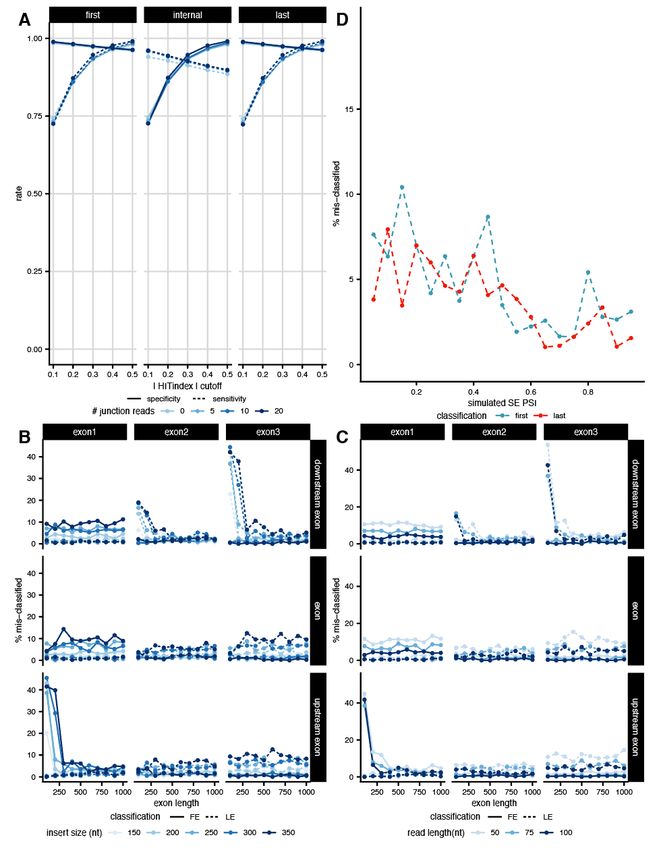
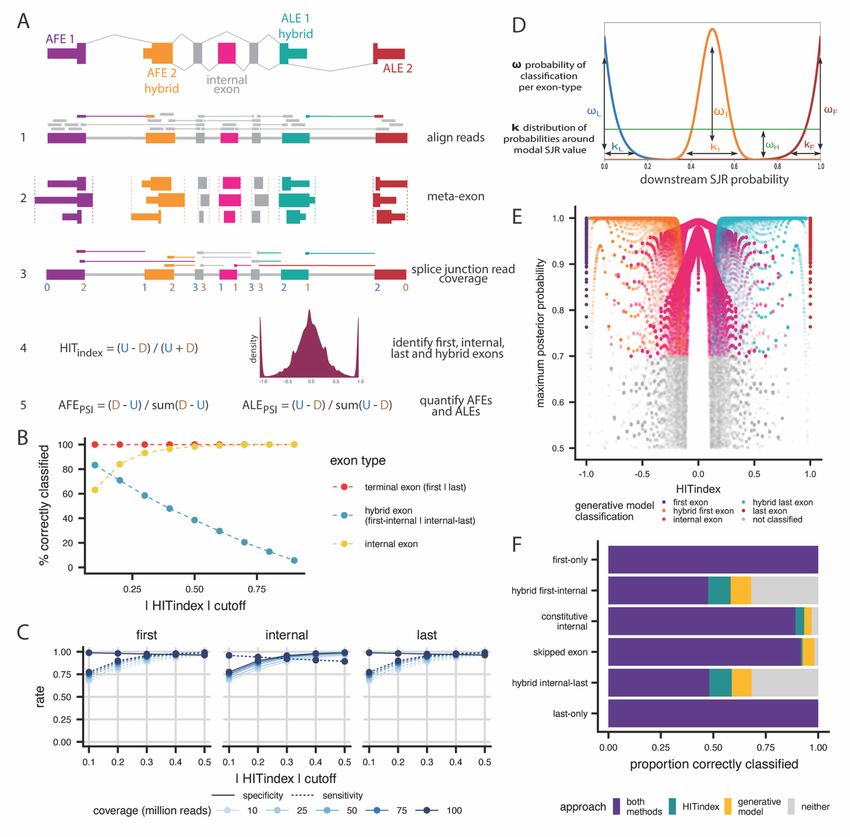
bioRxiv preprint doi: https://doi.org/10.1101/2021.05.27.446076; this version posted May 29, 2021. The copyright holder for this preprint (which
 was not certified by peer review) is the author/funder, who has granted bioRxiv a license to display the preprint in perpetuity. It is made
 available under aCC-BY-NC-ND 4.0 International license.

bootstrapped confidence interval and a measure of the probability that the HITindex was within
±10% of the observed value (Methods). With this formalization, exons used solely as FEs or LEs
have a HIT index of –1 or 1, since they only have downstream or upstream SJRs, respectively.
Internal exons, which should have roughly equal numbers of upstream and downstream SJRs, tend
to have a HIT index near 0. Notably, this approach allows us to classify hybrid exons, which exhibit
|HIT| indices between 0 and 1 commensurate with the fraction of transcripts that include a hybrid
exon as a terminal or internal exon.

HITindex accurately classifies simulated exon data
To assess the performance of our approach, we simulated mRNAs with a range of gene structures
(varying numbers, usage, and lengths of terminal, hybrid, alternatively spliced, and constitutive
exons) and gene expression levels, and created short reads using a range of library preparation
parameters, including different fragment sizes and read lengths (Figure S1, Methods). We then
calculated the HIT index for each simulated exon using exon-exon junction reads as described
above and classified exons as terminal exons that serve solely as FEs or LEs in a transcript, internal
exons, and hybrid exons that can be used as either terminal or internal exons in a transcript.
Classifications were performed as described in the Methods, with variable HIT index thresholds
when specified. Overall, HIT index classifications recapitulate expected exon classifications at
loose to moderate HIT index thresholds that represent less than a 50% imbalance (|HIT index| <
0.5, Figure 1B). Conversely, the classifications capture a smaller portion of hybrid exons at
stringent thresholds of greater than 50% imbalance (|HIT index| > 0.5), but with higher confidence
that each exon is truly hybrid. Since terminal-only exons entirely lack gene-distal junction reads
and thus have extreme HIT indices of 1 or –1 (for FEs or LEs, respectively), all terminal exons can
be reliably classified regardless of the chosen threshold. However, there is a tradeoff between the
identification of hybrid exons and internal exons, where more hybrid exons are correctly identified
at less stringent thresholds at the expense of the proper identification of internal exons.

We next sought to use these simulation data to identify systematic biases and characteristics of the
data in situations where the HIT-index is unable to correctly classify hybrid or internal exons. The
sensitivity for identifying terminal exons increased with more stringent |HITindex| thresholds,
coupled to slightly reduced specificity in terminal exon classification (Figure 1C). Given that >95%
of terminal-only exons (Figure 1B) are correctly classified, the variance in predictive values is
entirely driven by hybrid exon classification. Both the false positive and false negative rates of
terminal exon classification are less than 10% when using |HITindex| ≥ 0.3. However, the increased
ability to correctly classify terminal exons across |HITindex| thresholds occur at the expense of the
sensitivity, but not specificity, of internal exon classification. In both cases, overall specificity and
sensitivity scale with the read depth of libraries (Figure 1C) and the minimum number of SJRs
required (Figure S2A). Based on these trends, we further probed the parameters that influenced
internal exon and hybrid exon classification across the chosen thresholds.

Exons that are solely used as internal exons should have an even distribution of upstream and
downstream junction reads, however, we see that as many as 40% of internal exons are mis-
classified at less restrictive |HITindex| thresholds, with as much as a 30% imbalance of junction
reads. We reasoned that mis-classification of internal exons might be associated with their position
in the gene, and therefore evaluated the mis-classification of exons stratified by their order in the
gene (first, second, or third internal exon), the length of the exon, and the lengths of the upstream
or downstream flanking exons (Figure S2B,C). Internal exons are more likely to be mis-classified
as either FEs or LEs when the length of upstream or downstream exons, respectively, are shorter.
Further, this mis-classification is more extreme when the library has larger insert sizes (Figure S2B)
or is sequenced with shorter read lengths (Figure S2C). These trends suggest that our ability to

Page 4 of 34
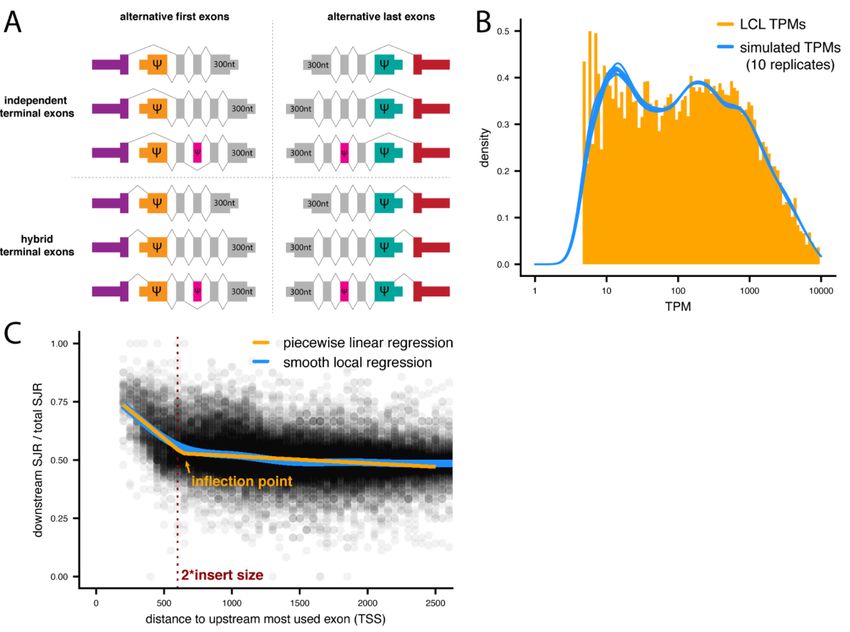
bioRxiv preprint doi: https://doi.org/10.1101/2021.05.27.446076; this version posted May 29, 2021. The copyright holder for this preprint (which
 was not certified by peer review) is the author/funder, who has granted bioRxiv a license to display the preprint in perpetuity. It is made
 available under aCC-BY-NC-ND 4.0 International license.

classify internal exons that are near terminal exons is affected by RNA-seq edge effects, whereby
there is a depletion of reads at the edges of molecules caused by size selection to achieve a narrow
distribution of fragment lengths before sequencing. We do not see these same trends for skipped
exons (SE), which were always flanked by two constitutive exons in the simulations. Instead, the
ability to classify an SE as an internal exon is dependent on the percent spliced in (PSI) of the
skipped exon, where lower SE inclusion results in a moderately higher frequency of mis-
classification (< 10%) due to decreased junction read coverage (Figure S2D). To account for
constitutive internal exon mis-classification, we incorporated an edge effect flag, which uses
piecewise regression to identify exons that are likely to be affected by the edge effect (Figure S1C,
Methods) and allows the end user to decide whether to include or exclude those exons from
downstream analyses.

Since the HIT index represents the imbalance between upstream and downstream junction reads,
the choice of HIT index threshold has a large impact on the ability to identify hybrid exons. To
assess this impact, we stratified the percent of hybrid exons correctly classified by HIT index
thresholds and the percent usage of the hybrid exon as a FE, measured by the percent spliced in
(PSI) value (Figure S3A). Regardless of HIT index threshold, moderate to minimal usage of the
hybrid exon as a FE rather than an internal exon reduces the ability to classify the exon as a hybrid
exon, because junction reads are less skewed. At more stringent thresholds (|HIT index| > 0.5), the
detection of hybrid exons with an FE PSI < 0.5 drops below 25%. When we evaluate the
classification of hybrid exons at a moderate HIT index threshold of 0.3, this relationship becomes
even more evident, where the assignment to hybrid decreases as PSI decreases and these exons are
classified as solely internal exons.

To alleviate these issues, we developed a probabilistic framework to classify exons by directly
modeling the probability of any exon being a hybrid, internal, or terminal exon considering read
coverage and the ratio of downstream junction reads to total junction reads (Methods, Figure 1D).
Specifically, this generative approach relies on jointly modeling the ratio of downstream junction
reads to all junction reads for first, internal, and last exons, assuming that these exons are derived
from probability distributions with a mode of 1, 0.5, and 0, respectively, with variance among the
different exons for each class. Thus, the downstream junction read probabilities can be modeled as
arising from a mixture of these three distributions and exons can be assigned a posterior probability
of belonging to each distribution. Hybrid exons are detected as outliers relative to each of the non-
hybrid distributions, enabling the estimation of a posterior probability of being either a first-internal
or internal-last hybrid exon. Importantly, this method accounts for the intrinsic noisiness in
sequencing data and the overdispersion of read counts relative to simple binomial or Poisson count
distributions. By moving away from a strict HIT index threshold and allowing for flexibility in the
classification probability of an exon, this framework enables exons to be correctly classified across
the distribution of HIT indexes (Figure 1E). Most exons, including all terminal exons, are correctly
classified by both the HIT index and generative model (Figure 1F). However, combining the two
approaches leads to an increase in the classification of hybrid and internal exons, where the HIT
index has more power for exons with lower read coverage, while the generative model has more
power to classify hybrid exons with moderate PSI values (Figure S3B). All together, the combined
approach is able to correctly classify 68% of simulated hybrid exons and 97% of internal exons.

Identification of hybrid exons in human transcriptomes
We applied the HIT index pipeline to a high-coverage human RNA-seq data from LCL cells to
evaluate the performance of our new method in classifying bonafide terminal, internal and hybrid
exons. From a total of 353,677 annotated metaexons, we discarded 50% that are not expressed and
0.3% located in single-exon genes (Figure 2A). Using an absolute HIT index cutoff of 0.3 classified

Page 5 of 34
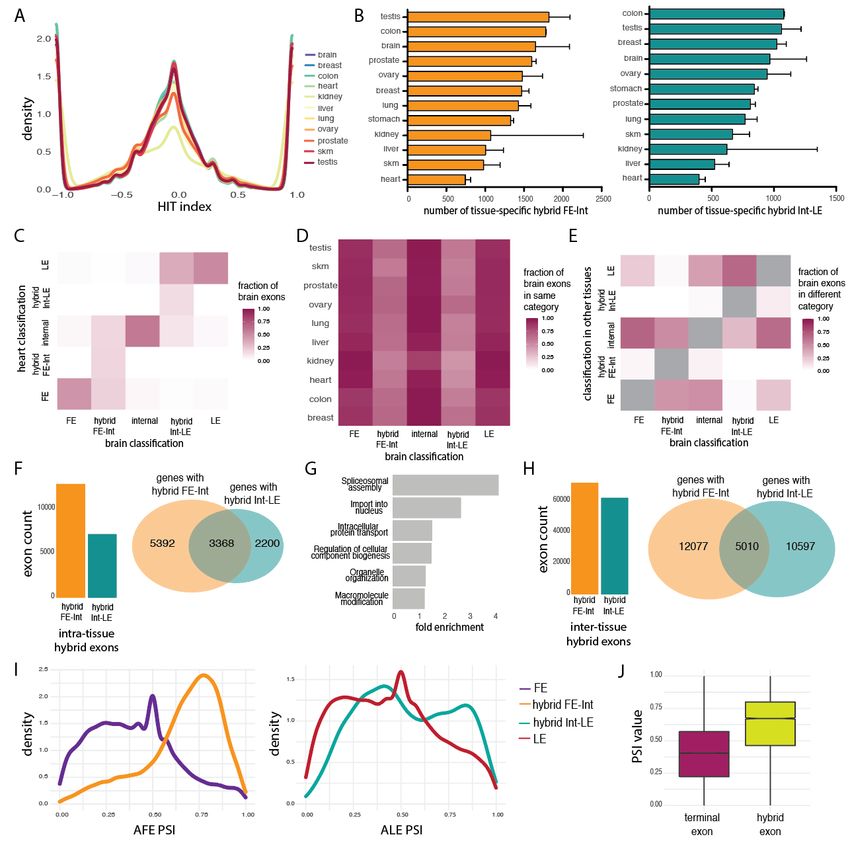
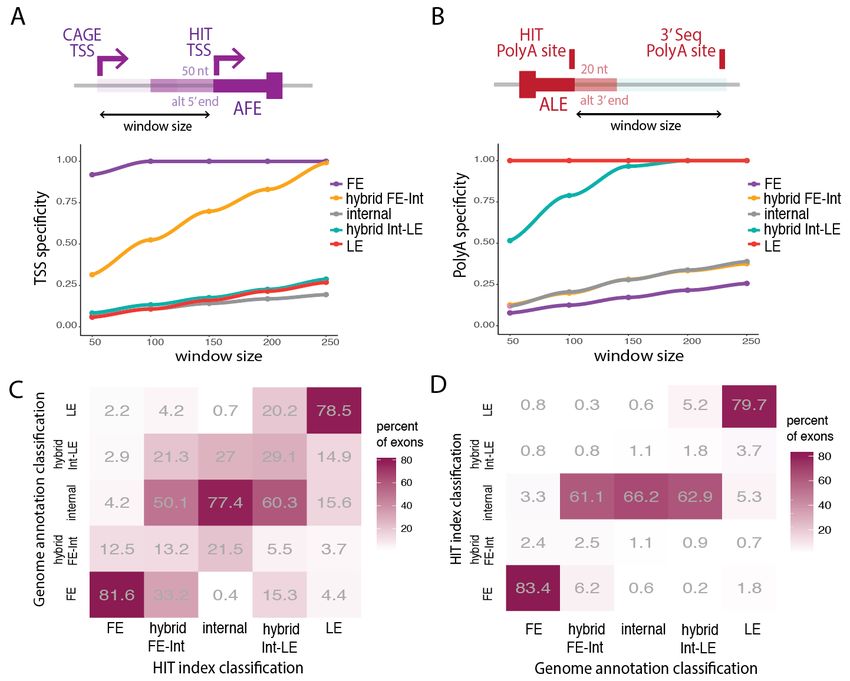
bioRxiv preprint doi: https://doi.org/10.1101/2021.05.27.446076; this version posted May 29, 2021. The copyright holder for this preprint (which
 was not certified by peer review) is the author/funder, who has granted bioRxiv a license to display the preprint in perpetuity. It is made
 available under aCC-BY-NC-ND 4.0 International license.

~60,000 internal, ~16,000 terminal and ~30,000 hybrid exons. (Figure 2B). We divided hybrid
exons into hybrid FE-internal and hybrid internal-LE, each corresponding to ~13% of total
expressed exons (Figure 2C). Consistent with the simulated data, metaexons classified as hybrid by
the HIT index have significantly higher probability of being classified as hybrid by the generative
model (Figure 2D,E). Thus, we divided hybrid exons into high, medium or low confidence
classifications depending on the bootstrapping variance metric (Methods, Figure 2F) and estimated
the probability of consistent classification by the generative approach. As expected, the HIT index
has lower power to identify hybrid exons relative to exons solely used as internal or terminal (Figure
S4A,B). to study the properties of hybrid exons, below we consider only high confidence hybrid
exons, which we define as being classified as a hybrid using the HIT index and a first-internal or
internal-last posterior probability greater than 0.5 when using the generative model (Figure 2G).
With these conservative criteria, we can reliably classify 3.82% of exons as hybrid in this dataset
(Figure S4C).

Reference techniques validate HIT index classifications
In order to evaluate the accuracy of the HIT index classifications from RNA-seq data with
orthogonal datasets, we used CAGE (26) and 3’end sequencing (27) datasets for direct assessments
of TSS and TES usage, respectively. All HIT index classified FE and hybrid FE-internal exons
overlapped with CAGE-identified TSSs, while all LE and hybrid Internal-LE exons overlapped
with 3’sequencing-identified TESs (Figure 3A, B). Reassuringly, terminal and hybrid exons
classified as first or last did not significantly overlap the TESs or TSSs, respectively, supporting
high specificity of HIT index classifications. Moreover, neither gene expression thresholds nor |HIT
index| cutoffs change TSS and TES specificity significantly (Figure S5). Overall, these orthogonal
reference techniques validated HIT index classifications and demonstrated 100% specificity in
determining true positive TSS and TESs. The HIT index also reliably identified hybrid exons,
significantly expanding the landscape of exons that can act as FE and LE.

We then compared HIT index classifications to annotated exon classifications (see Methods). While
most HIT index terminal and internal exons were annotated as the same, the majority of hybrid
exons were solely annotated as internal exons in genome annotations (Figure 3C). This suggests
that current genome annotations underestimate the existence of hybrid exons. A similar
underestimation of hybrid exons is true when conditioning on annotated exons and comparing to
HIT index classifications (Figure 3D). Consistent with previous work (28), we find that only a
minority of annotated exons are expressed in a single cell type and of these, many hybrid exons are
mis-classified as internal exons. Together, our new classifications show that a reliance on genome
annotations in RNA-seq analyses underestimates the usage of alternative terminal exons by mis-
classifying hybrid exons.

We also used Oxford Nanopore direct RNA long-read sequencing data from LCLs to validate the
HIT index classifications in selected genes that we highlight here (Figure 4). First, SFPQ is a
member of the proline/glutamine-rich family of splicing factors and is associated with amyotrophic
lateral sclerosis (29) Alzheimer’s disease and frontotemporal dementia (30). The tenth exon of
SFPQ is used as a terminal exon in the longest isoform of SFPQ and is essential, since isoforms
that skip exon 10 are non-coding or degraded by NMD. When exon 10 is excluded, splicing
switches to a group of exons in the 3’-UTR, with exon 14 used as an alternative LE. We found that
exon 12 is a hybrid FE-internal exon, used as an internal exon in transcripts that skip only exon 10
and as an FE in transcripts that skip exon 10 and use exon 14 as a LE (Figure 4A). SFPQ binds its
own mRNA (Figure 4B), suggesting self-regulation of alternative splicing and polyadenylation
(31). This suggests that the hybrid usage of SFPQ exons could contribute to the modulation of
levels of active SFPQ protein.

Page 6 of 34
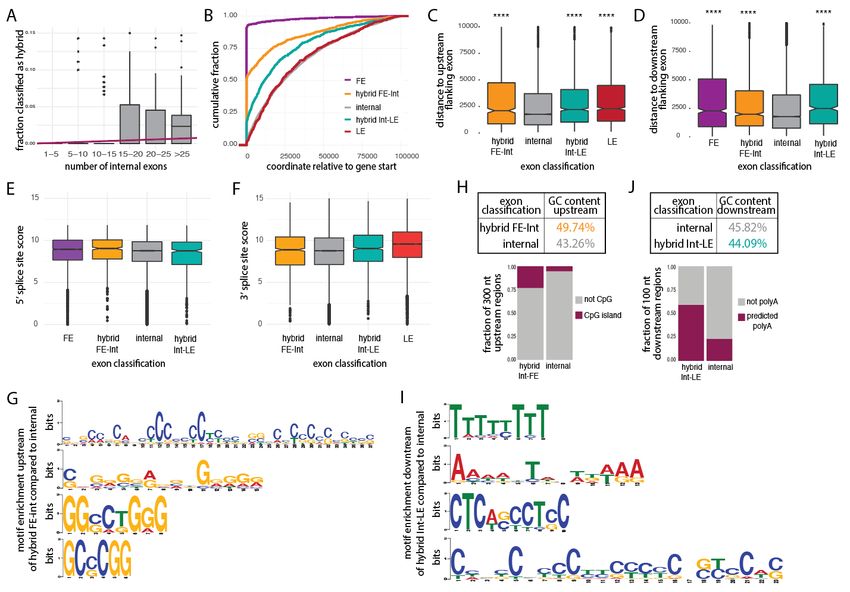
bioRxiv preprint doi: https://doi.org/10.1101/2021.05.27.446076; this version posted May 29, 2021. The copyright holder for this preprint (which
 was not certified by peer review) is the author/funder, who has granted bioRxiv a license to display the preprint in perpetuity. It is made
 available under aCC-BY-NC-ND 4.0 International license.

In another example, PTPN6, a member of the protein tyrosine phosphatase (PTP) family that
functions as an important regulator of multiple signaling pathways in hematopoietic cells, also has
a hybrid FE-Internal and several splicing isoforms. We identified three alternative FEs, including a
hybrid FE-internal second exon that is associated with expression of the predominant isoform
(Figure S6A). Third, we found an unannotated hybrid internal-LE that acts as the predominant LE
in LCLs for RPS3A (Figure 4C), whose full-length isoform encodes a component of the 40S
ribosome subunit. When the hybrid exon is used as an LE, the mRNA lacks a stop codon and is
subjected to non-stop decay (Figure 4D). Thus, regulation of the hybrid exon of RPS3A controls
the levels of the full-length protein of a ribosomal protein. Finally, CCT8 encodes the theta subunit
of the CCT chaperonin, which is involved in the transport and assembly of newly synthesized
proteins. In LCLs, we observed expression of two alternative FE and a hybrid internal-LE that
produces a truncated protein (Figure S6B). These examples illustrate how hybrid exons can play an
important role in modulating gene expression and isoform prevalence of individual genes that have
global impacts on gene regulation and protein levels.

Hybrid exons occur downstream of CpG islands and upstream of polyA sites
To understand the distribution of hybrid exons across human genes, we analyzed the molecular
features of the genes in which they occur. We first focused on the gene architecture of these genes,
specifically, the number of overall exons and internal exons. We observed that hybrid exons tend
to occur in genes with ten or more internal exons (Figure 5A, S7A) and most genes host only one
hybrid exon (Figure S7B). However, genes with more internal exons do not have more hybrid exons
(Figure S7A), suggesting that additional features govern the regulation of hybrid exons. As
expected, hybrid FE-internal exons occur towards the 5’ end of genes compared to hybrid internal-
LE exons, although hybrid exons are generally located in internal positions relative to terminal-
only exons (Figure 5B, S7C). Furthermore, hybrid FE-internal exons often occur downstream of
FEs and upstream of internal exons, while hybrid internal-LE exons often occur downstream of
internal exons and upstream of LEs (Figure S7D, S7E). Introns that flank hybrid exons tend to have
intermediate length, such that hybrid exons have longer flanking introns compared to internal
exons, but shorter flanking introns relative to terminal exons. This may allow for more genomic
space for proximal sequence elements that regulate the usage of hybrid exons (Figure 5C, 5D).
Hybrid exons also tend to have equally strong or stronger splice sites than terminal exons,
reinforcing the idea that the genomic characteristics of hybrid exons fall in between internal and
terminal exons (Figure 5E, 5F).

We sought to identify candidate genomic features involved in the regulation of hybrid exons, by
looking for motifs enriched in regions flanking hybrid exons relative to regions flanking internal
exons. For transcription to initiate from a hybrid FE-internal TSS, the immediately upstream
sequence should act as a promoter. A recent study showed that ~60% of random sequences are 1nt
away from being able to serve as active promoters in bacteria (32). In mammals, core promoters
are still not fully understood, but include structurally and functionally diverse sequences composed
of a variety of DNA elements, including CpG islands (33–35). We observed that the regions
upstream hybrid FE-internal exons are enriched for motifs with long stretches of Cs and Gs (Figure
5G), with an observed-to-expected CpG ratio greater than 60%, significantly more CpG islands (at
least 200 nt of CGs enrichment), and an average of ~50% GC content (Figure 5H). These CpG
islands tend to be located immediately upstream of hybrid FE-internal start coordinates (Figure
S7F). Although our results do not show causality, they suggest that CpG rich regions upstream of
internal exons are associated with a gain of hybrid usage and novel transcription initiation sites.
Conversely, sequences downstream hybrid internal-LE exons are enriched in motifs rich in As and
Ts (Figure 5I), have slightly lower CG dinucleotide content, and have significantly more predicted

Page 7 of 34
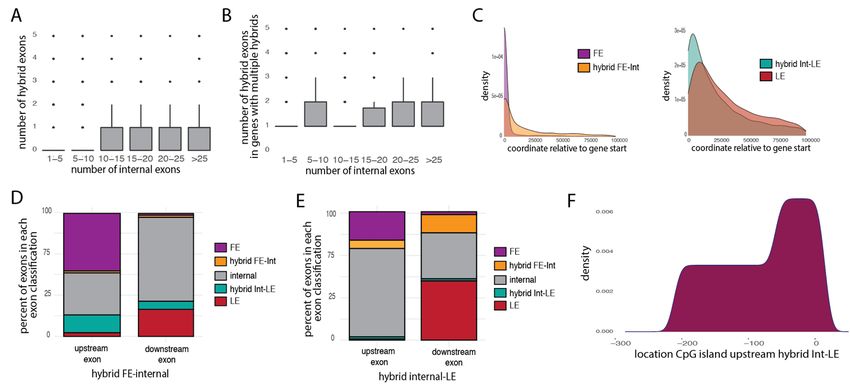
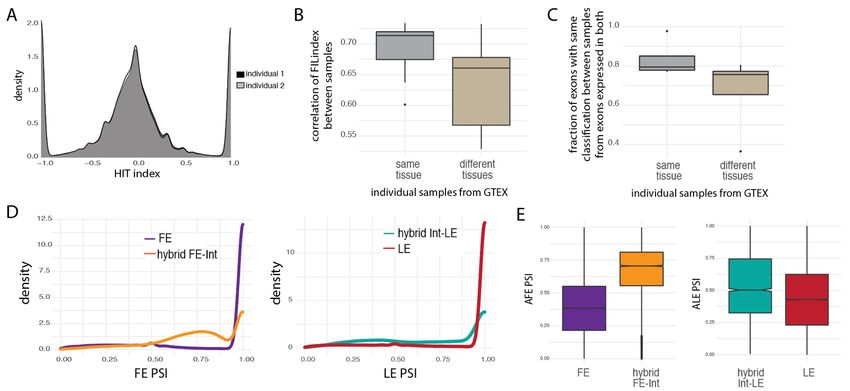
bioRxiv preprint doi: https://doi.org/10.1101/2021.05.27.446076; this version posted May 29, 2021. The copyright holder for this preprint (which
 was not certified by peer review) is the author/funder, who has granted bioRxiv a license to display the preprint in perpetuity. It is made
 available under aCC-BY-NC-ND 4.0 International license.

polyA sites than internal exons (Figure 5J). Our findings show that the gain of hybrid internal-LE
usage is associated with the presence of downstream polyA sites.

Widespread usage of intra-tissue and inter-tissue hybrid exons
Alternative mRNA isoforms are often seen as signatures of different tissues or cell types. Thus, we
wanted to evaluate the differential usage of hybrid exons across human tissues. To do so, we used
our HIT index pipeline to analyze RNA-seq data from GTEx (36). We observed that the distribution
of HIT index does not vary significantly across human tissues (Figure 6A), but the numbers of high-
confidence hybrid exons show a tissue-specific pattern. Both types of hybrid exons are more
predominant in testes, colon and brain tissues, all tissues that are known to have extensive
alternative isoform usage (Figure 6B). The brain enrichment is consistent with neuronal genes being
larger, with longer introns and undergoing more alternative RNA processing. While both types of
hybrid exons showed similar tissue-specificity, there are significantly more hybrid FE-internal
exons than hybrid internal-LE exons per tissue (Figure 6B), with twice as many observed in brain
tissues, suggesting that hybrid FE-internal are more prevalent in the human genome. The greater
variability of hybrid FE-internal exons across tissues suggests that these exons may be more tissue-
specifically regulated than hybrid internal-LE exons.

Hybrid exons might be more likely to arise in genes with particular functions or tissue-specific
expression patterns. To understand whether the same genes consistently utilize hybrid exons across
tissues, we calculated the fraction of exons expressed in brain tissues that are classified as the same
exon-type in heart or have alternative usage. We observed that, although the majority of exons
expressed in brain tissues are not expressed in heart tissues, most terminal or internal exons are
classified as the same exon type in heart. In contrast, exons identified as hybrid FE-internal in brain
are equally likely to be classified as FE, hybrid FE-internal and internal in heart. Similarly, hybrid
internal-LE exons in brain tissues are mostly classified as LE, followed by hybrid internal-LE and
internal in heart (Figure 6C). Expanding this analysis to all pairwise tissue comparisons, both types
of hybrid exons are consistently less likely to be classified as hybrid across tissues relative to
terminal or internal exons, which suggests that hybrid exons are more likely to be alternatively used
across tissues and hybrid usage tends to be tissue-specific (Figure 6D). We note that since hybrid
exons are more difficult to detect, the detection of hybrid exons may be underestimated. Exons
classified as FEs and LEs in brain tissues are both mostly classified as internal in other tissues,
while brain internal exons are mostly classified as FE and LEs. Similarly, brain-specific hybrid
exons are mostly classified as internal and FE or LE (depending on their hybrid type; Figure 6E).
Finally, the HIT index classifications of exons in the same tissue across different individuals in the
GTEX dataset are significantly more similar than the exon classifications of a given individual
across tissues (Figure S8A, B, C), suggesting that exon classifications are highly tissue-specific and
robust to technical variance across libraries. Together, our findings demonstrate that hybrid exons
are more likely to be used as both terminal and internal exons in a tissue-specific manner, while
being used as only terminal or internal exons in other tissues. This is consistent with the
observations that hybrid exons tend to have properties intermediate between internal and terminal
exons, and potentially allowing for more flexibility in isoform usage.

Since hybrid exons allow for increased isoform diversity, we reasoned that hybrid exons might arise
within genes that would benefit from flexibility in RNA processing. We first asked if genes with
one type of hybrid exon are more likely to have another type of hybrid in the same tissue. Indeed,
genes with hybrid FE-internal exons are 1.3-fold more likely to have hybrid internal-LE exons than
expected by chance (overlap p-value < 9.822´10-85) (Figure 6F). Genes with both types of intra-
tissue hybrid exons are enriched in spliceosome components and splicing factors (Figure 6G). The
enrichment of hybrid exons within factors involved in splicing may contribute to the autoregulation

Page 8 of 34
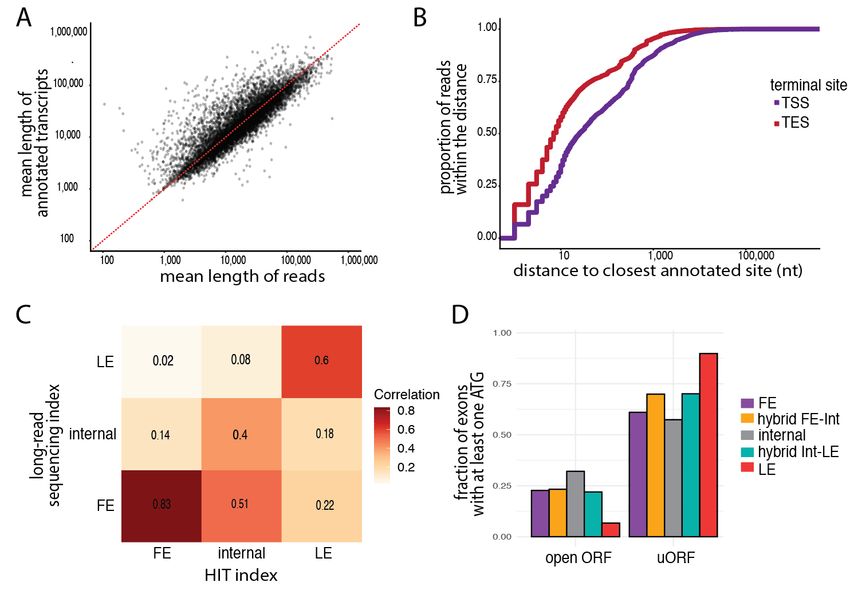
bioRxiv preprint doi: https://doi.org/10.1101/2021.05.27.446076; this version posted May 29, 2021. The copyright holder for this preprint (which
 was not certified by peer review) is the author/funder, who has granted bioRxiv a license to display the preprint in perpetuity. It is made
 available under aCC-BY-NC-ND 4.0 International license.

of these factors, as for SFPQ above, or may contribute to tissue-specific splicing programs. More
broadly, an exon could be used as a terminal exon in one tissue, but as an internal exon in another
tissue, which we term inter-tissue hybrid exons We identified more than 130,000 inter-tissue hybrid
exons across human tissues (10% of all exons analyzed across tissues) and similar to intra-tissue
hybrids, genes with inter-tissue hybrid FE-internal are significantly more likely to have an inter-
tissue hybrid internal-LE (Figure 6H). Finally, we asked what proportion of isoforms are likely to
use hybrid exons as terminal exons. Surprisingly, we observed that hybrid exons are used in a
relatively high proportion of isoforms compared to terminal exons, as measured by percent spliced
in (PSI) values. Hybrid exons produce the predominant gene isoforms across all tissues analyzed
(Figure 6I & J S8D & E). Our findings indicate that tissue-specific hybrid exons drive large changes
in isoform usage and are likely to have major impacts on mRNA and protein synthesis.

Discussion
Here, we describe the first computational pipeline to identify and classify hybrid exons, a largely
undescribed type of exons, from RNA-seq data. The HIT index uses splice junction reads to classify
exons as terminal exons that serve solely as FEs or LEs in a transcript, internal exons, or hybrid
exons. We find that, conservatively, 10% of human exons are intra-tissue hybrid exons that can
serve as either terminal or internal exons in a transcript. However, technical biases due to library
preparation and low proportional usage of exons (Fig. X, simulation data) may lead to an
underestimation of the true number of hybrid exons in human tissues. Moreover, increased tissue
and cell type sampling with higher coverage sequencing data could increase our power to
identify intra- and inter-tissue hybrid exons and the contexts in which they are used.

Orthogonal genome-wide high-throughput sequencing datasets targeting terminal site usage and
long-read RNA sequencing were used to validate our classifications and hybrid exons in individual
genes. We obtained 100% TSS and polyA specificity for all terminal exons including hybrid exons
(Figure 3). Consistent with previous studies (37–40), we find that the high frequency of truncated
reads in the long-read sequencing prevented us from using these data to globally validate terminal
or internal site usage. Combined with high error rates and potential coverage biases, long-read
Direct RNA sequencing anchored on the polyA tail leads to substantial 5’ truncation of transcripts,
reflected in 5’ ends of reads being located farther, on average, from annotated terminal sites than
3’ ends of reads and reads lengths that are smaller than average transcript lengths of the
corresponding annotated isoforms (Figure S9A, B). These biases significantly affect terminal exon
identification and quantification. Thus, only 50% of our HIT index classifications are matched
using long-read sequencing methods (Figure S9C), which could be due to either the aforementioned
lack of power in long-reads for terminal exon identification, limitations of the HIT index
classifications, or a combination of these effects. Regardless, despite the great promise of long-read
sequencing technologies, short-read sequencing datasets are still necessary to classify exons.
Furthermore, the HIT index may provide a useful tool to calibrate terminal end truncation in long-
read RNA sequencing datasets.

We found that hybrid exons are an inherently flexible exon type due to their ability to serve as either
terminal or internal exons within a transcript. Given their potential to increase both the coding
capacity and regulatory potential within a genome, hybrid exons are an underappreciated way in
which cells can expand their transcriptome and proteome to fine-tune alternative isoform usage
from a single gene. Since hybrid exons can influence either untranslated regions or coding
sequences depending on their usage, they are likely subjected to different evolutionary selective
pressures than either internal-only or terminal-only exons. We found that both FE and hybrid FE-
internal exons have fewer ATGs that start the open reading frame (ORF) compared to internal exons
(Figure S9D), suggesting that they mostly affect untranslated regions. However, hybrid FE-internal

Page 9 of 34
bioRxiv preprint doi: https://doi.org/10.1101/2021.05.27.446076; this version posted May 29, 2021. The copyright holder for this preprint (which
 was not certified by peer review) is the author/funder, who has granted bioRxiv a license to display the preprint in perpetuity. It is made
 available under aCC-BY-NC-ND 4.0 International license.

exons have higher frequency of upstream ORFs (uORFs), which are key regulators of gene
expression and often activate or inhibit downstream expression of the primary ORF. Their dual-
regulation by both splicing machinery and transcription or polyadenylation machinery (for hybrid
FE or LE exons, respectively), suggests that hybrid exons lie in regions with flexible or multi-
purpose regulatory sequences.

Our analysis detected CG-rich sequences upstream of hybrid FE-internal and polyA rich motifs
downstream of hybrid internal-LE exons, indicating that hybrid exons are enriched for specific
sequence features that may enable their use as either terminal or internal exons. These features are
generally associated with transcription initiation and polyadenylation, respectively, but we did not
specifically identify any auxiliary sequences canonically associated with mRNA splicing (apart
from the expected canonical splice sites). These findings suggest that there might be competition
sites involved in splicing and transcription/polyadenylation for usage of a particular exon, which
may be influenced by as yet unidentified sequence features, local epigenetic marks, DNA
confirmation, RNA secondary structure, or coordination with other RNA processing events on the
same transcript. We speculate that instead of creating new exons (8, 41), hybrid exons represent
exons that gained new functions in order to increase diversity over evolution. Further studies of the
evolutionary histories of these flexible hybrid exons may shed light on how new exons or isoforms
arise in tissues or species and the mechanisms by which they are recognized by transcription factors,
splicing components and termination machinery.

Together, our findings demonstrate the unique role that hybrid exons play in human transcriptomes
and highlight that our understanding of transcriptome complexity is far from complete.

Materials and Methods

HIT-index pipeline for exon classification
The HIT index approach uses the ratio between splice junction reads that overlap the beginning or
end of exons to classify exons as being first, hybrid first, internal, hybrid last, or last exons. The
HIT index pipeline involves 3 primary steps: (1) annotating meta-exons from a transcript
annotation, (2) extracting overlapping junction reads for each exon, and (3) calculating the HIT
index, classifying exons, and estimating percent spliced in values for alternative terminal exons.
The full pipeline is available as a set of python scripts, with detailed usage instructions, at
github.com/thepailab/HITindex.

Exon definition and junction read counting. First, for each gene in a transcriptome reference file
(i.e. gtf), annotated exons with overlapping boundaries are merged with pybedtools (42) to create a
meta-exon. The boundaries of these meta-exons are used to extract junction reads. To account for
ambiguity in the exact position of transcription start sites, splice sites, or mRNA cleavage sites, an
optional buffer region is added to the boundaries of meta-exons, with a recommended distance of
50nt upstream of the 5’end of the exon and 30nt downstream of the 3’end of the exon. Second,
splice junction reads (SJRs) (split between two regions) are extracted using samtools (43). For each
exon, SJRs that span the 5’ boundary (with at least 10nt overlap) are counted as upstream SJRs and
SJRs that span the 3’ boundary (with at least 10nt overlap) are counted as downstream SJRs,
regardless of the junction-specific boundaries (ie. specific splice sites used). For example, an exon
with 2 alternatively used 5’ splice sites would have an upstream SJR count that is the sum of
junction reads derived from splicing to both 5’ splice sites. SJRs that begin and end in the same
meta-exon are considered spurious and not used for further analysis.

Page 10 of 34
bioRxiv preprint doi: https://doi.org/10.1101/2021.05.27.446076; this version posted May 29, 2021. The copyright holder for this preprint (which
 was not certified by peer review) is the author/funder, who has granted bioRxiv a license to display the preprint in perpetuity. It is made
 available under aCC-BY-NC-ND 4.0 International license.

HIT index estimation. The HIT index and associated metrics are calculated for each exon with at
least 5 total SJRs. Specifically, the HIT index is calculated as the the ratio of the imbalance in
upstream and downstream SJRs over the total SJRs for the exon, as defined in Equation 1.

 !"#!" $!"##$%&
 (1) = !"#!" % !"##$%&

Two metrics are used to assess robustness of the HIT index estimation: (1) bootstrapped confidence
intervals and (2) a bootstrapped variance metric representing the probability that the true value of
the HIT index as within ±10% of the observed value. Both metrics are calculated through
bootstrapping HIT indices for each exon from reads randomly subsampled with replacement for a
user defined number of bootstraps (1000 suggested samples). 75%, 90%, and 95% confidence
intervals are calculated from the distribution of bootstrap statistics. The bootstrapped variance
metric is calculated as the number of times that bootstrapped statistics are at least 10% lower or
higher than the actual HIT index estimate.

Edge-effect flag. Simulated data uncovered biases in the HIT index estimation that existed
specifically for exons near the edges of transcripts, where an RNA-seq edge effect led to a depletion
of upstream or downstream SJRs for exons near the 5’ or 3’ ends of transcripts, respectively (Figure
S1C). To account for this, the HIT index pipeline flags exons that have a higher probability of being
affected by the edge effect and allows the user to decide whether to include them in downstream
analyses. Exons are flagged based on their distance to the transcript end and an empirical
determination of the distance at which SJR ratios are biased due to the edge effect, which is
expected to be approximately one fragment length away from the end of the transcript. Specifically,
piecewise linear regression is used to find the inflection point between the two subsets of exons:
(1) exons unaffected by edge-effect induced SJR biases, with equal upstream and downstream SJRs
on average and (2) exons affected by edge-effects, with a linear relationship between the exon’s
distance from the transcript end and the SJR bias. Exons with a 5’ or 3’ distance lower than the
inflection point and not classified as terminal only exons (|HITindex| = 1) are flagged as edge-effect
exons.

Probabilistic Framework. Given technical biases in the data, we developed a generative approach
that estimates the probability that the ratio of downstream SJRs to the total SJRs arises from a
particular exon type. Rather than assume that the ratio of downstream SJRs are generated from
exons with some fixed probabilities, we assume that first-only, internal-only, and last-only exons
generally have downstream SJR probabilities that are near 1, 0.5, and 0, respectively, but vary
among the different exons in each class. Assuming the modes of these distributions are likely 1,
0.5, and 0, the model estimates two features from the data: (1) how concentrated downstream SJR
probabilities are around these modes and (2) the probabilities with which exons belong to each of
these classes. Using these two assumptions, we model downstream SJR probabilities as arising from
a mixture of these three distributions. Hybrid exons are then defined as exons poorly explained by
or outliers relative to any of the three non-hybrid distributions.
 Specifically, we define ' as the number of downstream SJRs mapping to exon i out of Ni total
SJRs. We model Di as arising from a mixture of beta-binomial distributions, representing the classes
of first-only F, internal-only I, last-only L, and hybrid H exons, as defined in equation 2.
 (2) ( ~ ( ' , , , )
A Dirichlet prior is used for the probability, , that an exon belongs to each class, defined as
 ~ ℎ ( ). The modes of the beta distributions in the beta-binomial mixture are defined as,
which are held constant as fixed assumptions: = { ) = 1, ( = 0.5, * = 0, + = 0}. The
concentration of beta-distributions around these modes , which we want to learn from the data for

Page 11 of 34
bioRxiv preprint doi: https://doi.org/10.1101/2021.05.27.446076; this version posted May 29, 2021. The copyright holder for this preprint (which was not certified by peer review) is the author/funder, who has granted bioRxiv a license to display the preprint in perpetuity. It is made available under aCC-BY-NC-ND 4.0 International license. the first-only, internal-only, and last-exons. We place relatively uninformative priors on these parameters, drawing them from half-normal distributions shifted to start at 3 since must be greater than 2 in order for the beta-distributions for ) and * to not become uniform: ) , ( , * ~ ( = 3, = 1000). In contrast, for the class of hybrid exons, we set + = 2, which, when coupled with the model + = 0, corresponds to a uniform distribution under the assumption that for hybrid exons, all downstream SJR probabilities are equally plausible. We use Automatic Differentiation Variational Inference (ADVI) as implemented in the PyMC3 python package (44) to fit an approximation of the posterior distribution, allowing estimates of the posterior means and variation around this mean. Given a sample of M draws from the posterior distribution, defined as ' ~ ( | ' ' ), we can estimate the probability that an exon arose from a particular component distribution zi based on observed Di and Ni counts, as defined in equation 3. , 6( 7 ./0' | 2' ,4' ,5 (3) S T ' | ' , ' , V WX = ∑: ∑ 6 - )*+ ./0' | 9,4' ,5( 7 Finally, hybrid exons are partitioned into two classes using the posterior over the underlying proportion of downstream SJRs, with P(HybridFI) and P(HybridIL) defined in equations 4 and 5, respectively. (4) ( ) = ∫ 5, ∙ ( | , , , ( ) ∙ ( ) dq (5) ( ) = ∫ 5 ∙ ( | , , , ( ) ∙ ( ) dq The generative model leads to the following outputs: (1) the posterior mean estimate for the fraction of downstream SJRs, (2) the posterior mean estimate for the fraction of downstream SJRs converted to the HIT index, (3) the posterior classification probabilities for first-only P(F), first-internal P(FI), internal P(I), internal-last P(IL), and last-only P(L) exons. Exon Classification and PSI value calculations. Exons are classified into the following categories: “first”, “FirstInternal_medium”, “FirstInternal_high”, “internal”, “InternalLast_medium”, “InternalLast_high”, and “Last” exons, using a combination of thresholds across the HIT index metic, statistical confidence metrics, and posterior probabilities from the generative model, with all thresholds specified in the user defined HIT_identity_parameters file. Specifically, terminal exons are defined as having a |HITindex| greater than or equal to the specified “HITterminal” threshold and a bootstrapping variance value less than the specified “HITpval”. Hybrid exons are defined as having a |HITindex| greater than or equal to the specified “HIThybrid” threshold, a |HITindex| less than the specified “HITterminal” threshold, and an appropriate generative model posterior probability greater than the specified “prob_med” or “prob_high” thresholds, for medium and high confidence classifications, respectively. Finally, internal exons are defined as all remaining exons, including those exons whose specified bootstrapped confidence interval overlaps zero. Exons classified as “first”, “FirstInternal_medium” or “FirstInternal_high” are used to calculate percent spliced in (PSI) values for alternative first exon (AFE) usage, while exons classified as “last”, “InternalLast_medium” or “InternalLast_high” are used to calculate PSI values for alternative last exon (ALE) usage, for each exon i out of n total first or last exons as defined in equations 6 and 7, respectively. !"# #$%&' $ !"# !"' (6) ;)< = ∑&',- !"# #$%& ' $!"#!"' !"#!"' $ !"##$%& (7) ;)< = ∑& ' ',- !"#!"' $!"##$%&' If the user selects the --edge flag, exons flagged as potentially being affected by edge-effects (see above) are not included in the PSI value calculations. Page 12 of 34
bioRxiv preprint doi: https://doi.org/10.1101/2021.05.27.446076; this version posted May 29, 2021. The copyright holder for this preprint (which
 was not certified by peer review) is the author/funder, who has granted bioRxiv a license to display the preprint in perpetuity. It is made
 available under aCC-BY-NC-ND 4.0 International license.

Simulations
We simulated 12 sets of artificial transcripts to assess the specificity and sensitivity of both the
FILindex and generative model (Figure S1A). For each of these transcript architectures, we
simulated short read RNA-sequencing data from a range of different genomic and expression
contexts: exon length (100nt - 1kb), proportional usage of alternative first or last exons (0.05 - 0.95
PSI), proportional usage of skipped exons (0.05 - 0.95 PSI), library insert size (150 - 300nt), read
length (50 - 100nt), and sequencing coverage (10-100M reads). Transcripts were also sampled from
a range of gene expression levels that matched the distribution of TPMs in real RNA-seq data
(Figure S1B). To generate short read data from transcripts, we simulated several steps of Illumina
library generation, including transcript fragmentation (using a modified Weibull distribution) and
fragment size selection (as detailed in (45)). The FILindex and generative model were applied to
simulated read data as described above.

RNA-seq data processing and analyses
We used RNA-seq data from LCL human cells available at NCBI Gene Expression Omnibus
(accession no. GSE30400 (46)) and several human tissues from different individuals from GTEx
(36) downloaded through dbGaP under accession numbers SRR1068855, SRR1091865,
SRR1366790, SRR1093075, SRR1375738, SRR1093527, SRR1437274, SRR1341721,
SRR1434586, SRR1347481, SRR1347481, SRR1313449, SRR1080415, SRR1085975,
SRR1313969, SRR1322373, SRR1362332, SRR1395999, SRR1441768, SRR1470273,
SRR1082352 SRR1086140, SRR1317751, SRR1323087, SRR1366473, SRR1396700,
SRR1460409, SRR1490246, SRR1071379, SRR1083632, SRR1090650, SRR1321351,
SRR1336314, SRR1388190, SRR1416516, SRR1464788. We excluded cases with different
numbers of reads in read1 and read2 and selected the most recent releases in cases with multiple
ones. Reads were mapped using STAR (47), guided by transcriptome coordinates in the genome
annotation database (Ensembl GRCh37.72). The HIT index pipeline was run on resulting bam files,
with default parameters, to classify exons into five categories. Expressed exons required SJR > 0
and classified as follows:

FE: HITindex == -1
Hybrid Internal-FE: -0.3 > HITindex > -0.95 & Probability of being hybrid > 0.5
Internal: -0.3 < HITindex < 0.3
Hybrid Internal-FE: 0.3 < HITindex < 0.95 & Probability of being hybrid > 0.5
LE: HITindex == 1

All gene ontology analyses were performed using the Gene Ontology (GO) knowledgebase
developed by the GO Consortium, using relevant expressed genes as a background set.

CAGE, 3p-seq, and polyA site data processing and analysis
To evaluate performance of the HIT index, start and end coordinates of all classified exons in LCL
cells were interrogated for overlap on the same strand with TSS sites from CAGE and polyA sites
from 3’-seq within 50, 100, 150, 200, and 250 bp. Specificity was calculated as the fraction of exons
overlapping a bonafide TSS or PolyA site within the indicated window size. TSS sites were
identified as the nucleotide within a peak with the maximum score in CAGE data from the
FANTOM project (26) while polyA sites were also identified with nucleotide resolution in 3’-seq
data downloaded from the polyAsite database (27).

Motif, splice site, context and ORF analyses
DNA sequences flanking classified exon were extracted from the genome annotation database
(Ensembl GRCh37.72) using GetFasta function from BEDTools (48) with default parameters and
Page 13 of 34
bioRxiv preprint doi: https://doi.org/10.1101/2021.05.27.446076; this version posted May 29, 2021. The copyright holder for this preprint (which
 was not certified by peer review) is the author/funder, who has granted bioRxiv a license to display the preprint in perpetuity. It is made
 available under aCC-BY-NC-ND 4.0 International license.

strand-specificity. Motif analyzes were done with MEME suite packages (49) and customized R
scripts. The 5’- and 3’- splice site of each exon was mapped to hg38 reference genome using
BEDTools (v.2.28.0) and splice site scores were calculated with MaxEntScan (50). Among all
splice sites for overlapping exons including in each meta-exon, the exons with the highest splice
site score were selected. ORF and uORF analyses were performed in R (v.4.0.5) using the
‘matchPattern’ function from R package Biostrings and customized scripts. All occurrences of start
and stop codons were annotated for each exon. All graphical plots were generated using the R
package ggplot2.

Long-read RNA sequencing analysis
A raw fastq file with base-called Oxford Nanopore direct-RNA sequencing data from the GM12878
lymphoblastoid cell line (51) was downloaded and mapped to the GRCh38 reference assembly
using minimap2 (52). 98% of the 13.3M total reads mapped with high confidence primary
alignments. Mapped reads were assigned to genes using the GRCh38 gtf annotations and for
downstream analyses, only reads mapping to protein coding transcripts were considered. To
account for technical biases in the long read sequencing data that lead to truncated or chimeric
reads, we undertook a number of filtering steps to obtain a high-confidence set of reads. First, we
calculated z-scores for reads across the distribution of reads per gene to estimate how many standard
deviations a mapped length is away from the mean mapped length of the gene. We discarded reads
with mapped lengths 3 z-scores away from the mean. Second, we compared the mapped length of
a read against annotated coordinates using GRCh38 annotations. Reads with mapped lengths less
than or greater than 1.5kb from the smallest or largest annotated transcripts for the corresponding
gene, respectively, were discarded. Finally, we only considered genes with more than 10 reads.
After applying these filters, we obtained 7.7M reads across 10.4k genes, with a mean read length
of 1.1kb. To identify first, internal and last exons, each read was split into discrete exons using the
CIGAR string. For each read, the most upstream and downstream exons were classified as first or
last exons, respectively, and all other exons were considered as internal exons.

Acknowledgments
We thank all members of the Burge lab, Fiszbein lab and Pai lab for useful discussions and
comments.

Funding:
National Institutes of Health grant R35GM133762 (AAP)
National Institutes of Health grant X (CBB)
Pew Latin American postdoctoral fellowship (AF)
faculty funds from Boston University (AF)

Author contributions:
Conceptualization: AF, AAP
Methodology: AF, MM, CBB, AAP
Investigation: AF, MM, ECR, GK, AAP
Visualization: AF, MM, ECR, GK, CBB, AAP
Supervision: AF, CBB, AAP
Writing—original draft: AF, AAP
Writing—review & editing: MM, ECR, GK, CBB

Competing interests: All authors declare they have no competing interests.

Page 14 of 34
You can also read