THE VOICE OF MONETARY POLICY - University of California ...
←
→
Page content transcription
If your browser does not render page correctly, please read the page content below
THE VOICE OF MONETARY POLICY
 Yuriy Gorodnichenko Tho Pham Oleksandr Talavera
 University of California, University of Reading University of Birmingham
 Berkeley, and NBER

 First draft: October 31, 2020
 This draft: July 21, 2021

 Abstract: We develop a deep learning model to detect emotions embedded in press
 conferences after the meetings of the Federal Open Market Committee and examine
 the influence of the detected emotions on financial markets. We find that, after
 controlling for the Fed’s actions and the sentiment in policy texts, positive tone in
 the voices of Fed Chairs leads to significant increases in share prices. Other
 financial variables also respond to vocal cues from the Chairs. Hence, how policy
 messages are communicated can move the financial market. Our results provide
 implications for improving the effectiveness of central bank communications.
Keywords: monetary policy, communication, voice, emotion, text sentiment, stock market, bond
market.

JEL: E31, E58, G12, D84

Acknowledgements: We thank Annette Vissing-Jorgensen, Michael Ehrmann, William English,
and seminar/conference participants at University of Reading, University of Birmingham,
University of East Anglia, UC Davis, FED Cleveland, Economic Policy Working Group – Hoover
Institution, NBER 2021, and ESCoe Economic Measurement 2021 conference for comments. We
are grateful to Eric Swanson for sharing his series of monetary policy shocks.
“How can a president not be an actor?” Ronald Reagan (1980)

“As Chairman, I hope to foster a public conversation about what the Fed is doing to support a
strong and resilient economy. And one practical step in doing so is to have a press conference like
this after every one of our scheduled FOMC meetings. … [This] is only about improving
communications.” Jerome Powell (2018)1

1 Introduction

In a famous analysis, Mehrabian (1971) posited a 7-55-38 rule of communication: the words convey
7 percent of a message, the body language (gestures, facial expressions, etc.) accounts for 55 percent,
and the tone delivers 38 percent. While the debate on exact percentages for each channel is open, it
is clear that effective communication has to rely on more than just words. Central banks have been
increasingly relying on communication-based tools (e.g., forward guidance) to manage the public’s
expectations, but do central bankers utilize communication to its full potential?

 Textual analyses of policy statements, minutes, and transcripts (e.g., Rozkrut et al., 2007;
Hansen and McMahon, 2016, Hansen et al., 2018, Cieslak et al., 2019, Ehrmann and Talmi, 2020)
suggest that central bankers’ words carry a lot of weight,2 but little is known about the effects of
their non-verbal communication. To shed more light on this issue, we use deep learning methods
to quantify tone (vocal emotions) embedded in the answers given by Federal Reserve Chairs during
press conferences. To the best of our knowledge, our study is the first to examine the effects of
central bank communications through the vocal dimension. In other words, we move beyond text
analysis and study how policy messages are voiced and whether emotions in voice tone can move
financial markets.

 We focus on policy communication during press conferences for several reasons. First,
press conferences have been commonly used as an important communication tool. As suggested
by Ehrmann and Fratzche (2007) and emphasized by Powell (2018), press conferences,
particularly the Q&A sessions, play a key role in helping financial markets and the general public

1
 https://www.federalreserve.gov/mediacenter/files/FOMCpresconf20180613.pdf (Accessed on 21 July 2021).
2
 More generally, central banks have significant power to influence the macroeconomy and expectations. For example,
a large number of studies have documented the effectiveness of policy announcements in moving financial markets
(e.g., Kuttner, 2001, Gurkaynak et al., 2005) or shaping firm and household inflation expectations (e.g., Coibion et
al., 2019; Enders et al., 2019; Lamla and Vinogradov, 2019).

 1
to understand policy outlook and the interpretation of current economic conditions. Especially
during times of high uncertainty, market participants tend to seek further guidance/clarification
through press conferences’ Q&A sessions. Second, press conferences allow policymakers to go
off script and communicate soft information via non-verbal channels, thus potentially influencing
investors’ decision making.3 Finally, because video/audio recordings of press conferences are
available in a consistent format, we can measure the tone of communication in a consistent manner
and provide a systematic analysis of how voice tone can influence economic outcomes.

 Specifically, we split a given FOMC press conference during the 2011 – June 2019 period
into audio segments corresponding to each question raised during the event and the response of
the speaker. The split audios are then run through a machine learning model, which is trained to
recognize emotions from voice variations. Each answer is rated in terms of three emotions: positive
(happy or pleasantly surprised emotions), negative (sad or angry emotions), and neutral. After
aggregating the tone of the answers for a given press conference, we examine how the tone affects
a variety of financial variables at high frequencies. We find that the tone can materially move
financial markets. For example, making the voice tone more positive by one standard deviation
could raise S&P 500 returns by approximately 75 basis points. This order of magnitude is
comparable to what one can observe after a one-standard-deviation shock to forward guidance. In
other words, the voice component can generate economically large effects on the stock market.
We also find that inflation expectations and exchange rates respond to the variation in voice tone,
e.g., a more positive tone leads to a decrease in expected inflation. At the same time, the evidence
for the bond market is more mixed in our sample. These results suggest that policy communication
is more nuanced than reading and/or posting prepared remarks and speeches. It appears that a
certain level of acting skill may be helpful to ensure that the public receives the policy message
fully and correctly.

 In addition to the vast literature on policy communication (see Blinder et al., 2008 and
Coenen et al., 2017 for comprehensive surveys) and high-frequency analyses of monetary policy
shocks (e.g., Kuttner, 2001, Gurkaynak et al., 2005, and many others), our study relates to research
investigating the economic impacts of vocal cues. Using a sample of CEOs’ speeches during

3
 Caffi and Janney (1994), Visschedijk et al. (2013), Dricu et al. (2017), and others document that voice conveys
information beyond the verbal content and that information contained in voice can affect decision making.

 2
earnings conference calls, Hobson et al. (2012) find that the vocal markers of cognitive dissonance
can predict the likelihood of irregular restatements of earning reports. In a related study, Mayew and
Venkatachalam (2012) show that market participants and analysts react to the affective states of
managers expressed through vocal cues, such as happy or unhappy voices. For example, positive
affect is positively related to changes in stock recommendations and future unexpected earnings.
These results suggest that the affective states contain useful information about firms’ fundamentals.
In a more recent study, Hu and Ma (2020) find that positivity about a startup, shown through the
visual, verbal, and vocal dimensions, increases the likelihood of being funded even if the startup’s
quality is low. Apart from having a different focus (central banking communication vs.
CEO/manager communication), we differ in the tools employed to quantify the variation in tone.
Earlier studies use commercial software or pre-trained machine learning algorithms for voice
analysis, while we develop a customized deep learning model for detecting speech emotion. Our
approach offers several advantages in terms of flexibility, room for further development, and
implementations. For example, we can fine-tune the model’s parameters to achieve a higher accuracy
rate, which is not a feature available to commercial software. Similarly, the customized model allows
us to adjust the number and/or the class of emotions, which also cannot be done with commercial
software and pre-trained algorithms.

 Curti and Kazinnik (2021), a concurrent paper closest in spirit to our work, examines the
responses of the financial market to variations in the Chair’s facial expressions during post-FOMC
press conferences. Using intra-day data, they find that negative facial expressions lead to lower
stock-market returns. We view their results as reinforcing our message that non-verbal
communication can move the financial markets, and hence, non-verbal component is a potentially
important channel of communication with economic players.

2 Non-verbal communication and monetary policy

Why would non-verbal communication matter? One explanation is that due to asymmetric
information between the public and the central bank, market participants tend to look for more
information through the aspects which are not explicitly “scripted”, such as the choice of words,
the tone of voice or body language of the Fed Chair. Like words, the non-verbal elements of
communication can signal the Fed’s perspective on current/future economic outlook and/or the

 3
future course of monetary policy. Fed Chairs understand that press conferences are high-stake
interactions with the public and the media, and that communication is a complex process. For
example, in her closing remarks for the FOMC meeting on 16 December 2015, Janet Yellen said:

 “Okay. Boxed lunches will be available. If anybody wants to watch TV in the
 Special Library and see me get skewered at the press conference, please feel free.
 I will do my best to communicate the points that have been made here. END OF
 MEETING”

Not surprisingly, the Fed invests significant resources into preparation for press conferences as
well as post-conference analysis.

 We also know that investors and the media watch/listen to FOMC press conferences,
analyze the Chair’s voice, and attempt to interpret what it (i.e., the voice tone/emotion) implies.
For example, in the International Quest Means Business program aired on 22 June 2011, Felicia
Taylor, a business reporter for CNN, said while covering an FOMC press-conference:

 “The press conference, though, that is coming up in just a few minutes is where
 traders are really going to be looking for every little nuance. They want to see how
 [Ben Bernanke] is going to read into everything. The tone of his voice, his body
 language, his inflection, for any clue about the direction the markets are still
 looking for.”

This quote suggests that the press and financial market investors appear to pay attention to non-
verbal communication.4 Indeed, it is not uncommon to have media reports assessing non-verbal
elements of press conferences. For example, the Wall Street Journal5 reported Ben Bernanke’s
voice as either shaky or quavering during the first FOMC press conference on 27 April 2011. The
tone of Jerome Powell’s voice at the press conference on 16 September 2020 was perceived to be
consistent with previous press conferences, which was interpreted as a signal of downplaying his
dovish position.6

 These anecdotes suggest that non-verbal communication could be an important channel.
To study this channel systematically—in an objective, reproducible fashion—we build on recent
advances in voice recognition technology and classify the voice tone of Fed Chairs into a spectrum

4
 See, e.g., https://cutt.ly/FzbnCBo; https://cutt.ly/fzbn1le (Accessed on 21 July 2021)
5
 https://www.wsj.com/articles/BL-REB-13815 (Accessed on 21 July 2021)
6
 https://cutt.ly/RzbnAm5 (Accessed on 21 July 2021)

 4
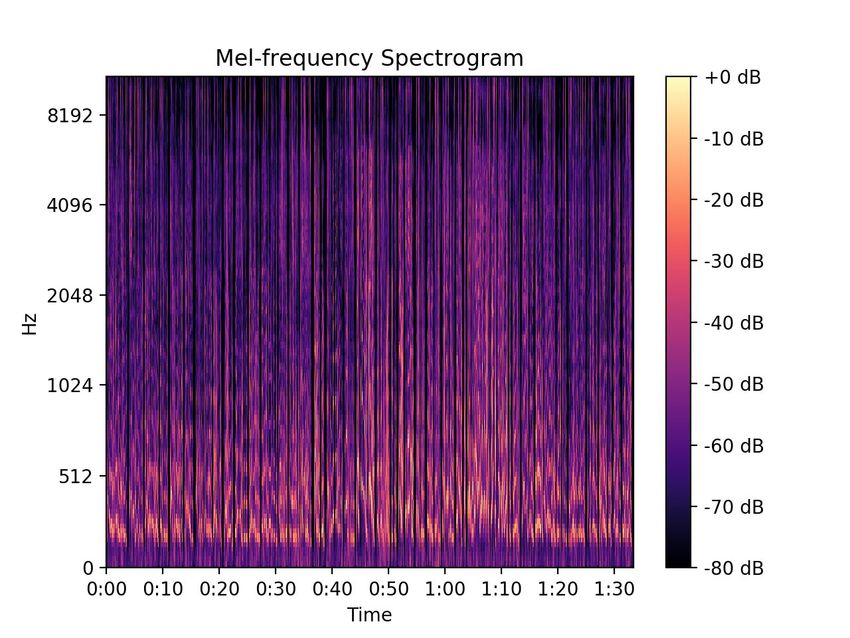
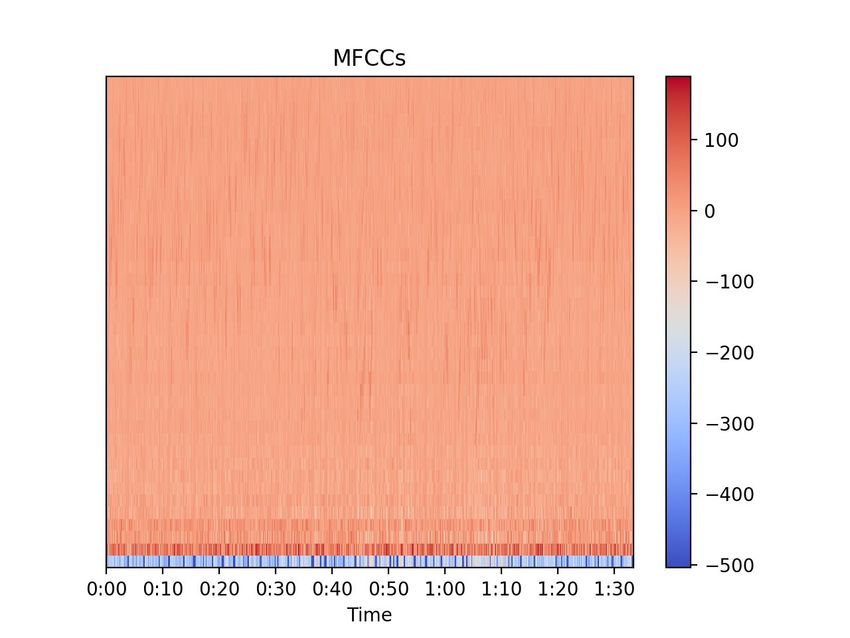
of emotions, and then we study how variations in voice tone (emotions) can affect financial
variables.

3 FOMC speeches: voice and linguistic analysis

Our sample runs from 2011 (when the first press conference was held) to June 2019. During this
period, 67 meetings and 36 press conferences were held. For each meeting, the FOMC statement and
the transcript of the press conference are collected from the Federal Reserve (Fed) website. The press
conferences’ videos are downloaded from the Fed’s official Youtube channel. We use only the audio
component of these videos.7 Because the Q&A session is the only part of the press conference that
is not scripted, our analysis focuses on the answers of the Chair during the Q&A. Our audio sample
contains 692 answers of 3 speakers (Ben Bernanke, Janet Yellen, and Jerome Powell).

3.1 Voice Tone

In this section, we briefly describe how we train a neural network model (a deep learning
algorithm) to recognize emotions and refer the reader to Appendix B for more details.
Conceptually, we need to create a mapping from various measures of sound waves into emotions.
We also present descriptive statistics for variations in voice tone during post-FOMC press
conferences.

3.1.1 Emotion Detection Using Neural Networks

Voice can be characterized by various parameters such as pitch (indicating the level of
highness/lowness of a tone) and frequency (indicating the variation in the pitch) which are useful
in determining the mood/emotion of a speaker. Building on earlier research on voice recognition
(e.g., Pan et al., 2012; Gao et al., 2017; Likitha et al., 2017; Bhavan et al., 2019), we use Librosa,
a Python package, to extract the following vocal features. First, we extract 128 Mel Spectrogram
Frequencies (Mel), which allows us to determine the level of loudness of a particular frequency at

7
 Video recordings can be used to study body language (e.g., facial expressions, gestures). However, videos are harder
to analyze because cameras are moving (different speakers, different angles). In this respect, audio tracks offer a more
consistent measurement.

 5

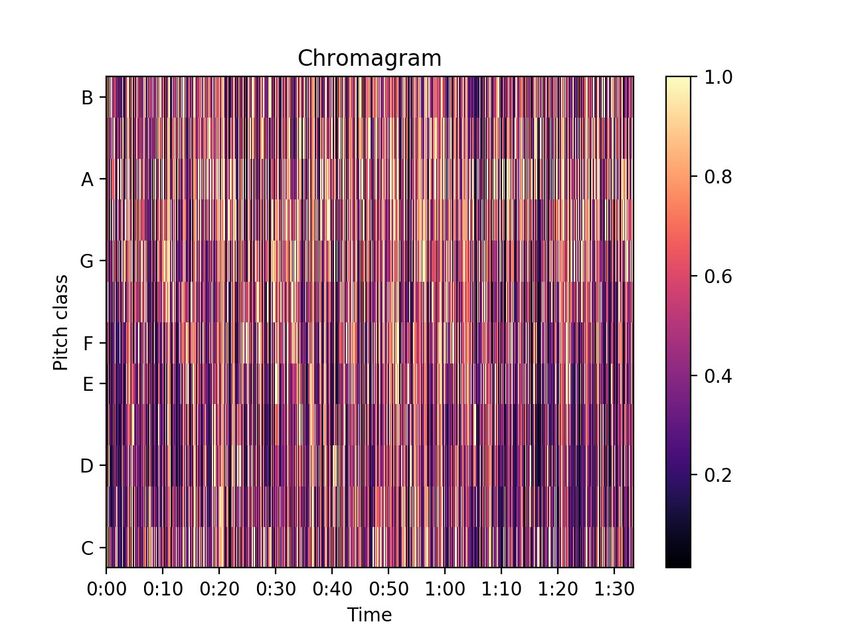
a particular time. Second, a chromagram with 12 Chroma coefficients is extracted. The
chromogram reflects the distribution of energy along 12 chroma bands (i.e., C, C#, D, D#, E, F,
F#, G, G#, A, A#, and B) over time, and hence, can capture melodic and harmonic characteristics
of an audio. Finally, we extract 40 Mel-frequency cepstral coefficients (MFCCs), which are
discrete cosine transformations of the Mel frequency spectrogram. Although MFCCs can be
derived from Mel Spectrogram Frequencies, we find that using both types of features helps
improve the accuracy of the model. Note that the number of Mel spectrogram coefficients, MFCCs,
and Chroma coefficients can be adjusted to achieve better prediction.

 Once the inputs from an audio track are constructed, we need measures of emotions
corresponding to the audio track so that we can build a model to classify sounds into emotions.
We use two data sets where emotions can be matched to audio tracks. The first is the Ryson Audio-
Visual Database of Emotional Speech and Song (RAVDESS). To create these data, 12 actors and
12 actresses speak two statements in a neutral North American accent and 8 emotions (calm,
happy, sad, angry, fearful, surprised, disgust, neutral). The second data set is the Toronto
Emotional Speech Set (TESS). To create these data, 2 actresses speak a set of 200 words in 7
emotions (happy, sad, angry, fearful, pleasantly surprised, disgust, neutral). These data sets are
widely used in the computer science literature to build the speech emotion/expression systems
(see, e.g., Verma and Mukhopadhyay, 2016, Gao et al., 2017, Choudhury et al., 2018, Bhavan et
al., 2019, Andersson, 2020). Because fearful/disgust emotions are unlikely to arise during the
Q&A sessions, we only use audios for 5 emotions: happy, (pleasantly) surprised, neutral, sad, and
angry. We use 80% of RAVDESS and TESS as the training sample and the remaining 20% are
used for validation.

 After extracting the vocal features from each recording in RAVDESS and TESS, we use
Keras, a deep learning API run on top of Google’s machine learning platform TensorFlow, to build
a neural network model, i.e., a computing system consisting of different layers where each layer
is a collection of different neurons (nodes). We illustrate the mechanism behind a neural network
comprised of three fully connected layers in Figure 1. The first layer in this network is the input
layer with three nodes and each node is an audio feature. The second layer is a hidden layer
consisting of four nodes ( , k=[1;4]) which are the activation functions of the input features
 (i=[1;3]). Particularly, a node is connected with the input through weight ( , ) and bias

 6
( ): ∑3 =1 × , + . The weighted summations are passed on an activation function such
as a binary step function, linear activation function, or non-linear activation function, to obtain the
outputs (k=[1;2]). Applying the same procedure on these outputs gives us the final output (i.e.,
the classification of emotion).

 In this study, we build a fully connected network with two hidden layers of which the
architect is specified as follows. The input layer has 180 nodes which are 180 vocal features (128
Mel coefficients, 40 MFCCs, and 12 Chroma coefficients). The first hidden layer has 200 nodes
which are connected with 180 nodes in the input layer through the linear activation function. The
second hidden layer has 200 nodes which are connected with 200 nodes in the first hidden layer
through the linear activation function. The output layer has 5 nodes representing 5 emotions
(happy, pleasantly surprised, neutral, sad, and angry). Given that our task is a multi-group
classification task, we use the softmax activation function (i.e., normalized exponential function),
which is a logistic function, to connect the nodes in this layer with 200 nodes in the second hidden
layer. To minimize overfitting, we add three dropout layers with a dropout rate of 0.3 after the
input layer and each of the hidden layers. This means that 30% of inputs are randomly set to 0 at
each step during training time (hence, only 70% of inputs are retained for training). After training
the model, we use the accuracy score to evaluate the model’s performance

 1
 ( , �) = � 1( � = ),

 =1

where and � are the true emotion and the predicted emotion, respectively, n is the number of
audio files in the testing dataset. The trained model gives us an overall accuracy score of 84%.
Applying the same formula for each emotion, we get the accuracy in predicting angry, sad, neutral,
surprised, and happy emotion of 87%, 84%, 74%, 87%, and 80%, respectively.

 A key advantage of our approach to classifying voice tone into emotions is its objectivity
and reproducibility. Indeed, any interested researcher can apply this tool—or its variations—to
trace every step of the approach and measure sensitivity to various assumptions and data points.
In contrast, using humans to classify Fed Chairs’ voice into emotions is not only much more costly
but also likely involves judgement, biases, conflicting interpretations, and perhaps too much
“reading between the lines”. However, humans may be better at picking up subtle tone variations.

 7
3.1.2 Emotion Detection Output

After training the neural network to recognize emotions from variations in vocal features (MFCCs,
Chromagram, and Mel Spectrogram), we feed the audio tracks of the policymakers’ answers into
the neural network and classify the answer into positive (“happy” or “pleasantly surprised”),
negative (“sad” or “angry”), or neutral. We measure the tone of responses for a given Q&A session
as follows:

 −
 =
 + (1)

where ranges from -1 (negative emotions) to +1 (positive emotions). We report
descriptive statistics in Panel A of Table 1 and scores for each Q&A session in Appendix Table 1.

 We find that Ben Bernanke on average had more positive emotions in his voice than Janet
Yellen, who in turn had generally more positive emotions in her voice than Jerome Powell. Bernanke
had five Q&A sessions with only positive emotions in his voice. In contrast, Jerome Powell had five
Q&A sessions with only negative emotions. Janet Yellen’s sessions always had a mix of positive and
negative emotions. The average tone across these central bankers is close to zero. There is
considerable within-speaker variation in tone, with Jerome Powell exhibiting the largest variation.
The serial correlation in the voice tone across meetings is close to zero ( =0.08).

3.2 Textual Analysis

Similar to Apel and Grimaldi (2014) and Neuhierl and Weber (2019), we use a “search and count”
approach to classify the text sentiment into hawkish versus dovish sentiment. In particular, we
build four lists of nouns, adjectives, and verbs of which combinations will indicate either tight
monetary policy/strong economic outlook (i.e., hawkish) or expansionary monetary policy/weak
economic outlook (i.e., dovish). As indicated in Table 2, a phrase combined of (1) A1 and A2 or
(2) B1 and B2 is classified as “dovish” while a phrase combined of (1) A1 and B2 or (2) B1 and
A2 is classified as “hawkish”. To increase the accuracy of our classification, the search and count
approach is performed on each part of a sentence then aggregated over the whole document.8 Since

8
 For example, the sentence “With inflation running persistently below this longer-run goal, the Committee will aim
to achieve inflation moderately above 2 percent for some time so that inflation averages 2 percent over time and

 8
negations such as “won’t”’ or “aren’t” can alter the meaning of the text, for each part of a text, a
hawkish (dovish) phrase is only counted as hawkish (dovish) if the text does not contain a negation
word/phrase. In contrast, if a hawkish phrase is accompanied by a negation word/phrase, then it is
counted as dovish and vice versa.9 The number of dovish and hawkish phrases detected in FOMC
press releases and press conferences’ transcripts are reported in Panel B of Table 1. The dovish
phrases are generally used more often in FOMC communications during the examined period.

 We use the following formula to measure the aggregate sentiment of the text of an FOMC
statement/remarks/Q&A:

 ℎ ℎ − ℎ ℎ
 = (2)
 ℎ ℎ + ℎ ℎ

where ℎ ℎ and ℎ ℎ are the counts of respective phrases in the FOMC
statements as well as transcripts when a press conference is held. is in the range
of [-1;1]. A positive value of indicates an expansionary monetary policy or that
expansionary monetary policy is expected.

 We find (Panel B of Table 1) that the sentiment of texts during the terms of Bernanke and
Yellen was generally more dovish than Powell’s.10 This pattern likely reflects that policy rate
increases dominated during Powell’s period in our sample. The within-speaker variation in the text
sentiment is broadly similar across the Fed Chairs. The variation in text sentiment during Q&A
sessions is larger than the variation in the text sentiment for statements and remarks, which would
be consistent with the less scripted nature of Q&A sessions relative to other communication types.
The correlation of sentiment for statement and remarks is discernibly positive ( = 0.4), while the
text sentiment of responses during Q&A sessions is approximately uncorrelated with the text
sentiment of statements ( = 0.06). At the same time, the text sentiments for Q&A and remarks
are correlated at = 0.32. To measure the totality of the sentiment, we compute
using all three sources (statement, remarks, and Q&A responses). Given that we have a limited

longer-term inflation expectations remain well anchored at 2 percent” contains 2 parts, “With inflation running
persistently below this longer-run goal” and “the Committee will aim to…2 percent”. The search and count approach
is performed on each part separately, then aggregated over the whole sentence, and then aggregated over the whole
document.
9
 A similar approach was applied in Cieslak and Vissing-Jorgensen (2020), where a negative word accompanied by
“not” is considered positive.
10
 Text sentiment scores for each meeting are listed in Appendix Table 2.

 9
number of events in our sample, this approach allows us to save degrees of freedom but our results
are robust to using measured for each source separately or in other combinations.

3.3 Co-movement in Policy Actions and Word

How much do text sentiment and voice tone co-move? Although one might think that text and voice
should be highly congruent, Figure 2 demonstrates that the relationship between these two channels
of communication is more nuanced. Specifically, the positive messages conveyed in the tonality of
voice are associated with more dovish statements in the accompanying texts. Hence, we observe
congruence in words and in tone, but this relationship is not perfect. For example, the correlation
between the text sentiment in statements and the voice tone in the corresponding Q&A sessions is
 = 0.35 (Spearman correlation is equal to 0.33). The correlation for Q&A tone with the text
sentiment in remarks or Q&A is even lower: 0.16 and 0.24, respectively. In fact, Figure 2 shows that
it is not uncommon to observe dovish texts and negative tonality. These results suggest that the tone
of Q&A responses may generate variation in policy communication that is unrelated to what is
contained in the texts of policymakers’ statements, remarks, or even Q&A responses themselves.

 In a similar spirit, the variation in tone appears to be only weakly correlated with actual
policy shocks (panels A-C in Figure 3) identified as in Swanson (2020): a shock to the policy rate
(FFR shock), a forward guidance (FG) shock, or an asset purchase (AP) shock. There is a stronger
correlation between voice tone and the stage of the policy cycle. Specifically, the correlation
between the shadow rate (measured as in Wu and Xia, 2016)11 and voice tone is -0.29 (for
comparison, the correlation with FFR shocks is -0.17), i.e., voice tone becomes more negative as
the policy rate increases. We conclude that voice tone has variations unrelated to the Fed’s actions
and verbal (text) communication.

4 Empirical analysis

In this section, we investigate whether voice tone can move various financial indicators. In
particular, we estimate the following specification in the spirit of Jordà (2005):

11
 The updated series of the shadow rate are available at https://sites.google.com/view/jingcynthiawu/shadow-rates.

 10
(ℎ) (ℎ) (ℎ)
, +ℎ = 0 + 1 + 2 (3)
(ℎ) (ℎ) (ℎ)
+ 3 ℎ + 4 ℎ + 5 ℎ
(ℎ) (ℎ) (ℎ)
+ 6 ℎ + 7 { } +
where dates FOMC meetings. measures voice tone of the Q&A session at date .
indicates the sentiment in the policy statement, remarks, and Q&A responses.
ℎ , ℎ , and ℎ are policy shocks identified using intraday data with a
three-factor model by Swanson (2020). These policy shocks are normalized to have unit variance
over a “typical” period (e.g., the FFR shock is normalized to have unit variance for the period that
excludes zero lower bound). ℎ is the shadow policy rate from Wu and Xia (2016).
Policy shocks and the shadow rate control for “actions” of the Fed so that we can identify more
cleanly the effects of voice tone on outcome variables.12 Note that we code equal to zero
for FOMC meetings without Q&A sessions but our results are robust to focusing only on meetings
with press conferences. We include the indicator variable { } which equals
to one when an FOMC meeting did not have a press conference.
We estimate specification (3) for each horizon ℎ (ℎ = [0; 15]) separately and plot the
(ℎ)
estimated coefficients, e.g., � �1 � , to illustrate the dynamics of the response to a form of policy
ℎ=0
action or communication. Note that while high-frequency analyses tend to find clear responses to
policy announcements at the intraday frequencies (e.g., Kuttner, 2001, Swanson, 2020), we use
the daily frequency which, given dramatic volatility for some financial indicators, often yields
statistically insignificant estimates (see, e.g., Gorodnichenko and Weber, 2016). However, one
could expect that the response may build over time, consistent with the notion of “slow- moving”
capital proposed by Fleckenstein et al. (2014). Using daily series allows us to examine responses
at longer horizons, which may be important for identifying policy actions and communication tools
12
To check the robustness of our findings, we control for releases of macroeconomic data (unemployment rate, non-
farm payroll, and GDP growth) in a version of specification (3). While most of the FOMC announcements were not
overlapped with the releases of other macro data releases over the examined period, there are few exceptions. In
particular, five FOMC announcements were released on the same day as the release of gross domestic product (GDP)
data but none of these five were accompanied by a press conference. At the same time, seven FOMC announcements
(six of which were followed by a press conference) were made on the same day as consumer price index data releases.
We found that controlling for the releases of macroeconomic news does not have a materially important effect on the
reported estimates.
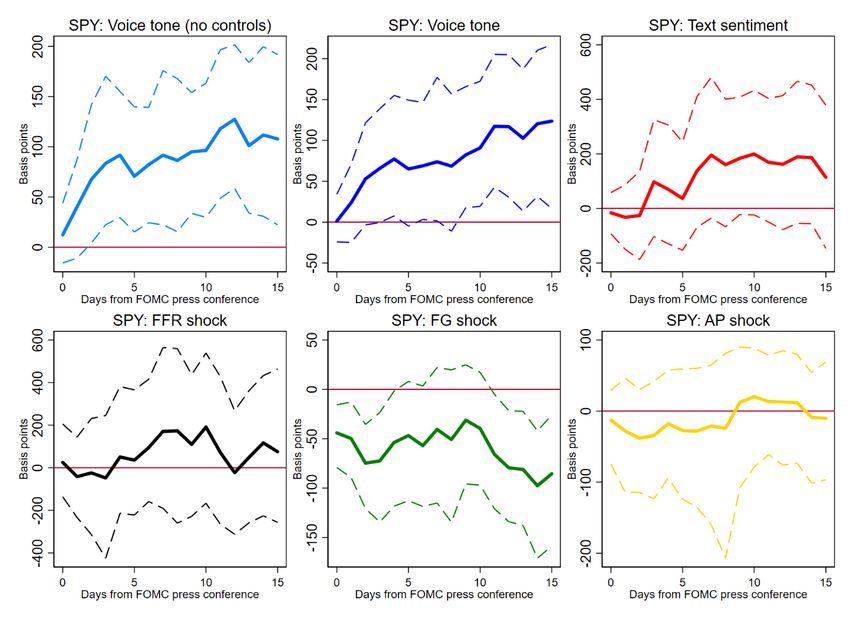
11(ℎ) (ℎ) with durable effects. We will use estimates responses to policy shocks (� �3 � , � �4 � , ℎ=0 ℎ=0 (ℎ) (ℎ) � �5 � ) and text sentiment (� �2 � ) to benchmark responses to voice tone variations. ℎ=0 ℎ=0 The outcome variables are daily financial indicators available from Thomson Reuters and other popular sources including Yahoo Finance and Tiingo. We generally use prices of exchange- traded funds (ETFs) that track popular indices. For example, we use the SPY, an ETF fund that tracks the S&P 500 index, to measure reactions of the stock market to policy shocks. We measure returns on ETF funds or similar securities as the log close price at date + ℎ minus log open price at date , e.g., , +ℎ = log� +ℎ � − log� �. Hence, the return on the day of an FOMC meeting is the log difference between close and open prices. Because the sample is relatively small (67 FOMC meetings), we estimate specification (3) using bootstrap methods to correct for possible biases in the estimates as well as to construct confidence intervals with good coverage. Specifically, 90 percent confidence intervals are based on the 5th and 95th percentiles of the estimates generated in bootstrap draws. As a robustness check, we also estimate specification (3) with as the only regressor. 4.1 Stock market reactions When we use the SPY ETF to measure the reactions of the stock market to policy actions and communications, we find (Panel B of Figure 4) that a more positive voice tone leads to an increase in share prices. Specifically, the impact response (i.e., ℎ = 0) of the stock market is weak and not significant statistically. Over time, the response builds up and after five days, the return on SPY reaches approximately 100 basis points for a unit increase in voice tone. The response levels off after the first few days and stays statistically significant at 10 percent. We observe this pattern irrespective of whether we include controls (Panel B) or not (Panel A) in specification (3). The sentiment of the policy texts does not appear to have a statistically discernible effect on the SPY in our sample, although the point estimates are positive, suggesting that more dovish sentiment leads to a boom in the stock market. This finding is qualitatively in line with the results documented in the literature. For example, employing the high-frequency event study approach, Rosa (2011b) shows that surprise hawkish FOMC statements lead to a reduction in equity returns. 12
However, using monthly data over the 1998 – 2014 period, Hansen and McMahon (2016) find a
statistically insignificant reaction of stock markets to FOMC statements talking more about strong
economic conditions.

 The FFR shock does not have a statistically significant effect on the stock market, which
likely reflects the fact that the sample period is dominated by the zero lower bound and changes in
the short-term policy rate probably provided a rather limited outlook for the stance of monetary
policy. Changes in the pace of asset purchases by the central bank (AP shock) also do not have a
clear effect on the stock market, a finding consistent with Swanson (2020). Note that our sample
does not include the first round of quantitative easing in 2009, which led to a strong reaction of
the stock market (see, e.g., Chodorow-Reich, 2004, Krishnamurthy and Vissing-Jorgensen, 2011).
For this sample period, however, a forward guidance shock leads to a persistent decrease in stock
prices, in line with the intra-day responses estimated by Swanson (2020). This response is
consistent with the signaling effect suggested by Campbell et al. (2012): an FG shock reveals that
the Fed could be pessimistic about the state of the economy. The magnitude of the stock market
response to a unit decrease in voice tone is approximately equal to the response we observe after
a one-standard-deviation forward-guidance shock. Thus, the variation in voice tone has
economically significant effects.

 To further understand the reaction of the stock market to policy actions and messages, we
examine the response of the CBOE Volatility Index VIX (Figure 5), a popular measure of the stock
market’s expectations about future volatility. We also study the responses of futures on the VIX to
have a more refined sense of how policy can influence outlook for volatility. Specifically, we use
VIXY (Figure 6; VIX Short-Term Futures) and VIXM (Appendix Figure 7; VIX Mid-Term Futures)
ETFs. We find that Fed actions (FFR/FG/AP shocks) tend to raise the volatility in the stock market.
Consistent with this result, Ehrmann et al. (2019) document the larger responsiveness of treasury
yields to macro news during weak forms of forward guidance which can be interpreted as evidence
of a larger uncertainty on rate paths. The sentiment in the texts does not lead to an apparent response
in the volatility indices. In contrast, a positive voice tone tends to decrease current and anticipated
volatility. This result is consistent with the notion that central banks can shape uncertainty about
future economic conditions (Hansen et al., 2019). The variation in voice tone has economically
significant effects: a unit decrease in the tone increases the volatility by an amount that is roughly
equal to the increase after a one-standard-deviation shock to forward guidance.

 13
Relatedly, monetary policy can convey information about the path of interest rates and thus
reduce the interest rate risk (Hattori et al., 2016). To quantify the importance of this channel, we

 +ℎ,
measure the interest rate risk with the following spread: , +ℎ = � �−
 ,

 +ℎ,
 � � , where is the price of LQD ETF (investment grade corporate bonds) and
 ,

 is the price of interest rate hedged corporate bond LQDH ETF. A decrease in this measure
indicates a decline in the perceived interest rate risk. Our results (Figure 7) suggest that a more
positive tone leads to a reduction in investors’ expectations about interest rate risk. Consistent with
this interpretation and in line with the existing studies, which document the impact of policy
actions on bond risk premia (e.g., Hattori et al., 2016), we find that a forward guidance shock
reduces uncertainty about the future path of interest rate. A unit decrease in voice tone and a one-
standard-deviation increase in the FG shock generate similar responses of the spread, again
pointing to the economic significance of the tone of voice. In contrast, an AP shock could signal
the lower amount of interest rate risk in investor portfolios in the future, and thus, increase the
perceived current interest rate risk, which is consistent with the analysis in Gorodnichenko and
Ray (2017). Intuitively, asset purchases are a form of discretionary policy and the deployment of
such a tool increases uncertainty about the future path of policy.

4.2 Bond market reactions

Kuttner (2001), Swanson (2020), and many others document a strong reaction of the bond market
to monetary policy shocks. Consistent with these earlier works, we find (Figure 8) that the price
of GOVT ETF (a fund covering U.S. government nominal debt) decreases in response to a forward
guidance shock (i.e., yields rise) and increases in response to an asset-purchase shock (i.e., yields
fall). FFR shocks do not lead to a statistically significant response in GOVT prices, which likely
reflects the prominence of the zero-lower bound (ZLB) in our sample. In contrast to the strong
responses of the stock market, responses of the bond market to voice tone are not statistically
significant (although we document above that voice tone can move spreads between nominal and
real bonds). Similarly, text sentiment does not move GOVT prices materially. These findings are
consistent with Cieslak and Pang (2020) or Ehrmann and Talmi (2020), who document that the

 14
bond market reaction to Fed communications is weak. Using ETFs for government debt with
different maturities, we also examine if there could be a differential response across the maturity
space. We find qualitatively similar responses for all maturities (Appendix Figure 1 through
Appendix Figure 6) although the magnitudes of the responses to FFR/FG/AP shocks tend to be
smaller for shorter maturities.

 An important dimension of monetary policy transmission is how policy can influence the
interest rates faced by the corporate sector. While the bond market is highly integrated, the pass-
through from U.S. government debt to corporate debt may be limited and nuanced. As a first stab
at this question, we use the LQD ETF (a fund covering investment grade corporate bonds) and find
(Figure 9) that policy actions (FFR/FG/AP shocks) tend to move yields in the same direction as
they move yields for U.S. government debt. Text sentiment does not have a statistically significant
effect on LQD prices. A positive voice tone appears to elevate LQD prices (i.e., yields fall) for a
few days after an FOMC meeting, but this effect is short-lived and statistically insignificant. The
results are broadly similar when we use the IVR ETF (real estate investment trust; Figure 10) to
gauge the responses of the real estate sector, although a more dovish text sentiment appears to raise
the IVR price after about a week.

4.3 Inflation Expectations

Management of inflation expectations is a key element of monetary policy (see Coibion et al.,
2020 for a survey). To evaluate the success of policymakers in this matter we use two popular
metrics. The first one is the spread between nominal and inflation-protected U.S. Government

 +ℎ, +ℎ,
bonds. Specifically, we use , +ℎ = � � − � � as a measure of
 , ,

the spread, where is the price of GOVT ETF (nominal bonds) and is the price of TIP
ETF (inflation-protected bonds). An increase in this spread can be interpreted as a decrease in
expected inflation. The second one used is the GLD ETF, a fund that tracks the gold spot price.
This ETF is used as a hedge against inflation: an increase in the price of GLD signals higher
expected inflation. Although neither of these measures is perfect (e.g., the spread varies not only
due to changes in inflation expectations but also with changes in liquidity conditions; gold prices

 15
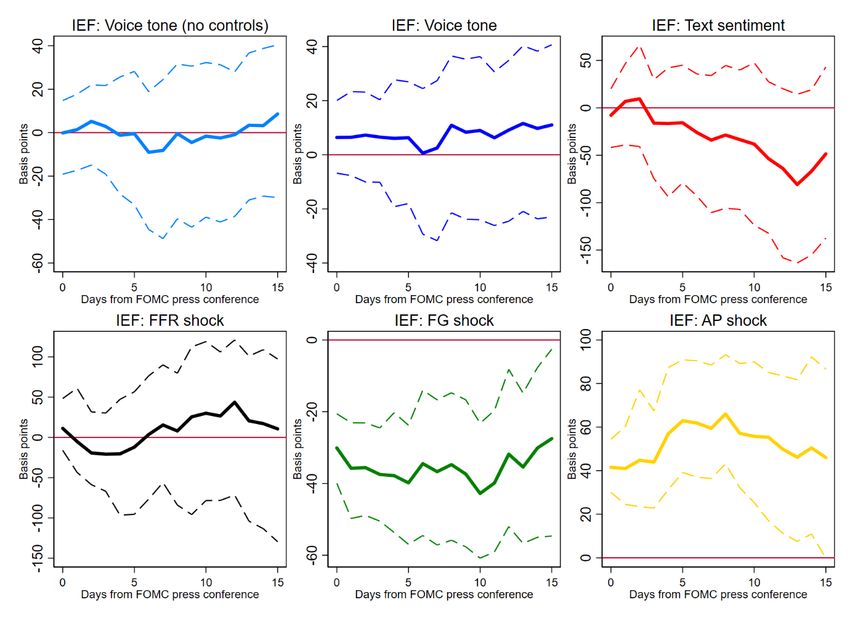
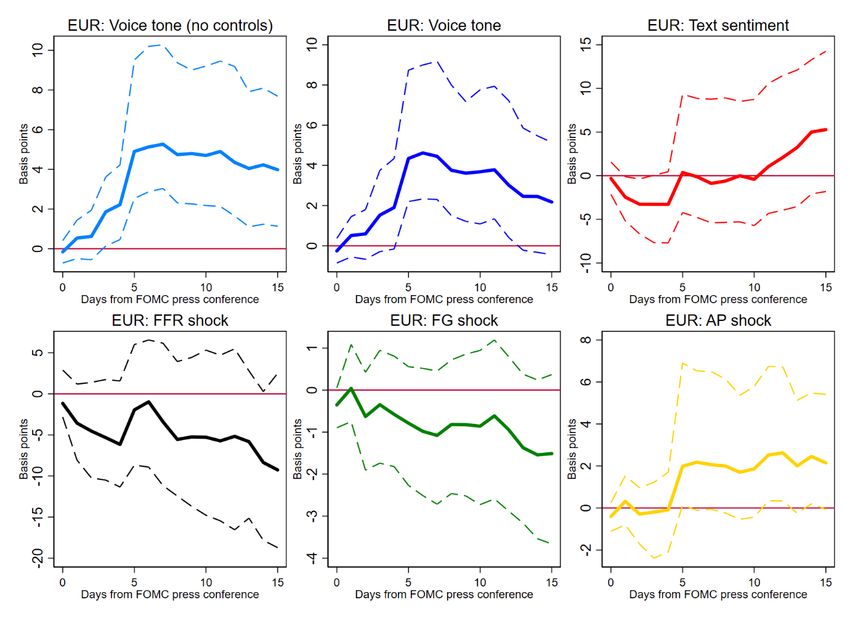
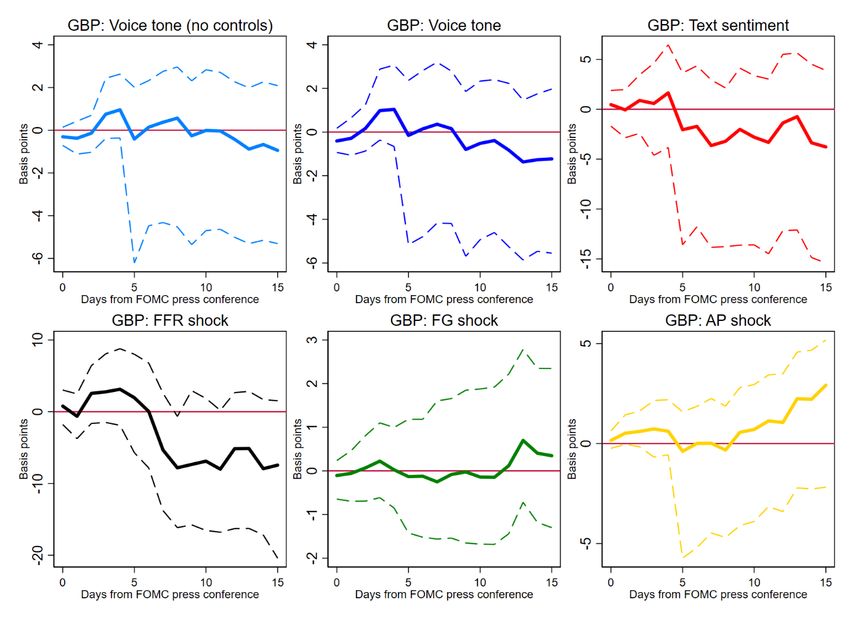
can move for reasons unrelated to inflation), these two measures are consistently available and are
based on reasonably deep markets.

 We find that the responses of the GOVT-TIP spread (Figure 11) and GLD (Figure 12) paint
a similar picture. As before, the FFR shock does not have a clear impact. The FG shock lowers
inflation expectations, while the AP shock raises inflation expectations. More dovish text
sentiment appears to raise inflation expectations (the GLD price increases), but this response is not
statistically significant. Moreover, it does not seem to have support from the GOVT-TIP spread,
which appears to decrease (i.e., expected inflation is lower), although again the estimates are not
statistically significant. The impact response of the GOVT-TIP spread to a positive tone of voice
is close to zero, but the spread gradually increases (thus, signaling lower expected inflation) and
peaks after about 10 days. The GLD price has similar dynamics (i.e., lower expected inflation) but
the estimates are less precise. Hence, voice tone seems to have an independent effect on inflation
expectations. One may conjecture that positive tone plays a signaling role: a happy tone of the Fed
Chair indicates satisfaction with future inflation dynamics.

4.4 Exchange Rate

The exchange rate is an important channel for monetary policy transmission in the increasingly
globalized economy. To shed more light on how policy actions and communication can work via
this channel, we examine the responses of two key exchange rates: yen/dollar (JPY; Figure 13)
and euro/dollar (EURO; Figure 14).13 We find that policy actions generally lead to mixed reactions
across currencies in our sample. For example, after an FFR shock (monetary tightening), the dollar
depreciates against the euro (although the effect is not statistically significant) and appreciates
against the yen.14 In a similar spirit, after a more dovish text sentiment (opposite to monetary
tightening), the dollar appreciates against the euro and depreciates against the yen. In contrast, a
more positive tone of voice leads to appreciation of the dollar against the euro, but there is no
statistically significant response for the yen/dollar exchange rate. While somewhat unexpected, the

13
 We also report results for the pound/dollar (GBP) exchange rate in Appendix Figure 8.
14
 Analyses using intraday data (e.g., Swanson, 2020) find that the dollar appreciates against the euro and yen after a
FFR shock.

 16
relatively lower level of reaction of the yen/dollar exchange rate to the monetary policy shocks has
also been observed in other studies (e.g., Fatum and Scholnick, 2008, Rosa, 2011a).

4.5 Discussion and additional analysis

In general, our findings shed new light on the effectiveness of press conferences as a central bank
communication tool. We show that just as the actions of the Fed move financial markets, so too
does the vocal aspect of FOMC press conferences. The vocal dimension of the central bank
communication appears to convey information beyond that in the text, and market participants
form their expectations and make their decisions based on that information. What information is
communicated exactly is open to further inquiry, but some tentative inferences are possible. For
example, the estimated responses appear to be consistent with the view that a more positive voice
tone of a Fed Chair leads to rate risk reduction which increases stock prices and depresses inflation
expectations.

 Differences in the shape of responses to various forms of policy communication and actions
is another area for further research. Specifically, in contrast to step-like contemporaneous responses
of financial variables to the Fed’s actions, the estimated responses to voice tone (and text sentiment)
tend to build gradually over time with weak contemporaneous reactions. We can offer several
conjectures to rationalize this pattern of the responses. First, the tone may be a leading indicator for
subsequent policy communication by the Fed Chair and other officials. As more information is
revealed progressively by the Fed via formal and informal channels, financial variables could take
time to respond.15 Second, the delayed response may capture the dynamics of trading where more
informed investors (e.g., those who are better at reading—perhaps subconsciously—non-verbal
communication at press conferences) move first and then the initial momentum is amplified by less
informed investors, a mechanism explored in other contexts (e.g., Bikhchandani et al., 1992; Zhou
and Lai, 2009). Third, media’s coverage may develop gradually while a consensus view about the
message at a press conference is being reached. While we do not have data to explore the first two
conjectures, we can provide some suggestive evidence for the third conjecture.

15
 We thank William English for suggesting this channel.

 17
Specifically, we collect FOMC-related news coverage from Nexis Uni, a popular news
database. We search for all news items which contain “FOMC” and one of the following keywords:
“interest rate”, “monetary”, “federal funds rate”, or “fed funds rate”. The search results are
restricted to English news generated by the U.S. media outlets. We further exclude government
sources which simply announce the events and/or the press conference transcripts, press releases,
etc. After screening and cleaning, the final dataset consists of 23,275 news articles covering the
01/01/2011 – 15/07/2019 period. The news dataset provides us with information on the publication
date of the news articles as well as their content.

 We then perform the following steps to determine the sentiment of each news item and the
aggregate news sentiment for a given day. First, following Tetlock (2007), we employ the General
Inquirer’s Harvard-IV lexicon and count the number of positive/negative words in each news
article. An article’s sentiment is calculated as:

 −
 =
 +

An article with the positive score is classified as a positive news article while an article which has
the negative score is classified as a negative news article. Second, we calculate the aggregate news
sentiment for a given day:

 0ℎ − 0ℎ
 0ℎ =
 0ℎ

where h=[0;15]. 0ℎ , 0ℎ , and 0ℎ are the total number of
news articles, total number of positive news, and total number of negative news published on the
FOMC day and h days after. A higher AggrSentiment score indicates a more positive news sentiment.

 We observe a positive correlation between the tone of voice and the sentiment of subsequent
news (Figure 15). The news sentiment is also positively related to the sentiment of the FOMC policy
text (i.e., press releases, opening remarks, and Q&A responses). However, the tone of voice – news
sentiment relationship seems to be stronger than the link between the FOMC text sentiment and news
sentiment. For example, on the press conference day, the correlation between the news sentiment
and the tone of voice is = 0.22 while the correlation between the news sentiment and the FOMC
text sentiment is close to 0. Similarly, four days after the press conference, the correlation between

 18
the voice tone and the news sentiment is 0.36 while the correlation between the FOMC text sentiment
and the news sentiment is only 0.03. This, coupled with the evidence of investors’ reactions to the
news sentiment documented in the literature (e.g., Tetlock et al., 2008; Chen et al., 2014), suggests
that FOMC-related news coverage and sentiment could be a channel through which the tone of voice
can move financial markets and continued media coverage can contribute to the delayed responses.

5 Concluding remarks

Press conferences are an important communication tool for delivering and explaining monetary
policy decisions to the public. Unlike press releases, transcripts, or minutes, a press conference
contains both verbal and non-verbal channels. The latter offers an opportunity to communicate
“soft” information. Machine learning applied to text analysis allowed researchers to better measure
messages in written policy documents and thus quantify the importance of soft information. Other
parts of communication (emotions, moods, tones, body language) could be equally (if not more)
important but these have proven to be particularly difficult to quantify. Building on recent
advances in voice recognition and deep learning, we attempt to shed new light on the effects of
non-verbal policy communication.

 Our analysis of variation in the Fed Chairs’ voice tone during Q&A sessions after FOMC
meetings shows that non-verbal communication can have a statistically and economically
discernible effect on a variety of financial indicators. For example, our results suggest that the
voice tone of policy communication may have a significant effect on the stock market above and
beyond what is contained in the Fed’s actions or actual words (texts). This reaction is consistent
with the Fed communicating a more positive outlook for the economy and reducing uncertainty.
Inflation expectations and exchange rates also respond to voice tone. In contrast, the bond market
appears to have more mixed reactions to vocal cues from the Fed Chairs.

 Although future work should dig deeper into understanding nuances of using voice to
communicate policy, our results clearly have important policy implications. How messages are said
appears to be potentially as important as what is in the messages. This does not make the job of
central bankers easier and possibly adds another qualification (voice control) to the job requirement.
However, this could be a prerequisite for anybody interested in using a public arena for policy
communication. Indeed, to paraphrase Ronald Reagan, how can a Fed Chair not be an actor?

 19
References

Andersson, K., 2020. “Speech Emotion Recognition in Neurological Disorders Using
 Convolutional Neural Network.” In Brain Informatics: 13th International Conference
 Proceedings 12241: 287. Italy: Springer, 12241, p. 287.

Apel, M. and Grimaldi, M., 2014. “How Informative Are Central Bank Minutes?” Review of
 Economics 65(1):53-76.

Bhavan, A., Chauhan, P., and Shah, R.R., 2019. “Bagged Support Vector Machines for Emotion
 Recognition from Speech.” Knowledge-Based Systems 184:104886.

Bikhchandani, S., Hirshleifer, D., and Welch, I., 1992. “A theory of fads, fashion, custom, and
 cultural change as informational cascades.” Journal of Political Economy 100(5):992-
 1026.

Blinder, A.S., Ehrmann, M., Fratzscher, M., De Haan, J., and Jansen, D.J., 2008. “Central Bank
 Communication and Monetary Policy: A Survey of Theory and Evidence.” Journal of
 Economic Literature 46(4): 910-45.

Caffi, C. and Janney, R.W., 1994. “Toward a Pragmatics of Emotive Communication.” Journal of
 Pragmatics 22(3-4): 325-373.

Campbell, J., Evans, C., Fisher, J., and Justiniano, A., 2012. “Macroeconomic Effects of Federal
 Reserve Forward Guidance.” Brookings Papers on Economic Activity: 1-80.

Chen, H., De, P., Hu, Y.J., and Hwang, B.H., 2014. “Wisdom of crowds: The value of stock
 opinions transmitted through social media.” Review of Financial Studies 27(5):1367-1403.

Chodorow-Reich, G., 2014. “Effects of Unconventional Monetary Policy on Financial
 Institutions.” Brookings Papers on Economic Activity:155-227.

Choudhury, A.R., Ghosh, A., Pandey, R., and Barman, S., 2018. “Emotion Recognition from
 Speech Signals using Excitation Source and Spectral Features.” In 2018 IEEE Applied
 Signal Processing Conference. IEEE, pp. 257-261.

Cieslak, A. and Pang, H., 2020. “Common Shocks in Stocks and Bonds.” National Bureau of
 Economic Research Working Paper No. w28184.

 20
Cieslak, A. and Vissing-Jorgensen, A., 2020. “The Economics of the Fed Put.” The Review of
 Financial Studies. In Press.

Cieslak, A., Morse, A. and Vissing‐Jorgensen, A., 2019. “Stock Returns over the FOMC Cycle.”
 The Journal of Finance 74(5): 2201-2248.

Coenen, G., Ehrmann, M., Gaballo, G., Hoffmann, P., Nakov, A., Nardelli, S., Persson, E., and
 Strasser, G., 2017. “Communication of Monetary Policy in Unconventional Times,”
 European Central Bank Working Paper Series 2080.

Coibion, O., Gorodnichenko, Y., and Weber, M., 2019. “Monetary Policy Communications and
 Their Effects on Household Inflation Expectations.” National Bureau of Economic
 Research Working Paper No. w25482.

Coibion, O., Gorodnichenko, Y., Kumar, S., and Pedemonte, M., 2020. “Inflation Expectations as
 a Policy Tool?” Journal of International Economics 124(C): 103297.

Curti, F., and Kazinnik, S., 2021. “Let's Face It: Quantifying the Impact of Nonverbal
 Communication in FOMC Press Conferences” (7 Apr 2021). Available at SSRN:
 https://ssrn.com/abstract=3782239.

Dricu, M., Ceravolo, L., Grandjean, D., and Frühholz, S., 2017. “Biased and Unbiased Perceptual
 Decision-making on Vocal Emotions.” Scientific Reports 7(1):1-16.

Ehrmann, M. and Fratzscher, M., 2007. “The Timing of Central Bank Communication.” European
 Journal of Political Economy 23(1):124-145.

Ehrmann, M. and Talmi, J., 2020. “Starting from a Blank Page? Semantic Similarity in Central
 Bank Communication and Market Volatility.” Journal of Monetary Economics 111: 48-
 62.

Ehrmann, M., Gaballo, G., Hoffmann, P., and Strasser, G., 2019. “Can more public information
 raise uncertainty? The international evidence on forward guidance” Journal of Monetary
 Economics 108(C): 93-112.

Enders, Z., Hünnekes, F., and Müller, G.J., 2019. “Monetary Policy Announcements and
 Expectations: Evidence from German Firms.” Journal of Monetary Economics 108: 45-63.

 21
Fatum, R. and Scholnick, B., 2008. “Monetary Policy News and Exchange Rate Responses: Do
 Only Surprises Matter?” Journal of Banking & Finance 32(6):1076-1086.

Fleckenstein, M., F. Longstaff, and H. Lustig, 2014. “The TIPS-Treasury Bond Puzzle.” The
 Journal of Finance 69(5): 2151-2197.

Gao, Y., Li, B., Wang, N. and Zhu, T., 2017. “Speech Emotion Recognition using Local and Global
 Features.” In International Conference on Brain Informatics. Springer, pp. 3-13.

Gorodnichenko, Y. and Ray, W., 2017. “The Effects of Quantitative Easing: Taking a Cue from
 Treasury Auctions.” NBER Working Papers 24122 (updated February 2021).

Gorodnichenko, Y. and Weber, M., 2016. “Are Sticky Prices Costly? Evidence from the Stock
 Market.” American Economic Review 106(1): 165-199.

Gürkaynak, G., Sack, B., and Swanson, E., 2005. “Do Actions Speak Louder Than Words? The
 Response of Asset Prices to Monetary Policy Actions and Statements.” International
 Journal of Central Banking 1(1): 55-93.

Hansen, S., and McMahon, M., 2016. “Shocking Language: Understanding the Macroeconomic
 Effects of Central Bank Communication.” Journal of International Economics 99: S114-
 S133.

Hansen, S., McMahon, M., and Prat, A., 2018. “Transparency and Deliberation Within the FOMC:
 A Computational Linguistics Approach.” Quarterly Journal of Economics 133(2): 801-
 870.

Hansen, S., McMahon, M., and Tong, M., 2019. “The Long-run Information Effect of Central
 Bank Communication,” Journal of Monetary Economics 108(C): 185-202.

Hattori, M., Schrimpf, A., and Sushko, V., 2016. “The Response of Tail Risk Perceptions to
 Unconventional Monetary Policy.” American Economic Journal: Macroeconomics 8(2):
 111-36.

Hobson, J.L., Mayew, W.J., and Venkatachalam, M., 2012. “Analyzing Speech to Detect Financial
 Misreporting.” Journal of Accounting Research 50(2): 349-392.

Hu, A. and Ma, S., 2020. “Human Interactions and Financial Investment: A Video-Based
 Approach.” Working Paper.

 22
Jordà, Ò., 2005. “Estimation and Inference of Impulse Responses by Local Projections.” American
 Economic Review 95(1):161-182.

Krishnamurthy, A. and Vissing-Jorgensen, A., 2011. “The Effects of Quantitative Easing on
 Interest Rates: Channels and Implications for Policy.” Brookings Papers on Economic
 Activity 42(2 (Fall)): 215-287.

Kuttner, K., 2001. “Monetary Policy Surprises and Interest Rates: Evidence from the Fed Funds
 Futures Market.” Journal of Monetary Economics 47(3): 523–544.

Lamla, M.J. and Vinogradov, D.V., 2019. “Central Bank Announcements: Big News for Little
 People?” Journal of Monetary Economics 108: 21-38.

Likitha, M.S., Gupta, S.R.R., Hasitha, K., and Raju, A.U., 2017. “Speech based Human Emotion
 Recognition using MFCC.” In 2017 International Conference on Wireless
 Communications, Signal Processing and Networking. IEEE, pp. 2257-2260.

Mayew, W.J. and Venkatachalam, M., 2012. “The power of voice: Managerial affective states and
 future firm performance.” The Journal of Finance 67(1): 1-43.

Mehrabian, A., 1971. Silent Messages: Implicit Communication of Emotions and Attitudes.
 Belmont, CA: Wadsworth.

Neuhierl, A. and Weber, M., 2019. “Monetary policy communication, policy slope, and the stock
 market.” Journal of Monetary Economics 108(C): 140-155.

Pan, Y., P. Shen, and L. Shen, 2012. “Speech emotion recognition using support vector machine.”
 International Journal of Smart Home 6(2):101-108.

Rosa, C., 2011a. “The high-frequency response of exchange rates to monetary policy actions and
 statements.” Journal of Banking & Finance 35(2): 478-489.

Rosa, C., 2011b. “Words that shake traders: The stock market’s reaction to central bank
 communication in real time.” Journal of Empirical Finance 18(5): 915-934.

Rozkrut, M., Rybiński, K., Sztaba, L., and Szwaja, R., 2007. “Quest for central bank
 communication: Does it pay to be “talkative”?” European Journal of Political Economy
 23(1): 176-206.

 23
You can also read