Heat Waves and Human Well-Being in Madrid (Spain) - MDPI
←
→
Page content transcription
If your browser does not render page correctly, please read the page content below
atmosphere
Article
Heat Waves and Human Well-Being in Madrid (Spain)
Domingo Rasilla 1, * , Fernando Allende 2 , Alberto Martilli 3       and Felipe Fernández 2
 1   Departamento de Geografía, Urbanismo y OT. Universidad de Cantabria, 39005 Santander, Spain
 2   Departamento de Geografía, Universidad Autónoma de Madrid, 28049 Madrid, Spain;
     fernando.allende@uam.es (F.A.); felipe.fernandez@uam.es (F.F.)
 3   División de Contaminación Atmosférica, Centro Investigaciones Energéticas,
     Medioambientales y Tecnológicas, 28040 Madrid, Spain; alberto.martilli@ciemat.es
 *   Correspondence: domingo.rasilla@unican.es; Tel.: 34-942-206755

 Received: 25 April 2019; Accepted: 14 May 2019; Published: 22 May 2019

 Abstract: Heat waves pose additional risks to urban spaces because of the additional heat provided
 by urban heat islands (UHIs) as well as poorer air quality. Our study focuses on the analysis of
 UHIs, human thermal comfort, and air quality for the city of Madrid, Spain during heat waves.
 Heat wave periods are defined using the long-term records from the urban station Madrid-Retiro.
 Two types of UHI were studied: the canopy layer UHI (CLUHI) was evaluated using air temperature
 time-series from five meteorological stations; the surface UHI (SUHI) was derived from land surface
 temperature (LST) images from MODIS (Moderate Resolution Imaging Spectroradiometer) products.
 To assess human thermal comfort, the Physiological Equivalent Temperature (PET) index was applied.
 Air quality was analyzed from the records of two air quality networks. More frequent and longer heat
 waves have been observed since 1980; the nocturnal CLUHI and both the diurnal and nocturnal SUHI
 experience an intensification, which have led to an increasing number of tropical nights. Conversely,
 thermal stress is extreme by day in the city due to the lack of cooling by winds. Finally, air quality
 during heat waves deteriorates because of the higher than normal amount of particles arriving from
 Northern Africa.

 Keywords: heat waves; urban heat island; heat stress; air quality; Madrid; Spain

1. Introduction
     The warming of global temperatures during the last 150 years has been accompanied by an
increase in the occurrence of heat waves [1,2], a trend that seems to be in close agreement with the
most probable scenarios provided by climate models for the rest of the 21st century [3,4]. Heat wave
impacts are diverse and widespread (crop failures, livestock losses, disruption of transportation,
spreading of wildfires, power outages), but are particularly harmful in urban areas, due to the high
population density and the urban heat island (UHI) effect, among other factors. UHI refers to a
human-induced modification of the regional climate whereby the cities become warmer than their
rural surroundings. Its magnitude is particularly intense at night, when an additional warming up to
7–10 ◦ C have been recorded [5–7], although it can be reversed by day when the city becomes cooler
than the surroundings [8]. Due to alterations in the natural landscape, urban environments absorb,
preserve, and/or generate more heat, and gradually release heat compared with rural areas that cool off
faster due to unobstructed outgoing radiation [9]. During heat waves, the prolongation of the diurnal
thermal stress into the nocturnal hours deprives the population of relief, producing serious impacts on
sensitive groups [10–13].
     The Mediterranean area is widely recognized as one of the most vulnerable hot spots to climate
change in the 21st century [14], particularly because of the predominance of the summer stable

Atmosphere 2019, 10, 288; doi:10.3390/atmos10050288                       www.mdpi.com/journal/atmosphere
Atmosphere 2019, 10, 288                                                                           2 of 21

atmospheric conditions, which are associated with heat waves and the build-up of pollutants, especially
in larger urban areas [15]. Given the growing need to adapt to the consequences of global warming in
a context of an aging population in the developed world, it is necessary to offer knowledge as detailed
as possible about the space-time dynamics of this phenomenon and possible interactions with other
urban phenomena, such as pollution, for its incorporation into studies about climate risks in urban
spaces [16,17].
      Studies of the spatial and temporal variability of temperature within urban spaces have relied
on different methods [18,19]. UHI is usually quantified as the air temperature difference between the
city and the corresponding air temperature of its surroundings (the canopy layer urban heat island,
CLUHI). Urban networks are usually too sparse to provide detailed information about the intra-urban
temperature variations, which can be resolved using remote sensing, which provides the surface urban
heat island (SUHI). Satellite monitoring of extreme heat events in urban areas [20–22] has improved the
knowledge about the spatial variability of this phenomenon. However, comparison between canopy
and surface UHIs should be cautious because of their diverse dynamics [23].
      The analysis of the impact of heat waves should include also the assessment of the human
sensation of heat, quantified throughout the use of proper bioclimatological indices [24,25] which
consider the whole heat balance of the human body, not only including the use of air temperature,
but also additional variables such as air humidity, wind speed, as well as short- and long-wave
radiation flux densities, in addition to human components like activity level or clothing type [26,27].
      Air pollution further exacerbates the adverse effects of heat waves. Slow-moving high-pressure
systems, the most common synoptic environment conducive to heat waves, are responsible for
dry conditions, strong sunlight, and low wind speeds, allowing poor-quality air to stagnate in a
given location for extended periods of time and accumulating pollutants [28–30]. These atmospheric
conditions increase the emission of biogenic volatile organic compounds, which boost the production
of surface ozone and other aerosols [31]. Drought-like conditions reduce soil moisture, making
near-surface temperatures hotter and inhibiting the role played by vegetation in absorbing pollutants,
resulting in worse air quality [32,33].
      The objective of this study was to identify some characteristics of the heat waves (frequency,
trends) that have been observed in Madrid since 1880 and to assess the urban heat island, thermal
comfort, and air quality during those events.

2. Data and Methodology
      The study area comprises the metropolitan area of Madrid, the capital of Spain. Madrid lies
on the southern area of the Spanish Plateau, between the Jarama and Manzanares river basins,
in the wider Tagus River catchment area. Orography is relatively rugged, since there are substantial
differences in altitude, ranging from 846 m a.s.l. in the north to 543 m a.s.l. in the southeast. Due to
its altitude and distance to the sea, the city experiences an extreme version of the Mediterranean
climate, characterized by scarce precipitation, mostly in autumn and spring, and large annual and
diurnal temperature changes. Summers are particularly warm (July average maximum temperature at
Madrid-Retiro 32.1 ◦ C) and dry (July 11 mm, August 9 mm), with most of the precipitation falling as
convective showers.
      Madrid is also the most populated urban area of Spain: 3.5 million people live in the municipality
as of 2018, spread over 604.3 km2 , but the population of the whole metropolitan area is approximately
6.5 million. The city experienced vigorous growth from the beginning of the century to 1970, increasing
from approximately 500,000 to 3 million people. After that, urbanization focused on the surrounding
locations (Figure 1). Vulnerable population groups (e.g., the elderly and youngsters) represent 33.3%
of the total, to which we must add people coming from other countries who can also be exposed to the
heat, since Madrid has become a popular tourist destination [34]. There are 4,699,917 vehicles officially
registered in the province of Madrid [35], 1,500,000 of which enter the core of the city every day [36].
Atmosphere 2019, 10, x FOR PEER REVIEW 3 of 22
4,699,9172019,
Atmosphere vehicles
10, 288officially
registered in the province of Madrid [35], 1,500,000 of which enter
3 ofthe
21
core of the city every day [36].
Figure 1. (a)
Figure 1. (a) Evolution
Evolution of
of the
the population
population in
in Madrid
Madrid and
and expansion
expansion of
of the
the urban
urban land
land uses
uses during
during the
the
second half of the 20th century: (b) 1956 (c) 1980, and (d) 2005.
second half of the 20th century: (b) 1956 (c) 1980, and (d) 2005.
Data
Data used
used inin this research originated
this research originated fromfrom various
various sources. Meteorological data
sources. Meteorological data (daily
(daily maximum
maximum
and minimum temperature; temperature, relative humidity, wind
and minimum temperature; temperature, relative humidity, wind speed, and cloudiness at 00, speed, and cloudiness at 00,
07,07,
13
13 and 18 UTC) from synoptic weather stations were obtained from AeMet,
and 18 UTC) from synoptic weather stations were obtained from AeMet, the Spanish meteorological the Spanish meteorological
office
office (Table
(Table 11 andand Figure
Figure 2).
2). Specifically,
Specifically, the the long-term
long-term trends
trends in in heat
heat waves
waves were were analyzed
analyzed onon the
the
time series of Madrid-Retiro weather station retrieved from the
time series of Madrid-Retiro weather station retrieved from the SDATS (Spanish Daily Adjusted SDATS (Spanish Daily Adjusted
Temperature
Temperature Series)Series) database
database [37].
[37]. The
The SDATS
SDATS timeseries
timeseries were were homogenized
homogenized and and adjusted
adjusted to
to solve
solve
some
some temperature inhomogeneities derived from the “screen bias” (change from Montsouris to
temperature inhomogeneities derived from the “screen bias” (change from Montsouris to
Stevenson screen), changes
Stevenson screen), changesin inplacement
placementand andanan artificial
artificial warming
warming trend
trend between
between 18941894
andand
1960,1960,
the
the period
period of the
of the largest
largest population
population increase.
increase.
Seasonal composites of large-scale
Seasonal composites of large-scale climatic climaticvariables
variables (e.g.,
(e.g., 500500
hPahPa geopotential
geopotential heights
heights andand850
850 hPa temperature) were extracted from the NCEP/NCAR
hPa temperature) were extracted from the NCEP/NCAR Reanalysis web site Reanalysis web site (http://www.esrl.noaa.
gov/psd/).
(http://www.esrl.noaa.gov/psd/).
Land
Land surface
surface temperature
temperature (LST)(LST) waswas analyzed
analyzed using using thethe product
product MYD11A1
MYD11A1 (V6) (V6) -MODIS/Aqua
-MODIS/Aqua
Land
Land Surface Temperature and Emissivity Daily L3 Global 1 km Grid SIN. Although the
Surface Temperature and Emissivity Daily L3 Global 1 km Grid SIN. Although the MODIS
MODIS
(Moderate
(Moderate Resolution Imaging Spectroradiometer) sensor is installed on two platforms, Aqua
Resolution Imaging Spectroradiometer) sensor is installed on two platforms, Aqua and
and
Terra,
Terra,only
only the
the first
first one
one was
was used
used because
because itsits approximate
approximate time time of of passage
passage overover thethe Iberian
Iberian Peninsula
Peninsula
(1:30
(1:30 a.m.
a.m. and
and 1:30
1:30 p.m.) is more
p.m.) is more suitable
suitable for
for the
the analysis
analysis of of the
the surface
surface UHI.
UHI. Compared
Compared with with other
other
platforms (e.g., ASTER or LANDSAT), the lower spatial resolution (~1 km 2 ) is compensated for by
platforms (e.g., ASTER or LANDSAT), the lower spatial resolution (~1 km2) is compensated for by a
ahigher
highertemporal
temporalresolution,
resolution,which
whichenables
enablesstudying
studyingthe thetemporal
temporal dimensions
dimensions of of the
the phenomenon.
phenomenon.
This
This product
product has has already
already been
been used
used inin research
research on on surface
surface UHI UHI in in cities
cities of varying sizes
of varying sizes and
and climates,
climates,
for
for example in Europe [38,39] and Asia [40]. Previous studies confirmed the accuracy of the MODIS
example in Europe [38,39] and Asia [40]. Previous studies confirmed the accuracy of the MODIS
LST
LST product, particularly by night under clear skies [41,42]. Additional technical details can
product, particularly by night under clear skies [41,42]. Additional technical details can be
be
consulted
consulted on the NASA website (https://lpdaac.usgs.gov/). The original images were subjected to
on the NASA website (https://lpdaac.usgs.gov/). The original images were subjected to aa
basic
basic quality
quality control
control analysis
analysis using
using only
only those
those daysdays with
with more
more than than 90%
90% valid
valid pixels
pixels within
within the
the limits
limits
of the image (a total of 7,645 images). To relate the surface temperature
of the image (a total of 7,645 images). To relate the surface temperature to land uses, the MODISto land uses, the MODIS images
were
imagescross-referenced with the with
were cross-referenced Global theLand
Global CoverLand2000 database
Cover 2000 [43]. This [43].
database databaseThiscovers thecovers
database entire
planet, providing 22 categories with a resolution of 1 km 2 , obtained from the VEGETATION sensor
the entire planet, providing 22 categories with a resolution of 1 km2, obtained from the VEGETATION
(SPOT 4 satellite). The types of land uses (Land Cover Classification System, LCCS) are inspired by the
FAO (Food and Agriculture Organization).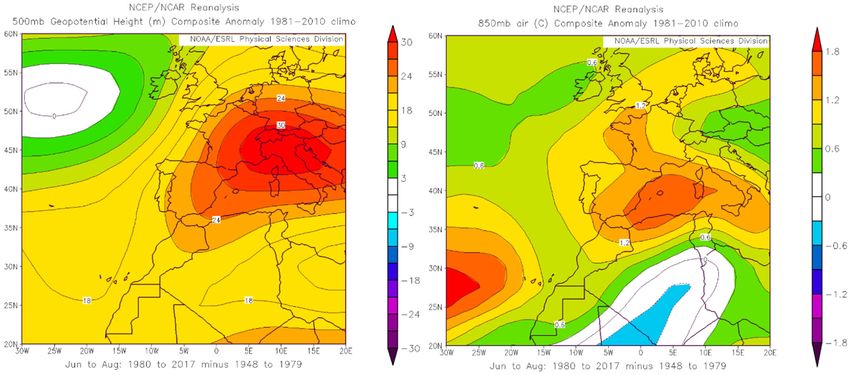
Atmosphere 2019, 10, x FOR PEER REVIEW 4 of 22
Atmosphere 2019, 10, 288 4 of 21
sensor (SPOT 4 satellite). The types of land uses (Land Cover Classification System, LCCS) are
inspired by the FAO
Additionally, (Food and
air quality Agriculture
data Organization).
were retrieved from the local Ayuntamiento de Madrid [44] and
regional Comunidad de Madrid [45] authorities. from
Additionally, air quality data were retrieved the local
Long-term Ayuntamiento
statistics de Madrid
of occurrence [44] and
of Saharan
regional were
outbreaks Comunidad de Madrid
downloaded [45]
from the authorities.
Spanish Long-term
Ministerio statistics of
para la Transición occurrence
Ecológica [46].of Saharan
outbreaks were downloaded from the Spanish Ministerio para la Transición Ecológica [46].
Figure 2. Location of the study area. Weather stations are depicted as filled squares (accompanied by
anFigure
aerial2. Location
view) of the
and air study
quality area. Weather
stations as emptystations
squaresare
or depicted as filled squares
circles, depending on their(accompanied
class. by
an aerial view) and air quality stations as empty squares or circles, depending on their class.
Table 1. Location of the meteorological stations.
Table 1. Location of the meteorological stations.
Station WMO Code Latitude Longitude Altitude Period LCZ 1
Barajas WMO
8221 Latitude
40.494 N Longitude
3.567 EAltitude 609Period 1961–2017LCZ 8/D
1
Station
Madrid-Retiro Code
8222 40.417 N 3.683 E 667 1880–2017 2/B
Cuatro Vientos
Barajas 82238221 40.371
40.494 NN 3.567 E E 609
3.785 691
1961–20171961–2017 8/D 5/D
Getafe 8224 40.294 N
Madrid-Retiro 8222 40.417 N 3.6833.724
E E 667 618
1880–20171961–2017 2/B 6/D
Torrejón de Ardoz 8227 40.497 N 3.446 E 617 1961–2017 8/D
Cuatro Vientos 8223 40.371 N 3.785 E
1 Local Climate Zones [47].
691 1961–2017 5/D
Getafe 8224 40.294 N 3.724 E 618 1961–2017 6/D
Torrejón de Ardoz 8227 40.497 N 3.446 E 617 1961–2017 8/D
Despite of the relevance of the phenomenon, no universal definition of a heat wave exists [48–50].
1 Local Climate Zones [47].
A heat wave can be considered as an extended period of hot days; from the statistical point of view, a
hot day Despite
may be of identified
the relevance
whenof air
thetemperature
phenomenon, no universal
rises beyond a definition
threshold, of a heatcalculated
usually wave exists [48–
from
50].temperature
the A heat wave can be considered
distribution recordedasatana meteorological
extended periodstation.of hot days;
Usingfrom the statistical
this basic procedure,point
butof
view, a hotthe
considering dayresults
may beof identified when airoftemperature
previous analyses the impact of rises
thebeyond a threshold,inusually
high temperatures Madridcalculated
[51–53],
wefrom the temperature
identified those days distribution
in which the recorded
maximum at a meteorological
temperature exceeds station.36.5 ◦
Using this
C at basic procedure,
Madrid-Retiro as
but considering
extreme the results
hot days (EHD). of previous
This value analyses
is equivalent of the
to the 95thimpact of the
percentile of high temperatures
the daily maximuminsummerMadrid
[51–53],
(June, July,we
andidentified those days in
August) temperature forwhich the maximum
the 1981–2010 period.temperature
Consequently, exceeds
a heat 36.5
wave°C at defined
was Madrid-
asRetiro as extreme
a period hot3days
of at least (EHD). This
consecutive EHDs, value is equivalent
becoming to the
heat wave days95th percentile
(HWDs). of the
In case daily
of an maximum
intermediate
summer
day between(June,
twoJuly,
heatand August)
waves, temperature
recording a maximumfor thetemperature
1981–2010 period. Consequently,
below such threshold,abutheat wave
above
was defined as a period of at least 3 consecutive EHDs, becoming heat wave days (HWDs). In case of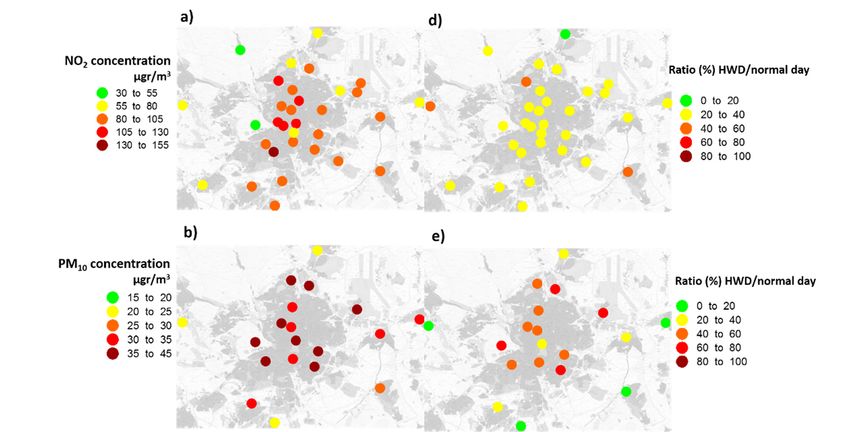
Atmosphere 2019, 10, 288                                                                                    5 of 21

the 90th percentile, it was also considered an EHD and both heat waves were merged into a single
heat wave.
     The magnitude of the CLUHI was quantified as the air temperature difference (∆T) between the
urban (Madrid-Retiro) and any other non-urban stations, calculated for both maximum (daytime) and
minimum (nighttime). A positive value indicates that Madrid-Retiro is warmer, whereas a negative
value indicates that is cooler. The Local Climate Zones (as defined by Stewart and Oke [47]) for each
station are presented in Table 1. Madrid-Retiro’s station is located in a park (LCZ B), approximately
100 m from a dense urban area (LCZ2). Barajas is the weather station of the busiest airport in Spain,
and it is located over a Low Plant (LCZ D) area, close to the main runway, with edifications (terminals)
at distances of less than 500 m (LCZ8). Cuatro Vientos, Getafe, and Torrejón de Ardoz are other
meteorological stations located at smaller airports, nearby urban areas of different densities. Also,
the number of summer tropical nights (Tmin > 20 ◦ C) [54] was calculated for the long-term evaluation
of the nighttime heat conditions.
     To describe and quantify heat waves from a human-biometeorological point of view, the
Physiological Equivalent Temperature (PET) index was calculated by the RayMan model [55,56].
PET describes the effect of the thermal environment as a temperature value (◦ C), which facilitates
interpretation of the results, and is based on the full human energy balance. PET is equivalent to
the air temperature at which, in a typical indoor setting, the heat balance of the human body (work
metabolism, 80 W of light activity, added to basic metabolism; heat resistance of clothing, 0.9 clo) is
maintained with core and skin temperatures equal to those of a body in the assessed conditions [57].
The classification of PET and the related physiological strain are given in Table 2.

      Table 2. Physiological Equivalent Temperature (PET) for different grades of thermal sensation and
      physiological stress on human beings (during standard conditions: heat transfer resistance of clothing,
      0.9 clo; internal heat production, 80 W) [58].

                       PET         Thermal Sensation            Physiological Stress Level
                           41           Very hot                   Extreme heat stress

     To evaluate potential health risks for the population due to abnormal concentrations of air
pollutants, daily averages, exceedances and ratios during normal days and HWD, plus a daily pollution
index (PI), were calculated for selected pollutants (PM10 , NO2 and O3 ). The PI [59] defines five distinct
air quality classes and matches a reference concentration (Cp ) of each individual pollutant (either daily
PM10 , maximum 8-hour O3 , or maximum hourly NO2 concentrations) to one of the five categories
(Table 3). The PI is expressed by:

                                            PIhi − PILO
                                     PI =                 Cp − BPlo + PIlo                                      (1)
                                            BPhi − BPlo

where BPhi and BPlo are the upper and lower concentration breakpoints of each PI category, respectively,
to which Cp corresponds; and PIhi and PIlo are the upper and lower PI breakpoints of the same category,
respectively (Table 3).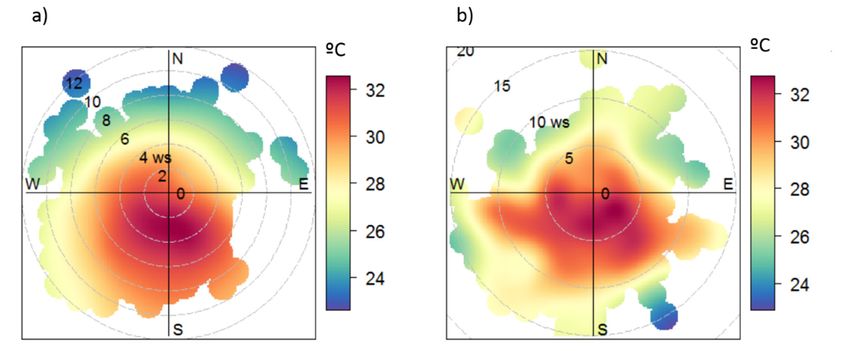
Atmosphere 2019, 10, 288                                                                                 6 of 21

      Table 3. Concentration breakpoints (µg·m−3 ) and corresponding pollution index (PI) values, for each
      PI air quality category [60].

                                                     PM10 24-h         NO2 24-h Max.      O3 8-h Daily Max.
          Pollution Category           PI
                                                  Average (µg·m−3 )      (µg·m−3 )            (µg·m−3 )
              Unhealthy                100              500                 1900                500
     Unhealthy for sensitive groups     85              238                  950                223
         Moderate pollution             70              144                 400                 180
            Low pollution              50               50                  200                 120
             Good quality               25               20                  40                  65

     The chi-square test of independence was used to evaluate whether a significant association exists
between the categories of two dichotomous variables, HWD and Saharan outbreaks (days). It is a
non-parametric (distribution free) test designed to analyze group differences, being robust with respect
to the data distribution. Specifically, it does not require equality of variances among the study groups
nor homoscedasticity in the data.

3. Results
    In this section, we first review the main temporal characteristics of heat waves in the Madrid
metropolitan area to continue with an analysis of how heat waves affect the UHI phenomenon. Finally,
we show the impact of heat waves on the air quality conditions.

3.1. Long-Term Trends on Heat Waves Occurrence
     Figure 3 shows the summer (JJA) average maximum temperature, the corresponding absolute
maximum temperature, and the number of EHD per summer season between 1880 and 2017 at
Madrid-Retiro. Years prior to 1880 were disregarded because of doubts about the data quality.
The evolution of both absolute and average maximum temperatures display large inter-annual
variability, but decadal trends are clearly connected with well-known phases of global temperatures.
Both parameters show a warming phase between 1880 and 1933 (0.03 ◦ C·year−1 ), replaced by a cooling
trend up to 1979 (−0.04 ◦ C·year−1 ). The last four decades of the 20th century exhibit a strong and
continuous warming trend, which amounts 0.09 ◦ C·year−1 . Overall, since 1880, the average maximum
temperature at Madrid-Retiro shows a warming trend of 0.03 ◦ C·year−1 . The warmest year was 2016,
with an average maximum temperature of 33.4 ◦ C. On a decadal time scale, the 10-year period between
2008 and 2017 must be considered the warmest in the historical record (32.1 ◦ C; ∆T = 1.6 ◦ C with
regard to the 1981–2010 “normal” period). The trend observed in the absolute summer maximum
temperature is similar to the average maximum temperature, although the variability is larger since it
depends on the occurrence of single day events. Two summers (2012 and 2017) out of three recorded
an absolute maximum temperature higher than 40 ◦ C in the aforementioned 10-year period since 2009.
     Another important feature of Madrid’s recent summer climate is the increase in the frequency
of EHD after the 1980s, which has occurred in longer spells (Figure 4a). Before 1980, occurrences of
EHD was a rare phenomenon, most of the time as single- or two-day events. The most remarkable
summer was 1949, which experienced both a four-day and a three-day event; however, 18 summers
(60%) between the 1948 and 1979 recorded no heat wave. The situation reversed after 1979, as a clear
increasing trend is detected; the slope of the linear fit equals 0.27 more HWD per year. We found that
2015 emerged as the absolute record year in the frequency of HWD, with 24 days, followed by 2017,
with 20 days, and 1991 with 17 days.
     Derived from the increase in the number of HWD and the length of the episodes, the core of
the summer, spanning from July 16 to August 15 (traditionally known as “canícula”) has extended,
particularly to June [60,61]. Most of the HWD until the 1980s were observed in July (74%) and August
(22%); the earliest HWD occurred on June 29 (1950) and the latest on August 17 (1949). During the last
four decades, summer is uniformly hotter than before, and the period prone to heat waves extends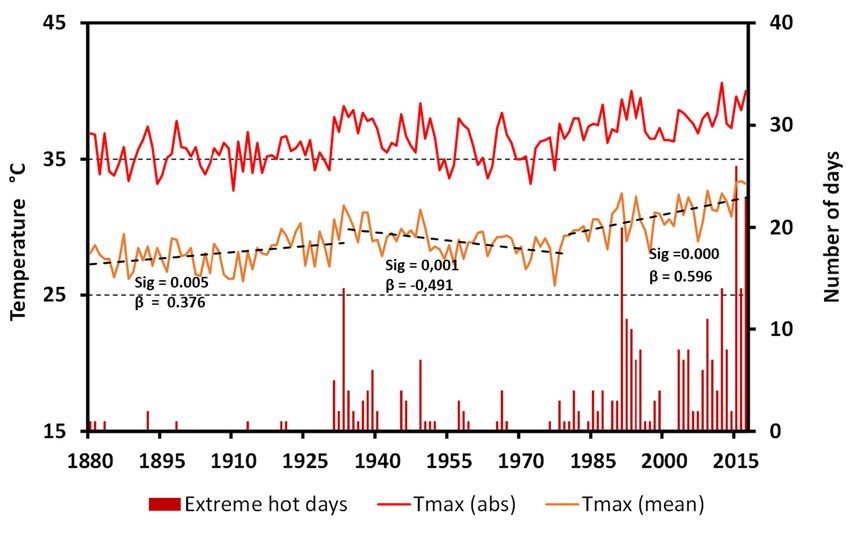
Atmosphere 2019, 10, 288                                                                                             7 of 21

to June (13%) and August (22%); the earliest have been recorded on 11 June 2017 and the latest on
29 August 2009.
     Regarding the possible causes of the warming experienced since the 1980s, Figure 4b shows the
daily maximum temperature distribution function corresponding to almost equally long temporal
periods, 1948–1979 and 1980–2017. Visually, both distributions are quite similar, but the mean and the
median of the second period are displaced almost 1.5 ◦ C to the right. This shift suggests the impact of
Atmosphere
the global2019,
           trend10,to
                    x FOR PEERtemperatures
                       higher  REVIEW      on the aforementioned warming.                         7 of 22

     Figure 3. Temporal evolution (1880–2017) of the summer (JJA) average maximum temperature,
     absolute
     Figure 3.maximum
                  Temporal temperature    and the number
                              evolution (1880–2017)         of extreme
                                                     of the summer       hotaverage
                                                                     (JJA)    days (EHD). Linear
                                                                                    maximum       trends of
                                                                                              temperature,
     average
     absolute maximum temperatures       are featured according to three sub-periods (1880–1933, 1934–1979,
Atmosphere 2019,maximum     temperature
                 10, x FOR PEER  REVIEW and the number of extreme hot days (EHD). Linear trends of average8 of 22
     and  1980–2017).
     maximum      temperatures are featured according to three sub-periods (1880–1933, 1934–1979, and 1980–
      2017).

      Another important feature of Madrid’s recent summer climate is the increase in the frequency
of EHD after the 1980s, which has occurred in longer spells (Figure 4a). Before 1980, occurrences of
EHD was a rare phenomenon, most of the time as single- or two-day events. The most remarkable
summer was 1949, which experienced both a four-day and a three-day event; however, 18 summers
(60%) between the 1948 and 1979 recorded no heat wave. The situation reversed after 1979, as a clear
increasing trend is detected; the slope of the linear fit equals 0.27 more HWD per year. We found that
2015 emerged as the absolute record year in the frequency of HWD, with 24 days, followed by 2017,
with 20 days, and 1991 with 17 days.
      Derived from the increase in the number of HWD and the length of the episodes, the core of the
summer, spanning from July 16 to August 15 (traditionally known as “canícula”) has extended,
particularly to June [60,61]. Most of the HWD until the 1980s were observed in July (74%) and August
(22%); the earliest HWD occurred on June 29 (1950) and the latest on August 17 (1949). During the
last four decades, summer is uniformly hotter than before, and the period prone to heat waves
     Figure 4. (a) Length runs of EHDs and (b) summer (JJA) daily maximum temperature distribution
extends   to June
      Figure 4. (a) (13%)
     corresponding  Length   and
                              runsAugust
                      to the periods   EHDs(22%);
                                    of 1948–1979
                                              and andthe
                                                   (b)    earliest(JJA)
                                                       summer
                                                       1980–2017
                                                                     have  been
                                                                        daily    recorded
                                                                              maximum
                                                                    at Madrid-Retiro.
                                                                                             on June 11,
                                                                                           temperature      2017 and the
                                                                                                         distribution
latestcorresponding
       on August 29,      2009.
                       to the periods 1948–1979 and 1980–2017 at Madrid-Retiro.
      Regardingathe
     However,           possible
                     regional      causes of the
                                 component          warming
                                                of this  summer experienced
                                                                     warmingsincemay the    1980s,
                                                                                        exist.       Figure
                                                                                                Figure   5a 4b   shows the
                                                                                                             displays    the
dailyHowever,
       maximum
anomalous          a temperature
             pattern    of 500 hPa
                      regional        distribution
                                       geopotential
                                  component          function
                                                of thisheights,
                                                          summer corresponding
                                                                   composited
                                                                      warming from  to almost
                                                                                  may            equally5along
                                                                                         the 1980–2017
                                                                                         exist. Figure     period temporal
                                                                                                                    minus
                                                                                                             displays    the
periods,
the
anomalous 1948–1979
    1948–1979    period.
             pattern     and
                        of  The
                           500 1980–2017.
                                 positive
                                hPa         Visually,
                                           area
                                     geopotentialover    both
                                                        the    distributions
                                                            Western
                                                      heights,                  are quite
                                                                        Mediterranean
                                                               composited      from         similar,
                                                                                           Basin
                                                                                      the 1980–2017    but the mean
                                                                                                   is consistent
                                                                                                        period     with and
                                                                                                                 minus  the
                                                                                                                         the
the medianperiod.
1948–1979     of the second     period are
                        The positive        displaced
                                         area  over thealmost
                                                           Western1.5 °C  to the right. This
                                                                       Mediterranean      Basinshift
                                                                                                  is suggests
                                                                                                      consistentthe impact
                                                                                                                   with  the
of the global
observed       trend to
            warming        higher
                         trend   of temperatures     on the aforementioned
                                    maximum temperatures,                         warming. pattern should induce a
                                                                     since the large-scale
broad-scale subsidence and adiabatic compression upon the tropospheric air masses.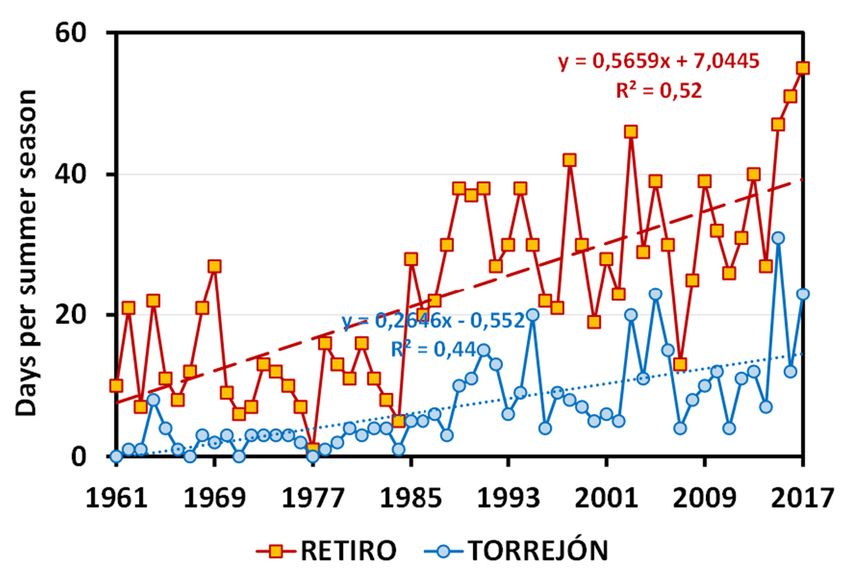
Figure 4. (a) Length runs of EHDs and (b) summer (JJA) daily maximum temperature distribution
      corresponding to the periods 1948–1979 and 1980–2017 at Madrid-Retiro.

Atmosphere 2019, 10, 288                                                                         8 of 21
     However, a regional component of this summer warming may exist. Figure 5a displays             the
anomalous pattern of 500 hPa geopotential heights, composited from the 1980–2017 period minus the
1948–1979warming
observed   period. The
                   trendpositive area over
                          of maximum       the Western
                                       temperatures,    Mediterranean
                                                      since              Basin
                                                            the large-scale     is consistent
                                                                             pattern          with the
                                                                                     should induce     a
observed  warming   trend of maximum    temperatures, since  the large-scale pattern
broad-scale subsidence and adiabatic compression upon the tropospheric air masses.    should  induce   a
broad-scale subsidence and adiabatic compression upon the tropospheric air masses.

      Figure 5. Composite anomaly maps of (a) 500 hPa geopotential heights (mts) and (b) 850 hPa temperature
       Figure 5. Composite anomaly maps of (a) 500 hPa geopotential heights (mts) and (b) 850 hPa
      (◦ C), corresponding to the period 1980–2017 minus 1948–1979 (from NCEP/NCAR reanalysis database).
       temperature (°C), corresponding to the period 1980–2017 minus 1948–1979 (from NCEP/NCAR
       reanalysis
      The          database).
             pattern displayed in Figure 5a ensures an upper-level southerly flux with negative relative
vorticity and a warm advection over the studied area, probably of Saharan origin, as portrayed by the
       The pattern displayed in Figure 5a ensures an upper-level southerly flux with negative relative
850 hPa temperature field (Figure 5b). The polar plots depicting the bivariate relationship between
 vorticity and a warm advection over the studied area, probably of Saharan origin, as portrayed by
13 UTC summer air temperature at Retiro and simultaneous surface wind and 850 hPa records from
 the 850 hPa temperature field (Figure 5b). The polar plots depicting the bivariate relationship
Barajas airport (Figure 6) emphasize the southerly component of the wind, more evident at the surface
 between 13 UTC summer air temperature at Retiro and simultaneous surface wind and 850 hPa
due   to the orientation
  Atmosphere               ofPEER
             2019, 10, x FOR  the Jarama
                                  REVIEW valley, where the airport facilities are located.            9 of 22
 records from Barajas airport (Figure 6) emphasize the southerly component of the wind, more evident
 at the surface due to the orientation of the Jarama valley, where the airport facilities are located.

        Figure
      Figure 6. 6. Polar
                Polar    plots
                       plots   relating
                             relating 1313 UTC
                                         UTC    summer
                                              summer  airair temperature
                                                           temperature   records
                                                                       records atat Retiro
                                                                                  Retiro   and
                                                                                         and   simultaneous
                                                                                             simultaneous (a)(a)
        surface and  (b) 850hPa   wind  records from Madrid-Barajas  airport.
      surface and (b) 850hPa wind records from Madrid-Barajas airport.

3.2.
  3.2.Heat
       HeatWaves
            Wavesand
                   andUHI
                       UHI

3.2.1.
  3.2.1.CLUHI
         CLUHI
       Due
        Duetotothetheaforementioned
                        aforementionedincreased
                                           increasedfrequency
                                                       frequencyofofheat
                                                                       heatwaves
                                                                              wavesafterafter1980,
                                                                                               1980,we
                                                                                                     werelied
                                                                                                         reliedupon
                                                                                                                 uponthethe
period   1980–2017     for the analysis of  the impact  of those  events   upon   Madrid´s
   period 1980–2017 for the analysis of the impact of those events upon Madrid´s summer CLUHI, summer   CLUHI,     which
is which
   a frequent    phenomenon
           is a frequent          by night,by
                            phenomenon       asnight,
                                                a response  of its large
                                                      as a response       urban
                                                                       of its largesize  andsize
                                                                                     urban     predominance     of stableof
                                                                                                   and predominance
atmospheric     conditions.
   stable atmospheric          Positive Positive
                           conditions.  differences  in minimum
                                                  differences       temperatures
                                                               in minimum              at Madrid-Retiro
                                                                                temperatures               occur almost
                                                                                                 at Madrid-Retiro    occur
9 almost
   of each910    nights,   with  average  differences    up to  2.5 ◦ C and maximums up to 5.5 ◦ C (Figure 7).
              of each 10 nights, with average differences up to 2.5 °C and maximums up to 5.5 °C (Figure
Distance    to the
   7). Distance   to city  center
                     the city      andand
                               center  topography
                                            topographyexplain   thethe
                                                          explain    primacy
                                                                        primacy  of of
                                                                                    Torrejón
                                                                                       Torrejón dedeArdoz
                                                                                                     Ardoz(LCZ2/B
                                                                                                              (LCZ2/Bvs.vs.
  LCZ8/D difference). Barajas (also a LCZ2/B vs. LCZ8/D difference) experiences similar but less
  intense differences, probably because the station is surrounded by the facilities of the busiest airport
  in Spain. Cuatro Vientos and Getafe (LCZ2/B vs. LCZ5/D, and LCZ2/B vs. LCZ6/D differences,
  respectively), display weaker differences in response to their suburban and southward locations, and
  less favorable topography to nocturnal cooling. By day, urban-to-rural differences reverse for all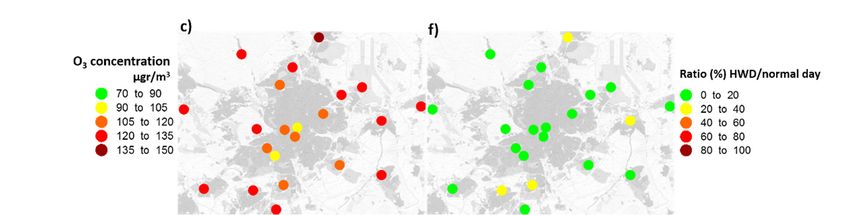
Due to the aforementioned increased frequency of heat waves after 1980, we relied upon the
period 1980–2017 for the analysis of the impact of those events upon Madrid´s summer CLUHI,
which is a frequent phenomenon by night, as a response of its large urban size and predominance of
stable atmospheric conditions. Positive differences in minimum temperatures at Madrid-Retiro occur
almost 9 of
Atmosphere each
2019, 10 nights, with average differences up to 2.5 °C and maximums up to 5.5 °C (Figure
10, 288 9 of 21
7). Distance to the city center and topography explain the primacy of Torrejón de Ardoz (LCZ2/B vs.
LCZ8/D difference). Barajas (also a LCZ2/B vs. LCZ8/D difference) experiences similar but less
LCZ8/Ddifferences,
intense difference). probably
Barajas (also a LCZ2/B
because vs. LCZ8/D
the station difference)
is surrounded byexperiences
the facilitiessimilar
of the but less airport
busiest intense
differences, probably because the station is surrounded by the facilities of the
in Spain. Cuatro Vientos and Getafe (LCZ2/B vs. LCZ5/D, and LCZ2/B vs. LCZ6/D differences, busiest airport in Spain.
Cuatro Vientos
respectively), and Getafe
display weaker (LCZ2/B vs. LCZ5/D,
differences andtoLCZ2/B
in response vs. LCZ6/D
their suburban differences,locations,
and southward respectively),
and
display weaker differences in response to their suburban and southward locations,
less favorable topography to nocturnal cooling. By day, urban-to-rural differences reverse and less favorable
for all
topography to nocturnal cooling. By day, urban-to-rural differences reverse for all stations.
stations.
Heat waves
Heat waves enhance
enhance the the nocturnal
nocturnal temperature
temperature contrast
contrast byby night.
night. The
The average
average minimum
minimum
temperature difference between Madrid-Retiro and Torrejón de Ardoz rises from 2.9 ◦ C during
temperature difference between Madrid-Retiro and Torrejón de Ardoz rises from 2.9 °C during
normal conditions
conditions to to 3.4 ◦ C during heat waves; for Barajas, the corresponding values are 1.9 ◦ C and
3.4 °C
normal during heat waves; for Barajas, the corresponding values are 1.9 °C and
◦
2.6 °C.
C. Conversely,
Conversely, no no differences
differences are
are observed
observed at at Cuatro
Cuatro Vientos
Vientos and
and Getafe.
Getafe. By
By day,
day, no
no substantial
substantial
2.6
differences are observed during heat
differences are observed during heat waves. waves.
Statistical distribution
Figure 7. Statistical
Figure distribution of
of the
the air
air temperature
temperature difference
difference between
between Madrid-Retiro
Madrid-Retiro and and each
each
other observatory
other observatory for daily
daily (a)
(a) minimum
minimum and and (b)
(b) maximum
maximum temperature
temperature during
during normal
normal summer
summer days
days
Atmosphere 2019, 10, x FOR PEER REVIEW 10 of 22
and HWD
and HWD for for the
the 1980–2017
1980–2017 period.
period. TOR
TOR stands
standsforfor Torrejón
Torrejón dede Ardoz,
Ardoz, BAR
BAR for
for Barajas,
Barajas, CUA
CUA for
for
Cuatro
Cuatro Vientos and
red rectangles GET for
represent theGetafe.
median, Grey
Grey boxes
blueboxes account
dots account
the forthe
for
average, the lower
lower
and (25%)
(25%)
whiskers andupper
and upper
indicate (75%)of
(75%)
the value quartiles,
quartiles,
the 5%
red rectangles represent
and 95% percentiles. the median, blue dots the average, and whiskers indicate the value of the 5%
and 95% percentiles.
As a direct consequence of the generalized warming, the number of summer tropical nights has
As a direct consequence of the generalized warming, the number of summer tropical nights has
increased since 1961 across the region, but the trend is faster in Madrid-Retiro (0.56 days per year)
increased since 1961 across the region, but the trend is faster in Madrid-Retiro (0.56 days per year) than
than in Torrejón de Ardoz (0.26 days per year) because of the intensification of nocturnal urban
inwarming
Torrejón(Figure
de Ardoz (0.26 days per year) because of the intensification of nocturnal urban warming
8). Both trends are statistically significant at a probability level of 0.001 according
(Figure 8).
to a t-test. Both trends are statistically significant at a probability level of 0.001 according to a t-test.
Figure 8. Long-term trends in the number of summer (JJA) tropical nights (daily minimum temperature
>Figure 8. Madrid-Retiro
20 ◦ C) at Long-term trends in the number
and Torrejón of summer (JJA) tropical nights (daily minimum
de Ardoz.
temperature > 20 °C) at Madrid-Retiro and Torrejón de Ardoz.
3.2.2. SUHI
The response of the earth surface to the atmospheric conditions created by heat waves follows
the same direction observed in the case of air temperatures. Figure 9 displays the spatial pattern of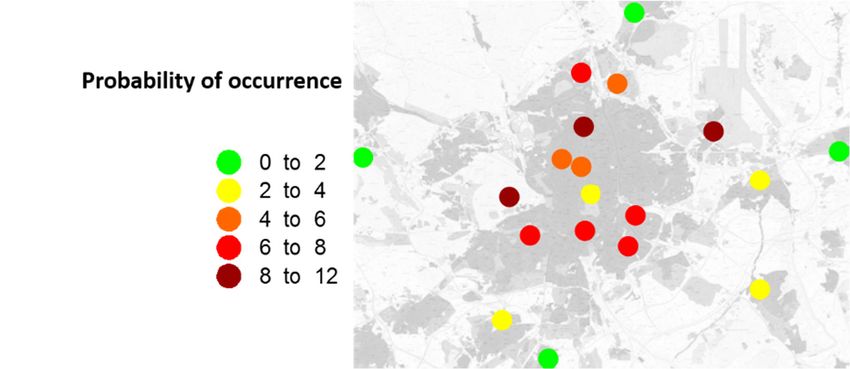
Atmosphere 2019, 10, 288                                                                           10 of 21

3.2.2. SUHI
      The response of the earth surface to the atmospheric conditions created by heat waves follows
the same direction observed in the case of air temperatures. Figure 9 displays the spatial pattern of
average LST corresponding to the nocturnal and diurnal images during HWD, and their pixel-to-pixel
differences with respect to normal summer conditions, obtained for the 2002–2017 period.
      As a whole, the maps indicate that surface temperature anomalies coincide, to a great extent,
with the built environment. The more irregular diurnal spatial pattern during daytime contrasts with
the concentric disposition of the surface temperature field by night, when the center of Madrid is
surrounded by an archipelago of smaller heat islands. By day, shadows and the greater heat capacity
of urban materials explain the slower warming of the city, forming a surface urban “cool” island
(SUCI). The lowest temperatures are visible at the western border of the city, in connection with the
valley of the Manzanares river and the urban forest of Casa de Campo (about 10 ◦ C less than the
warmest spots). At the southeast, the warmest anomalies appear due to the presence of bare soils under
gypsum rocks, accompanied by some isolated cool spots that coincide with wet surfaces (Jarama river).
At night, the slow release of the heat accumulated in the city keeps the city warmer (about 24 ◦ C) than
the surroundings. Several lines, following the transportation system, join Madrid with the smaller
suburban cities, like Móstoles and Getafe, whose islands are weaker (about 22 ◦ C). The Barajas airport
complex, in the north, becomes one the coolest spots, as well as the valleys of the Manzanares (NW)
and Jarama (SE) rivers, highlighting the role of the topography in channeling cool air masses from the
surrounding mountains and plateaus.
      The map of nighttime anomalies confirms that, as with air temperature, SUHI intensifies during
heat waves. The area corresponding to the highest anomalies is displaced to the more northerly
neighborhoods of Madrid, which are also characterized by a high build-up density and narrow streets,
but smaller urban nuclei also show positive anomalies of LST. Negative anomalies show a longitudinal
N–S arrangement, which roughly corresponds to the background of the valleys of the Manzanares
(to the west) and Jarama (to the east) rivers. By daytime, heat waves intensify the SUCI, by increasing
LST at two particular locations: the NW and the SE.
      To properly quantify the impact of the different land uses on surface temperature due to heat waves,
we calculated the average LST values pixel-by-pixel, and then we grouped them together according to
several categories (Figure 10). According to the Global Land Cover 2000 database, urban uses represent
approximately 14% of each image, woodlands 9.1%, rain fed crops 67.1%, and scrub/grassland 9.8% (for
sake of simplicity, the two latter were grouped together into a class named herbaceous).
      The thermal diversity is higher by day as a result of the multiple reflections of solar radiation
associated with the sun’s path over the horizon, the larger albedo values, and the shadows generated
by buildings or the presence of vegetation within urban areas, in contrast to a constant emission of
infrared radiation by night. Urban spaces are confirmed to be areas with lower thermal amplitude,
cooler by day (46.9 ◦ C) and warmer by night (23.1 ◦ C). The type of vegetation also controls the values
of LST by daytime (forests being the coolest), although the differences diminish by night.
Atmosphere 2019, 10, x FOR PEER REVIEW 11 of 22
Manzanares (to the
Atmosphere 2019, west) and Jarama (to the east) rivers. By daytime, heat waves intensify the SUCI,
10, 288 11 of 21
by increasing LST at two particular locations: the NW and the SE.
Figure 9. Spatial pattern of summer (a) daytime and (c) nighttime LST during HWDs and difference
Figure
with9.respect
Spatialto
pattern of and
(b) days summer (a) daytime
(d) nights and
without (c)waves.
heat nighttime LST during HWDs and difference
with respect to (b) days and (d) nights without heat waves.
The arrival of hot air masses during heat waves produces a general increase in LST at any time.
To properly
Comparing thequantify the impact
temperature of urbanofsurfaces
the different land
with the uses
other on uses,
land surface
wetemperature due
found that the to heat
enhancement
waves, we calculated the average LST values pixel-by-pixel,
◦ and then we ◦ grouped them together
of the diurnal “cool” island is slightly larger (−1.5 C normal days, −2.1 C heat wave days) than the
according to several
nocturnal categories
heat island (Figure2.3
(2 ◦ C versus 10). According
◦ C, to the
respectively) Globalof
because Land Cover 2000
the greater database,increase
temperature urban of
usesforest
represent approximately
and herbaceous 14% of each image, woodlands 9.1%, rain fed crops 67.1%, and
surfaces.
scrub/grassland 9.8% (for sake of simplicity, the two latter were grouped together into a class named
herbaceous).
The thermal diversity is higher by day as a result of the multiple reflections of solar radiation
associated with the sun's path over the horizon, the larger albedo values, and the shadows generated
by buildings or the presence of vegetation within urban areas, in contrast to a constant emission of
infrared radiation by night. Urban spaces are confirmed to be areas with lower thermal amplitude,
cooler by day (46.9 °C) and warmer by night (23.1 °C). The type of vegetation also controls the values
of LST by daytime (forests being the coolest), although the differences diminish by night.The arrival of hot air masses during heat waves produces a general increase in LST at any time.
Comparing the temperature of urban surfaces with the other land uses, we found that the
enhancement of the diurnal “cool” island is slightly larger (−1.5 °C normal days, −2.1 °C heat wave
days) than
Atmosphere the288nocturnal heat island (2 °C versus 2.3 °C, respectively) because of the 12greater
2019, 10, of 21
temperature increase of forest and herbaceous surfaces.
Figure 10.10.Statistical
Figure Statisticaldistribution
distributionofof
LST byby
LST land uses
land for
uses for(a)(a)nighttime
nighttimeand
and (b)
(b)daytime
daytime during
duringnormal
normal
summer
summerdaysdays(NO)
(NO) and
andheat wave
heat wave days (HWD).
days (HWD). Grey
Grey boxes
boxes account
accountforfor
the
thelower
lower(25%) and
(25%) andupper
upper
(75%) quartiles, red rectangles represent the median, blue dots the average, and whiskers
(75%) quartiles, red rectangles represent the median, blue dots the average, and whiskers indicate indicate the
the
value of the 5% and 95% percentiles.
value of the 5% and 95% percentiles.
3.2.3. Physiologic Urban Heat Island
3.2.2. Physiologic Urban Heat Island
Urban comfort conditions were assessed at each meteorological observatory using PET values,
Urban comfort conditions were assessed at each meteorological observatory using PET values,
also calculated for the 1980–2017 period. Figure 11 presents the frequency of occurrence of each PET
also calculated for the 1980–2017 period. Figure 11 presents the frequency of occurrence of each PET
classes during normal days and HWD, during both nighttime and daytime. A clear shift to higher
classes during normal days and HWD, during both nighttime and daytime. A clear shift to higher
PET classes is depicted during HWD, particularly during daytime. The figure also reveals that the
PET classes is depicted during HWD, particularly during daytime. The figure also reveals that the
distribution of PET classes on each observatory is in accordance with the distance to the city center.
distribution of PET classes on each observatory is in accordance with the distance to the city center.
As expected, the population suffers very hot conditions during most of the HWD days at 13 UTC,
As expected, the population suffers very hot conditions during most of the HWD days at 13 UTC,
particularly those living in the city center (almost 100% of the days); very hot conditions were also
particularly those living in the city center (almost 100% of the days); very hot conditions were also
common in Cuatro Vientos and Getafe, as the former weather station also experiences a weaker UHI
common in Cuatro Vientos and Getafe, as the former weather station also experiences a weaker UHI
and the latter occupies a southward location. Night hours provide relief of the heat stress, since
and the latter occupies a southward location. Night hours provide relief of the heat stress, since
comfortable sensations are predominant; however, slightly warm conditions are present in urban
comfortable sensations are predominant; however, slightly warm conditions are present in urban
observatories, whereas slightly cool conditions characterize nights in the outskirts of Madrid.
observatories, whereas slightly cool conditions characterize nights in the outskirts of Madrid.Atmosphere 2019, 10, 288 13 of 21
Atmosphere 2019, 10, x FOR PEER REVIEW 13 of 22
Figure 11. Frequency of occurrence of PET classes by nighttime (00 UTC) and daytime (13 UTC). (VH:
Figure 11. Frequency of occurrence of PET classes by nighttime (00 UTC) and daytime (13 UTC). (VH:
Very Hot; H: Hot; WM: Warm; SW: Slightly Warm; CF: Comfortable; SC: Slightly Cool; CL: Cool) during
Very Hot; H: Hot; WM: Warm; SW: Slightly Warm; CF: Comfortable; SC: Slightly Cool; CL: Cool)
normal days (hatched bars) and HWD (black bars).
during normal days (hatched bars) and HWD (black bars).
3.3. Air Quality During Heat Waves
3.3. Air Quality During Heat Waves.
The mean pollution levels during HWD and their ratios (% of variation) regarding normal days
The mean
for selected pollution
pollutants arelevels during
presented in HWD
Figureand
12. their ratiosconcentration
The mean (% of variation) regarding
of all normal
pollutants days
increased
for selected pollutants are presented in Figure 12. The mean concentration of all pollutants increased
during HWD, but the increase was significant in most stations only for PM10 levels according to a t-test.
during
The HWD,inbut
increases NOthe increase was significant in most stations only for PM10 levels according to a t-
2 levels were less pronounced, and non-relevant for O3 levels. The higher increases
test. The increases in NO 2 levels were less pronounced, and non-relevant for O3 levels. The higher
of PM10 concentration (sometimes more than 60%) were observed at stations inside the city, rather
increases of PM 10 concentration (sometimes more than 60%) were observed at stations inside the city,
than in suburban places (less than 25% on average), mainly at the NE, which might be a consequence
rather
of than in suburban
the displacement of theplaces
urban(less
plume than
by 25% on average),
the southerly windsmainly
duringatHWD.
the NE, Aswhich
stated might be a
previously,
consequence of the displacement of the urban plume by the southerly
the moderate increase in NO2 concentrations showed no clear spatial pattern. winds during HWD. As stated
previously, the moderate increase in NO2 concentrations showed no clear spatial pattern.Atmosphere 2019, 10, 288 14 of 21
Atmosphere 2019, 10, x FOR PEER REVIEW 14 of 22
Atmosphere 2019, 10, x FOR PEER REVIEW 14 of 22
Figure 12. Spatial patterns
Spatial patterns ofofsummer
summer (JJA)
(JJA)daily
daily average
average concentrations
concentrations of
of NO
NO 2 (upper
2 (upper
row),
row), PM1010
Figure
Figure 12. 12.
Spatial patterns of summer (JJA) daily average concentrations of NO 2 (upper row), PMPM10
(middle
(middle row),
row),and O3 (lower row) corresponding to HWD (left column) and the ratio between HWD
(middle row), andand O3 (lower
O3 (lower row)row) corresponding
corresponding to HWD
to HWD (left(left column)
column) andand
the the
ratioratio between
between HWD HWD
and normal summer days (right column).
andand normal
normal summer
summer daysdays (right
(right column).
column).
AsAsAs expected,
expected, thethe
expected, the increase
increase
increase in ininthe
the the average
average
average concentration
concentration
concentration levels
levels
levels during
during
during HWDHWD
HWD resulted
resulted
resulted in ininthe
the airair
the air
quality
quality standards
standards being
being exceeded.
exceeded. Figure
Figure 13
13 shows
shows the
the probability
probability of
ofoccurrence
occurrence
quality standards being exceeded. Figure 13 shows the probability of occurrence of a PM10 exceedance of
ofaa PM
PM 10
10exceedance
exceedance
(more
(more than
than 50
50 μg
µg mm −3
−3 ) )during
during HWDs
HWDs with
with respect
respect totonormal
normal days.
days. This
This dimensionless
dimensionless value
value was
was
(more than 50 μg m ) during HWDs with respect to normal days. This dimensionless value
−3 was
calculated by dividing the probability of a PM 1010exceedance occurrence
calculated by dividing the probability of a PM10 exceedance occurrence during a HWD by thethe
calculated by dividing the probability of a PM exceedance occurrence during
during a aHWD
HWD by
by the
probability
probability of of
probability of an
an an exceedance
exceedance
exceedance occurrence
occurrence
occurrence during
during
during aanormal
normal
a normal summer
summer
summer day
day
day (probability
(probability
(probability ofof
of occurrence
occurrence
occurrence ofof
of an
anan exceedance
exceedance
exceedance calculated
calculated
calculated as as number
asnumber
number of
ofofdays days
days with with
with exceedances
exceedances
exceedances by by by
total total
number
total number
number of of
of days atdays
days eachat at each
station).
each
station). The aforementioned spatial pattern of concentration around the city center is also visible in in
station).
The The aforementioned
aforementioned spatial spatial
pattern pattern
of of concentration
concentration around around
the city the city
center is center
also is also
visible invisible
Figure 13,
Figure
where
Figure 13, where
13,awhere a PM
PM10 aexceedance 10 exceedance
PM10 exceedance is up tois12is up
uptimesto 12
to 12 moretimes more
timesprobable probable under
under under
more probable a
a heat awaveheat
heat thanwave
waveathan than
normal a normal
day.
a normal
day.
day.
Figure13.
Figure Probability(%)
13.Probability (%)ofofoccurrence
occurrenceofofaaPM10
PM10exceedance
exceedanceday
dayduring
duringaaHWD
HWDwith
withrespect
respecttoto
Figure 13. Probability (%) of occurrence of a PM10 exceedance day during a HWD with respect to
normalsummer
normal summerdays.
days.
normal summer days.
Figure
Figure 1414 verifies
verifies thethe degradation
degradation of of
airair quality
quality during
during HWDs
HWDs byby means
means of of
PI PI
in in three
three selected
selected
stations:Aguirre
stations: Aguirre(urban
(urbantraffic),
traffic),Farolillo
Farolillo(urban
(urbanbackground),
background),
and andCasa
CasadedeCampo
Campo(suburban
(suburbanAtmosphere 2019, 10, 288 15 of 21
Figure 14 verifies the degradation of air quality during HWDs by means of PI in three selected
Atmosphere 2019, 10, x FOR PEER REVIEW 15 of 22
stations: Aguirre (urban traffic), Farolillo (urban background), and Casa de Campo (suburban
background). PI values were exclusively determined by PM10 concentrations. Figure 14 shows a clear
background). PI values were exclusively determined by PM10 concentrations. Figure 14 shows a clear
shift to higher PI classes during HWD, which is more pronounced at the urban traffic station.
shift to higher PI classes during HWD, which is more pronounced at the urban traffic station.
Figure 14. Frequency of occurrence of PI classes (G: good air quality; L: low air quality; M: moderate
Figure 14. Frequency
air quality) of occurrence
during HWDs of PIbar)
(solid black classes
and (G: goodsummer
normal air quality;
days L:(grey
low air quality;
bar) M:selected
at three moderate
air
air quality) during HWDs (solid black bar) and normal summer days (grey bar) at three selected
pollution stations: (a) Aguirre, urban traffic; (b) Farolillo, urban background; and (c) Casa de Campo, air
pollution
suburbanstations: (a) Aguirre, urban traffic; (b) Farolillo, urban background; and (c) Casa de Campo,
background.
suburban background.
As discussed above, we hypothesized the advection of warm air masses from Northern Africa as
As discussed
the most probableabove, weheat
cause of hypothesized the advection
waves in Madrid. Saharanof dust
warm air masses
plumes from
are one theNorthern Africa
main origins of
as the most probable cause of heat waves in Madrid. Saharan dust plumes are one the main
elevated concentrations of PM10 in Madrid [62,63]. For that reason, we assessed the relationship betweenorigins
of elevated
heat waves,concentrations of PM10 in and
Saharan dust outbreaks, Madrid [62,63]. conditions
air quality For that reason, we assessed
in Madrid theMore
(Table 4). relationship
Saharan
between heat waves,
dust outbreaks Saharan
are expected todust
occuroutbreaks, and air
simultaneously quality
with waves (X2 value
heat conditions in Madrid (Table
of 47.81, 4). More
significant at
Saharan dust outbreaks are expected to occur simultaneously with heat waves (X 2 value of 47.81,
0.001 level); outbreaks simultaneous with heat waves more probably produce a widespread occurrence
significant at 0.001 level);
of PM10 exceedances, outbreaks
as shown simultaneous
by the average with heat
ratio between waves
stations more probably
with/without produce a
exceedances.
widespread occurrence of PM10 exceedances, as shown by the average ratio between stations
with/without exceedances.
Table 4. Combined probability of occurrence of heat wave days and Saharan dust outbreak days
(2010–2017) and significance according to an X2 test.
Table 4. Combined probability of occurrence of heat wave days and Saharan dust outbreak days
Non Outbreak Days Saharan Outbreak Days
(2010–2017) and significance according to an X2 test.
Non heat wave days 486 233
Non Outbreak
20
Heat waves days
Saharan Outbreak54Days
Chi-Square test Days 47.81 *
Stations experiencing PM10 days
Non heat wave daily 486 233 51.53
28.65
exceedances (% of the total)
Heat waves days 20 54
* Significant at 0.001.
Chi-Square test 47.81 *
Stations experiencing PM10
4. Discussion and Conclusions
daily exceedances (% of 28.65 51.53
We analyzed the
theevolution
total) of heat waves in Madrid (Spain) and their impacts on human comfort.
Those extreme events show an increase* in frequency
Significant and duration after 1980, in close agreement
at 0.001.
with similar findings about the temporal evolution of heat waves in the Iberian Peninsula and the
Mediterranean
4. Discussion andregion [64–70]. Regarding the underlying cause of this trend, it might be primarily
Conclusions
related to the increase in global temperatures. However, it is not possible to rule out a regional
We analyzed the evolution of heat waves in Madrid (Spain) and their impacts on human
component in the form of a change in atmospheric circulation, which might favor a higher frequency of
comfort. Those extreme events show an increase in frequency and duration after 1980, in close
hot air masses advections from southern latitudes. Confirmation of these hypotheses pends future work.
agreement with similar findings about the temporal evolution of heat waves in the Iberian Peninsula
and the Mediterranean region [64–70]. Regarding the underlying cause of this trend, it might be
primarily related to the increase in global temperatures. However, it is not possible to rule out a
regional component in the form of a change in atmospheric circulation, which might favor a higherYou can also read