Mesoscale Dynamics and Niche Segregation of Two Dinophysis Species in Galician-Portuguese Coastal Waters - MDPI
←
→
Page content transcription
If your browser does not render page correctly, please read the page content below

toxins
Article
Mesoscale Dynamics and Niche Segregation of
Two Dinophysis Species in Galician-Portuguese
Coastal Waters
Patricio A. Díaz 1,2, * , Beatriz Reguera 1 , Teresa Moita 3,4 , Isabel Bravo 1 ,
Manuel Ruiz-Villarreal 5 and Santiago Fraga 1
 1   Instituto Español de Oceanografía (IEO), Centro Oceanográfico de Vigo, Subida a Radio Faro 50, 36390 Vigo,
     Spain; beatriz.reguera@ieo.es (B.R.); isabel.bravo@ieo.es (I.B.); santi.fraga.ieo.vigo@gmail.com (S.F.)
 2   Centro i~mar & CeBiB, Universidad de Los Lagos, 557 Puerto Montt, Chile
 3   Instituto Português do Mar e da Atmosfera (IPMA), Av. Brasília, 1449-006 Lisboa, Portugal;
     tmoitagarnel@gmail.com
 4   CCMAR, Universidade do Algarve, Campus de Gambelas, 8005-339 Faro, Portugal
 5   Instituto Español de Oceanografía (IEO), Centro Oceanográfico de A Coruña, Muelle das Ánimas s/n,
     15001 A Coruña, Spain; manuel.ruiz@ieo.es
 *   Correspondence: patricio.diaz@ulagos.cl; Tel.: +56-65-2322423

 Received: 1 December 2018; Accepted: 31 December 2018; Published: 14 January 2019

 Abstract: Blooms of Dinophysis acuminata occur every year in Galicia (northwest Spain), between
 spring and autumn. These blooms contaminate shellfish with lipophilic toxins and cause lengthy
 harvesting bans. They are often followed by short-lived blooms of Dinophysis acuta, associated with
 northward longshore transport, at the end of the upwelling season. During the summers of 1989 and
 1990, dense blooms of D. acuta developed in situ, initially co-occurring with D. acuminata and later with
 the paralytic shellfish toxin-producer Gymnodinium catenatum. Unexplored data from three cruises
 carried out before, during, and following autumn blooms (13–14, 27–28 September and 11–12 October)
 in 1990 showed D. acuta distribution in shelf waters within the 50 m and 130 m isobaths, delimited
 by the upwelling front. A joint review of monitoring data from Galicia and Portugal provided a
 mesoscale view of anomalies in SST and other hydroclimatic factors associated with a northward
 displacement of the center of gravity of D. acuta populations. At the microscale, re-examination of the
 vertical segregation of cell maxima in the light of current knowledge, improved our understanding
 of niche differentiation between the two species of Dinophysis. Results here improve local transport
 models and forecast of Dinophysis events, the main cause of shellfish harvesting bans in the most
 important mussel production area in Europe.

 Keywords: Dinophysis acuta; Dinophysis acuminata; DSP; physical–biological interactions; niche
 partitioning; climatic anomaly

 Key Contribution: Large positive SST anomalies combined with moderate upwelling and persistent
 thermal stratification were associated with the early decline of D. acuminata and its replacement by
 Dinophysis acuta in northwestern Iberian coastal waters and a poleward shift of the species distribution.
 The co-occurrence of D. acuminata with D. acuta from July to August showed a niche partitioning
 of the two toxic species; concentration of okadaic acid in raft mussels was a useful indicator of the
 vertical distribution of the species.

Toxins 2019, 11, 37; doi:10.3390/toxins11010037                                   www.mdpi.com/journal/toxins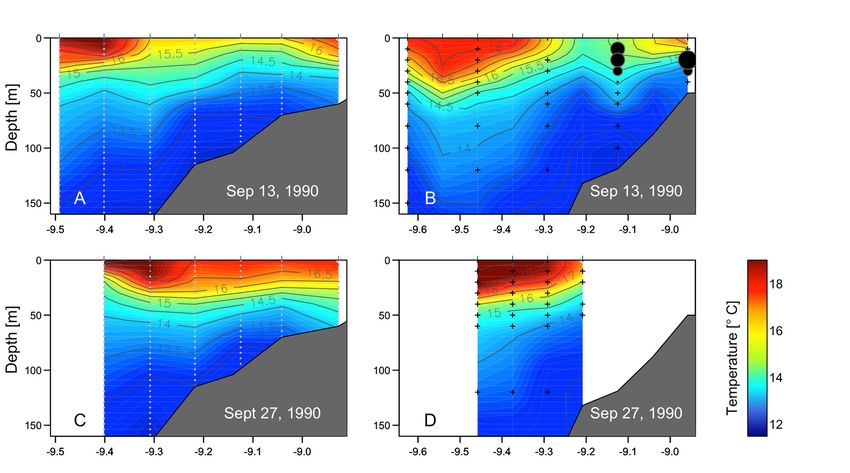
Toxins 2019, 11, 37                                                                                    2 of 21

1.Toxins
    Introduction
         2019, 11, x FOR PEER REVIEW                                                                   2 of 21

     Potentially toxic dinoflagellate species of the genus Dinophysis are distributed worldwide. To date,
 diarrhetic shellfish poisoning (DSP) toxins and/or pectenotoxins (PTXs) [1]. These toxins are retained
around twelve species of Dinophysis have been found to produce two kinds of lipophilic toxins:
 by filter feeding bivalves and are the main cause of shellfish harvesting bans in western Europe [2].
diarrhetic shellfish poisoning (DSP) toxins and/or pectenotoxins (PTXs) [1]. These toxins are retained
 These bans are enforced when shellfish contamination with DSP toxins and PTXs exceeds the
by filter feeding bivalves and are the main cause of shellfish harvesting bans in western Europe [2].
 Regulatory Levels (RL) established by European Union directives [3] (herein referred to as “DSP
These bans are enforced when shellfish contamination with DSP toxins and PTXs exceeds the
 event”). DSP events may occur with moderate cell densities, i.e., a few hundred cells per liter, and
Regulatory Levels (RL) established3by European         Union directives [3] (herein referred to as “DSP
 blooms of Dinophysis (densities > 10 cell L−1) are defined as “low biomass blooms of toxin producing
event”). DSP events may occur with moderate cell densities, i.e., a few hundred cells per liter,
 microalgae which are transferred through the food web” [1].
and blooms of Dinophysis (densities > 103 cell L−1 ) are defined as “low biomass blooms of toxin
      Negative impacts of Dinophysis blooms, namely of D. acuminata and D. acuta, are particularly
producing microalgae which are transferred through the food web” [1].
 severe in the Galician Rías Baixas and northern Portugal, northwestern Iberia, where harvesting
     Negative impacts of Dinophysis blooms, namely of D. acuminata and D. acuta, are particularly
 bans may last more than nine months in the most affected shellfish production areas [1,4,5]. This
severe in the Galician Rías Baixas and northern Portugal, northwestern Iberia, where harvesting bans
 region, located on the northern limit of the Canary Current upwelling system (Figure 1A,B), is
may last more than nine months in the most affected shellfish production areas [1,4,5]. This region,
 subject to a seasonal upwelling regime due to latitudinal shifts of the Azores high- and the Iceland
located on the northern limit of the Canary Current upwelling system (Figure 1A,B), is subject to a
 low-pressure systems [6]. Predominant northerly winds from April to September provoke
seasonal upwelling regime due to latitudinal shifts of the Azores high- and the Iceland low-pressure
 upwelling, and southerly winds from October to March lead to downwelling. In early spring and
systems [6]. Predominant northerly winds from April to September provoke upwelling, and southerly
 summer, northerly winds create jets of cold upwelled water on the shelf, and a southward flow of
winds from October to March lead to downwelling. In early spring and summer, northerly winds
 offshore surface waters, the Portuguese Coastal Current (PCC) [7,8] (Figure 1). A poleward
create jets of cold upwelled water on the shelf, and a southward flow of offshore surface waters, the
 countercurrent, the Portuguese Coastal Undercurrent (PCUC), also known as the Poleward Surface
Portuguese Coastal Current (PCC) [7,8] (Figure 1). A poleward countercurrent, the Portuguese Coastal
 Slope Current, or the Iberian Poleward Current (IPC), transports warmer and saltier subtropical
Undercurrent (PCUC), also known as the Poleward Surface Slope Current, or the Iberian Poleward
 water to the north [9,10]. In addition, during the autumn transition from the upwelling to
Current (IPC), transports warmer and saltier subtropical water to the north [9,10]. In addition, during
 downwelling season, a relatively narrow poleward warm flow has been described on the inner shelf,
the autumn transition from the upwelling to downwelling season, a relatively narrow poleward warm
 the “inner shelf countercurrent”, inshore of a southward moving tongue of previously upwelled
flow has been described on the inner shelf, the “inner shelf countercurrent”, inshore of a southward
 water [11,12].
moving tongue of previously upwelled water [11,12].

      Figure 1. Map of the study area showing (A) Iberian Peninsula, (B) Northwest Iberia and location of the
       Figure 1. Map of the study area showing (A) Iberian Peninsula, (B) Northwest Iberia and location of
      sampling station (asterisk) for upwelling index estimates, and (C–E) location of the sampling stations
       the sampling station (asterisk) for upwelling index estimates, and (C–E) location of the sampling
      during the three cruises and of the two monitoring stations in Ría de Vigo and Ría de Pontevedra.
       stations during the three cruises and of the two monitoring stations in Ría de Vigo and Ría de
       Pontevedra.has been identified as the main physical factor controlling phytoplankton dominance
      Upwelling
in the Galician Rías [13–15] and changes in upwelling patterns related to changes in phytoplankton
      Upwelling has been identified as the main physical factor controlling phytoplankton
 dominance in the Galician Rías [13–15] and changes in upwelling patterns related to changes in
 phytoplankton community composition and in the frequency of toxic algae events [13,14,16]. On a
 seasonal scale, initiation or intensification of PSP (Gymnodinium catenatum) and DSP (Dinophysis)
Toxins 2019, 11, 37                                                                               3 of 21

community composition and in the frequency of toxic algae events [13,14,16]. On a seasonal scale,
initiation or intensification of PSP (Gymnodinium catenatum) and DSP (Dinophysis) events have been
associated with upwelling relaxation at the end of the upwelling season. The inner shelf countercurrent
has been related with a northward transport of harmful dinoflagellates from northern Portuguese
waters towards the Galician Rías Baixas [11,17]. On a smaller spatiotemporal scale, the highest risk of
toxic events occurs during relaxation/downwelling between upwelling pulses (transport), or with
calm weather and a stratified water column following upwelling (in situ growth) [18–20].
      Previous studies in the region have shown that D. acuminata and D. acuta exhibit marked
differences in their phenology [21–24] and occur associated with different microplankton assemblages
throughout the annual succession [25]. Thus, the initiation of the D. acuminata growth season has
been shown to be tightly coupled to the beginning of the upwelling season (March to September) and
establishment of a shallow early spring pycnocline [26]. Earlier (March) DSP events caused by this
species have been related to anomalous wind patterns the preceding winter [27]. In contrast, D. acuta,
a mid-to-late summer species in northern Portugal, thrives under thermal stratification combined with
moderate upwelling (Figure 1B) [28,29]. High densities of D. acuta in the Rías Baixas are usually found
only at the end of the upwelling season (autumn transition) associated with upwelling relaxation
and longshore transport [21,30,31]. But during exceptionally hot and dry summers combined with
moderate upwelling pulses, D. acuta was found to grow in the Rías Baixas at the same time as and
later replacing D. acuminata [23]. In addition, toxic blooms of the chain former Gymnodinium catenatum,
producer of paralytic shellfish poisoning (PSP) toxins, occurs in some years in the autumn [11,32].
Blooms of G. catenatum have been also related to longshore transport at the end of the upwelling
season, but a time lag of approximately seven days (two consecutive samplings) was usually observed
in the Galician HAB monitoring between the sudden peaks of this species from 1986 to 1990 and the
preceding maxima of D. acuta (unpubl. data). This time lag suggests different locations of the source
populations for each species’ blooms.
      In 1990, exceptional summer blooms of D. acuta, in terms of cell density and time of co-occurrence
with D. acuminata, developed in situ in the Galician Rías Baixas [18,33]. Later, during the autumn
transition, there were simultaneous blooms of D. acuta and G. catenatum. Three research cruises were
carried out on the Galician shelf to measure physical properties of the sea surface and water column,
nutrients and HAB species distribution before, during and after the intense autumn blooms, in addition
to the routine monitoring in shellfish production areas. The objective of these cruises was to identify
the origin of the inoculum populations of G. catenatum [34] and no information was provided about
the accompanying populations of Dinophysis. Here, unexplored results from these cruises, in addition
to monitoring data from the rías of Pontevedra and Vigo and from the northern Portuguese coast are
re-examined in the light of current knowledge with a focus on the co-occurring Dinophysis species.
Results obtained here contribute to parameterize mesoscale environmental conditions associated
with exceptional blooms of D. acuta developed that year and most important, the niche partitioning
between D. acuta and D. acuminata explaining their spatiotemporal segregation. This information is
used to refine local transport models and improve capabilities to forecast toxic events in the Galician
Rías Baixas.

2. Results

2.1. Meteorological and Hydrographic Conditions
     Summer 1990 in northwest Spain was extremely hot and dry. Positive air temperature anomalies
were +2.6 ◦ C (maximum of 36.6 ◦ C on 20 July) in July and +2.0 ◦ C in August compared with the 47-y
(1967–2013) mean. Total rainfall from June to September in 1990 (118 mm) was less than half the mean
value (263 mm) for the same period in the last 47-y (Figure 2A). In contrast, a significant positive
anomaly was observed in autumn rainfall, with more than double the monthly mean (210 mm) during
October (428 mm) (Figure 2A).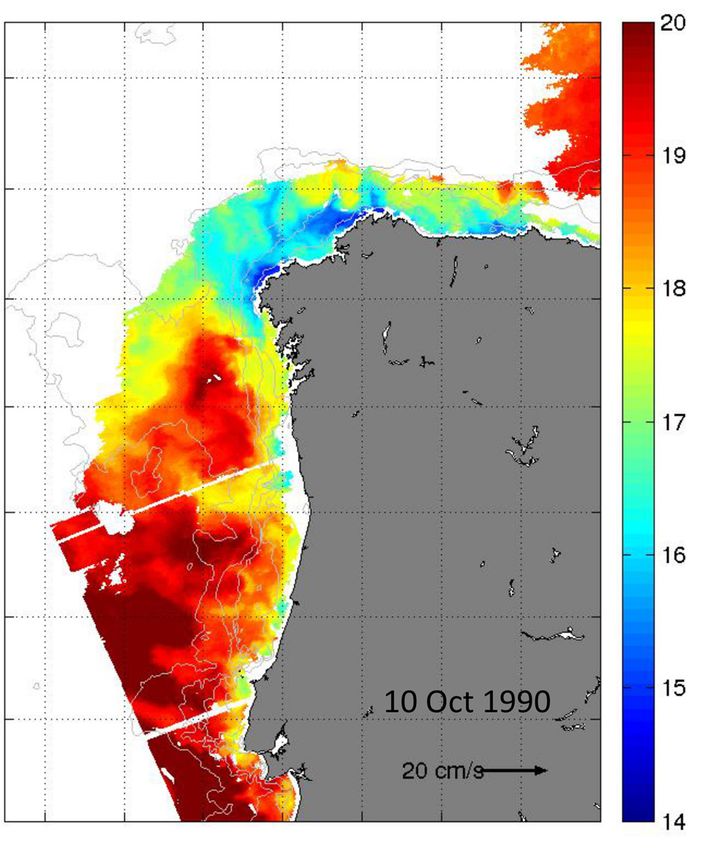
Toxins 2019, 11, 37 4 of 21
Estimates of the Cumulative Upwelling Index (CUI) showed that in 1990, the start of the upwelling
season or “spring transition”, on 21 March, was within the normal time-window observed in the
Toxins 2019, 11, x FOR PEER REVIEW 4 of 21
climatological mean (1967–2013), but the autumn transition, on 24 September, was two weeks earlier
(Figuretwo
2B).weeks
Thus,earlier
the second
(Figurecruise wasthe
2B). Thus, three days
second afterwas
cruise thethree
end days
of theafter
upwelling
the end ofseason. The Total
the upwelling
Upwelling Magnitude Index (TUMI), 81,280 m 3 s−1 km−1 , from 12 March to 30 September, was slightly
season. The Total Upwelling Magnitude Index (TUMI), 81,280 m3 s−1 km−1, from 12 March to 30
above the 47-y mean 3 − 1 − 1
September, was(69,650
slightlymabove
s the km 47-y ). At the(69,650
mean event scale
m3 s−1 (7–10
km−1).days),
At the the year
event 1990
scale wasdays),
(7–10 a “normal”
the
year, presenting
year 1990 was average patterns
a “normal” year,inpresenting
its sequence of upwelling-relaxation
average patterns in its sequencecycles during spring and
of upwelling-relaxation
cycles during
summer (Figure 2C). spring and summer (Figure 2C).
Figure Figure 2. (A) Monthly
2. (A) Monthly rainfall
rainfall (mm) (mm) in 1990
in 1990 andand the
the 30-y(1961–1990)
30-y (1961–1990) monthly
monthlymeanmeanat at
Vigo
Vigoairport.
airport.
Whiskers
Whiskers indicateindicate standard
standard deviation.
deviation. (B)(B) Cumulativeupwelling
Cumulative upwelling index
index (CUI)
(CUI)observed
observed 43°43N◦ in
at at N in
the Canary
the Canary Current Current upwelling
upwelling system
system in 1990.
in 1990. Upwellingand
Upwelling anddownwelling
downwelling transitions areare
transitions indicated.
indicated.
(C) Ekman
(C) Daily Daily Ekman transport
transport (m3 s(m s−1 km
−13 km ) estimated at
−1 )−1estimated at 43
43° N, from
◦ N, from June
June to
to October
October1990.
1990.Arrows
Arrows
indicate the initiation day of the three shelf water cruises.
indicate the initiation day of the three shelf water cruises.
From mid-June to early August the top 10 m of the water column were thermally stratified
From mid-June to early August the top 10 m of the water column were thermally stratified
(Figure 3A). Stratification and sea surface temperature (SST) (22 °C) reached record values for the
(Figure 3A). Stratification and sea surface temperature (SST) (22 ◦ C) reached record values3 for the area
area in late July [18,33]. During August, there was evidence of a strong (1700–2200 m s−1 km−1)
in late July [18,33]. During August, there was evidence of a strong (1700–2200 m 3 s−1 km−1 ) upwelling
upwelling pulse (SST 15 °C, 10 µM nitrates at 15 m) after the first week followed by intermittent
pulse (SST 15 ◦ C,of10
intrusions nitrates
µM water
colder andatincrements
15 m) after the first
of nitrate week
levels followed
alternated withbyperiods
intermittent intrusions
of rewarming and of
colder increased
water and increments
stratification ofwere
that nitrate
notlevels alternated
as marked as in Julywith periods
(Figure of rewarming
3B). These and
intermittent increased
upwelling
stratification
pulses that
werewere not by
followed as marked
significantasincreases
in July (Figure 3B). These intermittent
of chl a concentrations upwelling
with a maximum of ∼8 μg
valuepulses were
chl a L−1 at the surface on 8 August (Figure 3C). During the last third of September, nitrate levels −1
followed by significant increases of chl a concentrations with a maximum value of ~8 µg chl a L
declinedon
at the surface to almost undetectable
8 August (Figure levels, bottom the
3C). During temperatures
last thirdincreased, and progressive
of September, mixing
nitrate levels took
declined
Toxins 2019, 11, 37 5 of 21
Toxins 2019, 11, x FOR PEER REVIEW 5 of 21
to almost
place undetectable
in response levels,
to a few bottom
days temperatures
of upwelling increased,
relaxation beforeand progressive These
downwelling. mixingconditions
took placeare
in
response to a few days of upwelling relaxation before downwelling. These conditions are common
common in the area at the end of the upwelling season, which in 1990 occurred two weeks earlier
in thethe
than area at mean.
47-y the end of the upwelling season, which in 1990 occurred two weeks earlier than the
47-y mean.
Figure 3. Time series of (A) temperature (◦ C), (B) nitrate (µM), (C) chlorophyll a (µg L−1 ),
Figure
(D) 3. Time series
D. acuminata, of (A)
and (E) temperature
D. acuta (°C), (B)
cell densities nitrate
(cells L−1 );(μM), (C) chlorophyll
(F) Okadaic a (μg L(3
acid in mussels
−1), (D) D.
depths)
acuminata,glands
digestive and (E)(µg
D. acuta cell densities
g−1 HP), from June (cells L ); (F) Okadaic
−1
to December 1990 atacid in mussels (3
a monitoring depths)
station digestive
(P2) in Ría
glands
de (µg g−1 HP),
Pontevedra. from June
Isotherms aretodrawn
December 1990 at of
at intervals a monitoring
1 ◦ C. Graystation (P2) in Ría
dots indicate depthde and
Pontevedra.
time of
Isotherms are drawn
measurements. at intervals
Dinophysis of 1 were
contour plots °C. Gray
made dots
with indicate depth
cell density and time
estimates fromof measurements.
integrated (0–5 m,
Dinophysis
5–10 m, andcontour
10–15 m)plots
tubewere madeplotted
samples with cell density
at 2.5, estimates
7.5, and 12.5 m.from integrated (0–5 m, 5–10 m, and
10–15 m) tube samples plotted at 2.5, 7.5, and 12.5 m.
2.2. Seasonal Variability of Dinophysis Species and Microphytoplankton in Ría de Pontevedra
2.2. Seasonal Variability of Dinophysis Species and Microphytoplankton in Ría de Pontevedra
During June and the first half of July, moderate (102 –103 cells L−1 ) densities of D. acuminata
wereDuring
observed in the
June andwarmer
the firsttophalf0–5 m layer
of July, (Figure(10
moderate 3D). Maximal
2–10 3 cells L−1 densities
) densitieswere found
of D. on 23were
acuminata July
(8.3 3
× 10 in cell − 1
L warmer
) in thetopsame layer, followed by 3D).
almost undetectable levels after the strong
observed the 0–5 m layer (Figure Maximal densities were found on 23 upwelling
July (8.3 ×
pulse
103 cell(2200
L−1) m s−1 same
in3 the km−1 )layer,
in early August.
followed byAalmost
secondundetectable
surface maximum levels developed by mid-August
after the strong upwelling
(2.2 3
× (2200
10 cell − 1
pulse m3Ls−1 ).km A−1new decline
) in early followed,
August. very low
A second numbers
surface were detected
maximum developed in September, and cells
by mid-August (2.2
of D. acuminata were no longer detected either in the hose or in net samples
× 10 cell L ). A new decline followed, very low numbers were detected in September, and cells of D.
3 −1 in October. Dinophysis
acuta, first were
acuminata detected on 10 July,
no longer exhibited
detected eitherlow densities
in the (max.
hose or in net cell L−1in
160samples ) that month.
October. Rapid growth
Dinophysis acuta,
took place in early
first detected on 10 August, with a low
July, exhibited maximum
densitiesof 14 × 10
(max. 3
cellLL−−11)found
160cell at 10–15
that month. m on
Rapid 13 August
growth took
place in early August, with a maximum of 14 × 10 cell L found at 10–15 m on 13 August (Figure
3 −1
3E), co-occurring with the second peak of D. acuminata at the surface. The depths of D. acuta maxima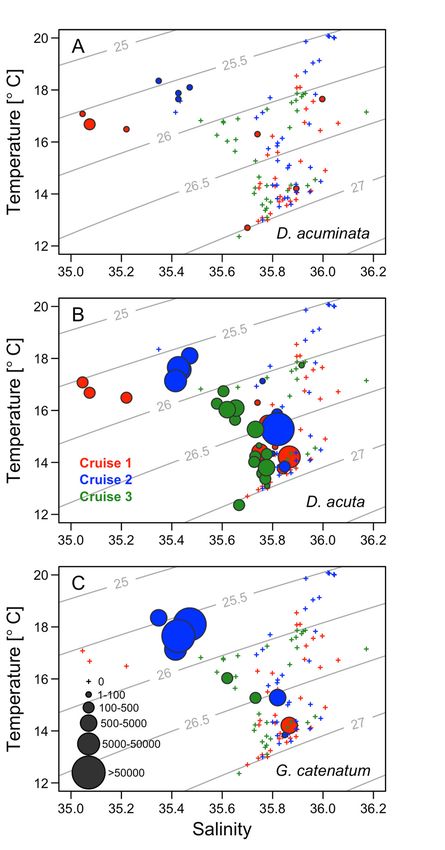
Toxins 2019, 11, 37 6 of 21
(Figure 3E),
Toxins co-occurring
2019, with the second peak of D. acuminata at the surface. The depths 6ofofD.
11, x FOR PEER REVIEW 21 acuta
maxima followed the vertical excursions of the isotherms. A second peak of 13.8 × 10³ cells L−1
followed the vertical excursions of the isotherms. A second peak of 13.8 × 10³ cells L−1 occurred at
occurred at 10–15 m on 2 October following downwelling and the species was no longer detected after
10–15 m on 2 October following downwelling and the species was no longer detected after 22
22 October (Figure 3E).
October (Figure 3E).
During June,June,
During smallsmall
centric colony-forming
centric colony-formingdiatoms (Leptocylindrus
diatoms minimus,
(Leptocylindrus Leptocylindrus
minimus, danicus,
Leptocylindrus
Guinardia
danicus,delicatula,
Guinardia Dactyliosolen
anddelicatula, and fragilissimus)
Dactyliosolen represented
fragilissimus) over 90% of the
represented microphytoplankton
over 90% of the
accompanied by nanoplanktonic
microphytoplankton accompanied flagellates. July, Pseudo-nitzschia
In early flagellates.
by nanoplanktonic In early July,seriata-group species
Pseudo-nitzschia
constituted >87%, and Tripos fusus was the most abundant dinoflagellate. In the second half of
seriata-group species constituted >87%, and Tripos fusus was the most abundant dinoflagellate. In the
July, second
duringhalf of July,stratification,
maximal during maximal redstratification,
patches of the redciliate
patches of the ciliate
Mesodinium Mesodinium
cf rubrum werecf observed
rubrum on
were observed
the surface at noon, onand
the Proboscia
surface at alata,
noon, and
and Proboscia
to a lesser alata, and Pseudo-nizschia
extent to a lesser extent spp.,
Pseudo-nizschia spp., spp.,
Leptocylindrus
Leptocylindrus spp., and T. fusus were the most abundant species in the samples. Diatoms, in
and T. fusus were the most abundant species in the samples. Diatoms, in particular P. alata, Rhizosolenia
particular P. alata, Rhizosolenia shrubsolei, L. danicus, and L. minimus, were still dominant (>95%) at the
shrubsolei, L. danicus, and L. minimus, were still dominant (>95%) at the three depth intervals all through
three depth intervals all through August. The last two diatoms were dominant in the top 10 m in
August. The last two diatoms were dominant in the top 10 m in September, while Gymnodinium
September, while Gymnodinium spp. were the most abundant in the 10–15 m layer at the end of that
spp. month.
were Thus,
the most fromabundant in the 10–15
June to September, whenm layer atwere
nutrients the high
end (Figure
of that3B),
month.
diatomsThus,
and from
small June
to September, when nutrients were high (Figure 3B), diatoms and small
flagellates predominated and Dinophysis species (D. acuminata + D. acuta) represented a small flagellates predominated
Dinophysis(1–5%)
and proportion speciesof (D. acuminata + D. acuta)
the microphytoplankton represented
community. a small changed
The situation proportion (1–5%)
abruptly on 2of the
October, followingcommunity.
microphytoplankton some days ofThe upwelling
situationrelaxation,
changedwhen a sudden
abruptly on 2 peak of G.following
October, catenatum, some
daysco-occurring
of upwelling withrelaxation,
D. acuta, became
whenthea main
suddencomponent
peak ofof G. a dinoflagellate (T. fusus, Protoperidinium
catenatum, co-occurring with D. acuta,
became the main component of a dinoflagellate (T. fusus, Protoperidinium divergens, anddiatoms.
divergens, and Prorocentrum triestinum)-dominated microplankton community with no Prorocentrum
There was a lag of approximately five days between the cell maxima of D. acuta and G. catenatum at
triestinum)-dominated microplankton community with no diatoms. There was a lag of approximately
the monitoring station in the mouth of Ría de Vigo (Figure 4). After 8 October, diatoms reoccurred
five days between the cell maxima of D. acuta and G. catenatum at the monitoring station in the mouth
and together with small flagellates were the main component of a very sparse phytoplankton
of Ría de Vigo (Figure 4). After 8 October, diatoms reoccurred and together with small flagellates were
population.
the main component of a very sparse phytoplankton population.
Figure 4. Distribution
Figure 4. Distribution D.D.acuta
of of andG.
acutaand G. catenatum cellmaxima
catenatum cell maximain in
thethe vertically
vertically integrated
integrated (0–5, 5–10,
(0–5, 5–10,
and 10–15 m) samples
and 10–15 m) samplesfrom a monitoring
from a monitoringstation at the
station at themouth
mouthofof Ría
Ría dede Vigo
Vigo (Figure
(Figure 1). 1).
2.3. Distribution of OA
2.3. Distribution with
of OA Depth
with DepthininRaft
RaftMussels
Mussels
Results from
Results the the
from monitoring
monitoring of of
okadaic
okadaicacid
acid(OA)
(OA)atatthree
threedepths
depths of
of the mussel ropesshowed
mussel ropes showed low
low levels of OA − 1
(1.4 µg g −1 HP) in mussels from 7 and 15 m in early June, and a moderate
levels of OA (1.4 µg g HP) in mussels from 7 and 15 m in early June, and a moderate progressive
progressive
increase (up to 3increase
µg g−1(up HP)to during
3 µg g−1June
HP) during June untilBetween
until mid-July. mid-July.17Between
and 3117July,
andOA31 July, OAat 2 m
levels
increased, coinciding with the surface maximum of D. acuminata, to the highest value of the of
levels at 2 m increased, coinciding with the surface maximum of D. acuminata, to the highest value season
the season
− 1 (10.8 µg g−1 HP). In August (1.9–3.0− 1 µg g−1 HP) and September (1.5–1.8 −µg 1 g−1 HP), there
(10.8 µg g HP). In August (1.9–3.0 µg g HP) and September (1.5–1.8 µg g HP), there was an
was an even distribution of the toxin with depth, with the exception of a small peak (4.4 µg g−−11 HP) at
even2distribution of the toxin with depth, with the exception of a small peak
m coinciding with the second maximum of D. acuminata before the population declined. A new
(4.4 µg g HP) at 2 m
coinciding with the second maximum of D. acuminata before the population declined.
increase with a maximum at 15 m (4.7 µg g−1 HP) was detected at the same time and depth as the A new increase
withpeak
a maximum −1 HP) was detected at the same time and depth as the peak of
of D. acuta.atFrom
15 m8 (4.7
Octoberµg gonward, OA levels gradually decreased, becoming undetectable by
D. acuta. From
the end 8 October
of the month atonward,
15 m andOA on 5levels
Novembergradually decreased,
at 2 and 7 m. becoming undetectable by the end
of the month at 15 m and on 5 November at 2 and 7 m.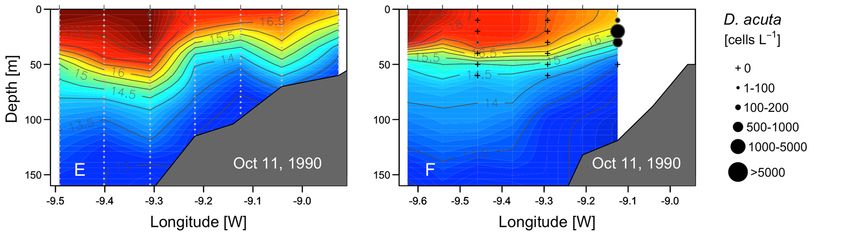
Toxins 2019, 11, x FOR PEER REVIEW 7 of 21
Toxins 2019, 11, 37 7 of 21
Assuming for Mytilus galloprovincialis an average whole flesh:digestive gland weight ratio of
11:1 [35] and for
Assuming thatMytilus
approximately 80% ofanthe
galloprovincialis toxins whole
average are accumulated
flesh:digestivein the
glanddigestive
weightgland,
ratio ofthe
maximum
11:1 levelapproximately
[35] and that of OA observed 80%inoflate July would
the toxins be equivalent
are accumulated to digestive
in the approximatelygland,1230 µg OA 100
the maximum
g−1 of
level meat,
OA i.e., 7.7-fold
observed in higher
late July than RL.equivalent to approximately 1230 µg OA 100 g−1 meat, i.e.,
the be
would
7.7-fold higher than the RL.
2.4. Hydrodynamic Conditions on Shelf Before, During, and after the Autumn DSP and PSP Events
2.4. Hydrodynamic Conditions on Shelf Before, During, and after the Autumn DSP and PSP Events
Cruise 1 (13–14 September). During the first cruise, there was offshore Ekman transport and
Cruise 1associated
upwelling (13–14 September). During
with the onset of the first cruise,
northerly windsthere was offshore
the preceding days Ekman
(Figuretransport
2). The and
cruise
upwelling
coincidedassociated with the
with an intense onset of
intrusion ofnortherly
cold water winds the preceding
in bottom layers into days
the (Figure
rías and2).withThethecruise
export
coincided
of surface with
ríaan intense
waters to intrusion
the shelf of cold water
(Figure 5A). inThebottom layerspulse
upwelling into the rías shelf–rías
in the and with the export
system was
of characterized
surface ría watersby a to the shelf
marked (Figure front
upwelling 5A). Theabout upwelling
19 nm off pulse
the in the (∼150
coast shelf–rías system with
m isobath) was a
characterized
gradient of 2.3by a°Cmarked
in 1.6 nmupwelling
(Figure front about
5 A,B). The 19 nm off the coast
phytoplankton (~150 m isobath)
community with a gradient
on the inshore side of the
of front ◦
2.3 Cwas in 1.6 nm (Figure 5 A,B). The phytoplankton community on the inshoreL. side of the and
frontby
dominated by the same diatoms than inside the rías, i.e., L. danicus, minimus,
was dominated
species by the same diatoms
of Pseudo-nizschia than inside
seriata-group the rías, of
spp. Seaward L. danicus,
i.e.,the L. minimus,
front there and bydecline
was a sharp species in
Pseudo-nizschia
of chlorophyll seriata-groupand
a fluorescence, spp.a Seaward
dominance of theof front
small there was a sharp
flagellates; valuesdecline in chlorophyll
of salinity (>35.9) and
a fluorescence,
temperature (>18 and °C)a dominance
corresponded of small flagellates;
to those typical of values of salinity
the Iberian (>35.9)Current
Poleward and temperature
(IPC) [9]. D.
(>18 ◦ C) corresponded to those typical of the Iberian Poleward Current (IPC) [9]. D. acuta cells
acuta cells were only observed at stations on the inshore side of the upwelling front. Maximum cell
were only observed
densities (9 × 10³ cellat stations
L−1) wereon the inshore
observed at the side of of
base thetheupwelling
pycnocline front.
(20 m)Maximum
on a shelf cell densities
station (50 m
3
× 10 cellclose
(9 isobaths) − 1
L ) towere
the observed
mouth ofat the
the baseRiver
Miño of the(station
pycnocline (20 m) on
9) (Figures 5B,a6A).
shelf station (50 m isobaths)
close to the mouth of the Miño River (station 9) (Figures 5B and 6A).
Figure 5. Vertical
Figure 5. Verticaldistribution
distributionof of
(A,C,E)
(A,C,E)temperature (◦ C),
temperature measured
(°C), measured with
withXBT, in in
XBT, transects diagonal
transects diagonal
to to
thethe
coast (left) and (B,D,F) temperature (CTD casts) and D. acuta cells density (bottle
coast (left) and (B,D,F) temperature (CTD casts) and D. acuta cells density (bottle samples)samples) in in
transects perpendicular
transects perpendicular to to
thethe
coast (right)
coast sampled
(right) during
sampled duringthethe
three cruises
three onon
cruises thethe
Galician shelf
Galician (see
shelf (see
Figure 1).1).
Figure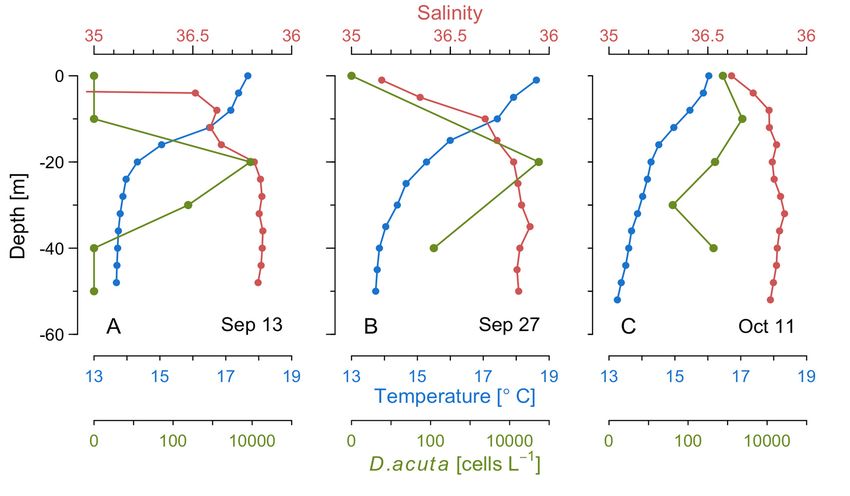
Toxins 2019, 11, 37 8 of 21
Toxins 2019, 11, x FOR PEER REVIEW 8 of 21
Figure 6. Vertical profiles of temperature (blue), salinity (red), and D. acuta cell densities (green), on the
adjacent
Figure 6.shelf during
Vertical three cruises
profiles on (A) 13–14
of temperature September,
(blue), (B) 27–28
salinity (red), and September,
D. acuta celland (C) 11–12
densities October.
(green), on
the adjacent shelf during three cruises on (A) 13–14 September, (B) 27–28 September, and (C) 11–12
Cruise
October.2 (27–28 September). Following some days of downwelling relaxation, a low pressure
system off the western Iberian peninsula caused a shift from northerly to southerly winds on
Cruise 2 (27–28
25 September (FigureSeptember).
2) resultingFollowing
in onshore some days of
transport of downwelling
the warmer (19 ◦ C), more
relaxation, a low
salinepressure
water
system off
located the western
seaward Iberian
of the front peninsula
in the previous caused
cruise,a and
shiftlowering
from northerly to southerly
of the pycnocline winds
over on 25
the whole
shelf to the outer reaches of Ría de Vigo (Figure 5C). Maximal densities of D. acuta (5.4 × 10 cells L−1 )
September (Figure 2) resulting in onshore transport of the warmer (19 °C), more saline 4
water located
seaward ofwith
associated the front
marked in the previous
vertical cruise,
gradients and
(3.3 ◦ C/20
lowering
m) wereof the pycnocline
found at the baseoverofthe
thewhole shelf to
pycnocline at
themouter
20 reaches
on a shelf of (station
station Ría de Vigo
12, 100(Figure 5C).close
m isobath) Maximal
to the densities of D. acuta
southern mouth of Ría(5.4
de Vigo 4 cells L−1)
× 10(Figure 6B).
associated
G. catenatum,with marked
below vertical
detection gradients
levels (3.3 °C/20cruise,
in the previous m) were found
reached at the baseofof6.2
a maximum 104 cells L−at1
the×pycnocline
20 10
at mmonata the
shelf station (station
monitoring station12,in100
them isobath)
mouth close
of Ría deto the southern mouth of Ría de Vigo (Figure
Vigo.
6 B). Cruise
G. catenatum,
3 (11–12 below detection
October) Renewedlevelsnortherly
in the previous
winds at cruise, reached aof
the beginning maximum
October, of 6.2an
after × 10 4 cells
intense
L at 10 m event,
−1
upwelling at the monitoring
led to positive station
Ekman in the mouth of
transport Ría de Vigo.
(maximum 3 − 1 -1
value, 2000 m s km on 7 October)
Cruise 3of(11–12
and inflow October)rich
cold nutrient Renewed
watersnortherly
into the winds
rías from at the beginning
below of October,
with surface afterof
outflow anwarmer,
intense
upwelling event, led to positive Ekman transport (maximum value, 2000
less saline water from the rías. This re-established a strong thermal stratification and coastward m 3 s−1 km-1 on 7 October)
and inflow
shoaling of cold
of the nutrient
13.5–16.5 ◦ C rich watersthat
isotherms intoreached
the ríasthefrom below
surface at with surface
the mouth ofoutflow of warmer,
Ría de Vigo (Figure less
5E).
saline
A newwater from the
upwelling frontrías. This re-established
developed, much closer a strong
to thethermal
coast than stratification and coastward
the one observed duringshoaling
the first
of the 13.5–16.5
cruise °C isotherms
(Figure 5E,F). that reached
These conditions the surface
coincided withatthe thedecline
mouthof ofG.Ría de Vigo (Figure
catenatum. Maximum 5E). values
A new
upwelling
of 2
1–5 × 10front − 1
cellsdeveloped,
L of thismuch species closer
weretodetected
the coastinthan the oneofobserved
the mouth Ría de Vigo during
andthe first cruise
adjacent shelf
(Figure 5E,F).
stations. BloomTheselevelsconditions L−1 ) of D.with
(>103 cellscoincided acutathe declineat
persisted ofall
G.stations
catenatum. Maximum
sampled, with values of 1–5at×
cell maxima
cells
10 2m, L−1 the
below of this species
warmer andwere detected
saltier surfacein the (Figure
layer mouth 6C).of Ría de Vigo and adjacent shelf stations.
Bloom levels (>103 cells L−1) of D. acuta persisted at all stations sampled, with cell maxima at 10 m,
2.5.
below Thermohaline
the warmer Conditions
and saltier Associated with Dinophysis
surface layer (Figure 6C).and G. catenatum Shelf Maxima
Cell densities of toxigenic species (D. acuminata, D. acuta, and G. catenatum) plotted over TS
diagrams duringConditions
2.5. Thermohaline Associated
the three cruises with Dinophysis
showed and G.of
that cell maxima catenatum
the three Shelf Maxima
species were located in the
mixed surface layer (< 30 m). This water layer is delimited by a seasonal
Cell densities of toxigenic species (D. acuminata, D. acuta, and G. catenatum) plottedthermocline (Figure
over TS 7).
D. acuminata was the
detected − 1
diagrams during three in low densities
cruises showed that (max.
cell120 cells Lof )the
maxima during
threethe first were
species and second
locatedcruises
in the
which
mixed showed salinities
surface layer (< 30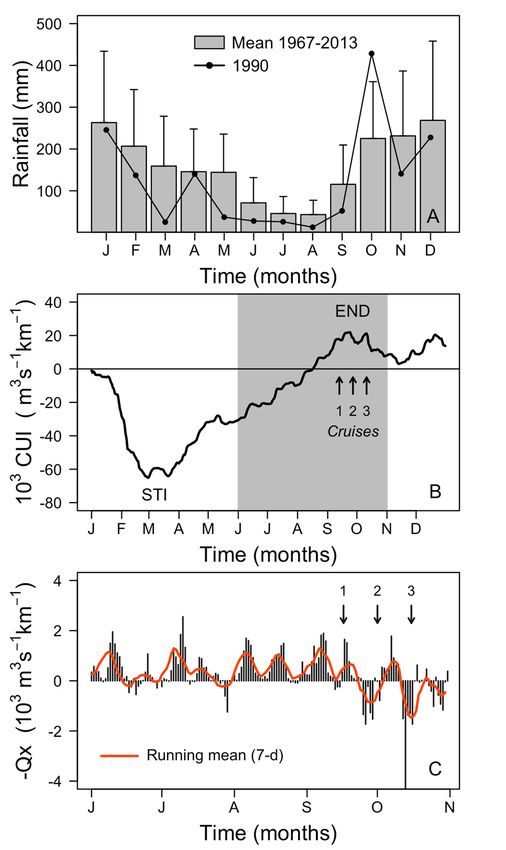
Toxins
Toxins 2019,2019,
             11, 3711, x FOR PEER REVIEW                                                                              9 of921of 21

   densities were associated with a temperature of 14 to 18 °C and salinity 35.4 (Figure 7C). This water
highest
   mass,cell densities
          although     were in
                    similar associated withto
                               temperature  a temperature of 14 to
                                              the warm offshore    18 ◦ Chad
                                                                 water,   andasalinity 35.4 (Figure 7C).
                                                                               lower salinity.
This water mass, although similar in temperature to the warm offshore water, had a lower salinity.

     Figure 7. Cell
         Figure     densities
                 7. Cell densities    L−1 ) L
                               (cells(cells     ) of D.
                                            of−1(A)  (A)acuminata,  (B) D.(B)
                                                          D. acuminata,    acuta, and (C)
                                                                              D. acuta,   G.(C)
                                                                                        and  catenatum  plottedplotted
                                                                                                 G. catenatum   over TSover
     diagrams  from   the three  shelf cruises   from   September    to October   1990. Contour  lines
         TS diagrams from the three shelf cruises from September to October 1990. Contour lines (gray) (gray) represent
     isopycnals spaced
         represent        at intervals
                    isopycnals   spaced of at
                                           0.5intervals
                                                σ.        of 0.5 σ.
     Images from the AVHRR sensors, corresponding to the day pass of the satellite over the study
         Images from the AVHRR sensors, corresponding to the day pass of the satellite over the study
area on 10 October revealed a surface poleward flow characterized by SST values >18 ◦ C (Figure 8),
    area on 10 October revealed a surface poleward flow characterized by SST values >18 °C (Figure 8),
which correspond to the signature of the Iberian Poleward Current, IPC. These agree with the surface
    which correspond to the signature of the Iberian Poleward Current, IPC. These agree with the
salinity (>35.9) and temperature (>18 ◦ C) values observed at the offshore stations (stations 1 and 2) on
    surface salinity (>35.9) and temperature (>18 °C) values observed at the offshore stations (stations 1
11 October during the third cruise.
    and 2) on 11 October during the third cruise.
2.6. Mesoscale Dynamics of D. acuta in Galician-Portuguese Coastal Waters
    2.6. Mesoscale Dynamics of D. acuta in Galician-Portuguese Coastal Waters
      Mesoscale dynamics of D. acuta cell density distribution estimated from weekly monitoring
samplingMesoscale    dynamics
          at different           of northwestern
                       sites along  D. acuta cell density   distribution
                                                   Iberian coastal       estimated
                                                                    waters,         from
                                                                            from Cape     weekly Portugal
                                                                                       Carvoeiro,  monitoring
    sampling  at different sites along  northwestern   Iberian coastal waters, from Cape  Carvoeiro,
to Cape Finisterre, Spain between July and October 1990, were compared with the distribution in       Portugal
                                                                                                        the
same area observed in 2005 (Figure 9). In July 1990, low to moderate density (102 –103 cells L−in
    to Cape Finisterre, Spain  between   July and  October  1990,  were compared   with the distribution   1 )the
    same areaofobserved
populations      D. acuta in   2005detected
                            were     (Figure throughout
                                              9). In July 1990,  low to moderate
                                                           Galician-northern       density coastal
                                                                               Portuguese   (10 –10 waters.
                                                                                                2   3 cells L−1)
    populations of D. acuta were detected throughout Galician-northern Portuguese coastal waters.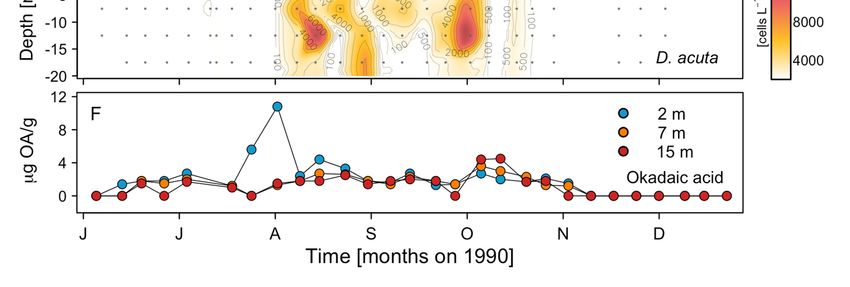
Toxins 2019, 11, x FOR PEER REVIEW                                                                          10 of 21

     Toxins 2019, 11, 37                                                                                        10 of 21
ToxinsDensities
       2019, 11, x progressively increased
                   FOR PEER REVIEW            reaching a maximum off Aveiro (2.9 × 10⁴ cells L−1) on 30     10 July
                                                                                                               of 21 and
     off Ría de Vigo (3.5 × 10⁴ cells L−1) on 13 August.
Densities   progressively
     Densities progressivelyincreased
                                increasedreaching  a maximum
                                             reaching          off off
                                                       a maximum   Aveiro  (2.9(2.9
                                                                       Aveiro    × 10  cells
                                                                                    ×4 10          −1 )30
                                                                                             L−1)Lon
                                                                                          4 cells       onJuly  and and
                                                                                                            30 July
off Ría
     off de
         RíaVigo (3.5 (3.5
             de Vigo  × 10×cells
                           4
                              10 L
                                 4  −1 ) on
                                   cells   −
                                          L 13) August.
                                             1  on 13 August.

         Figure 8. Sea Surface Temperature (SST) from AVHRR (2-km) satellite data on 10 October 1990.
         White patches represent clouds.
         Figure 8. Sea Surface Temperature (SST) from AVHRR (2-km) satellite data on 10 October 1990. White
     Figure 8. Sea Surface Temperature (SST) from AVHRR (2-km) satellite data on 10 October 1990.
         patches represent clouds.
     White patches represent clouds.

         Figure 9. Seasonal variability, from June to November, of D. acuta cell maxima at monitoring sites in
         Galicia and northern Portugal in 1990 (A) and 2005 (B). Isobaths are shown in gray. The 2005 map is
         Figure 9. Seasonal variability, from June to November, of D. acuta cell maxima at monitoring sites in
         modified from Escalera et al. [30].
         Galicia and northern Portugal in 1990 (A) and 2005 (B). Isobaths are shown in gray. The 2005 map is
         modified
     Figure
         From      fromvariability,
            9. Seasonal Escalera
                mid-August        etfrom
                             onwards,al. [30].
                                           June to November,
                                           the Galician      of D. acuta
                                                        Rías became   thecell maxima
                                                                           center     at monitoring
                                                                                  of gravity        sites inof highest
                                                                                             (the region
     Galicia and northern
    population    density) Portugal
                           of the latein 1990 (A) and
                                         summer       2005 (B).
                                                   D. acuta     Isobaths are
                                                            population       shown in from
                                                                          distributed gray. The 2005 map
                                                                                            Óbidos,      is
                                                                                                     Portugal to the
     modified  from Escalera et al. [30].
    Galician Rías. This population showed a seasonal bimodal distribution in the Galician Rías, with a
Toxins 2019, 11, 37 11 of 21
second maximum of 2 × 10⁴ cells L−1 observed in Ría de Pontevedra in early autumn (24 September)
(Figure 9A). At the same time, cell densities 1–2 orders of magnitude lower (104 cells L−1 ) summer blooms. These blooms were associated with
exceptional hydroclimatic conditions in summer, including positive anomalies of SST (over 2 ◦ C)
on the Galician shelf and in the Rías. These anomalies were a large scale phenomenon which also
affected plankton communities in the North Sea and other northeast Atlantic coastal regions [37,38].
A second “normal” bloom occurred at the end of the upwelling season co-occurring with a PSP event
of G. catenatum. Although both D. acuta events (late summer and early autumn) during 1990 reached
similar population densities (2–3 × 10⁴ cells L−1 ), they developed under distinct meteorological and
oceanographic conditions. The hydroclimatic process implicated in the onset, development, and
decline of these exceptional events is discussed here with the overall objective of “identification of key
past events which will be re-analyzed and used for training the modelling system”.
3.1. Initiation of D. acuta Summer Bloom and the Replacement of D. acuminata
HABs may be triggered by different mechanisms promoted by physical, chemical and biological
conditions optimal for bloom development [39]. In 1990, the exceptional D. acuta summer bloom
coincided with extreme climate anomalies, characterized by very hot and dry summer conditions.
These local weather conditions were accompanied by an upper-level high-pressure anomaly in late July
and early August (data not shown). Likewise, Cloern et al. [36] reported extreme climate anomalies
associated with an exceptional bloom of the red tide forming dinoflagellate Akashiwo sanguinea in San
Francisco Bay during summer 2004. Nevertheless, similar summer blooms have not been observed in
the Galician Rías since then, despite new records of high summer temperatures.
Recently, Díaz, et al. [33], based on a 29-y time series (1985–2013) analysis of monitoring data from
the Galician Rías, suggested that a long period of stable, thermally-driven stratification is necessary for
in situ development of summer populations of D. acuta. These authors suggested that exceptional in situ
development of these populations (mainly July–August) appeared related to an optimal combination
of SST (>17 ◦ C), water column stability (>6 weeks) and values of upwelling close to the historic mean.
These conditions would keep stability in the stratified top layer down to a favorable depth for D. acuta.
In summer 1990, as well as in 1989, these “optimal environmental conditions” were observed. Recent
laboratory studies have shown that Dinophysis species, including D. acuta, are obligate mixotrophs
which require live ciliate prey (e.g., Mesodinium spp.) and light for sustained growth, but they are also
able to survive for long periods of time (up to two months) without prey [40,41]. Nevertheless, predatorToxins 2019, 11, 37 12 of 21
and prey have different environmental requirements, their populations only coincide occasionally [42],
and Dinophysis populations may often be prey-limited [43]. Monitoring data reported a dominance
of Mesodinium cf rubrum within the microplankton community during the second half of July. Thus,
the exceptional summer bloom of D. acuta in 1990 may be understood as a local response to an optimal
coupling of physical (persistent thermal stratification) and biological conditions (prey availability)
promoting in situ growth on the Galician shelf.
The sequential development of D. acuminata and D. acuta populations, the former with a much
longer growth season than the second, is observed in all the geographic areas where these two HAB
species commonly occur [44]. This is the case in northwestern Iberia, where a wider continental shelf
enhances stratification and the development of dense populations of D. acuta in summer with a center
of gravity off Aveiro [28]. But in the Galician Rías, in situ growth in summer is very weak (if it is
present at all) and DSP outbreaks associated with this species are in the autumn, at the end of the
upwelling season and due to longshore transport and accumulation [30]. During the exceptional years
(1989 and 1990) described above, D. acuta exhibited a seasonal bimodal distribution characterized by
two annual peaks. The first maximum, in late summer, associated with in situ growth and the second
maximum in the autumn transition linked to physical transport [30].
A detailed understanding of the species-specific processes involved in the replacement of
D. acuminata by D. acuta in late summer during exceptional summer conditions has not so far been
achieved. A plausible explanation was given by Escalera et al. [23], who suggested that in the
Galician Rías Baixas this replacement appeared to be associated with the establishment of deeper
thermoclines. These authors described the 2003 scenario, with a high temperature (~20 ◦ C) in the
top layer (1–5 m) during a very hot summer. Dinophysis acuta was present and replaced D. acuminata,
but at very low cell densities. The year 2003 was also characterized by having extremely weak
upwelling pulses. This situation was recently reinterpreted in the light of new knowledge on Dinophysis
feeding-behavior [33]. The low intensity upwelling pulses and subsequent low nutrient levels in the
euphotic layer in 2003 would have prevented the development of high densities of Mesodinium, and its
cryptophyte prey, both part of the food chain required to promote Dinophysis growth.
3.2. Niche Partitioning and Specific Requirements of D. acuminata and D. acuta
Species can differentiate their niche in many ways, such as by consuming different foods, or using
different parts of the environment. The spatial and temporal complexity of upwelling dynamics can
create a variety of niche opportunities for phytoplankton populations, including HAB species. In these
systems, phytoplankton populations are much more dependent of turbulence (physical control) and
nutrient availability [45]. Further, the large species diversity observed indicate that the adaptations
and behavioral strategies are varied [46]. Recently, Smayda [47] suggested that different morphological
traits allow dinoflagellates exploit the complex niche structure of upwelling systems without the need
for special adaptations.
In this work we studied the population dynamics of two dinoflagellate species of Dinophysis—D.
acuminata, and D. acuta—which are both kleptoplastic mixotrophs, i.e., they perform photosynthesis
with “stolen” plastids from their prey. The two species have identical partial (23 S rDNA) sequences of
their plastid psbA gene and both are successfully cultivated in the laboratory with the phototrophic
ciliate Mesodinium rubrum [48]. Therefore, if the two species share the same prey, they would not be
able to co-occur unless they occupied different positions in the water column. Results here show that
when D. acuminata and D. acuta coincided in time (August 1990), their maxima occupied different water
masses, suggesting a “niche partitioning” with depth. This vertical segregation may be associated
with the species-specific response to environmental factors, such as light (quality and intensity)
and turbulence.
Recent laboratory experiments with the two species have shown that Dinophysis acuta is more
susceptible to photodamage, under high light intensities (370–650 µmol photons m−2 s−1 ) than
D. acuminata, but survives better with low light (10 µmol photons m−2 s−1 ) and endures longerToxins 2019, 11, 37 13 of 21
periods (28 d) in the dark [49]. D. acuta is better adapted to low light intensities and photosynthesizes
better with blue light, the only wavelength reaching the lower limit of the euphotic zone, and its
swimming capacity [46] enables it to succeed in deeper pycnoclines than D. acuminata. These features
might explain its vertical distribution in summer in the Galician Rías, close to or associated with the
pycnocline, whereas D. acuminata cell maxima aggregate nearer the surface. The vertical distribution
of OA on the raft mussel ropes, with a marked peak at 2 m, provided evidence of the aggregation
of D. acuminata near the surface in late July. From mid-August onwards, when D. acuta became the
dominant Dinophysis species in the rías, the similar levels of OA in mussels from the three depths
sampled suggests this species performed a daily vertical migration.
Morphologically, D. acuminata and D. acuta are also quite distinct. D. acuta, with a biovolume
3 times larger than D. acuminata, is much more dorsoventrally compressed than D. acuminata, which
is rounded. These differences enable D. acuminata to endure higher values of turbulence near the
surface. In contrast, D. acuta moves in layers, close to the pycnocline, with decreased rates of kinetic
energy dissipation (ε). Experimental work with cultures of the two species subject to three different
levels of turbulence confirmed that D. acuta was more sensitive to high levels of turbulence than
D. acuminata [50]. All these differences in morphology and adaptations to distinct environmental
conditions would define the realized niche of each species of Dinophysis and justify their co-occurrence
in time but at different levels in the water column, even considering their competition for the same prey.
3.3. Inoculum Source for Bloom Development
Results from northern Portugal shelf waters have shown that the highest cell densities of D. acuta
always occurred at the inner-shelf margin. [51]. The best documented example was reported by
Moita et al. [29] who described an intense bloom of D. acuta (5 × 10⁴ cells L−1 ) restricted to a subsurface
thin layer (between 18 and 20 m depth) within the pycnocline extending 30 km offshore.
The three cruises discussed here were originally planned in 1990 to investigate the origin of the
inoculum population leading to abrupt increments of G. catenatum in the Galician Rías during relaxation
at the end of the upwelling season [32]. One hypothesis was that the inoculum for G. catenatum blooms
was transported by the Iberian Poleward Current. Results here showed that the phytoplankton in
the IPC was mainly composed of small flagellates and that D. acuta and G. catenatum were always
found at shelf stations close to the coast, but not at offshore stations. Early suspicions of longshore
transport of G. catenatum came after observations on the mesoscale dynamics of blooms of this species
in 1985 and 1994. Populations of G. catenatum were detected in retention areas formed on the lee side
of upwelling plumes off Capes Roca and Carvoeiro during summer before blooming in northwestern
Iberia in the autumn [52]. These autumn blooms were very sudden, during upwelling relaxation,
and were interpreted as a result of advection from shelf populations into the Galician Rías [32]. Twenty
years later, improved knowledge on the hydrodynamics and the development of predictive transport
models in northwestern Iberia have provided a clearer picture of the mesoscale circulation at the end
of the upwelling season and the identification of a poleward inner coastal current [17,53]. This inner
poleward current has been associated with the northward transport of D. acuminata and G. catenatum
populations [11], a view supported by observations from Escalera et al. [30] during the intense 2005
bloom of D. acuta in the Galician Rías. Estimates of in situ division rates of D. acuta throughout its
seasonal occurrence that year showed that during the autumn bloom, cells were not dividing at all, so
the rapid increase in net growth had to be the result of transport rather than in situ growth. Running
of a local hydrodynamic model with data from the autumns of 2005 and 2013 confirmed a northwards
advection in an inner shelf current as a plausible mechanism of northwards transport of D. acuta from
Portugal to Galicia [53]. Surveys in the Celtic Sea, southwestern Ireland, provided evidence of the
direct transport of a high-density patch of D. acuta, forming a subsurface thin layer within a coastal
jet along the south coast of Ireland; the 5-m thick thin layer was centered at 20 m depth and did not
coincide with the deeper (30 m) chlorophyll maximum [54]. The main unresolved issue with Dinophysis
blooms and their contamination of shellfish with DSP toxins in Ireland was the identification of theirToxins 2019, 11, 37 14 of 21
source. Recent surveys have given evidence for extensive D. acuta bloom development in summer
in the productive region close to the Celtic Sea Front, a tidal front extending from southeast Ireland
to Britain [55]. Therefore, the source population of D. acuta would be about 300 km away from the
aquaculture sites in Bantry Bay where their impact is maximal, i.e., a similar distance than that from
the Aveiro “center of gravity” of D. acuta distribution in northwestern Iberia to the intensive mussel
aquaculture sites in the Galician Rías Baixas. Likewise, the formation of a tidal front in the warm season
has been pointed to as an essential requirement for the development of D. acuta blooms in the Firth
of Clyde in western Scotland [56]. In the case of the Iberian blooms, the upwelling front at the time
the cruises took place established the borders between oceanic water populations dominated by small
flagellates, and those in the nutrient-rich shelf waters dominated by microplanktonic dinoflagellates
and diatoms. The toxic dinoflagellate populations of concern were distributed on the inner shelf
waters, far from the front. A much earlier cruise would have been needed, before bloom initiation,
to explore the origin of the inoculum. Nevertheless, results on the distribution of scattered cells of
D. acuta during the Morena cruise in May 1993 confirmed the prebloom distribution of the “pelagic
seed banks”, sensu Smayda [57] of this species were restricted to the northern half of the Portuguese
shelf [58].
3.4. OA Distribution with Depth in Raft Mussels. Implications for Shellfish Exploitation
The sequence of D. acuminata (June-early August) and D. acuta (August–October) events observed
in the Galician Rías in 1990 caused mussel harvesting bans from 9 July to 17 November, with significant
economic losses [59]. Based on the vertical distribution of OA and Dinophysis species presented here
(Figure 4E), it was concluded that D. acuminata blooms were associated with mussel toxicity from June
to early August, and those of D. acuta with the late summer to autumn toxicity. It was also suggested
that the smaller-sized D. acuminata had a stronger toxic potential than the larger D. acuta. We draw
special attention to the fact that only OA was measured in the HPLC analyses performed in the 1990s,
and that according to the analyses of picked cells from the region [60], it was assumed that OA was
the only toxin present in D. acuta strains from Galicia. Dinophysistoxin 2 (DTX2) was not described
until 1992 [61] and the widespread presence of PTX2 in Galician shellfish during blooms of D. acuta,
D. caudata, and D. tripos, until 2002 [62]. Dinophysis acuta has a complex toxin profile including OA,
DTX2, and PTX2 in addition to small amounts of OA diol-esters and PTX11. It is also known that
different years may bring strains with different toxin profiles [63]. In any case, it is certain that the
toxin content in mussels exposed to the D. acuta bloom in the Galician Rías Baixas in 1990 was much
higher than the estimates given at the time.
A remarkable difference was observed in the vertical distribution of OA during the cell maxima of
D. acuminata and D. acuta. The overwhelmingly higher values of toxin content in surface (2 m) mussels
in late July and the second peak in early August suggest that D. acuminata kept aggregated in the top
water layer. This suggestion agrees with observations in recent years on the vertical distribution of
this species during cell cycle studies and a couple of 2-week spring cruises in the Galician Rías and
adjacent shelf [42,64]. In contrast, the even vertical distribution of toxin content when the bloom was
dominated by D. acuta (from mid-August to November), suggests a daily vertical migration of the
species within the depth range of the mussel ropes (2–12 m).
Recently, Díaz et al. [33] proposed a conceptual model based on a 29-year (1985–2013) time series
of weekly observations, to explain the seasonal variability of D. acuminata and D. acuta in the Galician
Rías Baixas. According to this model, years with exceptional summer blooms of D. acuta (such as 1989
and 1990), or even worse, with very intense autumn blooms, following spring-summer blooms of
D. acuminata, have more severe socioeconomic impacts. This is explained by the extended duration
of the Dinophysis bloom season, which causes a longer period of harvesting bans. The latter scenario
is worsened when the autumn blooms of D. acuta end very late in the year, when phytoplankton is
scarce and mussels take much longer time to eliminate the toxins. That was the case in 2005, when
lipophilic toxins accumulated until mid-November did not clear until March 2006 [30]. In addition,You can also read