RedquorinXS Mutants with Enhanced Calcium Sensitivity and Bioluminescence Output Efficiently Report Cellular and Neuronal Network Activities - MDPI
←
→
Page content transcription
If your browser does not render page correctly, please read the page content below
International Journal of
            Molecular Sciences

Article
RedquorinXS Mutants with Enhanced Calcium
Sensitivity and Bioluminescence Output Efficiently
Report Cellular and Neuronal Network Activities
Adil Bakayan 1,2, *, Sandrine Picaud 1,3, *,† , Natalia P. Malikova 4,† , Ludovic Tricoire 3 ,
Bertrand Lambolez 3 , Eugene S. Vysotski 4 and Nadine Peyriéras 2, *
 1    Institut de Neurobiologie Alfred Fessard, UPR 3294, Centre National de la Recherche Scientifique (CNRS),
      Avenue de la Terrasse, 91198 Gif-sur-Yvette, France
 2    BioEmergences Unit, CNRS USR 3695, Université Paris-Saclay, Avenue de la Terrasse,
      91198 Gif-sur-Yvette, France
 3    Neuroscience Paris Seine—Institut de Biologie Paris Seine (NPS—IBPS), CNRS UMR8246, INSERM U1130,
      Sorbonne Université UM119, 75005 Paris, France; ludovic.tricoire@upmc.fr (L.T.);
      bertrand.lambolez@upmc.fr (B.L.)
 4    Photobiology Laboratory, Institute of Biophysics SB RAS, Federal Research Center “Krasnoyarsk Science
      Center SB RAS”, 660036 Krasnoyarsk, Russia; npmal@yandex.ru (N.P.M.); eugene_vysotski@ibp.ru (E.S.V.)
 *    Correspondence: adil.bakayan@cnrs.fr (A.B.); sandrine.picaud@upmc.fr (S.P.); nadine.peyrieras@cnrs.fr (N.P.);
      Tel.: +33-(0)4-93-95-43-07 (A.B.); +33-(0)1-44-27-38-72 (S.P.); +33-(0)1-69-82-41-42 (N.P)
 †    These authors contributed equally to this work.

 Received: 8 October 2020; Accepted: 19 October 2020; Published: 22 October 2020

 Abstract: Considerable efforts have been focused on shifting the wavelength of aequorin Ca2+ -dependent
 blue bioluminescence through fusion with fluorescent proteins. This approach has notably yielded
 the widely used GFP-aequorin (GA) Ca2+ sensor emitting green light, and tdTomato-aequorin
 (Redquorin), whose bioluminescence is completely shifted to red, but whose Ca2+ sensitivity is low.
 In the present study, the screening of aequorin mutants generated at twenty-four amino acid positions
 in and around EF-hand Ca2+ -binding domains resulted in the isolation of six aequorin single or
 double mutants (AequorinXS) in EF2, EF3, and C-terminal tail, which exhibited markedly higher
 Ca2+ sensitivity than wild-type aequorin in vitro. The corresponding Redquorin mutants all showed
 higher Ca2+ sensitivity than wild-type Redquorin, and four of them (RedquorinXS) matched the
 Ca2+ sensitivity of GA in vitro. RedquorinXS mutants exhibited unaltered thermostability and peak
 emission wavelengths. Upon stable expression in mammalian cell line, all RedquorinXS mutants
 reported the activation of the P2Y2 receptor by ATP with higher sensitivity and assay robustness than
 wt-Redquorin, and one, RedquorinXS-Q159T, outperformed GA. Finally, wide-field bioluminescence
 imaging in mouse neocortical slices showed that RedquorinXS-Q159T and GA similarly reported
 neuronal network activities elicited by the removal of extracellular Mg2+ . Our results indicate that
 RedquorinXS-Q159T is a red light-emitting Ca2+ sensor suitable for the monitoring of intracellular
 signaling in a variety of applications in cells and tissues, and is a promising candidate for the
 transcranial monitoring of brain activities in living mice.

 Keywords: bioluminescence; aequorin; calcium sensor; BRET; mutagenesis; GPCR assay; neuronal
 network imaging

1. Introduction
    Intracellular Ca2+ is a critical signal in many important physiological processes and pathophysiological
conditions across living species, and measurements of intracellular Ca2+ concentration are widely used

Int. J. Mol. Sci. 2020, 21, 7846; doi:10.3390/ijms21217846                              www.mdpi.com/journal/ijms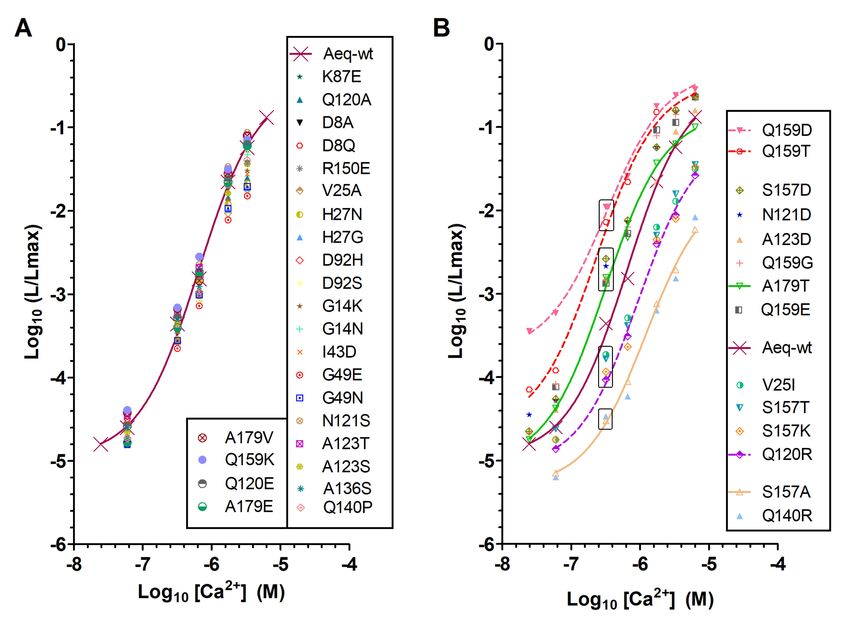
Int. J. Mol. Sci. 2020, 21, 7846                                                                      2 of 20

in virtually all domains of biology [1]. Ca2+ -dependent photoproteins are a family of bioluminescent
molecules that emit blue light upon Ca2+ binding and share high structural and functional homology [2,3].
These photoproteins contain three EF-hand Ca2+ binding sites and form a stable complex from
the reaction of the apo-photoprotein (luciferase) with coelenterazine (CLZ, the luciferin; [2,3]).
Light emission proceeds with a rate that increases with Ca2+ concentrations in the 0.1 µM to 1 mM
range [4–7]. Ca2+ -dependent photoproteins exhibit rapid Ca2+ binding/unbinding kinetics, low light
output in the absence of Ca2+ , and broad dynamic range [6,8,9]. Aequorin is the photoprotein of choice in
Ca2+ sensing applications, owing to the wealth of information on its structure, function, and its selectivity
for Ca2+ [3,10–13]. However, as for other Ca2+ -dependent photoproteins, the bioluminescence from
wild-type (wt) aequorin is emitted at a slow rate at low Ca2+ concentrations, the light emission intensity
below 1 µM Ca2+ being less than one-thousandth of that obtained in 1 mM Ca2+ [6,9,14]. This low
bioluminescence output significantly limits the spatiotemporal precision of aequorin as a reporter of
intracellular Ca2+ signals, which are in the 0.1–0.5 µM range in most mammalian cell types.
     Several approaches help in circumventing this low Ca2+ sensitivity. The incorporation of various
CLZ analogs is a convenient way to alter Ca2+ sensitivity, decay kinetics, and the emission spectrum
of aequorin [15–19]. Although CLZ analogs often suffer from low water solubility or cell membrane
permeability, aequorin reconstituted with the CLZ-f analog has been used in high sensitivity Ca2+
measurements in cellulo or in vivo [20]. Alternatively, the use of apo-aequorin mutagenesis should,
in principle, allow for altering aequorin Ca2+ sensitivity for applications where the CLZ analog choice is
detrimental. However, while aequorin mutants with decreased Ca2+ sensitivity have been successfully
applied to the study of cellular organelles containing high Ca2+ concentrations [21,22], only one
aequorin mutant showing enhanced light output at low Ca2+ concentrations has been described to
date [7,23]. Finally, the fusion of the green fluorescent protein (GFP) with aequorin (GA), which naturally
interact in the jellyfish Aequorea victoria [2], results in over twenty fold enhancement of GA sensitivity
to submicromolar Ca2+ concentrations, as compared to aequorin alone [24]. Likewise, GA is a dual
fluorescent label and Ca2+ sensor emitting green light through Förster resonance energy transfer (FRET),
which enables the imaging of Ca2+ signals in single cells, tissue slices, and whole animals [23–30].
     Aequorin fusion with GFP yellow mutants, or with red fluorescent proteins, further shifts light
emission to the red, thereby enhancing light output through biological tissues [19,31–33]. The tdTomato-
aequorin fusion named Redquorin [33] is spectrally optimal for deep tissue in vivo imaging due to its
large and almost complete red shift (peak at 582 nm). However, its low sensitivity to submicromolar
Ca2+ concentrations limits its usefulness as a sensor of intracellular Ca2+ signals. In the present
work, we aimed at enhancing Redquorin Ca2+ sensitivity through apo-aequorin mutagenesis. We first
screened apo-aequorin molecules mutated at selected amino acid positions for their sensitivity to
Ca2+ . Apo-aequorin mutants showing extra sensitivity to Ca2+ (AequorinXS) were then used to
generate six Redquorin mutants that were characterized in vitro and in cellulo. Four of these mutants,
named RedquorinXS, were stably expressed in CHO cell lines and tested for their sensitivity to
physiological Ca2+ signals. Finally, a RedquorinXS Ca2+ sensor was expressed in a mouse brain slices
through viral transfer and validated for the imaging of neuronal network activities.

2. Result

2.1. Identification of New Mutations That Enhance Aequorin Ca2+ Sensitivity
     A total of twenty-four amino acid positions that belong to EF-hand domains and their surroundings
in the 3D structure of apo-aequorin [10–12] were selected for mutagenesis (Figure 1). Seven of these
amino acids belong to the EF-hand consensus sequences of apo-aequorin, including four Ca2+ binding
residues. The mutagenesis consisted of random and non-conservative amino acid conversions at
single amino acid positions. The resulting mutants were screened for Ca2+ affinity change in vitro.
Apo-aequorin mutants were transiently expressed in HEK cells, purified, and reconstituted with CLZ-f.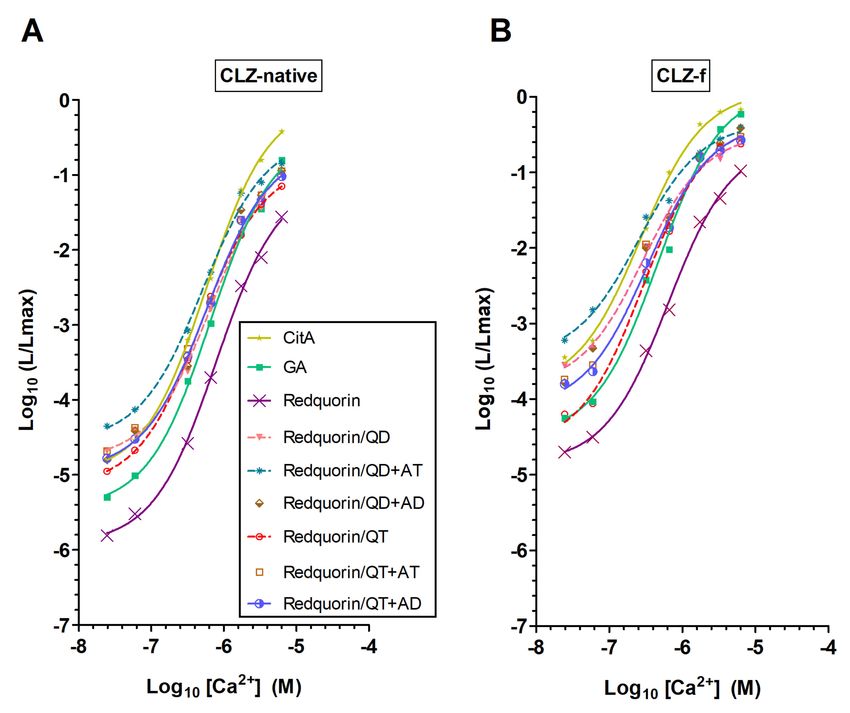
Int. J. Mol. Sci. 2020, 21, 7846                                                                            3 of 20

A first screening revealed six mutations (Y38S; A69M; E84K; I107E; C180S; and G185N) that yielded
very low or non-detectable luminescence at pCa 6 and were not further considered.

      Figure 1. Apoaequorin amino acid sequence highlighting the mutated sites screened for enhanced Ca2+
      sensitivity. The apo-aequorin sequence from Aequorea victoria (PDB code: 1EJ3) is 198 amino acids long.
      Random, non-conservative substitution was performed on boxed amino acids in order to alter aequorin
      Ca2+ affinity. Amino acids involved in coelenterazine (Clz) and Ca2+ (Ca) binding are indicated.

      The analysis of Ca2+ titration curves of aequorin mutants resulted in the identification of five
groups with different performances. A large group of aequorin mutants whose sensitivity to Ca2+ was
not significantly altered (Figure 2A and Supplementary Table S1), and four groups with significant
changes in Ca2+ sensitivity (Figure 2B, Table 1 and Supplementary Table S1) compared to wt-aequorin
(wt-aeq). Two of these groups (AequorinXS mutants) contained mutations that resulted in medium-high
to high sensitivity to Ca2+ (e.g., A123D; A179T; Q159D; and Q159T). Interestingly, different amino acid
substitutions at the same positions resulted in different, sometimes opposite changes in Ca2+ sensitivity
(e.g., Q159K vs. Q159D, S157D vs. S157A, A179T vs. A179E, Figure 2B), thereby highlighting the
importance of these specific amino acid residues in aequorin bioluminescence.

      Figure 2. Ca2+ sensitivity of aequorin mutants. The relationship between Ca2+ concentration ([Ca2+ ])
      and fractional bioluminescence intensity (L/Lmax) is displayed in Log values on a linear scale. L and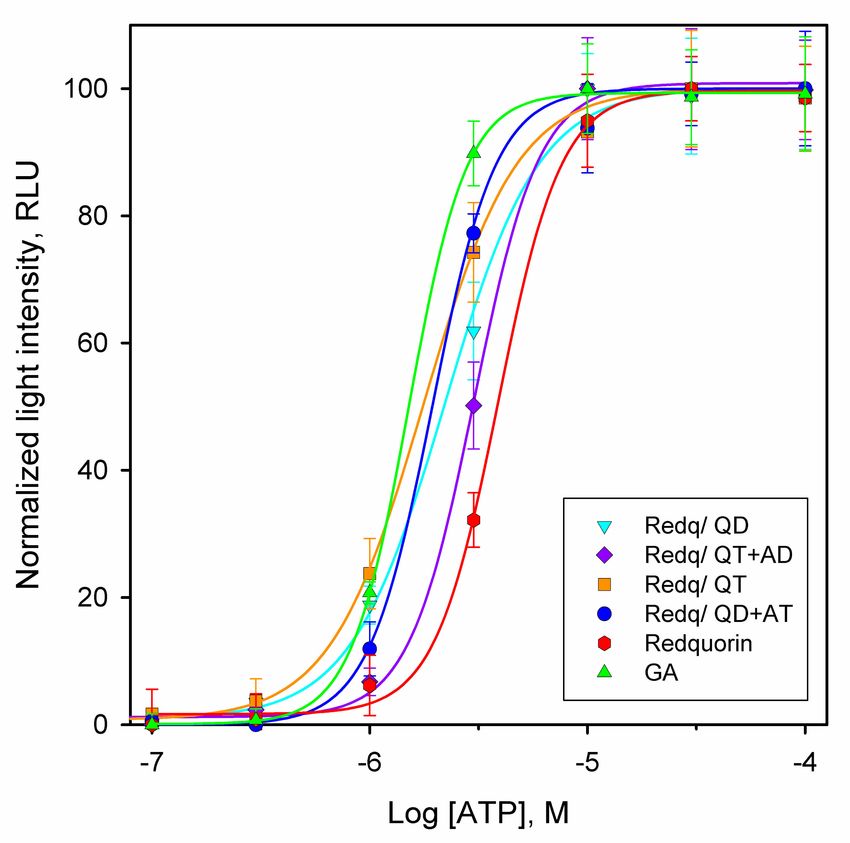
Int. J. Mol. Sci. 2020, 21, 7846                                                                                               4 of 20

      Lmax stand for the peak luminescence intensity at a given [Ca2+ ] and the total luminescence intensity
      at saturating [Ca2+ ] for the same sample, respectively. Aequorin and its mutants were reconstituted
      with CLZ-f. For wt-aequorin (Aeq-wt), a sigmoidal curve fit is traced for comparison. R square of the
      fit goodness was higher than 0.994. (A) Amino acid mutations that resulted in no significant change in
      affinity, n was at least 2. (B) Amino acid mutations that increased or decreased Ca2+ sensitivity, n was
      at least 3. At pCa 6.5, and relative to wt-aequorin, four mutant groups (boxed) have been identified
      with low (e.g., Q140R), medium-low (e.g., S157T), medium-high (e.g., A123D) or high (e.g., Q159D)
      sensitivity to Ca2+ .

                         Table 1. Properties of aequorin mutants with increased Ca2+ sensitivity.

                                                 Ca2+         Relative Intensity a         Decay Kinetics,    Emission Peak
                                   Mutation   Sensitivity,                                   t1/2 (ms) b     Wavelength (nm)
                                              EC50 (nM) a    at pCa 6.5       at pCa 7.2
                                   Aeq-wt      659 ± 23          1                1           906 ± 53             476
                                    Q159D       330 ± 8         25.1             23.4         794 ± 42             478
                                    Q159T       310 ± 13        16.6             4.8          866 ± 23             477
           Single mutants           S157D       322 ± 20        6.0              2.2          835 ± 47             475
          with medium-high
             to high Ca2+           N121D       400 ± 14        4.9              2.1          957 ± 30             477
              sensitivity           A123D       374 ± 9         3.6              1.6          862 ± 48             476
                                    Q159G       492 ± 10        3.3              3.2          830 ± 37             478
                                    A179T       330 ± 19        3.0              1.3          779 ± 33             477
                                   QD+AT        216 ± 26        58.5             60.8         750 ± 50             478
                                   QD+ND        295 ± 17        29.0             41.7         738 ± 28             477
            Double mutants
                                   QD+AD        271 ± 15        26.2             15.0         612 ± 26             475
              with high
            Ca2+ sensitivity       QT+AT        281 ± 25        29.0             14.0         650 ± 68             478
                                   QT+ND        337 ± 10        14.4             12.2         680 ± 55             478
                                   QT+AD        279 ± 16        22.8             10.0         620 ± 33             476
      Aequorin and its mutants were reconstituted with CLZ-f.          Ca2+
                                                                          sensitivity (represented in EC50) was calculated
      from sigmoidal curve fit; n was at least 3. Values are displayed as mean ± SD. Values for Aeq-wt are in bold as a
      reference. Luminescence relative intensity (compared to Aeq-wt) was deduced from data points of L/Lmax for two
      Ca2+ concentrations, pCa 6.5 and pCa 7.2. a, the R square of the goodness of the curve fit was higher than 0.994.
      The decay kinetics was assayed by fast-flow injection of a saturating Ca2+ solution and recording of the luminescence
      signal decay at a sampling interval of 30ms. Mean values ± SD were calculated from a monoexponential decay
      curve fit. b, the R square of the goodness of the decay curve fit was higher than 0,999. Aequorin double mutants:
      QD+AT (Q159D+A179T); QD+ND (Q159D+N121D); QD+AD (Q159D+A123D); QT+AT (Q159T+A179T); QT+ND
      (Q159T+N121D); QT+AD (Q159T+A123D).

      EC50 values derived from the fit of Ca2+ titration curves (Table 1, upper part) showed that,
in comparison with wt-aequorin (659 nM), mutations Q159T (310 nM) and Q159D (330 nM) largely
increased Ca2+ sensitivity, as well as S157D (322 nM), A179T (330 nM), and A123D (374 nM).
The examination of light emission intensities of these mutants at pCa 6.5 and pCa 7.2 (relative
intensity, Table 1, upper part) confirmed their enhanced Ca2+ sensitivity relative to wt-aequorin.
Mutants Q159D and Q159T exhibited the highest luminescence output at pCa 6.5, their light emission
intensities being 25 and 16 time higher than wt-aequorin, respectively. Moreover, the Q159D mutant
showed a drastically higher (23-fold) luminescence output than wt-aequorin at the minute Ca2+ dose
of pCa 7.2, suggestive of its potential usefulness at detecting low Ca2+ concentrations.
      A previous study has reported that mutations of the first EF-hand domain can increase aequorin
   2+
Ca sensitivity [7]. However, these latter mutants exhibit slower light emission rate than wt-aequorin,
which translates into slower decay kinetics of light emission in the continuous presence of Ca2+ [7].
Because slow rate/slow decay of light emission can hamper the use of aequorin mutants for monitoring
fast intracellular Ca2+ dynamics, we compared the bioluminescence half decay time (t1/2 ) of aequorin
mutants identified herein with that of wt-aequorin, in saturating Ca2+ concentration. The t1/2 values of
AequorinXS mutants (Table 1, upper part) were in the range of wt-aequorin t1/2 (906 ms), with Q159D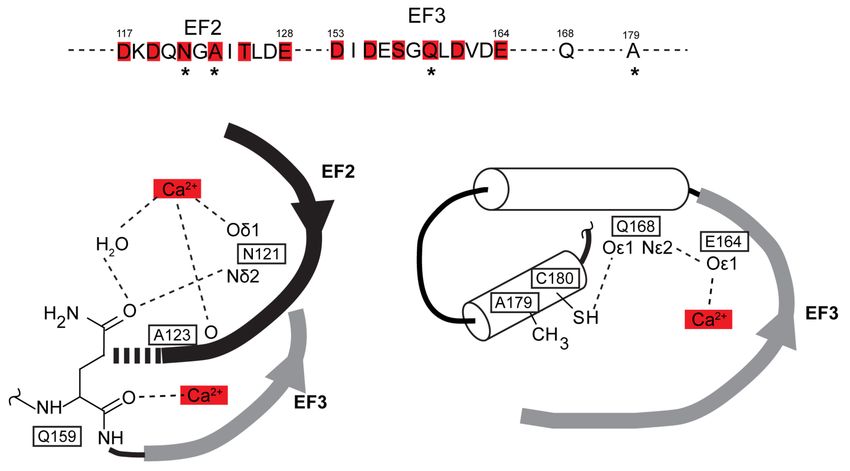
Int. J. Mol. Sci. 2020, 21, 7846                                                                           5 of 20

and A179T mutants showing significantly faster decay kinetics (t1/2 : 794 and 779 ms, respectively)
than wt-aequorin.
     Because amino acid mutations can shift the wavelength of aequorin luminescence [34],
we established the light emission spectra of the AequorinXS mutants. None of these mutants exhibited
significant change of luminescence spectrum peak relative to wt-aequorin (Table 1, upper part).
This suggests that the present apo-aequorin mutations enhanced the Ca2+ sensitivity of aequorin
without notably affecting the apo-aequorin-coelenterazine reaction per se.
     We next reasoned that combining some of the above single mutations may further enhance the
Ca2+ sensitivity and light emission rate of aequorin. Indeed, Ca2+ titration analyses of aequorin
double mutants (associating Q159D or Q159T with N121D, A123D, and A179T) revealed that all these
combinations resulted in further enhanced Ca2+ sensitivity and light emission rate (Table 1 lower part,
and Figure 3). Among double mutants, the Q159D+A179T and Q159T+A123D mutants exhibited the
highest Ca2+ sensitivity (QD+AT and QT+AD, EC50: 216 nM and 279 nM, respectively). Moreover,
the QD+AT and QT+AD mutants additionally showed the fastest light emission rate (t1/2 : 612 ms and
620 ms, respectively). The Q159D, Q159T, QD+AT, QD+AD, QT+AT, and QT+AD aequorin mutants,
termed Aequorin XS, were thus selected as the most promising candidates for enhancing the Ca2+
sensitivity of aequorin-based Ca2+ sensors.

      Figure 3. Ca2+ sensitivity of aequorin double mutants. The relationship between Ca2+ concentration
      ([Ca2+ ]) and fractional bioluminescence intensity (L/Lmax) is displayed in Log values on a linear
      scale. Aequorin reconstitution was with CLZ-f. The graph shows Ca2+ sensitivity of aequorin double
      mutants combining single mutations that resulted in Ca2+ extra-sensitivity (AequorinXS), n was at
      least 4. For wt-aequorin, a sigmoidal curve fit is traced for comparison. R square of the fit goodness
      was higher than 0.994. The following abbreviations are used for clarity: QD+AT (Q159D+A179T),
      QD+ND (Q159D+N121D), QD+AD (Q159D+A123D), QT+AT (Q159T+A179T), QT+ND (Q159T+
      N121D), QT+AD (Q159T+ A123D).

2.2. Generating Redquorin Mutants with Ca2+ Sensitivity and Light Emission Rate That Match Those of GA
     The fusion of aequorin with GFP (GA) shifts the light emission to green and enhances Ca2+
sensitivity [24], whereas its fusion with tdTomato (Redquorin) emits red light, thus allowing deep
tissue imaging, but does not enhance Ca2+ sensitivity [32,33]. In order to improve Redquorin as a
reporter of intracellular Ca2+ signals, we incorporated the above Q159D, Q159T, QD+AT, QD+AD,
QT+AT, and QT+AD mutations into its apo-aequorin moiety, and compared the resulting mutants
with Redquorin and GA, and with the fusion of wt-aequorin with the citrine yellow variant of GFP
(CitA, [33]). Aequorin moieties of fusion proteins were reconstituted with native CLZ or CLZ-f and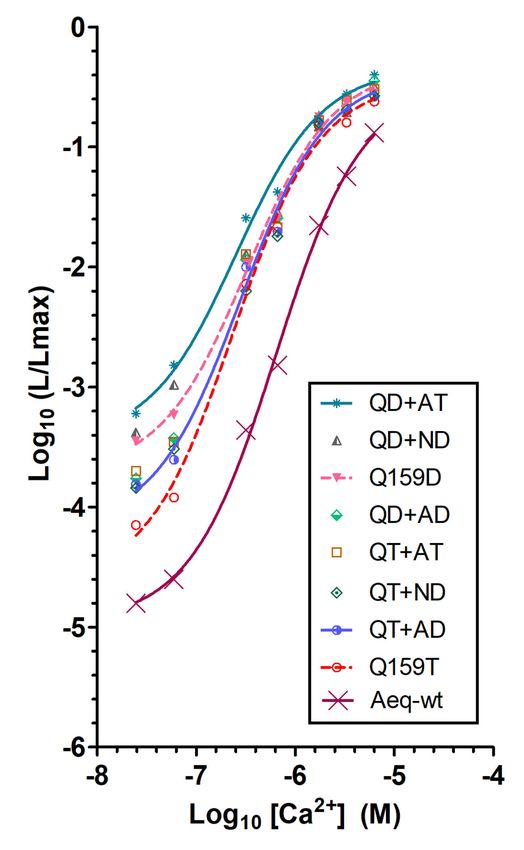
Int. J. Mol. Sci. 2020, 21, 7846                                                                                               6 of 20

their Ca2+ sensitivities, light emission rates, and emission peak wavelengths were determined (Figure 4
and Table 2).

      Figure 4. Ca2+ sensitivity of Redquorin and its mutants relative to GFP-aequorin (GA) and CitA.
      The relationship between Ca2+ concentration ([Ca2+ ]) and fractional bioluminescence intensity (L/Lmax)
      is displayed in Log values on a linear scale (n was at least 4). Aequorin moieties of the fusion proteins
      were reconstituted with native CLZ (A) or CLZ-f (B). For Redquorin (Rdq), a sigmoidal curve fit is
      traced for comparison. R square of the fit goodness was higher than 0.994.

                       Table 2. Properties of Redquorin and its mutants relative to GA and CitA.

                                                  Ca2+           Relative Intensity a      Decay Kinetics,     Emission Peak
                                   Mutation    Sensitivity,                                  t1/2 (ms) b      Wavelength (nm)
                                               EC50 (nM) a      at pCa 6,5   at pCa 7,2
                                    Redq        859 ± 45           1.0           1.0          1 203 ± 70              582
                               Redq/Q159D        680 ± 33          9.1          13.2           980 ± 66               582
                              Redq/QD+AT         515 ± 20          32.1         24.5           913 ± 39               582
                              Redq/QD+AD         621 ± 44          10.8         12.8          1 120 ± 46              582
         CLZ-native            Redq/Q159T        478 ± 39          13.0          7.1          1 103 ± 50              582
                              Redq/QT+AT         605 ± 16          18.3         14.1           990 ± 87               582
                              Redq/QT+AD         577 ± 33          14.4         10.0           950 ± 56               582
                                    CitA         573 ± 45          24            9.5           794 ± 46               529
                                     GA          630 ± 29          6.8           3.2           852 ± 64               509
                                    Redq         600 ± 35          1.0           1.0           880 ± 68               582
                               Redq/Q159D        290 ± 18          23.9         14.9           770 ± 88               582
                              Redq/QD+AT         252 ± 40          58.5         48.3           740 ± 55               582
                              Redq/QD+AD         300 ± 26          22.8         15.0           750 ± 66               582

            CLZ-f              Redq/Q159T        296 ± 13          11.0          2.8           705 ± 36               582
                              Redq/QT+AT         284 ± 30          25.6          9.0           810 ± 61               582
                              Redq/QT+AD         336 ± 11          14.4          7.4           670 ± 50               582
                                    CitA         266 ± 18          41.1         18.7           680 ± 72               529
                                     GA          463 ± 46          8.6           2.9           700 ± 48               509
      Aequorin moieties of Redq, Redq mutants2 , GA, and CitA were reconstituted either with CLZ-native (top section
      of the table) or CLZ-f (bottom section of the table). For more details on Ca2+ sensitivity (represented in EC50),
      luminescence relative intensity and decay kinetics, refer to Table 1. Values for Redq are in bold as a reference. a, the R
      square of the goodness of the curve fit was higher than 0.995. n was at least 3. b, the R square of the goodness of the
      decay curve fit was higher than 0.999. n was at least 3.
Int. J. Mol. Sci. 2020, 21, 7846 7 of 20
The Ca2+ sensitivity of CitA, which has not been previously characterized in detail, was compared
with those of Redquorin and GA (Figure 4 and Table 2). Their overall Ca2+ sensitivities followed the
order Redquorin < GA < CitA, as indicated by their EC50 values (CitAInt. J. Mol. Sci. 2020, 21, 7846 8 of 20
CHO cells showed a prominent, dose-dependent bioluminescent response, specific for each of these
Ca2+ sensors (Figure 6). A detailed analysis of the ATP response curve is presented in Table 3.
Figure 5. Thermostability of aequorin mutants, GA, CitA, redquorin (Redq) and Redq mutants.
Photoproteins were purified and reconstituted with CLZ-f. The samples were incubated at room
temperature (20–24 ◦ C) for 15 min before measuring total luminescence on a first aliquot using saturating
Ca2+ solution. Samples were then incubated at indicated temperatures for 30 min before measuring
total luminescence on a second aliquot. The relative bioluminescence activity at each temperature was
calculated by the ratio 2nd counts (at target T ◦ C)/1st counts (at initial room T ◦ C) multiplied by 100.
Bars represent mean ± SD, with n between 3 and 5.
Figure 6. Dose–response curves for activation of endogenous P2Y2 receptor with ATP in CHO cells
stably expressing the indicated Ca2+ sensor variants. The light intensity was measured by integration
of the bioluminescence signal for 60 s. Each point is the mean ± SD of eight experiments.Int. J. Mol. Sci. 2020, 21, 7846 9 of 20
Table 3. Performance of Redquorin mutants in cellular assay for P2Y2 receptor activation.
Ca2+ Sensor Variant [ATP] CL (nM) EC50 (µM) Z-Factor
Redq/Q159T 310 1.7 ± 0.2 0.76
Redq/Q159D 320 2.2 ± 0.1 0.68
Redq/QD+AT 548 2.0 ± 0.2 0.67
Redq/QT+AD 1025 3.0 ± 0.4 0.82
Redq 2033 4.0 ± 0.3 0.56
GA 640 1.5 ± 0.2 0.69
CL: concentration limit of [ATP] is the smallest amount of ATP capable of generating measurable Ca2+ response
by the sensor compared to background signal. It was estimated as the [ATP] that corresponds to three times the
standard deviation of the intensity of the background signal; EC50: half-maximal effective concentration.
The values of half-maximal effective concentrations (EC50) for P2Y2 activation determined from
the fit of dose-response curves were around 2 µM for most CHO cell lines expressing Redquorin
mutants or GA (Figure 5 and Table 3), in accordance with earlier reports [13,18]. The expression of
these latter Ca2+ sensors also resulted in submicromolar ATP concentration detection limits (Table 3).
In particular, the cell line Redq/Q159T gave an EC50 value of 1.7 µM, which closely matched that of the
GA-expressing cell line (1.5 µM), and exhibited the lowest ATP concentration limit of all Ca2+ sensors
tested (310 nM, Table 3). In contrast, the cell lines expressing native Redquorin and the Redq/QT+AD
mutant, yielded higher EC50 values (4.0 and 3.0 µM, respectively), associated with supramicromolar
ATP concentration limits (Table 3).
In high-throughput screening assays, the number of compounds is evaluated, and thus the
assays need to be robust and reproducible over time. Hence, the need for at least one strict assay
validation parameter that assures high quality data and suitability of the system. For validating this
Ca2+ sensor-based assay, ATP experiments were performed at the maximum and minimum signal
or response levels in order to ensure that the signal window is adequate to detect effective ATP
concentrations. Accordingly, the Z-factor was calculated for each pair of CHO cell line/ATP response,
which reflects the assay signal dynamic range and the data variation associated with the signal
measurements [38]. Values of ≥ 0.6 are commonly considered to indicate a valuable assay (which is
comparable to a signal window ≥3). The data showed that the cell line CHO/Redq/QT+AD performed
best in terms of signal measurement (Z-factor = 0.82), although this cell line lacked submicromolar
sensitivity to ATP, whereas the performance of the cell line expressing native Redquorin was the lowest
(Z-factor = 0.56). The cell line CHO/Redq/Q159T exhibited an excellent Z-factor value of 0.76 and
performed well in responding to submicromolar ATP concentration (Table 3). Hence, all Redquorin
mutants performed better than native Redquorin in terms of sensitivity to physiological Ca2+ signals,
and GPCR assay robustness and reproducibility.
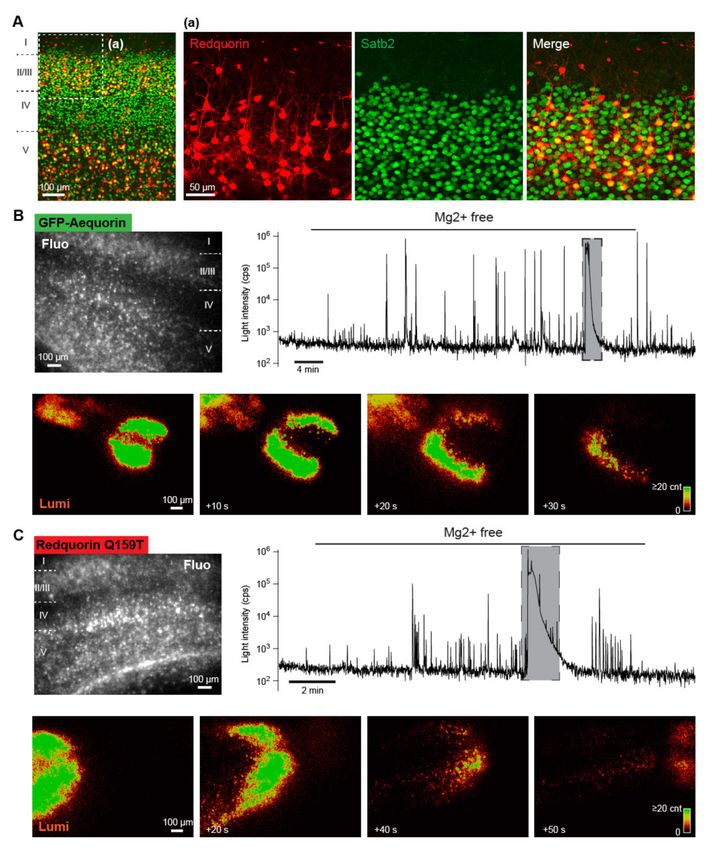
2.5. Imaging Neuronal Network Activities in Brain Slice with a RedquorinXS Mutant
GA has been used for the real-time monitoring of intracellular Ca2+ increase associated with
bioelectrical activity in single neurons or multiple neurons simultaneously in brain slices [23,30].
In order to evaluate the usefulness of RedquorinXS mutants as neuronal activity sensors, we compared
the performance of GA with that of RedquorinQ159T (whose Ca2+ sensing properties are closest) for
the imaging of neuronal network activity in slices of mouse neocortex. After the overnight incubation
of acute cortical slices with recombinant Sindbis virus encoding either GA or RedquorinQ159T,
the expression of sensors was visualized using GFP or tdTomato fluorescence, respectively.
Sensor-expressing cells were labeled throughout the somatodendritic compartment, localized primarily
in layers II/III and V, and exhibited the morphology of excitatory pyramidal neurons (Figure 7),
consistent with earlier observations on GA [23,30]. A large majority of Redquorin-expressing cells
(80.9% in layer II/III, n = 110; 75.3% in layer V, n = 77) were immunoreactive for Satb2, which isInt. J. Mol. Sci. 2020, 21, 7846 10 of 20
selectively expressed in excitatory neurons of the mature cortex ([39], Figure 7). These results indicate
that most sensor-expressing cells following Sindbis viral transfer were pyramidal neurons, as described
for GA [30].
Figure 7. Ca2+ imaging of mouse neocortical network activities with GA and RedquorinQ159T.
(A) Confocal reconstruction of a neocortical slice expressing RedquorinQ159T after viral gene transfer.
Redquorin-expressing cells were preferentially localized in layers II/III and V, and most exhibited the
typical morphology of pyramidal neurons and were immunopositive for the marker of excitatory
neurons Satb2. (B,C) Upper: Fluorescence images (Fluo) of neocortical slices expressing the indicated
Ca2+ sensor, and traces corresponding to whole-field bioluminescence recordings of the same slices.
Note the logarithmic scale of light intensity. Lower: Bioluminescence images of the same slices showing
intense bioluminescence waves corresponding to the large peaks on whole-field bioluminescence traces
indicated by shadowed boxes. Note the slow propagation of the waves.
We compared the ability of the two sensors to report neocortical network activities elicited by the
removal of extracellular Mg2+ (n = 2 slices and 14 slices for GA and RedquorinQ159T, respectively),
which is known to induce episodes of synchronized epileptiform activity of the network that can be
monitored using GA bioluminescence [30]. In the control conditions, the whole-field recording basal
signal was low (below 103 cps for both sensors, Figure 7), consistent with the low spontaneous activity
observed in neocortical slices [40] and the low background luminescence of aequorin in absence of
Ca2+ [6]. After removal of extracellular Mg2+ , bioluminescence peaks of large amplitude (reaching
above 105 cps for both sensors) gradually became more frequent on the traces of whole field recording,
reflecting the progressive appearance of synchronized epileptiform activities in neuronal ensembles
upon Mg2+ washout (see examples in Figure 7). These results are consistent with those of previous
electrophysiological and imaging studies [30,41,42]. Similar to earlier reports [30,43,44], we observed
that slowly propagating waves of intense bioluminescence occurred in some slices (n = 2 out of 2 andInt. J. Mol. Sci. 2020, 21, 7846 11 of 20
n = 8 out of 14 GA-expressing and RedquorinQ159T-expressing slices, respectively) after prolonged
perfusion with Mg2+ -free solution (Figure 7, and Supplementary Movie). These waves temporarily
interrupted epileptiform activities (Figure 7) and are reminiscent of cortical spreading depression [45].
These results indicate that, like GA, RedquorinQ159T is a suitable bioluminescent Ca2+ sensor for the
wide-field imaging of diverse neuronal network dynamics with a high signal-to-background ratio.
3. Discussion
3.1. Apoaequorin Mutations That Enhance Aequorin Ca2+ Sensitivity
Aequorin light emission rate/intensity increases by several orders of magnitude over the [0.1 µM–
1 mM] Ca2+ concentration range [6]. This increase is determined by the interplay between three EF
hands endowed with different Ca2+ affinities, with a low affinity EF1 domain and a high affinity
domain comprising the EF2,3 cooperative pair [7]. In the present study, 44 apo-aequorin mutations were
screened, of which 7 enhanced the Ca2+ sensitivity of aequorin. None of the mutations generated in or
around EF1 enhanced aequorin Ca2+ sensitivity. In particular, mutations flanking the N26 Ca2+ -binding
residue, whose N26D substitution enhances aequorin Ca2+ sensitivity [7,35], either reduced (V25I)
or did not affect (V25A, H27N, H27G) Ca2+ sensitivity. Conversely, the 7 mutations that enhanced
aequorin Ca2+ sensitivity concern four Ca2+ -binding residues located at equivalent positions in EF2
(N121, A123) and EF3 (S157, Q159), as well as a residue of the C-terminal tail (A179). Among these five
residues, four (N121, A123, Q159, A179) bear the substitutions that have been used, alone or in dual
combinations, to enhance Redquorin Ca2+ sensitivity. The functional impact of these mutations can be
tentatively explained in light of aequorin crystal 3D structures (Ca2+ -free aequorin: [10], PDB code 1EJ3;
Ca2+ -bound apo-aequorin: [11], PDB code 1SL8), in which N121, A123, Q159, and A179 lie within short
distance of each other and participate in Ca2+ binding, EF2-EF3 interactions, and/or EF3-coelenterazine
binding domain interactions (see Figure 8).
Figure 8. Local environment of amino acid residues bearing AequorinXS mutations N121D, A123D,
Q159D/T, and A179T. Upper: position of N121, A123, Q159, and A179 (asterisks) in the primary
sequence of aequorin, red boxes denote Ca2+ binding residues. Lower: local environment of these
residues in the crystals of Ca2+ -free aequorin (PDB code 1EJ3) and Ca2+ -bound apo-aequorin (PDB code
1SL8). Note in left panel that EF2 residues N121 and A123 participate in Ca2+ binding, and that EF3
residue Q159 interacts with N121. Note in right panel that the A179 residue points via its side chain
towards the beginning of EF3. Its neighbor C180 interacts with the Q168 residue, which belongs to an
α-helix involved in coelenterazine binding and interacts with the EF3 Ca2+ -binding residue E164.Int. J. Mol. Sci. 2020, 21, 7846 12 of 20
The N121 EF2 residue interacts via its polar side chain with both Ca2+ and the Q159 EF3 residue.
High Ca2+ sensitivity of the N121D mutant (not observed for N121S) may primarily result from the
negatively charged side chain of the D residue strengthening interaction with Ca2+ , thus enhancing
EF2 Ca2+ affinity. The A123 EF2 residue binds Ca2+ via the carbonyl of its peptide bond, and its short
hydrophobic side chain points towards the Q159 side chain. As for the N121D mutation, the A123D
substitution (but not A123S and A123T) may primarily enhance EF2 Ca2+ affinity by increasing its
interaction with Ca2+ . The Q159 EF3 residue binds Ca2+ via the carbonyl of its peptide bond, and its
polar side chain interacts with that of the N121 residue. The replacement of Q159 by K (long side chain)
does not change Ca2+ sensitivity, whereas Q159D, T, or G mutants (shorter or no side chain) presumably
result in the loss of interaction with N121, thereby enhancing EF2 Ca2+ affinity by unleashing N121
interaction with Ca2+ . The A179 residue points towards the beginning of EF3 and neighbors the C180
residue. The C180 residue interacts with the Q168 residue, which belongs to an α-helix comprising
several coelenterazine-binding residues downstream of EF3 and interacts with the E164 Ca2+ -binding
residue of EF3 [35]. In contrast with A179 (short hydrophobic side chain), the mutant T179 (longer
polar side chain) may interact with the EF3 residue and/or alter interaction between C180 and Q168
residues, thereby enhancing EF3 Ca2+ affinity and/or facilitating the transduction of EF3 occupancy by
Ca2+ to light emission. It is noteworthy that the above hypotheses are compatible with observation of
the additive effects of these mutations in dual combinations. Moreover, these hypotheses predict that
the mutations also affect the interplay between aequorin EF hands, and thus not merely shift aequorin
Ca2+ sensitivity curve, but additionally change its shape/slope, as indeed observed in the present study.
3.2. AequorinXS Mutations Primarily Enhance Redquorin Sensitivity to Low Ca2+
The Ca2+ sensitivity of Redquorin mutants was compared to those of GA, CitA, and wt-Redquorin,
whose Ca2+ sensitivity curves are essentially parallel to that of wt-aequorin, but shifted towards lower
(GA and CitA), or higher (wt-Redquorin) Ca2+ concentration. Our results show that AequorinXS
mutations enhanced Redquorin Ca2+ sensitivity in all regards (submicromolar sensitivity, EC50,
decay kinetics). However, this effect was more prominent at low than at high Ca2+ concentration.
Indeed, all Redquorin mutants exhibiting higher sensitivity to submicromolar Ca2+ concentration
than GA, and some higher than CitA. Conversely, the increase of light emission intensity with Ca2+
concentration was smaller for RedquorinXS mutants than for GA and CitA, as apparent in the Ca2+
sensitivity curves of all mutants crossing those of GA and/or CitA, and in the decay kinetics of all
mutants being slower than those of GA and CitA at saturating Ca2+ concentration. These different
slopes point to differences in mechanisms of Ca2+ sensitivity enhancement. While RedquorinXS
mutations target EF2 and EF3 with likely alterations of the three EF interplay, fusion with GFP in GA
and CitA results in a global enhancement of aequorin Ca2+ sensitivity that presumably leaves the three
EF interplay unaffected. GA and CitA fusions mimic the natural, non-covalent association of GFP and
aequorin in Aequorea victoria photocytes [2]. This suggests that the enhancement of the Ca2+ sensitivity
of their aequorin moieties occurs through the GFP/aequorin interface optimized through co-evolution.
In contrast, although high BRET efficiency attests to their close proximity in Redquorin [33], aequorin
fusion with tdTomato does not enhance its Ca2+ sensitivity, suggesting that the aequorin-tdTomato
interface may be engineered as an alternative strategy to enhance Redquorin Ca2+ sensitivity.
3.3. RedquorinXS Sensors Report Intracellular Ca2+ Signals with High Sensitivity in Cell Lines and in
Brain Slice
Consistent with their enhanced Ca2+ sensitivity, the four tested RedquorinXS mutants surpassed
Redquorin in sensing P2Y2 receptor activation by ATP upon expression in CHO cell lines. As expected
from their respective Ca2+ sensitivity in vitro, the dose-response curves of RedquorinQ159D and
Q159T mutants in the P2Y2 receptor in cellulo assay exhibited lower [ATP] detection limits than GA,
and reached a maximum at higher [ATP] than GA. The performance of RedquorinQ159D and Q159T
in the P2Y2 receptor assay was thus superior to that of GA, in terms of ATP detection sensitivity andInt. J. Mol. Sci. 2020, 21, 7846 13 of 20
of ATP concentration range reported. Moreover, the P2Y2 receptor assay was more robust (Z-factor)
using RedquorinQ159T as reporter than using GA. Conversely, and at odds with their respective
Ca2+ sensitivity in vitro, RedquorinQD+AT and QT+AD double mutants were less sensitive reporters
of P2Y2 receptor activation than RedquorinQ159D/T single mutants and GA. Protein misfolding or
instability in cellulo are unlikely to account for this discrepancy, since photoproteins used in vitro
were also produced in mammalian cells, and since thermostability was similar for all Redquorin
mutants. Conversely, this discrepancy may result from differences between in vitro and in cellulo
solutions. For example, Mg2+ at cytosolic concentration is a competitor of Ca2+ binding to EF hands,
whose inhibitory effect on aequorin and GA is sensitive to EF mutation [23,46]. Cytosolic Mg2+ may
thus preferentially inhibit Redquorin double over single mutants because of its enhanced binding
to EF2 (Q159T+A123D mutant) or EF3 (Q159D+A179T), leading to lower in cellulo sensitivity of
Redquorin double mutants. Our results thus indicate that the RedquorinXS Q159T mutant is the
best suited aequorin-based red sensor for Gq-coupled receptor assays, but also for the simultaneous,
multicolor monitoring of cellular signaling in combination with bioluminescent sensors for diverse
intracellular signals emitting at various wavelengths [47–52].
An earlier study showed that the small proportion of red light emitted by the fusion of aequorin
with red fluorescent protein mRFP can be detected through the mouse skull [31]. This suggests that
Redquorin mutants, whose light emission is optimally shifted to red, may be used for transcranial
monitoring of brain activity, pending their ability to report the activities of neuronal ensembles. We thus
tested the mutant showing highest in cellulo performance, RedquorinQ159T, for the imaging of neuronal
network activity following viral transfer in slices of mouse neocortex, using GA as an established
reference [30]. Both sensors were expressed in cortical pyramidal neurons, exhibited a low basal
signal in the absence of cortical stimulation, and similarly reported synchronized activities of neuronal
ensembles elicited by the removal of extracellular Mg2+ via the emission of large bioluminescence peaks.
These results do not allow for quantifying the relative sensitivity of the two Ca2+ sensors because of the
high variability of neuronal network activity patterns evoked by Mg2+ washout [30,41,42]. Nonetheless,
they demonstrate that RedquorinQ159T efficiently reports neuronal network dynamics in real-time
upon wide-field bioluminescence imaging with a high signal-to-background ratio. Mg2+ removal also
elicited waves of intense bioluminescence, which were observed for both Ca2+ sensors, propagated
slowly across the cortical slice, and resembled cortical spreading depression. Spreading depression
consists in a transient wave of near-complete neuronal and glial depolarization associated with large
intracellular Ca2+ increases and is a pathophysiological correlate of migraine that also occurs following
traumatic brain injury or focal ischemia [45]. Our results thus indicate that the RedquorinXS Q159T
mutant is the best suited aequorin-based red sensor for the monitoring of normal and pathological
neuronal network activities.
4. Materials and Methods
4.1. Site-Directed Mutagenesis of Apo-Aequorin and Redquorin
The construct of wt-apo-aequorin (PDB ID: 1EJ3; SEQ ID NO:1), and the fusion proteins
wt-redquorin (wt-Redq) and citrine-aequorin (CitA), subcloned in pTriEx vector, were generated
and obtained as a generous gift from Prof. Juan Llopis [32,33]. The fusion construct GFP-aequorin
(GA) was the one generated in the lab of Prof. Philippe Brûlet [24]. The selected single and double site
mutations were obtained using mutagenic oligonucleotide primers applied on wt-apo-aequorin or
redquorin constructs using the single- and multiple-site QuikChange XL Site-Directed Mutagenesis kit
according to the manufacturer’s instructions (Catalog #200516, Agilent Technologies, Les Ulis, France).
The DNA sequence of all obtained mutants was verified by Sanger sequencing.Int. J. Mol. Sci. 2020, 21, 7846 14 of 20
4.2. Production and Purification of Apophotoproteins from Mammalian HEK Cells
HEK-293 cells (kind gift from Dr. Helene Faure) were cultured in Dulbecco’s Modified Eagle’s
Medium (Lonza, Levallois, France) supplemented with 2 mM L-glutamine, 10% heat-inactivated
fetal bovine serum (FBS) and 100 U/mL of penicillin/streptomycin (Lonza). The cells were routinely
maintained at humidified atmosphere of 37 ◦ C and 5% CO2 . For transfection with foreign DNA vector,
the cells were seeded at a density of 6 × 10⁵ /cm2 and transfected the day after with Lipofectamine 2000
(Life technologies SAS, Villebon-sur-Yvette, France) according to the manufacturer’s recommendations.
One day post-transfection, HEK-293 cells (2–3 × 10⁶ cells) transiently expressing the apophotoproteins
were rinsed twice with phosphate-buffered saline (PBS) and collected using a cell scraper, under ice-cold
conditions. The cells were harvested at 500g for 5 min and then resuspended and washed once in cold
PBS buffer. Subsequently, the cells were lysed using a hypo-osmotic buffer composed of 20 mM Tris-HCl
(pH 7.5), 10 mM EGTA, and 5 mM β-mercaptoethanol, prepared in Milli-Q/H2 O and supplemented
with a protease inhibitor cocktail (complete-Mini, EDTA-Free, Roche, Basel, Switzerland). The cell
membranes were broken by two freeze-thaw cycles, followed by few passages through a 25-gauge
needle. The resulting lysates samples were then centrifuged at 13,000× g for 20 min to remove cell
debris and unbroken cells. The 500 µL supernatant containing the apophotoprotein was recovered and
passed through molecular weight cut-offs (AmiconUltra MWCO, 10K and 50K, from Millipore SAS,
Molsheim, France). Columns of 10 kDa were used for apo-aequorin mutant proteins and 50 kDa for
redquorin mutant proteins. This step allowed for higher purity and buffer exchange by eliminating
unwanted proteins, salts, and different compounds in the eluted protein samples. The samples were
concentrated from approximately 500 µL to 20 µL volumes for buffer exchange. The 20 µL concentrated
samples were resuspended in 500 µL volume of the desired buffer and this step was repeated twice
to ensure high fidelity wash and buffer exchange. The concentrated samples were stored at 4 ◦ C for
reconstitution in future assays.
4.3. Protein Expression and Purification from E. coli
Some experiments of affinity, emission lifetime, and thermostability were repeated on highly
purified proteins and gave similar results (Redq/Q159D; Redq/QD+AT, Redq/Q159T, Redq/QT+AT,
and Redq/QT+AD). Consult more detailed protocol in the following references [32,33]. Briefly,
the expression of His-tagged photoproteins was carried out in E. coli using pTriEx-4 plasmid system.
Bacterial cells expressing the photoproteins were then lysed and photoproteins were column purified
using Ni-NTA HisBind resin (Merck Millipore, Burlington, MA, USA). An additional purification step
was performed using molecular weight cut-offs (AmiconUltra MWCO, 50K, from Millipore) as described
in the previous section of cell culture. Protein quantification of the protein samples was performed
on Nanodrop machine (ThermoFisher scientific, Waltham, MA, USA), by using a combination of
absorbance either at 280 nm or at wavelength that corresponds to the maximum extinction coefficient
of the fluorescent protein tdTomato in Redq (554 nm). The pure samples were stored at 4 ◦ C for
reconstitution in future assays.
4.4. Aequorin Reconstitution for In Vitro Assays
The purified and concentrated samples of apo-aequorin and redquorin mutant proteins were
buffer-exchanged to 50 mM Tris–HCl (pH 7.5), 150 mM NaCl, 10 mM EGTA, 5 mM β-mercaptoethanol,
supplemented with 5 µM CLZ-f or CLZ-native and incubated overnight at 4 ◦ C, in the dark. The next
day, samples were passed through molecular weight cut-offs (AmiconUltra MWCO, 10K and 50K,
from Millipore), then resuspended in Zero-Ca2+ buffer (30 mM MOPS, 100 mM KCl and 10 mM EGTA,
pH 7.2) for calcium affinity, emission decay kinetics, and spectral analyses assays.Int. J. Mol. Sci. 2020, 21, 7846 15 of 20
4.5. Functional Analysis of Aequorin Mutants and Fusions In Vitro
Ca2+ sensitivity curves. Purified and reconstituted samples with CLZ-f or CLZ-native already
buffered-exchanged to zero-calcium buffer ensured to minimize calcium contamination that could
interfere with the measurements. A fifteen microliter aliquot of photoprotein samples (concentration
range, 50 to 90 ng/µL) was placed in a home-made luminometer and mixed with 300 µL solution
containing the desired concentration of free-Ca2+ . The solutions of EGTA-buffered with varying
free-Ca2+ prepared according to the manufacturer instruction for the kit (Molecular Probes, Invitrogen).
The integration of luminescence emission per second was measured for 20 s (background) before
injecting solution with known [free-Ca2+ ] and lasted until stable or decaying signal (at final-phase)
was obtained. At this point, 400 µL of a saturating calcium solution (30 mM MOPS, 100 mM CaCl2 ,
pH 7.2) was rapidly injected (less than 30 ms) and light integration continued until all aequorin had
been consumed and light intensity had gone back to background signal. Luminescence intensity (L) at
different [Ca2+ ] was taken as the response peak value in case of decaying signal or as the stable value
in case of stable emission. Lmax was measured by integrating all remaining luminescence signal from
that moment (L value) to the end of the experiment. The EC50 values were extracted from a sigmoidal
dose-response fit (variable slope) using Prism software ( GraphPad, San Diego, CA, USA).
Emission half-life. For assessing the decay kinetics of the mutant proteins of aequorin and redquorin,
as well as citrine-aequorin (CitA) and GFP-aequorin (GA), the emission half-life (t1/2 ) was calculated
from the curve with monoexponential decay fit. The recording of the luminescence signal (sampling
interval of 30 ms) started before the fast injection of 200 µL of saturating calcium solution (50 mM
Tris–HCl, 100 mM CaCl2 , pH 7.5) into fifteen microliter aliquot of protein samples. This resulted in a
peak response with complete aequorin consumption and emission decay in less than 8 s for all samples.
Spectral measurement and analysis. A fifteen microliter aliquot of photoprotein samples was brought
in contact with 200 µL saturating calcium solution (50 mM Tris–HCl, 100 mM CaCl2 , pH 7.5) in a
PCR tube to induce light emission. Emitted photons were collected via an optic fiber, guided into a
spectrometer (Specim, Oulu, Finland), and captured by an EM- CCD camera (DU-897 back illuminated,
Andor, Belfast, Northern Ireland). Spectral calibration was performed using laser pointers (405 and
650 nm). This home-made setup, from the lab of Prof. Philippe Brûlet, allowed immediate and
synchronous spectral analysis (no scanning) of emitted luminescence with 1-nm resolution [31].
Thermostability. The purified photoprotein samples were reconstituted with CLZ-f (as detailed
earlier) and let to calibrate at room temperature (20–24 ◦ C) for 20 min before taken the first measurement
of total counts using saturating calcium solution (50 mM Tris–HCl, 100 mM CaCl2 , pH 7.5). The samples
were then incubated at two different temperatures for 30 min and let equilibrate at room temperature for
15 min before taken the second measurement of total counts in the sample. The relative bioluminescence
activity at each temperature was calculated by the ratio 2nd counts/1st counts multiplied by 100.
4.6. Functional Analysis of Photoproteins in CHO Cell Lines
CHO cells stably expressing photoproteins. To produce stable CHO cell lines, the cells transfected
with GA and Redquorin variant plasmids were seeded on six-well plates and grown in the same
medium with addition of Geneticin sulfate (G418) (Thermo Fisher Scientific, Waltham, MA USA)
at 1 mg/mL under the same conditions with replacement of the medium by fresh medium every
2 days. After 7–10 days of selection, CHO cells were transferred into a medium without antibiotic.
To select clones with the highest bioluminescence activity, one run of limiting dilution was performed.
Following G418 selection, CHO cells were seeded on 96-well plates (approximately 0.5 cells per well)
and grown in DMEM/F12 medium supplemented with 10% fetal calf serum at 37 ◦ C, 5% CO2 for
up to 80–90% confluence. Before the bioluminescence measurements, the plates with monoclones of
CHO cells expressing a given apophotoprotein were duplicated and grown up to 90–100% confluence.
The medium was then removed and cells were loaded with 5 µM CLZ-native in Tyrode solution
(130 mM NaCl, 5 mM KCl, 1 mM MgCl2 , 2 mM CaCl2 , 5 mM NaHCO3 , 20 mM N-(2-hydroxyethyl)
piperazine-N0 -ethanesulfonic acid (HEPES), pH 7.4) for 3 h at room temperature. Then, bioluminescenceInt. J. Mol. Sci. 2020, 21, 7846 16 of 20
in each well was measured with a Mithras LB 940 plate luminometer (Berthold Technologies GmbH,
Bad Wildbad, Germany) at 23 ◦ C by injection of 1% Triton X-100 in Tyrode solution for cell lysis and
triggering light emission. Bioluminescence was measured by integrating the light signal for 10 s.
The CHO cell clones with the highest bioluminescence activity were selected for this study.
Assay of activation of endogenous P2Y2 receptor in CHO cells. The CHO cell lines stably expressing
each Redquorin variant or GA were used in assay of activation of endogenous P2Y2 receptor by
ATP. The day before the measurements, the corresponding cells were seeded on 96-well plates with
DMEM/F12 medium supplemented with 10% fetal calf serum and were grown up to 90–100% confluence
at 37 ◦ C with 5% CO2 . Then, the medium was replaced by 100 µL per well of the coelenterazine solution
described above, and cells were incubated at 23 ◦ C for 3 h. ATP was injected to trigger an intracellular
Ca2+ response in the cells and bioluminescence measurement started immediately. Bioluminescence
was measured using a Mithras LB 940 plate luminometer, with light emission integrated over a 0.5 s
time interval for 60 s.
4.7. Bioluminescence Imaging of Photoproteins in Mouse Neocortical Slices
Preparation and production of recombinant viral vectors. Recombinant Sindbis viruses were prepared
and used to express Redquorin mutants and GA in neurons of brain slices as described [23,53].
The coding sequences of Redquorin mutants and GA were first subcloned in the plasmid pSinRep5
(Invitrogen) upstream to the polyA signal. The resulting pSinRep5 plasmids encoding the fusion
protein sensors as well as the helper plasmid pDH26S (Invitrogen) were then submitted to in vitro
transcription to prepare capped RNA using the Megascript SP6 kit (ThermoFisher scientific, Waltham,
MA, USA). Next, BHK-21 (baby hamster kidney; CCL-10; ATCC) cells were electroporated with
both sensors-encoding and helper viral RNAs, and maintained for 24 h at 37◦ C, 5% CO2 in DMEM
containing 5% fetal calf serum. Recombinant pseudovirions were harvested by collecting the cell
supernatant and were stored at −80 ◦ C.
Preparation and viral transduction of neocortical Slices. All experiments were carried out in accordance
with the guidelines published in the European Communities Council Directive of 22 September 2010
(2010/63/UE, project agreement # APAFIS#16198-2018071921137716v3, approved by ethical committee
#5 on 02/19/2017). Parasagittal sections (250 µm-thick) of cerebral cortex were prepared from young
C57BL/6J mice (10–14 postnatal days old) as described [23,53]. The slices were incubated at room
temperature for 30 min in artificial cerebrospinal fluid (ACSF) containing (in mM): 126 NaCl, 2.5 KCl,
1.25 NaH2 PO4 , 2 CaCl2 , 1 MgCl2 , 26 NaHCO3 , 20 glucose, 5 pyruvate, 1 kynurenic acid and oxygenated
with a mixture of 95% O2 /5% CO2 . The slices were then transferred onto a Millicell CM membrane
(Millipore) pre-equilibrated with culture medium (50% MEM, 50% HBSS, 6.5 g/L glucose, 10 U/mL
penicillin, 10 µg/mL streptomycin). The transduction of the slices with Sindbis pseudovirions as DNA
delivery vehicles was carried out as described [23,53]. The apophotoproteins in Redquorin mutant
and GA were reconstituted overnight by supplementing the culture medium with 10 µM native CLZ.
The next day, cortical slices were pre-incubated for at least 1 h in ACSF before being transferred to the
imaging chamber where ACSF was continually perfused at a rate of 1–2 mL/min.
Bioluminescence imaging. Bioluminescence imaging was performed as described [30] using an
intensified CCD video camera (ICCD225; Photek, St Leonards on Sea, United Kingdom) controlled
by the IFS32 software (Photek), and mounted on an upright microscope (BX51WI, Olympus, Tokyo,
Japan) equipped with water immersion objectives ×10 (NA = 0.3) and ×20 (NA = 0.95). Prior to
bioluminescence imaging, fluorescence images of GA- or Redquorin-transduced slices were acquired
in the “bright field” mode of the camera using GFP (Semrock, Rochester, NY, USA) or Cy3ET (Chroma,
Bellows Falls, VT, USA) filter sets. Bioluminescence imaging was performed at room temperature in
“bining slice” mode at a rate of 25 frames per second in complete darkness and without emission filter
to maximize photon capture. Data were collected, stored, and visualized with the IFS32 software.
Immunohistochemistry. Slices were fixed overnight at 4 ◦ C in 0.1 M phosphate-buffered saline (PBS,
pH 7.4) containing 4% paraformaldehyde. Next, the slices were washed with PBS 3 × 15 min andInt. J. Mol. Sci. 2020, 21, 7846 17 of 20
permeabilized with 0.2% gelatin/0.25% triton X-100 in 0.1 M PBS (GT-PBS) for 1 h. The slices were then
incubated overnight with primary antibody in GT-PBS. Primary antibodies used were rabbit anti-Satb2
(1/1000; Abcam, ab34735), chicken anti-GFP antibody (GFP-1020, 1/2000; Aves Labs, Tigard, OR, USA)
and rat anti-RFP (5F8, 1/1000; Chromotek, Planegg, Germany). After 3 × 10 min washes in GT-PBS,
the slices were incubated for 2 h with Alexafluor 488-conjugated goat anti-rabbit IgG, and Alexafluor
555-conjugated goat anti rat IgG (1/1000; Life Technologies, A-11034 and A-21434 respectively). After at
least three washes in 0.1 M PBS, slices were mounted in fluoromount-G (Clinisciences, Nanterre,
France). All steps were performed at room temperature except the incubation with primary antibodies
that was performed at 4 ◦ C. Images were acquired with an upright Leica DM 6000 SP5 confocal laser
scanning microscope, and then analyzed using the cell counter plugin of ImageJ 1.32 software (National
Institute of Health, Bethesda, MD, USA). Counting was performed upon visual inspection of confocal
images and no procedure was implemented to reduce count bias.
5. Conclusions
RedquorinXS-Q159T is an optimized red light-emitting Ca2+ sensor suitable for the monitoring of
intracellular signaling in a variety of screening and basic research applications in cells and tissues.
Supplementary Materials: The following are available online at http://www.mdpi.com/1422-0067/21/21/7846/s1.
Supplementary Table S1, Supplementary Table S2, legend to Supplementary Movie, Supplementary Movie.
Author Contributions: A.B., S.P., N.P.M., and L.T. performed experiments. A.B., S.P., N.P.M., and L.T. analyzed
data. A.B., S.P., E.S.V., B.L. and N.P. designed the study. A.B., E.S.V. and B.L. wrote the manuscript with input
from the other authors. E.S.V., B.L. and N.P. acquired funding. All authors have read and agreed to the published
version of the manuscript.
Funding: This work was supported by grants from Centre National de la Recherche Scientifique (AAP Prématuration
CNRS 2016, to A.B. and N.P.; equipment transfer to S.P. and B.L.), from Agence Nationale de la Recherche
(AAP Prématuration FCS/IDEX Paris Saclay, to A.B. and N.P., France BioImaging infrastructure ANR-10-INBS-04,
ANR-11-EQPX-029 to N.P.), from Fondation pour la Recherche sur le Cerveau/Rotary Club de France (B.L.),
and from RFBR (project number 20-04-00085 to N.P.M. and E.S.V.). The funders had no role in study design,
data collection and analysis, decision to publish, or preparation of the manuscript.
Acknowledgments: The authors thank Philippe Vernier, Juan Llopis, Hélène Faure, and the IBPS Cell Imaging
and Animal Facilities for their valuable help. This work is dedicated to the memory of Philippe Brûlet.
Conflicts of Interest: The authors have no conflict of interest to declare.
References
1. Russell, J.T. Imaging calcium signals in vivo: A powerful tool in physiology and pharmacology. Br. J.
Pharmacol. 2011, 163, 1605–1625. [CrossRef] [PubMed]
2. Wilson, T.; Hastings, J.W. Bioluminescence. Annu. Rev. Cell. Dev. Biol. 1998, 14, 197–230. [CrossRef] [PubMed]
3. Vysotski, E.S.; Lee, J. Ca2+ -regulated photoproteins: Structural insight into the bioluminescence mechanism.
Acc. Chem. Res. 2004, 37, 405–415. [CrossRef] [PubMed]
4. Shimomura, O.; Johnson, F.H. Calcium binding, quantum yield, and emitting molecule in aequorin
bioluminescence. Nature 1970, 227, 1356–1357. [CrossRef] [PubMed]
5. Shimomura, O.; Johnson, F.H. Regeneration of the photoprotein aequorin. Nature 1975, 256, 236–238.
[CrossRef] [PubMed]
6. Allen, D.G.; Blinks, J.R.; Prendergast, F.G. Aequorin luminescence: Relation of light emission to calcium
concentration—A calcium-independent component. Science 1977, 195, 996–998. [CrossRef] [PubMed]
7. Tricoire, L.; Tsuzuki, K.; Courjean, O.; Gibelin, N.; Bourout, G.; Rossier, J.; Lambolez, B. Calcium dependence
of aequorin bioluminescence dissected by random mutagenesis. Proc. Natl. Acad. Sci. USA 2006, 103,
9500–9505. [CrossRef]
8. Hastings, J.W.; Mitchell, G.; Mattingly, P.H.; Blinks, J.R.; Van Leeuwen, M. Response of aequorin
bioluminescence to rapid changes in calcium concentration. Nature 1969, 222, 1047–1050. [CrossRef]
9. Illarionov, B.A.; Frank, L.A.; Illarionova, V.A.; Bondar, V.S.; Vysotski, E.S.; Blinks, J.R. Recombinant obelin:
Cloning and expression of cDNA purification, and characterization as a calcium indicator. Methods Enzymol.
2000, 305, 223–249.You can also read