A Role of Inflammation and Immunity in Essential Hypertension-Modeled and Analyzed Using Petri Nets - MDPI
←
→
Page content transcription
If your browser does not render page correctly, please read the page content below
International Journal of
           Molecular Sciences

Article
A Role of Inflammation and Immunity in Essential
Hypertension—Modeled and Analyzed Using
Petri Nets
Dorota Formanowicz 1 , Agnieszka Rybarczyk 2,3 , Marcin Radom 2,3
and Piotr Formanowicz 2,3, *
 1    Department of Clinical Biochemistry and Laboratory Medicine, Poznan University of Medical Sciences,
      60-806 Poznan, Poland; doforman@ump.edu.pl
 2    Institute of Computing Science, Poznan University of Technology, 60-965 Poznan, Poland;
      Agnieszka.Rybarczyk@cs.put.poznan.pl (A.R.); Marcin.Radom@cs.put.poznan.pl (M.R.)
 3    Institute of Bioorganic Chemistry, Polish Academy of Sciences, 61-704 Poznan, Poland
 *    Correspondence: piotr@cs.put.poznan.pl

 Received: 15 April 2020; Accepted: 5 May 2020; Published: 9 May 2020

 Abstract: Recent studies have shown that the innate and adaptive immune system, together with
 low-grade inflammation, may play an important role in essential hypertension. In this work, to verify
 the importance of selected factors for the development of essential hypertension, we created a Petri
 net-based model and analyzed it. The analysis was based mainly on t-invariants, knockouts of
 selected fragments of the net and its simulations. The blockade of the renin-angiotensin (RAA)
 system revealed that the most significant effect on the emergence of essential hypertension has
 RAA activation. This blockade affects: (1) the formation of angiotensin II, (2) inflammatory process
 (by influencing C-reactive protein (CRP)), (3) the initiation of blood coagulation, (4) bradykinin
 generation via the kallikrein-kinin system, (5) activation of lymphocytes in hypertension, (6) the
 participation of TNF alpha in the activation of the acute phase response, and (7) activation of NADPH
 oxidase—a key enzyme of oxidative stress. On the other hand, we found that the blockade of the
 activation of the RAA system may not eliminate hypertension that can occur due to disturbances
 associated with the osmotically independent binding of Na in the interstitium. Moreover, we revealed
 that inflammation alone is not enough to trigger primary hypertension, but it can coexist with
 it. We believe that our research may contribute to a better understanding of the pathology of
 hypertension. It can help identify potential subprocesses, which blocking will allow better control of
 essential hypertension.

 Keywords: hypertension; inflammation; immunological phenomena; mathematical modeling;
 Petri nets; t-invariants

1. Introduction
     Although hypertension is a common disorder, there is still uncertainty about the underlying
mechanisms. Hence only a small number of patients are adequately treated, avoiding cardiovascular
complications. In almost 95% of patients with hypertension, the cause of this disease is unknown,
and they are referred to suffer from essential hypertension. Currently, there is more and more evidence
that hypertension is not only hemodynamic disorder but also a very complex disease that includes
numerous abnormalities, such as inflammatory process, activation of the immune system, metabolic
problems, abnormal fat distribution and over-activity of the sympathetic nervous system, becoming
the probable cause of treatment failure in many patients. This complexity of hypertension was already
noticed by Dr. Guyton over 50 years ago. In 1961 he developed a computational model predicting

Int. J. Mol. Sci. 2020, 21, 3348; doi:10.3390/ijms21093348                        www.mdpi.com/journal/ijms
Int. J. Mol. Sci. 2020, 21, 3348                                                                   2 of 34

how the kidney is the center-point of long-term blood pressure control. Then, together with Coleman,
he proposed the linkage between blood pressure and natriuresis, which maintains the balance of
sodium and extracellular volume in the body [1,2]. These pioneers’ research, far ahead of their times,
laid the groundwork for intensive research on the mechanisms of arterial blood pressure regulation.
      To the best of our knowledge, there is no research on essential hypertension which, in order
to capture new properties, would simultaneously take into account many of the fundamental
processes underlying the disease and analyze their interrelations in a single project. In our study,
to accomplish this, we conducted in silico experiments using a systems approach based on Petri net
theory. In general, the systems approach used to model complex biological systems involves a wide
range of different techniques, such as ordinary differential equations (ODEs), Boolean networks (BNs),
linear programming (LP), or agent-based models (ABMs). ODE-based methods that are frequently
applied for this purpose, despite their expressive power, also have some limitations. They result from
the necessity to determine the exact values of some parameters corresponding to the quantitative
properties of the modeled system. The values of these parameters are often difficult to obtain in
practice, and this makes the construction of the ODE model a difficult and sometimes impossible
task. Models based on ODEs have also proved suitable for modeling continuous kinetic changes
in small networks, see [3,4]. Logical modeling techniques, ABM, and LP also suffer from some
limitations that have been thoroughly discussed, for example in [3–5]. In contrast to the methods
mentioned above, Petri nets provide an intuitive graphical representation that is of great importance
during the development phases of the biological system and gives the possibility to simulate system
behavior. Moreover, Petri nets are mathematical objects, and thus, can be analyzed using strict
mathematical methods.
      Furthermore, there are several different extensions of the classical (qualitative) Petri nets,
which make it possible to incorporate information of different types in models based on them, increase
their precision and allow to meet the modeling and analysis needs of diverse, complex dynamical
systems. Among these extensions are stochastic Petri nets (SPNs) [6], used for instance to study
complex disease comorbidities in autism and inflammatory bowel diseases (see [7]), to demonstrate
the significance of IL-10 in the inflammatory process (see [8]) or to study interferon regulatory factors
genes and T cells activation (see [9]). Additionally, Bolton with his co-authors [10] have proposed a
new type of net, i.e., Fuzzy Continuous Petri net, which allows using fuzzy firing rates for transitions.
However, reliable reaction data are, in most cases, not accessible in the literature and the structure of
the net itself determines many fundamental properties of the analyzed system and still results in many
interesting and spectacular discoveries.
      In our study, using the classic Petri nets used by other researchers, we investigated the factors
and mechanisms underlying primary hypertension, whose role in the light of recent research seems to
be crucial. In the beginning, we created a model in which we took into account both the role of the
RAA system, whose significance is undisputed, as well as on new scientific discoveries, such as the
significance of neoantigens [11], the existence of an additional salt buffering mechanism [12], the role
of oxidative stress, inflammation and endothelial dysfunction [13]. To understand the importance
of studied factors/mechanisms, we blocked some of them during the knockout analyzes and then
checked how the system (representing the human body affected by hypertension) works without them.
It allowed assessing the importance of particular factors.
      The article has four main sections. Firstly, the problem of the complexity of primary hypertension
with particular emphasis on the new scientific trends is shown. The next part briefly discusses the
methods used in this study (there are two main sub-sections here, the first is the part presenting Petri
net, the second is a description of the hypertension phenomenon, enriched with a block diagram
enabling understanding the analyzed issue. Then, there is a section of results and discussion, when the
model and its formal analysis are presented. Moreover, six scenarios are analyzed and discussed
here. Each of them includes questions and answers, accompanied by figures and tables that facilitate
understanding of the analyzes. The last section contains conclusions.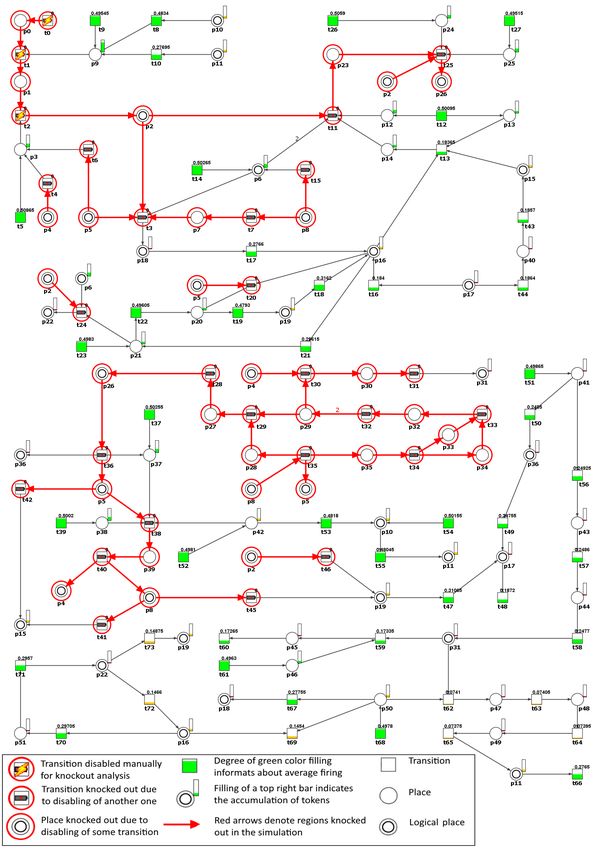
Int. J. Mol. Sci. 2020, 21, 3348                                                                                 3 of 34

2. Methods

2.1. Petri Nets
     In the beginning, we would like to present how Petri nets are used in bio-medical research.
What is their place and on what basis the models are created and then analyzed. Figure 1 shows the
block diagram of this method.

      Figure 1. The general working scheme describing the steps that should be taken in order to create
      model, conduct the analysis and obtain results.

       Petri nets are mathematical objects whose structure is a directed bipartite graph. Graph G = (V, A)
of this type is composed of two subsets of vertices V1 and V2 such that V = V1 ∪ V2 , V1 ∩ V2 = ∅ and
∀(vx ,vy )∈ A (v x ∈ V1 ∧ vy ∈ V2 ) ∨ (v x ∈ V2 ∧ vy ∈ V1 ) (i.e., there is no arc in the graph connecting two
vertices being elements of the same subset). In a Petri net, vertices belonging to one of these subsets
are called places, while vertices being elements of the second subset are called transitions. (From this it
follows that no two places nor two transitions can be connected by an arc.) For transition t j place pi is
called its pre-place if there exists arc ( pi , t j ), i.e., if place pi is an immediate predecessor of transition t j .
Analogously, place pk is called post-place of transition t j if there exists arc (t j , pk ), i.e., if place pk is an
immediate successor of transition t j . When a Petri net is a model of some system, places correspond
to its passive components, while transitions correspond to the active ones. In the case of models of
biological systems transitions can model chemical reactions while places can be counterparts of their
substrates and products, for example. Moreover, arcs correspond to causal relations between the
passive and active components of the system. Each of the arcs is labeled by a positive integer number
called a weight.
       Places, transitions and arcs compose the structure of Petri nets but there are other important
components bringing to the nets a dynamics, being one of their fundamental properties. These
components are tokens residing in places and flowing from one place to another through transitions.
This flow corresponds to a flow of information, substances, etc. in the modeled system. A vector of
the numbers of tokens residing in every place is called marking of the net and corresponds to a state
of the modeled system. The flow of tokens is governed by a simple rule called transition firing rule.
According to it, a transition is enabled if the number of tokens residing in each of its pre-places is equal
to or greater than the weight of an arc connecting such a place with the transition. An enabled transition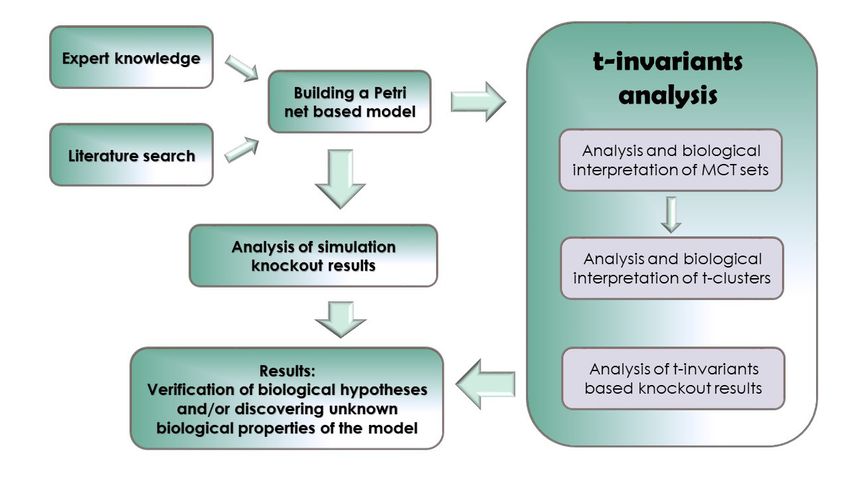
Int. J. Mol. Sci. 2020, 21, 3348                                                                      4 of 34

can be fired what means that tokens can flow from its pre-places to its post-places. The number of
flowing tokens is equal to the weight of an arc connecting the transition with the place. There are two
exceptions to this rule, i.e., a transition without pre-places (the so-called input transition) is always
enabled and a transition without post-places (the so-called output transition), when fired, does not
produce any tokens. Transitions of these two types are usually used to model some connections of the
system with its environment [14–16].
     Petri nets have very intuitive graphical representation, which helps to better understand the
structure and behavior of the net. In this representation places are shown as circles, transitions as
rectangles or bars, arcs as arrows, and tokens as dots or positive integer numbers residing in places.
If a weight of an arc is equal to 1, then it is usually not shown, otherwise, the number is associated
with an arrow corresponding to a given arc.

2.1.1. t-Invariants
       Despite that the graphical representation is intuitive, it is not very well suited for the analysis
of formal properties of the nets. For this purpose another representation, i.e., an incidence matrix,
is used. In such a matrix A = ( aij )n×m , where n is the number of places and m is the number of
transitions, rows correspond to places while columns correspond to transitions. Every entry aij is an
integer number equal to the difference between the numbers of tokens in place pi after and before
firing transition t j .
       Petri nets have many interesting properties whose analysis can help to better understand the
behavior of the net and the behavior of the modeled biological system. In our studies of the model
we have put special attention to the analysis of the net invariants. There are two types of them,
i.e., transition invariants (t-invariants) and place invariants (p-invariants). An invariant of the former
type is vector x ∈ Nm being a solution to the equation A · x = 0. while an invariant of the latter type is
vector y ∈ Nn , which is a solution of the equation

                                                 y · A = 0.

       With every t-invariant x there is associated its support, denoted by supp( x ), being a set of
transitions corresponding to positive entries in x, i.e., supp( x ) = {t j : x j > 0, j = 1, 2, . . . , m}.
A t-invariant is minimal if its support does not properly contain a support of any other t-invariant,
i.e., there is no another t-invariant x 0 such that supp( x 0 ) ⊂ supp( x ). A net is covered by t-invariants
(i.e., CTI property holds, which is an important initial condition for an analysis based on t-invariants)
if every transition belongs to a support of at least one t-invariant. A support of a p-invariant and
a minimal p-invariant are defined analogously. Since every invariant can be expressed as a linear
combination of the minimal ones usually only minimal invariants are analyzed.
       If each transition t j belonging to a support of t-invariant x is fired a number of times equal to
the invariant entry x j then the marking of the net will not be changed (i.e., the state of the system
will remain unchanged). Moreover, the weighted number of tokens residing in places belonging to a
support of p-invariant y is constant, where the weight for place pi is equal to the invariant entry yi .
       In the case of Petri nets being models of biological systems t-invariants correspond to some
subprocesses occurring in the modeled system; t-invariants can be seen as biologically balanced
processes. It means that firing of all transitions belonging to the t-invariant support a proper number
of times will not change the state of the net (i.e., the tokens distribution in places). Obviously, these
processes are composed of some elementary subprocesses modeled by individual transitions belonging
to a support of a given t-invariant. Supports of various invariants can have non-empty intersections
what means that the subprocesses modeled by these invariants are composed of some common
elementary processes. Hence, the subprocesses can interact with each other. Therefore, the analysis of
similarities between t-invariants may lead to the discoveries of some new interactions or dependencies
between the subprocesses of the modeled system.
Int. J. Mol. Sci. 2020, 21, 3348 5 of 34
2.1.2. MCT Sets
As we have explained before, a support of a t-invariant is a set of transitions. Such a set defines
some minimal subnet representing a subprocess in the biological system. Within the supports some
common sets of transitions can be identified and they are called Maximal Common Transition (MCT)
sets. Such an approach is especially valuable when the number of t-invariants is too high to analyze
them individually (this is the case for the presented model, with 2588 minimal t-invariants). MCT
sets contain transitions being elements of supports of exactly the same t-invariants. Each MCT set
corresponds to some functional module of the modeled system whose biological meaning should
be determined. It is easy to see that a support of every t-invariant is a collection of some MCT sets
(some of them may contain only one element and are called trivial MCT sets). Hence, the results of the
t-invariant clustering can be analyzed in the context of dependencies among MCT sets [17].
2.1.3. t-Clusters
In order to find such similarities, t-invariants can be grouped into structures called t-clusters
(consisting of similar t-invariants and interpreted as biological functional modules) [17]. As a general
rule for clustering one can assume that the elements of a given t-cluster (i.e., a set of transitions) are
more similar to each other than to elements of any other t-cluster. The similarities between t-invariants
are looked for among elements of each t-cluster [18–21]. Such clusters can be calculated using standard
clustering methods (c.f. [20]). However, some important decisions when calculating clusters must be
made. The first two of them concern the selection of clustering (joining) algorithm and a similarity
measure. A proper similarity measure must take into account that in a case of t-invariants, their
non-zero entries correspond to distinct, different transitions in the net. The third decision concerns the
selection of the number of clusters that must divide t-invariants (representing system processes) into
biologically relevant groups. To evaluate the clusters we have used the Mean Split Silhouette (MSS)
evaluation index [22] to identify the best clustering with the optimal number of t-clusters (c.f. [20]).
After comparing multiple sets of clusters being the results of combinations of such aforementioned
decisions, we have decided that our analysis will rely on the clusters obtained using the Unweighted
Pair Group Method with Arithmetic Mean (UPGMA) joining algorithm and the correlated Pearson
similarity measure, which seems to usually give best results in t-clusters analysis of Petri net [17].
2.1.4. Knockout Analysis
Knockout analysis has been performed in two different ways. The first one is based on t-invariants
as described in [23], the second on the net simulation. For easier distinction between them the
first one will be called invariants knockout or simply knockout, while the second one will be called
simulation knockout.
In the invariants knockout, some selected transitions can be excluded from the model and the
remaining invariants examined (i.e., the ones without the chosen, knocked out transitions in their
supports). The remaining invariants may not fully cover the net. Therefore transitions that are not
covered due to the knockout of some other ones are considered disabled. They are classified as
dependent on the ones that have been initially knocked out. From the biological point of view it
is interesting to detect which parts of the model will be affected by the knockout of the selected
transitions. It can also be investigated which transitions should be knocked-out to achieve a desired
model behavior.Int. J. Mol. Sci. 2020, 21, 3348 6 of 34
The second type of knockout involves the simulation of the net and analyzing tokens distribution
in places when some transitions have been knocked out in the model. In this type of approach a
series of simulations are being performed, all starting from the same initial marking and ending
after achieving the same number of steps. During a normal net simulation (i.e., without anything
knocked out) an enabled transition has 50% chances for being fired. Additionally, multiple transitions
can fire simultaneously in the same step if the number of tokens in all their pre-places allows it.
Fired transitions consume tokens from their pre-places and produce them in post-places in a number
defined by the weights of proper arcs. The chances of firing for all of the transitions as well as the sum
of all accumulated tokens in the net places are gathered and averaged, taking into account the number
of simulations. A simulation knockout, on the other hand, is a type of simulation performed when
some transitions are marked as knocked out. Such transitions will never fire, no matter how many
tokens are present in their pre-places. Using this type of simulation an influence of a knockout of some
important reactions on the rest of the model can be studied.
As an example a simple net is given in Figure 2.
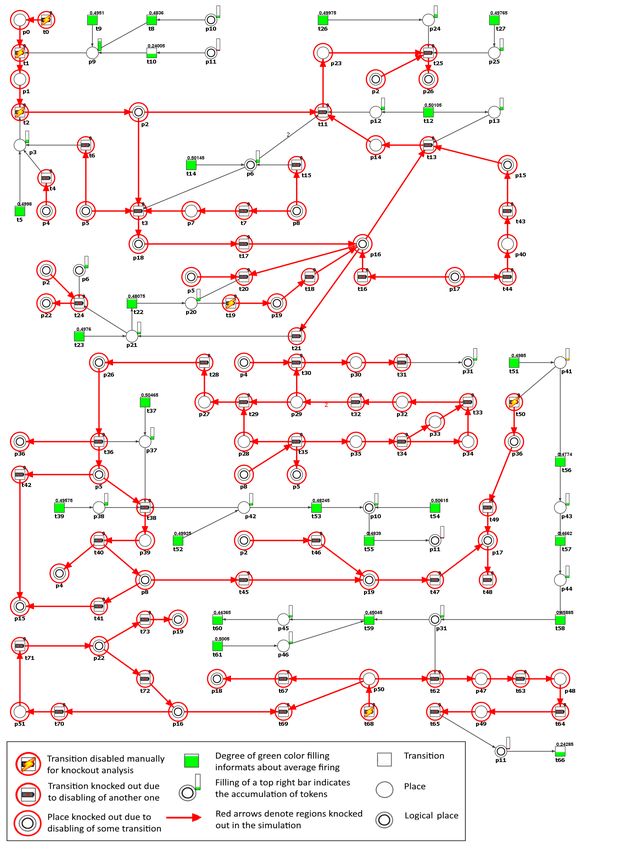
Figure 2. Example results of t-invariants knockout (left) and simulation knockout (right). In the left
picture t0 and t3 (in blue) belong to the same MCT as t1 , while transitions covered in black are knocked
out. Only t6 and t8 remained active, i.e., they are in the support of unaffected t-invariant. In the right
picture the area colored in red do not function due to lack of tokens in p2 caused by t1 knockout.
Other transitions still work and their average firing is given as a value above them. For working places
the filling of a small bar represent total accumulation of their tokens in the simulation.
In the left part of Figure 2 there are results from the first type of knockout approach, proposed
in [23]. The net is covered by 6 t-invariants: x0 = {0, 0, 0, 0, 0, 0, 1, 0, 1}, supp(x0 ) = {t6 , t8 },
x1 = {1, 1, 2, 1, 0, 0, 0, 1, 0}, supp(x1 ) = {t0 , t1 , t2 , t3 , t7 }, x2 = {1, 1, 0, 1, 0, 2, 2, 1, 0}, supp(x2 ) =
{t0 , t1 , t3 , t5 , t6 , t7 }, x3 = {1, 1, 2, 1, 1, 0, 0, 0, 1}, supp(x3 ) = {t0 , t1 , t2 , t3 , t4 , t8 }, x4 = {1, 1, 1, 1, 1, 1, 0, 0, 0},
supp(x4 ) = {t0 , t1 , t2 , t3 , t4 , t5 }, x5 = {1, 1, 0, 1, 1, 2, 1, 0, 0}, supp(x5 ) = {t0 , t1 , t3 , t4 , t5 , t6 }. Of these,
five (x1 –x5 ) contain transition t1 in their supports and its knockout will disable these invariants.
In other words, without the t1 such processes represented by t-invariants will no longer be balanced,
e.g., without t1 , transition t3 will in theory consume tokens from p2 (if any will be available) which will
never be replaced without t1 being active. Transitions t6 and t8 belong to the support of t-invariant x0 ,
which does not contain t1 in its support and as a result they are not affected by the t1 knockout.
The process represented by x0 is the only one that is still balanced in a scenario when t1 does
not function.
The right part of the Figure 2 shows an example of a simulation knockout. One can see that
knockout of t1 completely stops tokens production in p2 , and as a result t3 , t4 and t7 will never beInt. J. Mol. Sci. 2020, 21, 3348 7 of 34
enabled in such a scenario. The other transitions can still fire and their average chance of firing
gathered in a simulation is given as a value above their symbol. Average tokens residing in each place
in comparison to other places is given as a partly filled bar slightly above and to the right of each
place symbol.
2.2. Description of Essential Hypertension-Related Phenomena That Were Taken into Account for Building
the Model
This subsection shows the modeled disorder, divided into thematic blocks with their detailed
features, along with the corresponding place and transition symbols that are included in the model.
Both places and transitions are determined by the notation p a and tb , where a and b are their respective
numbers from Tables 1 and 2.
Table 1. The list of places of the model.
Place Biological Meaning References Place Biological Meaning References
T lymphocytes in adventitia and
p0 angiotensinogen [24–26] p26 [27,28]
perivascular adipose tissue
p1 angiotensin I [24] p27 bradykinin and BR1 complex [27]
p2 high angiotensin II [24–26,29,30] p28 BR1 [27]
p3 ACE on vascular endothelium [24,26] p29 bradykinin [27,29]
p4 BR2 in EC [27] p30 bradykinin and B2R complex [27]
p5 TNF alpha [24–26,28,31] p31 VEGF-C [32]
p6 AT1R [24–26,30] p32 kalikrein [27]
p7 ET1 [24,25] p33 XII factor [27]
p8 C-reactive protein (CRP) [25,26,33] p34 HMWK with zinc [27]
damaged endothelium with
p9 prorenin-renin axis [24,25] p35 [27]
platelets aggregation
p10 high PGI2 [24] p36 IL-17 [11,28]
p11 lower blood pressure [24,27] p37 increase in IFN gamma [28]
p12 T lymphocytes [11,26,34] p38 TNFR1 [24]
APC (macrophages, lymphocytes
p13 [11,28] p39 TNF alpha-TNFR1 complex [24]
B and dendritic cells)
p14 APC cells with neoantigens [28,34] p40 shear stress [28]
Na bound to glycosaminoglycans
p15 neoantigens [28,34] p41 [35]
in interstitium
p16 superoxide anion [24,25,32,34] p42 AT2R [24,29]
p17 high blood pressure [30] p43 attracted MPS [35]
p18 NADPH oxidase activated [24,25] p44 TonEBP [35]
p19 low NO [24–26] p45 VEGF-C and VEGFR3 complex [32]
p20 low eNOS coupled [24–26] p46 VEGFR3 [32]
p21 ADMA [26,30] p47 VEGF-C and VEGFR2 complex [32]
p22 eNOS uncoupled [24,26,30,31,33] p48 high eNOS coupled [31]
p23 Th lymphocytes [34] p49 high NO [29,31]
p24 CCR5 [28] p50 VEGFR2 [32]
p25 RANTES [28] p51 peroxynitrite (ONOO anion) [24,30]Int. J. Mol. Sci. 2020, 21, 3348 8 of 34
Table 2. The list of transitions of the model.
Transition Biological Meaning References Transition Biological Meaning References
t0 angiotensinogen synthesis [24,25] t37 IFN gamma synthesis as response for LPS [26]
t1 angiotensinogen with renin binding [24,25] t38 TNF alpha with TNFR1 binding [28]
t2 angiotensin I with ACE binding [24,25] t39 TNFR1 expression [28]
t3 NADPH oxidase activation via AT1R [24,25] t40 acute phase reaction [27,34]
t4 ACE influenced by BR2 [27] t41 increase in neoantigens formation [28]
t5 ACE synthesis by vascular endothelium [24,25] t42 neoantigens formation [28]
t6 ACE influenced by TNF alpha [31] t43 neoantigens formation under shear stress [28]
t7 synthesis and stimulation of ET1 release [24,25] t44 shear stress influenced by high blood pressure [28]
t8 stimulation of prorenin-renin axis caused by PGI2 and PGE2 [25] t45 reducing the activity of eNOS by CRP [33]
t9 sympathetic stimulation under stress [24] t46 reduction of the bioavailability of NO [24,31]
t10 decrease in renal perfussion [24,25] t47 vasoconstriction [11]
t11 T lymphocytes activation and proliferation via AT1R [34] t48 hypertension [30]
t12 the immune system activation via inflammation [34] t49 blood pressure increasing [30]
t13 APC with neoantigens binding [28] t50 induction of Th 17 [28]
t14 AT1R source [24–26,30] t51 osmotically independent binding of Na in interstitium [35]
t15 increased AT1R at vascular smooth muscles [24–26] t52 AT2R expression [29]
t16 superoxide anion generation via high blood pressure [24,25] t53 AT2R mediated PGI2 production by endothelial cells [29]
t17 superoxide anion generation via NADPH oxidase [24,25] t54 synthesis of PGI2 by endothelial cells [24]
t18 superoxide anion generation via low NO [31] t55 lowering blood pressure by PGI2 [24]
the immune system activation in interstitium under local
t19 decreased NO synthesis by endothelial cells [31] t56 [35]
hypertonic state
t20 eNOS expression significantly attenuated by TNF alpha [31] t57 TonEBP synthesis under local hypertonic state [35]
t21 induction of ADAMA synthesis by oxidative stress [30] t58 VEGF-C activation [32]
t22 eNOS expression significantly attenuated by ADMA [26] t59 VEGF-C with VEGFR3 binding [32]
t23 early hypertension or kidney disease [26] t60 modification of lymph capillary network via VEGFR3 [32]
t24 eNOS uncoupled formation [30,31,33] t61 process in lymphatic endothelium [32]Int. J. Mol. Sci. 2020, 21, 3348 9 of 34
Table 2. Cont.
Transition Biological Meaning References Transition Biological Meaning References
t25 migration of Th lymphocytes into the blood vessels [11] t62 VEGF-C with VEGFR2 binding (canonical signaling) [32]
eNOS synthesis induction, calcium and
t26 increased expression of CCR5 [28] t63 [32]
phosphorylation dependent
t27 RANTES influenced by TNF-TNFR axis [28] t64 NO increase [32]
t28 ICAM1, VCAM1 and PECAM endothelial stimulation [27] t65 muscles relaxation [31]
t29 bradykinin with BR1 binding [27] t66 health [32]
t30 bradykinin with BR2R binding [27] t67 NADPH oxidase activation via VEGFR2 [24]
t31 stimulation of VEGF-C formation by bradykinin-B2R complex [27,32] t68 vascular endothelium VEGFR2 expression [32]
t32 bradykinin formation [27] t69 VEGF pathway (ligand independent, non canonical signaling) [32]
t33 prekalikrein and kalikrein formation [27] t70 peroxynitrite (ONOO anion) formation [24,30]
t34 increase in HMWK with zinc and XII factor [27] t71 oxidation of BH4 (eNOS cofactor) [24,30,31]
t35 chronic inflammatory process [27,34] t72 superoxide anion synthesis by eNOS uncoupling [33]
t36 the local release of cytokines (local inflammation) [27,34] t73 low NO synthesis [24,31]Int. J. Mol. Sci. 2020, 21, 3348 10 of 34
In the proposed model there was no single overarching process. It was built based on several
main processes that were introduced to the model based on current medical knowledge, clinical
experience of the authors and some research hypotheses. To make the model easier to understand
Figure 3, which shows a block diagram of factors/processes underlying essential hypertension and
their interrelationships in the model, is presented.
Renin-angiotensin system (RAA)
• responsible for blood pressure and sodium Increased central blood volume
balance regulation A novel extra-renal mechanism for
and cardiac output in a course of increase of NaCl intake
• When blood volume or sodium levels in the buffering dietary salt
body are low, or potassium is high, cells in the during salt loading, skin Na concentration
kidney release renin into the blood. Renin acts hypertensive stimuli, increased and the hypertonicity causes
on its target - angiotensinogen (produced in such as Ang II Immune system activation recruitment of macrophages which
the liver) and cleaves its into physiologically initial elevation in blood pressure (pre- activate TonEBP that increases the
inactive angiotensin I, whose conversion into hypertension), which results in protein expression of VEGF-C
angiotensin II (Ang II) is catalyzed by an modifications; elevated production of TNF-
enzyme called angiotensin converting enzyme by different immune cells
(ACE). Finally, Ang II binds to AT1 and AT2 increases in activity of
formation of neoantigens
receptors. Circulating monocytes epithelial sodium
leads to T cell activation; T channels (ENaCs) that
(precursors of macrophages) cells are required for the full are sensitive to stretch
Ang II a potent stimulator of NAD(P)H infiltrating macrophages release development of angiotensin pressure and shear
oxidase, which is the major source and pro-inflammatory mediators and are stress
II–induced hypertension,
primary trigger for reactive oxygen species the major sources of oxidative stress important role of IL-17
(ROS) generation in various tissues
protein modifications Neoantigenes
Oxidative stress due to oxidative (antigens that are not identified as
•sources: NAD(P)H oxidase and uncoupled eNOS alterations stimulate self)
•oxidation reaction of lipids in the blood vessels neoantigens synthesis
• inflammatory proces induction
• membranes leading to inflammation (oxidation reaction of lipids in the
blood vessels membranes leading
to inflammation)
Reaction of NO and ROS
NO/ROS balance
depletes NO bioactivity • adaptive immunity activation
Endothelial stimulation/dysfunction
Disturbances in nitric oxide (NO) activity decrease in NO bioavailability as • endothelial inflammatory activation VEGF-C
NO - endothelial nitric oxide synthase a result of endothelial • endothelial cell stiffnes induces
expression
(eNOS) axis dysfunction • mechanoreceptor signalling, importance of shear of (eNOS)
• NO plays a major role in regulating blood pressure stress
• in hypertension eNOS becomes dysfunctional and
produces ROS rather than NO
• In salt-sensitive subjects, increase in salt intake
may induce increase in asymmetrical Subnormal vasodilatation
dimethylarginine (ADMA) levels by both Increased in blood pressure
promoting oxidative stress- induced decrease of
ADMA metabolism and increase in ADMA
synthesis.
Figure 3. The diagram of the role of inflammation and immunity in essential hypertension. The orange
blocks represent known factors affecting primary hypertension. Gray blocks include processes/factors
whose involvement in hypertension is increasingly recognized.
2.2.1. RAA System Pathway, in the Liver, Lungs and Kidney
RAA (t0 , t1 , t2 , t5 , t10 ) is a physiological system that regulates blood pressure and fluid balance in
the body [36]. First, cells in the kidney release the enzyme, prostaglandin (PGE2 (p10 )) and sympathetic
stimulation under stress (t63 ). Renin catalyzes the conversion of angiotensinogen (p0 ) to angiotensin
I (p1 ). Then angiotensin-converting enzyme (ACE in lungs (p3 )) converts angiotensin I (p1 ) into
renin (p9 ). This process is stimulated by decreased blood flow to the kidneys (t10 ), prostacyclin
(PGI2 (p10 )) and angiotensin II (p2 ). Angiotensin II acts via at least four different subtypes of
angiotensin receptors (ATRs). In the presented model we included two of them, whose roles are
fairly well-documented, i.e., type 1 (AT1R (p6 )) and type 2 (AT2R (p42 )). High level of angiotensin
II (p2 ) through its interactions with the AT1R together with tumor necrosis factor alpha (TNF alpha
(p39 , p38 , p5 )) and endothelin 1 (ET1 (p7 )) participates in the activation of NADPH oxidase (t3 , t17 ,
p18 ) resulting in increased generation of superoxide (reactive oxygen species (ROS) (t3 , p18 , t17 , p16 ,
t67 )). Next, from the biradical reaction of superoxide (p16 ) and NO (p19 ) peroxynitrite (p51 ) is formed.
This reaction depletes NO bioactivity (p51 , t71 , p22 , t73 and p19 ) and promotes hypertension [24].
Opposing to the vasoconstrictor action of AT1R (p6 ), angiotensin II (p2 ) mediates vasodilation through
the AT2R pathway. There is a link between AT2R (p42 ) and vasodilators including NO (p49 ) and
bradykinin (p29 ) [29]. The kinin-kallikrein system creates bradykinin (p29 ) by proteolytic cleavage
of its high-molecular-weight kininogen (HMWK (p34 , t33 , p33 and p32 )) precursor, whose synthesis
is stimulated by chronic inflammation (t35 , p35 , t34 , p33 , p34 and p26 ). Bradykinin (p29 ) mediates its
actions via two different types of receptors, i.e., non-constitutively expressed bradykinin receptor type
1 (BR1 (p28 , p27 , t29 and t28 )) and consitutively expressed bradykinin receptor type 2 (BR2 (p4 , p30 and
t30 )). BR1 can be induced by inflammation (p28 and t35 ) and it modulates cardiovascular functions ofInt. J. Mol. Sci. 2020, 21, 3348 11 of 34
bradykinin during chronic local inflammation (t36 and t28 ). On the other hand, BR2 is constitutively
expressed in many tissues, e.g., vascular endothelium and smooth muscle cells and it mediates most of
the vascular functions of bradykinin (t4 ) [27]. ACE also breaks down the vasodilator bradykinin (p29 )
into inactive fragments.
2.2.2. Activation of the Immune System and the Formation of Neoantigens, Occurring in the
Vascular Endothelium
The immune system activation (t11 and t12 ) [34] is one potential mechanism by which
inflammation (t35 ) may promote hypertension. T-effector cells (p12 ) interact with innate immune
mechanisms (p14 ) to increase the inflammatory response via production of many cytokines (t36 ) and
ROS (p16 ). An activated lymphocytes, particularly T lymphocytes may play an ongoing chronic
inflammation, which is a source of infective antigens or neoantigens—modified molecules that are no
longer recognized as self (p15 , t41 ) in the organism. This can occur in response to many disturbances,
such as the release of a molecules that are generally intracellular, oxidative modification of proteins,
lipids or nucleic acids, cleavage of proteins what exposes intramolecular sites normally not being
available for immune attack [28] or influence of increased shear stress (p40 , t43 and t44 ). Neoantigens
are processed in antigen presenting cells (APC (p13 , p14 and t13 )) and presented within a major
histocompatibility complex. They activate T cells that leave secondary lymphoid organs and are
targeted to sites of inflammation, i.e., the kidney and vasculature. Lymphocytes migration (p12 ,
p26 ) is stimulated, inter alia, by the chemokine regulated on activation, normal T-cell expressed and
secreted (RANTES) (p25 ), which production increases under the influence of hypertensive stimuli,
like angiotensin II (p2 ). Concomitantly, in hypertension, an increased expression of CCR5 (receptor for
RANTES (t26 and p24 )) is observed, what leads to the migration of lymphocytes into the perivascular
space, where cytokines, such as tumor necrosis factor alpha (TNF alpha (p5 , p38 , p39 , t68 , t38 , t39 and
t27 )), interferon gamma (IFN-gamma (p37 )) and interleukin 17 (IL-17 (t50 , p36 )) are released [37,38].
T cell derived signals like IL-17 promote an entry of other inflammatory cells, such as macrophages.
These inflammatory cells release cytokines that cause vasoconstriction and promote sodium and water
absorption, ultimately leading to severe hypertension [11].
2.2.3. Novel Extra-Renal Mechanism for Buffering Dietary Salt in the Interstitium of the
Skin—Probably an Additional System Affecting the Response to Salt Load and Blood Pressure
in Humans
Recent discoveries have shown that macrophages act as local sensors and regulators of electrolyte
composition in the interstitium of the skin [39]. The electrolytes in the skin do not readily equilibrate
with plasma, and hence escape homeostatic control in the kidneys. Titze and colleagues [35,37]
found that the traditional concept of the sodium homeostasis regulation, determining the level of the
body’s volumes and blood pressure in the human organism, is much more complicated than it has
been expected. Sodium can be stored without accumulation of water in the subdermal interstitium
at hypertonic concentration via interactions with proteoglycans (p41 ). This becomes a stimulus for
mononuclear phagocyte system (MPS) (p43 ) for the inflow to the interstitial space, under a local
hypertonia (induced by sodium concentration), and for secreting TonEBP (t57 ) that activates VEGF-C
(t58 , p31 ). VEGF-C can bind to one of its two canonical receptors. If it binds to VEGFR3 (p45 ), then it
leads to hyperplasia of lymph capillaries (t60 ). If it is bound to VEGFR2 (p31 , t62 ), it enhances production
of NO. In addition, there is non-canonical signaling, i.e., VEGF-independent activation of VEGF
receptors, in a course of excessive production of ROS (p16 and t69 ) [12,32].
2.2.4. NO-eNOS Axis Affecting the Vascular Endothelium
NO (p40 ) is released from endothelial cells and plays an important role in preserving the
endothelial vasodilatation and inhibiting the vasoconstriction triggered by angiotensin II (t65 ). It is
recognized as one of the major mediators of the maintenance of vascular homeostasis. A decreaseInt. J. Mol. Sci. 2020, 21, 3348 12 of 34
in bioavailability of NO (t46 and t73 ) is associated with endothelial dysfunction, which can alter the
rates of synthesized and degraded vasoconstrictors and vasodilators leading to hypertension. NO is
derived from endothelial nitric oxide synthase (eNOS) in the vessels in the presence of the cofactor
tetrahydrobiopterin (BH4 (t71 )) and mediated through a cGMP-dependent downstream signaling
cascade. In general, increased eNOS expression is considered to be beneficial. However, in various
pathophysiological conditions, the function of eNOS is altered and it produces superoxide instead of
NO, which is associated with reduced endothelium-dependent vasodilatation. This state is referred
to as the uncoupled state of eNOS (t24 , p22 ) [31] and is aggravated by asymmetric dimethylarginine
(ADMA (t21 , p21 )), AT1R (p6 ) and high levels of angiotensin II (p2 ). Peroxynitrite (p51 , t70 ) also
uncouples eNOS by oxidation of BH4 which serves as a critical cofactor for eNOS (p51 , t71 and
p22 ) [30]. Consequently, the loss of NO bioactivity associated with increased vascular superoxide plays
a potentially important role in the pathogenesis of hypertension (t49 , p17 and t48 ).
3. Results and Discussion
3.1. The Model Presentation and the Results of Its Formal Analysis
The proposed Petri net based model is in Figure 4 and is available at http:/www.cs.put.poznan.
pl/arybarczyk/Hypertension/.
It contains 52 places and 74 transitions whose names are listed in Tables 1 and 2, respectively.
In the model, some places shown as two concentric circles exist in multiple copies, which are
logically identical (e.g., p13 ). Those places are called logical ones and their role is to improve model
readability and simplify the visualization of connections between vertices. The net does not contain
any information connected with the reaction speed nor exact amounts of reactants and products.
However, important and interesting information about the described biological process can be derived
from the structural analysis of the net [14,40]. Hence, the model itself is a very significant result.
The studied net is pure, i.e., there are no two nodes connected in both directions. The model is
also not ordinary (i.e., there are weights greater than 1), because not every stoichiometric coefficient
of each modeled reaction is equal to 1. Furthermore, the net is connected but not in a strong sense.
It means that there exists an undirected path between any two places, but there may not be a directed
path between them, what implies that there are no independent processes within the analyzed model.
Moreover, the net is not structurally conflict-free because it contains places with two or more outgoing
arcs. This entails that there are reactions sharing at least one substrate. Since the net is not ordinary,
also the property of non-blocking multiplicity does not hold. The model contains neither input places
nor output places (i.e., places without pre-transitions or post-transitions, respectively), but there exist
a few input and output transitions. The net is also unbounded since there are no upper bound on the
number of tokens.
The model contains 2588 minimal t-invariants covering all transitions (i.e., each transition belongs
to a support of at least one t-invariant) and no p-invariant. The smallest supports of t-invariants consist
of three transitions, e.g., a support of t-invariant x2 includes transitions t70 , t71 and t72 . The five largest
supports of t-invariants, x1477 , x1709 , x1728 , x1773 and x2511 , contain 44 transitions each. Transitions t0
(angiotensinogen synthesis), t1 (angiotensinogen with renin binding) and t2 (angiotensinogen I with
ACE binding) are of crucial importance for the network behavior because they occur in more than 98%
of all supports of t-invariants. Except for five t-invariants, supports of all other ones contain input
transitions and apart from 131 t-invariants, supports of all other contain output transitions.
In the net there are 10 non-trivial MCT sets listed in Table 3. All of them represent connected
subnets and give a better insight into understanding the analyzed phenomenon. The results based
on the clustering using UPGMA algorithm show that in the studied process one can distinguish one
huge cluster c4 covering almost the whole net (about 99% of t-invariants) and five clusters (c1 –c3 , c5 –c6 )
containing small numbers of t-invariants. These clusters (six functional blocks), which are assigned a
biological relevance, are presented in Table 4. This can be a unique feature of the analyzed biologicalInt. J. Mol. Sci. 2020, 21, 3348 13 of 34
process, where most of the subprocesses within the analyzed system are highly interconnected and
interdependent. However, the results of the clustering are not satisfactory because it is very difficult to
draw valuable biological conclusions without further analysis of the model.
Figure 4. The Petri net based model. Non-trivial Maximal Common Transition (MCT) sets are marked
by accordingly labeled rectangles. The transitions within a given MCT sets are shown with different
colors. Logical places are shown as two concentric circles and are denoted by their names. The places
and transitions are represented by both their names and numbers.Int. J. Mol. Sci. 2020, 21, 3348 14 of 34
As a next step of the analyses we conducted a knockout analysis. First, to analyze the knockout
behavior of the model the impact of disabling some single activity (e.g., reaction) have to be determined.
These activities are represented by MCT sets (non-trivial and the trivial ones, the latter being simply
single transition). The impact of turning off a single activity on the analyzed net is measured as the
percentage of t-invariants and what follows transitions affected by it. According to the authors of [23],
the transitions in the model that are affected by a knockout of some other chosen transitions are those
which belong only to the supports of the same t-invariants as the knocked-out ones (i.e., if a transition
belongs to a support of at least one t-invariant which is not affected by a knockout of some other
transitions, it is considered as being unaffected by it as well). We noticed, basing on the analysis
supported by simulation knockout of the net, that in many cases the knockout of a given MCT set
entails the inactivity of transitions that should not be affected as defined above. Therefore, we decided
to conduct the knockout analysis based on both simulation knockout using Holmes software [41] and
the approach described in [23] with the use of MonaLisa software [42]. All transitions detected by the
simulation knockout to be inactive (along with the t-invariants they are involved in) and not included
in the calculations of the selected activity knockout impact (according to MonaLisa) were included in
the results presented in Table 5.
Table 3. The list of non-trivial MCT sets.
MCT-Set Contained Transitions Biological Interpretation
The initiation of blood coagulation, and the generation
m1 t28 , t29 , t30 , t31 , t32 , t33 , t34 , t35
of bradykinin via the kallikrein-kinin system
Lymphocytes T activation in hypertension—as a part of
m2 t11 , t12 , t13 , t25 , t26 , t27
immune system defense
The participation of TNF alpha in the activation of the
m3 t36 , t38 , t39 , t40
acute phase response in the course of hypertension
Impact of VEGF-C—VEGFR2 axis on the nitric oxide
m4 t62 , t63 , t64 , t65
synthesis and relaxation of vascular smooth muscles
Angiotensinogen-angiotensin axis activation leading to
m5 t0 , t1 , t2
angiotensin II formation
Local activation of the immune system due to changes
m6 t56 , t57 , t58 in the local hypertonia associated with the activation of
VEGF-C
Impact of the VEGF-C—VEGFR3 axis on the lymphatic
m7 t59 , t60 , t61
endothelium
Activation of key enzymes of oxidative stress (NADPH
m8 t3 , t7
oxidases) through AT1R
The influence of shear stress on the formation of
m9 t43 , t44
neoantigens and increased arterial blood pressure
Peroxynitrite formation as a part of oxidative stress
m10 t70 , t71
signaling pathwayInt. J. Mol. Sci. 2020, 21, 3348 15 of 34
Table 4. The 2588 feasible t-invariants of the model clustered by Unweighted Pair Group Method with Arithmetic Mean (UPGMA) algorithm. In the two columns on
the right side of the table, the processes contained in the clusters are listed. Processes are divided into non-trivial MCT sets and single transitions. The numbers
presented in brackets are fractions (a number of supports of t-invariants from a given t-clusters containing a given process)/(a number of supports of t-invariants from
all other t-clusters containing a given process)%. The lack of any number means that a given transition or MCT-set occurs only in supports of t-invariants being
elements of a given t-cluster. The columns on the left side give the total number of t-invariants in the cluster, together with its biological interpretation.
Contained Processes
Cluster No. Biological Interpretation No. of t-Invariants
MCT-Sets Single Transitions
The local changes in the interstitium due to
c1 fluctuations in the local independent osmotic 1 m6 (0.9), m7 (0.1) t51 (0.86)
sodium concentration
t16 (0.11), t17 (0.13), t18 (0.11), t47 (0.20),
Formation and effects of reactive oxygen
c2 4 m10 (13.3) t48 (0.06), t67 (0.39), t68 (0.05), t72 (0.24),
species on hypertension
t73 (0.60)
Processes mediated by PGI2, resulting in the
t52 (0.04), t53 (0.13), t54 (0.13), t55 (0.33),
c3 reduction of blood pressure and maintenance of 2
t66 (0.33)
health state
t4 , t5 , t6 , t8 , t9 , t10 , t14 , t15 , t16 (99.58),
t17 (99.60), t18 (99.68), t19 (98.47), t20 ,
The influence of oxidative stress and
m1 , m2 , m3 , m4 , m5 , t21 (99.10), t22 (95.89), t23 (99.57), t24 , t37 , t41 ,
inflammation on vascular endothelium in the
c4 2572 m6 (99), m7 (99.9), m8 , m9 , t42 , t45 , t46 , t47 (99.41), t48 (99.77), t49 (99.92),
course of arterial hypertension without changes
m10 (87) t50 (75.00), t51 (97.41), t52 (99.96), t53 (99.87),
regarding the lymphatic endothelium
t54 (99.87), t55 (99.67), t66 (99.67), t67 (98.84),
t68 (99.69), t69 (99.50), t72 (99.76), t73 (99.40)
Processes leading to hypertension, t16 (0.11), t48 (0.06), t49 (0.08), t50 (25.00),
c5 2
with particular emphasis on the role of IL-17 t51 (1.72), t68 (0.05), t69 (0.12)
Processes leading to hypertension, t16 (0.21), t17 (0.27), t18 (0.21), t19 (1.53),
c6 with particular emphasis on the effect of nitric 7 t21 (0.90), t22 (4.11), t23 (0.43), t47 (0.39),
oxide, the role of ADMA and VEGFR2 t48 (0.11), t67 (0.77), t68 (0.21), t69 (0.37)Int. J. Mol. Sci. 2020, 21, 3348 16 of 34
Table 5. The most important activities in the model according to their combinatorial knockout impact
calculated based on both simulation knockout and the approach described in [23]. In the calculation of
the knockout impact in the case of transitions, only the inactive ones, according to simulation knockout,
were taken into account.
MCT-Set Activity Knockout Impact Knockout Impact
t5 ACE synthesis by vascular endothelium 33.78% 99.73%
angiotesinogen-angiotensin axis activation leading to
m5 28.38% 99.34%
angiotensin II formation
t14 AT1R source 31.08% 99.23%
the influence of shear stress on the formation of neoantigens
m9 31.08% 99.23%
and increased arterial blood pressure
lymphocytes T activation in hypertension as a part of immune
m2 27.03% 98.92%
system defense
t52 AT2R expression 22.97% 97.68%
t49 blood pressure increasing 0.00% 96.87%
the participation TNF alpha in the activation of the acute
m3 22.97% 96.79%
phase response in the course of hypertension
the initiation of blood coagulation, and the generation of
m1 0.00% 92.39%
bradykinin via the kallikrein-kinin system
t4 ACE influenced by BR2 0.00% 88.79%
t68 vascular endothelium VEGFR2 expression 8.11% 74.03%
t48 hypertension 0.00% 68.47%
impact of the VEGF-C—VEGFR2 axis on the nitric oxide
m4 0.00% 55.91%
synthesis and relaxation of vascular smooth muscles
t37 IFN gamma synthesis as response for LPS 0.00% 53.40%
t10 decrease in renal perfussion 0.00% 50.50%
t15 increased AT1R at vascular smooth muscles 0.00% 43.51%
t47 vasoconstriction 0.00% 39.26%
impact of the VEGF-C—VEGFR3 axis on the
m7 0.00% 38.68%
lymphatic endothelium
t8 stimulation of prorenin-renin axis caused by PGI2 and PGE2 0.00% 38.25%
t16 superoxide anion generation via high blood pressure 0.00% 36.51%
t18 superoxide anion generation via low NO 0.00% 36.40%
t24 eNOS uncoupled formation 0.00% 34.47%
t45 reducing the activity of eNOS by CRP 0.00% 31.72%
t69 VEGF pathway (ligand independent, non canonical signaling) 0.00% 31.11%
t53 AT2R mediated PGI2 production by endothelial cells 0.00% 30.80%
t54 synthesis of PGI2 by endothelial cells 0.00% 30.80%
t17 superoxide anion generation via NADPH oxidase 0.00% 29.02%
t23 early hypertension or kidney disease 0.00% 27.13%
t6 ACE influenced by TNF alpha 0.00% 25.70%
t66 health 0.00% 23.76%
t55 lowering blood pressure by PGI2 0.00% 23.34%
t42 neoantigens formation 0.00% 23.18%
t73 increase in neoantigens formation 0.00% 19.36%
t41 low NO synthesis 0.00% 19.32%Int. J. Mol. Sci. 2020, 21, 3348 17 of 34
Table 5. Cont.
MCT-Set Activity Knockout Impact Knockout Impact
t46 reduced bioavailability of NO 0.00% 19.24%
activation of a key enzymes of oxidative stress (NADPH
m8 0.00% 19.13%
oxidases) through AT1R
t9 sympathetic stimulation under stress 0.00% 19.13%
t72 superoxide anion synthesis by eNOS uncoupling 0.00% 16.27%
t19 decreased NO synthesis by endothelial cells 0.00% 15.19%
t21 induction of ADAMA synthesis by oxidative stress 0.00% 12.94%
t67 NADPH oxidase activation via VEGFR2 0.00% 10.01%
t20 eNOS expression significantly attenuated by TNF alpha 0.00% 9.81%
t22 eNOS expression significantly attenuated by ADMA 0.00% 5.64%
t51 osmotically independent binding of Na in interstitium 5.41% 4.48%
local activation of the immune system due to changes in the
m6 0.00% 4.21%
local hypertonia associated with an activation of VEGF-C
peroxynitrite formation as a part of an oxidative stress
m10 0.00% 1.16%
signaling pathway
t50 induction of Th 17 0.00% 0.31%
3.2. The Biological Questions We Answered on the Basis on the Knockout Analyzes
Scenario 1. The influence of RAA blockage on the essential hypertension development.
The importance of the RAA in essential hypertension, with angiotensin II as a key player, is well
established [43]. In the beginning, we imitated the action of angiotensin-converting enzyme inhibitors
(ACEIs) or ATR blockers, drugs commonly used in the hypertension treatment.
We found that according to Table 5, knockout of MCT set m5 —biological interpretation:
angiotensinogen-angiotensin axis activation leading to angiotensin II formation, had a great impact on
the net. To confirm this, we excluded from the model the transitions belonging to m5 and simulated
its behavior. Next, all of the transitions detected in the simulation knockout as inactive were also
removed from the network and the remaining t-invariants were further investigated. Figure 5 shows
the simulation knockout impact of the transitions belonging to m5 , related to the emergence of an
essential hypertension activation through angiotensinogen-angiotensin axis.
The result of the analysis of the m5 knockout impact on the other transitions in the model is
presented in Table 6 whereas on the places in Table 7. It can be easily noticed that m5 knockout
indirectly influenced place p8 (C-reactive protein (CRP), see Table 7) through the inactivation of
transition t40 (acute phase reaction, see Table 6 and Figure 5).
This relationship between RAA blockade and the lack of CRP and TNF alpha (place p5 , see
Table 7) in the net, shows that the efficacy of ACEIs used in cardiovascular diseases was not only in the
inhibition of angiotensin II, but partly in the anti-inflammatory properties of these drugs.Int. J. Mol. Sci. 2020, 21, 3348 18 of 34
Figure 5. Graphical representation of the knockout results for the entire model, upon disabling of the
transitions belonging to m5 . Inactive transitions, according to the simulation knockout, are marked
with red circles. Active transitions are marked with rectangles filled with green or orange color which
indicates whether the activity of a given transition has decreased (partially filled) or stayed intact
(fully filled) as compared to the reference set. The results were obtained using Holmes software [41].Int. J. Mol. Sci. 2020, 21, 3348 19 of 34
Table 6. The impact of m5 knockout. The columns on the right side of the table present each transition activity before and after the knockout of transitions belonging
to m5 . The change in the activity in the case of each transition is shown in the last column. A positive value means that a given transition activity has increased while
the negative one indicates that the transition activity has decreased. The transitions that were manually disabled are denoted as “(Offline)”. Those indicated by
the simulation knockout as inactive due to m5 knockout are marked as “(Knockout)”. Each entry in the table corresponds to the average value coming from 4000
simulation runs, each having 10,000 steps.
Difference in the Transition Activity as
The Transition Activity The Transition Activity in the
Transition Biological Meaning Compared to the Reference and m5
in the Reference Set Set with m5 Knocked out
Knocked out Set
t0 (Offline) angiotensinogen synthesis 50.00% 0.00% −50.00%
t1 (Offline) angiotensinogen with renin binding 49.44% 0.00% −49.44%
t2 (Offline) angiotensin I with ACE binding 49.05% 0.00% −49.05%
t3 (Knockout) NADPH oxidase activation via AT1R 0.60% 0.00% −0.60%
t4 (Knockout) ACE influenced by BR2 2.51% 0.00% −2.51%
t5 ACE synthesis by vascular endothelium 50.00% 50.00% 0.00%
t6 (Knockout) ACE influenced by TNF alpha 3.50% 0.00% −3.50%
t7 (Knockout) synthesis and stimulation of ET1 release 0.63% 0.00% −0.63%
stimulation of prorenin-renin axis caused by PGI2
t8 48.32% 49.41% 1.09%
and PGE2
t9 sympathetic stimulation under stress 49.98% 49.99% 0.01%
t10 decrease in renal perfussion 27.82% 28.45% 0.63%
(Knockout) T lymphocytes activation and
t11 12.21% 0.00% −12.21%
proliferation via AT1R
t12 the immune system activation via inflammation 50.00% 50.01% 0.01%
t13 APC with neoantigens binding 30.87% 19.04% −11.83%
t14 AT1R source 50.01% 50.01% 0.00%
(Knockout) increased AT1R at vascular
t15 0.62% 0.00% −0.62%
smooth muscles
t16 superoxide anion generation via high blood pressure 26.84% 19.06% −7.79%
t17 superoxide anion generation via NADPH oxidase 26.55% 27.67% 1.12%Int. J. Mol. Sci. 2020, 21, 3348 20 of 34
Table 6. Cont.
Difference in the Transition Activity as
The Transition Activity The Transition Activity in the
Transition Biological Meaning Compared to the Reference and m5
in the Reference Set Set with m5 Knocked out
Knocked out Set
t17 superoxide anion generation via NADPH oxidase 26.55% 27.67% 1.12%
t18 superoxide anion generation via low NO 43.17% 32.21% −10.96%
t19 decreased NO synthesis by EC 49.85% 49.42% −0.43%
(Knockout) eNOS expression significantly attenuated
t20 2.31% 0.00% −2.31%
by TNF alpha
t21 induction of ADMA synthesis by oxidative stress 35.15% 30.04% −5.11%
t22 eNOS expression significantly attenuated by ADMA 49.97% 49.98% 0.02%
t23 early hypertension or kidney disease 50.01% 49.99% −0.02%
t24 (Knockout) eNOS uncoupled formation 12.22% 0.00% −12.22%
(Knockout) migration of Th lymphocytes into the
t25 11.80% 0.00% −11.80%
blood vessels
t26 increased expression of CCR5 50.00% 50.00% 0.00%
t27 RANTES influenced by TNF-TNFR axis 50.00% 50.00% 0.01%
(Knockout) ICAM1, VCAM1 and PECAM
t28 0.62% 0.00% −0.62%
endothelial stimulation
t29 (Knockout) bradykinin with BR1 binding 0.62% 0.00% −0.62%
t30 (Knockout) bradykinin with BR2R binding 0.62% 0.00% −0.62%
(Knockout) stimulation VEGF-C formation by
t31 0.62% 0.00% −0.62%
bradykinin-B2R complex
t32 (Knockout) bradykinin formation 0.62% 0.00% −0.62%
t33 (Knockout) prekalikrein and kalikrein formation 0.62% 0.00% −0.62%
(Knockout) increase in HMWK with zinc and
t34 0.62% 0.00% −0.62%
XII factor
t35 (Knockout) chronic inflammatory process 0.62% 0.00% −0.62%You can also read