Accelerating river blindness elimination by supplementing MDA with a vegetation "slash and clear" vector control strategy: a data-driven modeling ...
←
→
Page content transcription
If your browser does not render page correctly, please read the page content below
www.nature.com/scientificreports

            OPEN           Accelerating river blindness
                           elimination by supplementing MDA
                           with a vegetation “slash and clear”
                           vector control strategy: a data-
                           driven modeling analysis
                           Morgan E. Smith1, Shakir Bilal1, Thomson L. Lakwo2, Peace Habomugisha3,
                           Edridah Tukahebwa2, Edson Byamukama3, Moses N. Katabarwa4, Frank O. Richards4,
                           Eddie W. Cupp5, Thomas R. Unnasch6 & Edwin Michael1*
                           Attention is increasingly focusing on how best to accelerate progress toward meeting the WHO’s 2030
                           goals for neglected tropical diseases (NTDs). For river blindness, a major NTD targeted for elimination,
                           there is a long history of using vector control to suppress transmission, but traditional larvicide-based
                           approaches are limited in their utility. One innovative and sustainable approach, “slash and clear”,
                           involves clearing vegetation from breeding areas, and recent field trials indicate that this technique very
                           effectively reduces the biting density of Simulium damnosum s.s. In this study, we use a Bayesian data-
                           driven mathematical modeling approach to investigate the potential impact of this intervention on
                           human onchocerciasis infection. We developed a novel “slash and clear” model describing the effect of
                           the intervention on seasonal black fly biting rates and coupled this with our population dynamics model
                           of Onchocerca volvulus transmission. Our results indicate that supplementing annual drug treatments
                           with “slash and clear” can significantly accelerate the achievement of onchocerciasis elimination. The
                           efficacy of the intervention is not very sensitive to the timing of implementation, and the impact is
                           meaningful even if vegetation is cleared only once per year. As such, this community-driven technique
                           will represent an important option for achieving and sustaining O. volvulus elimination.

                           Large-scale initiatives aiming to control and eliminate neglected tropical diseases (NTDs) have made signifi-
                           cant progress in treating at-risk populations and reducing the transmission and burden of these communicable
                           diseases1. As NTD programmes achieve disease-specific targets set by the World Health Organization (WHO)
                           Roadmap and enter the endgame phase of elimination, priorities will need to shift to adapt to changing trans-
                           mission dynamics2,3. Novel approaches will be required to sustain elimination in the long term in the face of new
                           infection patterns, emerging drug resistance, and socio-political challenges that are associated with the end-
                           game3–5. Identifying the best course of action is not trivial, as complex socio-ecological systems are characterized
                           by significant uncertainties, trade-offs between human action and ecological responses, and nonlinear effects
                           that make elimination unpredictable and difficult to achieve6. Furthermore, attention is also increasingly focused
                           on how best to accelerate progress toward meeting the WHO goals of eradication, elimination, or control of the
                           major NTDs by 20301. Recent work highlights that the development of intensified and diversified strategies are
                           needed to accelerate the achievement of these targets1,5,6.
                              Vector-borne diseases are responsible for a large proportion of the global communicable disease burden1.
                           Vector control (VC) is recognized by the WHO as a major tool to prevent the transmission of vector-borne
                           NTDs, but is generally underused. There is, however, a long history of using VC in control and elimination

                           1
                            Department of Biological Sciences, University of Notre Dame, Notre Dame, IN, USA. 2Vector Control Division,
                           Ministry of Health, Kampala, Uganda. 3The Carter Center, Uganda office, Kampala, Uganda. 4Emory University and
                           The Carter Center, Atlanta, GA, USA. 5Department of Entomology and Plant Pathology, Auburn University, Auburn,
                           AL, USA. 6Department of Global Health, College of Public Health, University of South Florida, Tampa, FL, USA.
                           *email: emichael@nd.edu

Scientific Reports |   (2019) 9:15274 | https://doi.org/10.1038/s41598-019-51835-0                                                           1
www.nature.com/scientificreports/ www.nature.com/scientificreports
efforts, particularly for onchocerciasis7. VC through the application of larvicides was the primary strategy of the
Onchocerciasis Control Programme in West Africa8–10. The Ugandan experience with VC, when used in conjunc-
tion with twice per year treatment with ivermectin (IVM), is also rich and impressive; transmission for example
has been interrupted in 15 of 17 endemic foci using this integrated approach11–19. However, the implementation of
larvicide treatments can be labor-intensive and cost-prohibitive20,21. Insecticide resistance is also a major concern
that threatens the long term success of pesticide-based interventions1. Innovative and sustainable VC interven-
tions to support endgame elimination activities are thus critically needed.
Recently, building on this tradition of using VC for facilitating onchocerciasis elimination and drawing on
similar approaches used previously in Sudan22 and Kenya23, Jacob et al.24 reported on the impact of vegetation
clearing to reduce the biting density of Simulium damnosum sensu stricto, an important vector in the Madi
mid-North focus in northern Uganda. The Jacob et al.24 “slash and clear” trials involved recruiting young men
from villages in northern Uganda and training them to cut trailing vegetation from rivers. The vegetation was
thrown on the riverbanks to dry, thereby killing any attached black fly larvae. Biting rates in the intervention
villages were quickly reduced by up to 89–99%24. Lesser but still significant reductions were observed up to 120
days after the intervention was complete. The intervention was well-accepted by community members who were
motivated to reduce the biting of black flies, and it was inexpensive requiring only basic materials already availa-
ble in the villages. These results of the initial trials suggest that the “slash and clear” technique is highly promising
for interrupting transmission in a cost-effective and sustainable manner.
The impact of “slash and clear” on onchocerciasis transmission and community infection when combined
with mass drug administration (MDA) is, however, unknown. Preventive chemotherapy with ivermectin is the
primary tool used against Onchocerca volvulus transmission, so understanding the value of clearing vegetation in
combination with MDA is crucial if this tool is to support elimination programmes. Mathematical models offer
a mechanism for investigating this key question in the absence of empirical information. Furthermore, forecasts
made by models present decision makers with new information not otherwise available as data provides only
retrospective insight. Thus, while the Jacob et al.24 trials present critical observations about the impact of “slash
and clear” on vector biting rates, short-term data on their own cannot anticipate changes as a result of future
management actions or ecological shifts, especially for biologically and socially complex systems25. By combin-
ing data with forecast models, the trial observations can also in addition be extrapolated to diverse settings and
future scenarios. Moreover, forecast models have a unique ability to account for uncertainties in initial conditions,
transmission drivers, and parameters to allow understanding of the full range of possible outcomes in different
local settings25.
In this study, we developed a mathematical model of the “slash and clear” intervention to investigate the
potential for this VC strategy to enhance efforts to accelerate progress toward onchocerciasis elimination. We
present a novel mechanistic “slash and clear” model developed using the data from the field trials presented in
Jacob et al.24. As part of this development, we also introduce a new seasonal black fly biting rate model. We couple
this intervention model with our population dynamics model of onchocerciasis transmission26 to evaluate the
benefit of supplementing MDA with “slash and clear” VC for accelerating transmission interruption. Specifically,
our Bayesian data-driven modeling approach involves modeling baseline infection data from onchocerciasis
endemic villages and then using the locally calibrated models to forecast the impacts of different “slash and clear”
intervention scenarios. Our forecasts suggest that “slash and clear”, when used in conjunction with IVM MDA,
can significantly accelerate the achievement of onchocerciasis elimination across endemic settings.
Results
Seasonal biting rate and “slash and clear” model. The “slash and clear” intervention involves remov-
ing vegetation from breeding sites (fast flowing, well oxygenated, sediment free water) along rivers to disrupt
black fly breeding activities. Black fly breeding, and consequently biting intensity, typically varies throughout the
year due to environmental changes, indicating the importance of considering the timing of the intervention in
relation to these background seasonal patterns. Here, we developed a novel data-driven black fly biting rate model
that considers seasonal fluctuations to account for this variation when simulating the “slash and clear” vector
control intervention investigated in this study. The time-dependent biting rate was modelled by identifying the
mechanistic relationship between the monthly biting rate (MBR) and expected monthly rainfall (see Methods).
The model was calibrated to the observations of both variables reported for the geographical area of interest in
Jacob et al.24.
Given the observed monthly rainfall during the long term trial24, our new double Weibull biting rate model
captured 91% of the MBRs observed in the control sites, thereby supporting the process equation used to describe
MBR as a function of rainfall (Fig. 1a). The model estimates of MBR in both the control and intervention (i.e.
clearing vegetation in May) sites during the trial are shown in Fig. 1b,c. The ability of our exponential decay
“slash and clear” intervention model (see Methods) to reproduce the observations is confirmed by these results
with the ensemble of model predictions capturing 100% of the intervention data. The posterior median and 95%
confidence intervals of the “slash and clear” efficacy (η) and efficacy decay rate (Λ) were η = 0.84 (0.75,0.95) and
Λ = 0.16 (0.05, 0.39) after fitting the model to MBR data from the three intervention sites. These results indicate
that the biting rate is immediately reduced by 84% following vegetation clearance and that the half-life of the
intervention is ln(2)/Λ = 4.3 months. This means that the intervention can still remain 50% effective after about
4 months.
In our scenario modeling, we used a non-stationary cosinor model for estimating the seasonal rainfall pattern
in northern Uganda to predict MBR as a function of monthly rainfall. The use of the cosinor model allowed us
to consider uncertainty and non-stationarity in rainfall patterns from year to year as opposed to relying solely on
Scientific Reports | (2019) 9:15274 | https://doi.org/10.1038/s41598-019-51835-0 2www.nature.com/scientificreports/ www.nature.com/scientificreports
Figure 1. Model-predicted monthly biting rate as a function of rainfall in control and intervention sites. (a) The
model predictions (gray curves) represent the MBR in the presence of seasonal rainfall fluctuations but in the
absence of the “slash and clear” intervention. The ensemble of models together captured 91% of the observed
MBR vs. rainfall data (red points with 95% confidence interval error bars) from the control sites for May 2017 –
March 201824. (b) Given the observed rainfall, the ensemble of models captured 91% of the data points from the
control sites. (c) Given the observed rainfall, the ensemble of models captured 100% of the data points from the
intervention sites.
mf breakpoint (%) ATP threshold
Village TBR ABR TBR ABR
Palaure Pacunaci 0.716 0.085 91.5 1.8
Masaloa 0.989 0.124 44.6 2.9
Nyimanji 0.802 0.133 28.7 3.0
Olimbuni/Aroga 0.455 0.115 16.1 2.7
Table 1. Model-predicted threshold values for mf and ATP indicators. Threshold values represent 95%
elimination probability at the modelled site-specific ABR and TBR.
the observed 2017–2018 rainfall. The model was fitted to the observed rainfall data for May 2017 - April 2018 in
Gulu, Uganda24, and the fit is shown in Supplementary Fig. S1.
Transmission model fits to site-specific baseline prevalence. Our Bayesian Melding (BM) modelling
framework relies on data assimilation to discover local transmission models. Supplementary Fig. S2 shows the
BM fits of our O. volvulus transmission model to the age microfilariae (mf) prevalence data in each of the four
study sites (see Methods for a description of the model and study sites). Because age-stratified mf prevalence data
were not available, two infection patterns (plateau and convex) were estimated from the observed overall prev-
alence, and each were equally considered in the model fitting procedure (see Supplementary Information (SI)).
These results overall highlight the flexibility of the data-model assimilation approach for both overcoming gaps
in data and for accurately differentiating between the prevailing transmission dynamics across endemic settings.
mf and ATP breakpoint calculations. The model calibration procedure produced a selection of n = 500
best-fitting posterior parameter vectors from the initially drawn N = 200,000 samples (see Methods for the
detailed procedure). For each of the selected parameter vectors, we calculated the mf prevalence and annual
transmission potential (ATP) breakpoints at both the model-estimated annual biting rate (ABR) and threshold
biting rate (TBR), resulting in a site-specific distribution for each of these variables. Using the empirical inverse
cumulative distribution function of the ensemble of breakpoint values and exceedance probability calculations,
we identified the breakpoints representing 95% elimination probability for each site (Table 1). These values served
as the target endpoints for intervention programmes in subsequent simulations and analyses. Kruskal-Wallis tests
indicated that the breakpoint distributions at ABR and TBR statistically significantly varied between sites, sug-
gesting the existence of spatial heterogeneity in transmission dynamics (p-values < 0.003). It is also important to
note that the mf breakpoints at TBR are statistically significantly higher than at ABR when vector populations are
unperturbed (p-values < 1e-4), emphasizing the valuable role that VC can play to raise the transmission thresh-
olds and facilitate the achievement of elimination. Significantly, the ATP values estimated in this study (Table 1)
also indicate that the relevant ATP threshold values in a site may be different from the global value of 20 ATP set
by WHO. Thus, if VC is not implemented, it is clear that the ATP thresholds at ABR may be significantly lower
than the globally-set value of 20 (Table 1). However, if VC is used, it can be seen that the relevant ATP thresholds
estimated at TBR could range from 16–91 across sites, a result which again highlights the important role that VC
can play in facilitating the elimination of a vector-borne parasitic disease
Scientific Reports | (2019) 9:15274 | https://doi.org/10.1038/s41598-019-51835-0 3www.nature.com/scientificreports/ www.nature.com/scientificreports
Figure 2. Impact of “slash and clear” on MBR for different intervention schedules in Masaloa, Uganda. Two
years of implementing “slash and clear” is shown with vertical red lines indicating the months where vegetation
was cleared. The blue line depicts the median MBR prediction throughout the intervention period and the
horizontal black dashed line represents the median TBR for Masaloa.
Impact of “slash and clear” on required durations of interventions for achieving parasite elimi-
nation. We modelled several different “slash and clear” scenarios in combination with annual MDA to assess
the optimal frequency and timing of the intervention and to evaluate the intervention’s potential to accelerate
the achievement of onchocerciasis elimination. Three different scenarios were tested (see Methods): clearing
vegetation (1) during the first month of the rainy season (here considered to be April), (2) once every two months
during the rainy season (April – December), and (3) every month throughout the year. Figure 2 shows the pre-
dicted impact of these intervention schedules on MBRs compared to when no VC is used. For each site, timelines
to reach the site-specific 95% elimination probability mf breakpoint and ATP threshold values were calculated
for each scenario (Fig. 3, Table 2). Similar calculations were done for the WHO-defined threshold values (mf
prevalence = 1%, ATP = 2027,28).
The results of the scenario modeling suggest that the time required to reach the ATP threshold is directly
proportional to the frequency at which vegetation is cleared and the baseline infection intensity. The most notable
result was that if vegetation is cleared every month, then transmission suppression is predicted to be achievable in
as little as one year (Table 2). Interestingly, there is a relatively small added benefit to clearing vegetation several
times throughout the rainy compared to only during the first month of the rainy season. These additional efforts
reduce the years of required interventions by only a couple of years compared to clearing vegetation only once
per year. For all sites, there was a statistically significant difference between the predictions for each schedule
(Kruskal-Wallis p-values < 1e-4).
Supplementing annual MDA with “slash and clear” significantly reduces the timelines to reach the site-specific
mf breakpoints, with the impact of the different clearing frequencies found to be statistically significantly different
(Kruskal-Wallis p-values < 1e-4). However, the differences between these schedules for crossing mf breakpoints
are practically not very notable compared to the results pertaining to using the ATP threshold targets (Fig. 3).
The addition of VC does not directly result in significant reductions of the community mf prevalence, but instead
Scientific Reports | (2019) 9:15274 | https://doi.org/10.1038/s41598-019-51835-0 4www.nature.com/scientificreports/ www.nature.com/scientificreports
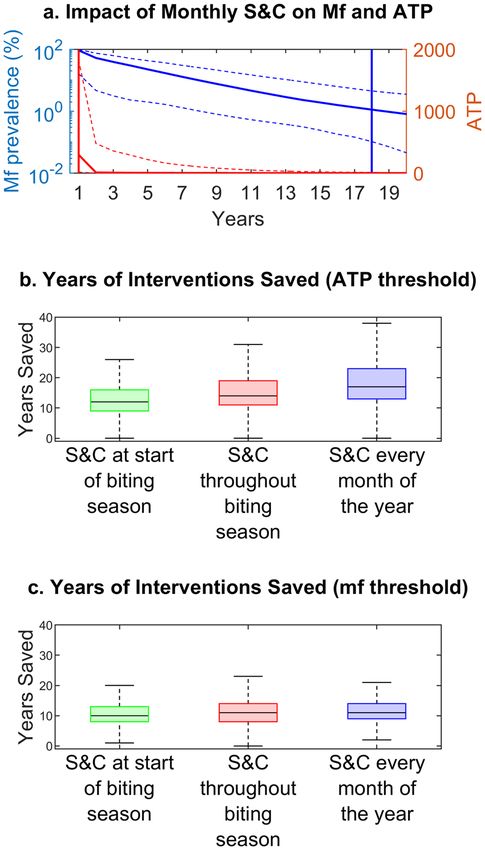
Figure 3. Impact of “slash and clear” on timelines to suppress or interrupt transmission. (a) Timelines to
achieve the site-specific mf and ATP thresholds for Masaloa, Uganda when annual MDA is supplemented with
monthly “slash and clear”. The blue curve shows the mf prevalence predictions over time (95% confidence bands
shown by dashed lines) with the time required to reach the 95% elimination probability threshold given by a
vertical blue line (18 years). The red line shows the ATP over time (95% confidence bands shown by dashed
lines) with the time required to reach the 95% elimination probability threshold given by a vertical red line (1
year). (b,c) Years of interventions saved by supplementing annual MDA with “slash and clear” (S&C). Results
for three different “slash and clear” schedules and two different elimination thresholds (modelled ATP (b) and
mf (c) breakpoints) are shown. The results for all four study sites are pooled together. The whiskers correspond
to 1.5 times the interquartile range.
raises the mf breakpoint value making it easier to reach through MDA. Another point of interest is that the ATP
threshold is predicted to be reached well before the mf breakpoint (Table 2).
Uncertainty analysis. We modelled the various “slash and clear” scenarios in combination with biannual
MDA to assess the sensitivity of the results to the annual MDA strategy. The major conclusions of this analysis
are that (1) the predicted timelines to reach the mf and ATP thresholds are shorter if MDA is given biannually
(Supplementary Table S1) compared to annually (Table 2), and (2) adding “slash and clear” will still have an
important impact when combined with biannual MDA. Thus, under a strategy relying on drug treatment alone,
biannual MDA can save 5–13 years of treatment compared to annual MDA, highlighting the strength of the
added drug pressure. The savings are dependent on the choice of threshold and baseline endemicity of a site.
However, despite the accelerated timelines using twice per year treatment, adding supplemental “slash and clear”
VC can still save as many as 13 years of interventions compared to biannual MDA alone.
It is unlikely that rainfall patterns will remain constant in the long term future. Because the simulations con-
sider time scales over which we cannot rely on stationarity, we performed a sensitivity analysis to evaluate how
well the “slash and clear” intervention would work given unforeseeable shifts in seasonality. We tested scenarios
where the rainfall patterns shift forward by 1, 3, and 6 months while keeping the intervention schedules the same.
Results from this analysis suggest that there is no significant change in the impact of “slash and clear”, suggesting
that the frequency of the intervention has a stronger effect than the timing even in the presence of uncertain
future seasonal changes in rainfall and hence transmission (Supplementary Table S2).
Scientific Reports | (2019) 9:15274 | https://doi.org/10.1038/s41598-019-51835-0 5www.nature.com/scientificreports/ www.nature.com/scientificreports
mf threshold ATP threshold
Village
(baseline mf S&C before peak S&C during peak S&C S&C before peak S&C during peak S&C
prevalence (%)) No S&C biting season biting season monthly No S&C biting season biting season monthly
Model-predicted thresholds
Palaure Pacunaci (100) 34 (24–49) 26 (16–45) 25 (16–43) 24 (16–41) 28 (16–50) 10 (2–23) 8 (1–18) 4 (1–12)
Masaloa (76) 31 (19–49) 19 (11–33) 19 (10–31) 18 (10–29) 20 (10–34) 7 (1–17) 5 (1–14) 1 (1–9)
Nyimanji (58) 30 (18–47) 19 (10–34) 19 (10–33) 18 (10–32) 18 (8–33) 7 (1–18) 5 (1–14) 1 (1–9)
Olimbuni/Aroga (24) 28 (15–46) 20 (9–38) 19 (9–36) 19 (9–34) 17 (8–32) 8 (1–18) 5 (1–14) 1 (1–9)
WHO thresholds
Palaure Pacunaci (100) 25 (15–45) 24 (15–41) 23 (15–40) 22 (14–37) 19 (9–45) 16 (7–32) 13 (4–26) 9 (1–19)
Masaloa (76) 20 (11–34) 19 (10–32) 19 (10–31) 18 (10–29) 13 (4–25) 10 (1–21) 8 (1–18) 1 (1–12)
Nyimanji (58) 19 (9–34) 18 (9–31) 17 (9–30) 17 (9–29) 11 (2–24) 8 (1–20) 6 (1–16) 1 (1–10)
Olimbuni/Aroga (24) 15 (5–30) 14 (5–28) 14 (5–26) 14 (5–26) 10 (1–22) 7 (1–17) 4 (1–13) 1 (1–8)
Table 2. Number of years of interventions required to reach mf and ATP transmission thresholds. The number
of years of required interventions is reported as the median prediction with its 95% confidence interval. All
“slash and clear” scenarios are in combination with annual MDA at 80% population coverage. Results for both
the model-predicted site-specific thresholds (representing 95% elimination probability) and the global WHO
thresholds are shown.
Discussion
The major result of this study that is immediately relevant for onchocerciasis elimination programmes is that
supplementing annual MDA programmes with community-directed VC by clearing vegetation can significantly
accelerate the achievement of parasite elimination in a sustainable manner. A recent field study in northern
Uganda indicated that clearing vegetation using a community-driven approach can significantly reduce Simulium
damnosum s.s. biting rates, but no empirical study has yet been done to test how this will affect infection rates in
humans24. Here, we address this gap explicitly by using a forecasting model to link the observed changes in vector
biting rates to the expected infection dynamics in the human population.
Our study has highlighted three major advantages offered by the addition of “slash and clear” VC for achieving
rapid and sustained onchocerciasis elimination. First, the main result of importance for onchocerciasis elimina-
tion programmes is that supplementing MDA with vegetation clearing activities can significantly accelerate the
average timelines to achieve elimination targets (Table 2). The implementation of “slash and clear” can potentially
save, on average, more than 10 years of interventions compared to relying on annual MDA alone if mf thresholds
are used as elimination targets, and, notably, the savings could increase to more than 20 years if the correspond-
ing ATP thresholds are used (Table 2). These savings were also apparent in the case of biannual MDA, although
to a lesser extent. Other studies have also shown this value of adding VC to MDA, and together with the present
results, it is increasingly clear that relying on MDA alone may not bring about onchocerciasis elimination in all
settings29,30. Indeed, field evidence supports this modelling result, demonstrating that the use of annual MDA
alone in many areas has not led to achievement of targets even after 19 years of applying the intervention29,30,
while VC alone and VC together with MDA have played key roles in onchocerciasis elimination efforts in Uganda
and elsewhere11,14–16,31. These results strongly indicate that diversifying options, such as including “slash and clear”
VC into MDA programmes, will be required if S. damnosum associated onchocerciasis is to be most effectively
eliminated from endemic locations.
Second, an exciting result of this study is that, because of the lasting effects of this intervention (remaining
at least 50% effective for 4 months), significant reductions in biting rates can be achieved by clearing vegetation
before and/or during the biting season, and that year-round intervention is not required (Table 2 and Fig. 2).
While monthly clearing will very quickly reduce transmission below the model-predicted ATP thresholds (poten-
tially within 1 year of interventions), performing “slash and clear” just once per year is enough to save up to
18 years of interventions compared to relying on annual MDA alone in a hyper-endemic setting like Palaure
Pacunaci (Table 2 and Fig. 3). Choosing to undertake annual or seasonal vegetation clearance if the community
does not have the capacity for monthly intervention will still save many years of interventions compared to using
annual MDA alone even if optimal coverages are achieved (here simulated at 80%). As expected, fewer years of
interventions were saved in settings with lower pre-control prevalence. This trend remained true even if seasonal
patterns were to shift and the vegetation was cleared annually at a suboptimal time with respect to the biting
season (Supplementary Table S2).
Finally, “slash and clear” is an alternative form of VC capable of alleviating challenges associated with
MDA5,21,32,33. While the value of VC for eliminating onchocerciasis is well-established, the cost of implement-
ing traditional larvicide-based approaches, the potential for larvicide resistance, and the amount of preparatory
work required to implement this intervention are of concern1,20. In line with the growing trend of integrating
community participation in VC efforts34–37, “slash and clear” can be considered an effective community-directed
intervention in that community members are trained and are responsible for clearing the vegetation. Jacob et
al.24 reports that communities were motivated to be involved because the biting of the black flies is very bother-
some, suggesting that “slash and clear” would have sustained support by local populations. Furthermore, there
are no costly materials required, removing the financial burden associated with larvicide treatments. Because this
intervention involves environmental management as opposed to chemical solutions, the emergence of resistance
would be a lesser threat to elimination, further improving the sustainability of the approach38–40.
Scientific Reports | (2019) 9:15274 | https://doi.org/10.1038/s41598-019-51835-0 6www.nature.com/scientificreports/ www.nature.com/scientificreports
Another notable feature of our study is the evaluation of two different transmission indicators, mf prevalence
and ATP. Our findings show that ATP thresholds are reached markedly earlier than mf breakpoints (Table 2 and
Fig. 3), suggesting that, in locations where vector migration is not a concern, targets based on indicators in the
vector (ATP) are significantly more sensitive for detecting the eventual interruption of transmission than the
corresponding indicators in the human (mf). However, as noted in Methods, in settings where the in-migration
of black flies is likely, MDA will still be important for reducing the intensity of the remaining mf infections in
order to achieve the permanent reduction of transmission27; here, adding “slash and clear” to continuing MDA
interventions will still significantly reduce the number of years required for this extended drug intervention
(Table 2). Furthermore, in these locations, the addition of VC into MDA programmes can serve to reduce the
risk of recrudescence by making the system more resistant to the re-initiation of infections essentially by driving
the prevailing ABR toward its local TBR, which in turn raises the mf breakpoint/emergence values41. This effect,
coupled by the long-lasting impact of the present VC method against reestablishement of the fly population,
suggests that introducing community-driven “slash and clear” VC in S. damnosum transmission areas nearing
elimination targets may represent an important endgame strategy for ensuring onchocerciasis elimination. Given
the rising concern about the impact of cross-border introduction of infection33, implementing “slash and clear” in
a border region that has successfully interrupted transmission could also act as an effective strategy to safeguard
the gains made. Field trials to evaluate these predicted impacts of the “slash and clear” VC are required to attest to
the real-world usefulness of this approach as an onchocerciasis endgame/cross-border strategy.
Mf is a poor indicator for other reasons as well like low diagnostic sensitivity, especially in low prevalence
settings, and community disapproval of the skin snip procedure, resulting in a general movement away from
the use of mf as an indicator and toward the application of vector and serology-based indicators for evaluating
onchocerciasis elimination32,42,43. However, identifying reliable vector and serology thresholds is still a key issue
that needs to be resolved43. The vector thresholds recommended by WHO was initially set at a value of 20 ATP per
site27. Our results on ATP threshold values (Table 1), however, have provided three important insights regarding
the applicable vector threshold values in a site. First, as in the case of the corresponding mf breakpoint values,
vector-based elimination thresholds (here ATP) will vary significantly between sites owing to variations in local
transmission conditions. Second, the relevant ATP threshold values may be different from the global value of 20
set by WHO. Third, if VC is not implemented, the ATP thresholds at ABR may be significantly lower than the
globally-set value of 20 but these will increase to 16–91 across sites if VC is used (Table 1). These are important
results, and highlight: (1) that these thresholds are not spatially stationary but are properties of heterogeneous
transmission dynamics, and (2) that currently set targets require revaluation.
This study emphasizes the valuable role that forecasting models can play in programme design and
decision-making. While the field data reported from the “slash and clear” trials showed great promise for reduc-
ing O. volvulus transmission24, it is clear that such data alone may not provide insight into infection dynamics in
humans nor can it be relied upon to anticipate the impact of the intervention in other settings or in the future.
This highlights some of the challenges associated with using data alone for decision-making in parasite elimina-
tion. Thus, while data can provide critical evidence, it is important to note, firstly, that data on one state variable
alone cannot predict the behavior of the overall transmission system and, in particular, does not guarantee the
detection of change in related but separate parts of the system25. Combining data with forecasting models may,
however, allow us to clearly define what we know, extrapolate this information to other settings, and reliably
predict the outcome25. Furthermore, the use of data-assimilated models provides a framework for explicitly con-
sidering uncertainties in data, initial conditions, and parameters25. Here, we used a Bayesian Melding framework
for expressing initial uncertainties in pre-control ABR (a key system driver) and other model parameters, which
are updated or localized for a site based on mf infection data. This allows us to discover models with associated
uncertainties for a given site which capture the properties of local dynamics better, and thus to make more reliable
site-specific future forecasts of intervention outcomes25. Note that such data-model assimilation is flexible and
can enable models to be easily updated as new data are collected, which can be a useful procedure for further
reducing forecast uncertainty and thus supporting more reliable decision-making44.
A limitation to our study is that the modelled site-specific breakpoints and the WHO-proposed thresholds for
onchocerciasis have not yet been sufficiently validated. Our modeling results, in agreement with others, indicate
that breakpoints vary by endemicity and are lower than the operational thresholds currently used by global pro-
grammes (Table 1)29,32,45. Undoubtedly, this indicates that there is an urgent need for reevaluating and confirming
the criteria used for determining whether transmission has been interrupted43,45. However, note that the key con-
clusion of our study, viz. that adding “slash and clear” VC to MDA will significantly reduce timelines to eliminate
onchocerciasis transmission compared to using MDA alone, will not change but the actual timelines predicted
would (compare the durations of interventions needed for meeting the model-presicted thresholds versus the
WHO threshold given in Table 2). Future refinements of our model are also needed with respect to modeling
seasonality and serological indicators. In this first development, we modelled the MBR as a function of monthly
rainfall to capture seasonality and predict the impact of future shifts in seasonal patterns. This model was based
on one year of rainfall data and should be updated with future and possibly historical rainfall data. Other relevant
environmental factors that impact biting rate could also be incorporated, such as temperature46. Additionally, as
the WHO has adopted serology indicators, it will be important to extend our model to consider this new indicator.
Finally, we have modelled the efficacy of the vegetation “slash and clear” approach based on impact on MBR from
only three experimental field sites. As the “slash and clear” efficacy parameters may depend on local vegetation
and other riverine features, further field studies of the impact of this and indeed other approaches for reducing
vector populations and hindering their regrowth based on vegetation clearance should be carried out in relevant
settings to provide more reliable estimates of efficacy, and to determine how it may vary between diverse ecologies.
In summary, our data-driven modeling study predicts that clearing vegetation as a form of VC can signif-
icantly accelerate the achievement of elimination of S. damnosum-transmitted onchocerciasis, regardless of
Scientific Reports | (2019) 9:15274 | https://doi.org/10.1038/s41598-019-51835-0 7www.nature.com/scientificreports/ www.nature.com/scientificreports
the timing and frequency of implementation. These results also highlight the value of supplementing annual
MDA with VC, a conclusion that is applicable to many vector-borne NTDs. VC, especially implemented via
a community-directed approach, such as embodied by the “slash and clear” technique studied here, may also
overcome the challenges of chemical-based VC delivered using public infrastructures, and thus may consti-
tute a more sustainable approach to deploying long-term VC. Further consideration of the optimal indicator
and means of measurement to detect the interruption of vector-borne macroparasitic disease transmission is
required. Our results suggest that measuring transmission status based on vector-related targets is more sensitive
than using measures of infection in humans, but the choice of endpoint targets will depend crucially on whether
significant dispersal of vectors occurs between intervention sites. Finally, this study emphasizes the value of
using data-assimilation models for forecasting the effects of parasite intervention strategies even in data-limited
situations.
Methods
Modeling seasonal black fly biting rates as a function of rainfall. To model seasonal fluctuations in
MBR, we first fitted a non-stationary cosinor model to monthly rainfall data applicable to our observation sites
(obtained from the Gulu meteorological station in northern Uganda for May 2017 - April 2018)24,47. We chose to
use rainfall as a proxy for seasonality because, apart from being a well-established driver variable underpinning
black fly population dynamics, there were reliable rainfall data published alongside the biting rate data in Jacob
et al.24 thus creating an opportunity for modeling the observed correlation between rainfall and biting rate in the
local setting. We then used the fits to predict the amount of rainfall in mm with associated 95% confidence inter-
vals for each month of the year. The non-stationary cosinor model captures annual seasonality in time series data
using a sinusoid and is flexible enough to allow for changes in seasonality over time. In subsequent simulations,
we therefore did not assume that the observed rainfall remained constant from year to year, but instead drew
random samples from the predicted intervals for each month to serve as inputs to the MBR function. The MBR is
related to rainfall through a double Weibull function:
R t (m ) k1 R (m ) k2
−( ) −( t )
MBR(m) = MBRM (1 − e RL )e R U
where MBRM is the maximum expected biting rate, RU and RL represent upper and lower rainfall thresholds
above and below which fly biting is greatly reduced, and k1 and k2 are shape parameters. We calibrated this
rainfall-dependent seasonal MBR model to monthly biting data from control sites (Supplementary Table S3)
using Bayesian Melding with a pass/fail filter (see description of BM approach below)48–51. The prior parameter
ranges for RL, RU, k1 and k2 are given in Supplementary Table S4. The pass/fail filter was based on the following
acceptance criteria: the ensemble of models was considered acceptable if >85% of the observed data points were
captured.
Biting rate reduction due to “slash and clear”. Removing trailing vegetation by the “slash and clear”
technique was shown in trials to have a strong and rapid impact on black fly biting rates24. The biting rate was
reduced by 89–99% within one month post-intervention in the intervention sites compared to control sites, and
the reduction was long lasting with biting density significantly reduced for up to 4 months24. To capture this
immediate decline followed by a slow period of population regrowth, we model the effects of “slash and clear”
as an intervention acting against the MBR whose efficacy declines over time according to an exponential decay
function:
R (m ) 1 R t (m ) 2
k k
− t −
MBR(m, ts ) = MBRM 1 − e L e U η(1 − e−Λts)
R R
where η is the immediate percentage decrease in biting rate due to the removal of vegetation, Λ is the decay rate of
the efficacy of the intervention at maintaining reduced biting rates, and ts is the time since clearing the vegetation
in months. Note that, in this formulation, Λ controls the rate of return of the black fly population following the
intervention. We calibrated the seasonal MBR model with the effects of “slash and clear” to monthly biting data
from the intervention sites (Supplementary Table S3)48–51. The prior parameter ranges for η and Λ are given in
Supplementary Table S4. The pass/fail filter was based on the same acceptance criteria as above.
Survey data. To simulate “slash and clear” interventions in this modeling study, we modelled four oncho-
cerciasis endemic sites in northern and western Uganda that closely resemble the environment from the origi-
nal trials described in Jacob et al.24. Simulium damnosum s.s. is responsible for transmission in these sites, and
together they also represented a range of transmission conditions. Table 3 provides the baseline microfilariae (mf)
prevalence survey data used to calibrate the model to local conditions13,17,26. Baseline surveys were carried out in
1993–1994 for all sites using standard skin snip protocols for diagnosing the presence of mf13,17,26.
Onchocerciasis transmission model. The biting rate model developed here was coupled to a filarial para-
site transmission model previously parameterized for onchocerciasis26. The state variables of this model vary over
age (a) and/or time (t) and track changes in the average pre-patent (P(a,t)) and adult (W(a,t)) worm burden per
human host, the average microfilariae intensity per human host (M(a,t)) the average number of infective L3 stage
larvae per black fly (L), and a measure of immunity (I(a,t)) developed by human hosts against incoming L3 larvae.
The state equations comprising this model are:
Scientific Reports | (2019) 9:15274 | https://doi.org/10.1038/s41598-019-51835-0 8www.nature.com/scientificreports/ www.nature.com/scientificreports
Baseline
Focus Village Prevalence (%) Ref.
Madi mid-North Palaure Pacunaci 100 26
Madi mid-North Masaloa 76 26
Wadelai Nyimanji 58 17
Obongi Olimbuni/Aroga 24 13
Table 3. Ugandan onchocerciasis study sites.
∂P ∂P
+ = ΦL⁎F1(I (a, t ))F2(WT(a, t )) − µw P(a, t )
∂t ∂a
− ΦL⁎F1(I (a, t − τ ))F2(WT(a, t − τ ))ζ
∂W ∂W
+ = ΦL⁎F1(I (a, t − τ ))F2(WT(a, t − τ ))ζ − µw W (a, t )
∂t ∂a
∂M ∂M
+ = F3(WT(a, t )) − γM (a, t )
∂t ∂a
∂I ∂I
+ = WT(a, t ) − δI (a, t )
∂t ∂a
L⁎ = F4(WT(a, t ))
Each function, Fx, denotes a functional form for which the specified state variable serves as an input along with
other model parameters. Expanded forms of these functions are fully described in previous work26 and all param-
eter values and functional forms are detailed in Supplementary Tables S5 and S6. Note that some functions are
dependent on the total worm load where WT = W(a,t) + P(a,t). Given the faster time scale of infection dynamics
in the vector compared to the human host, we make a simplifying assumption that the density of infective stage
larvae in the vector population reaches a dynamic equilibrium rapidly52–56, so the infective L3-stage larval density
in the vector population is evaluated as an ordinary differential equation at equilibrium (denoted by L*).
Bayesian Melding fitting of the model to the baseline data. Our computational approach is founded
on a BM data assimilation framework48,55–58. Using the known ranges of the model parameter values, we defined
uniform prior distributions for each parameter and randomly sampled with replacement from these distributions
to generate N = 200,000 parameter vectors. The model was run with each of the N parameter vectors, which
generated N outputs predicting mf prevalence by age. Because there was no ABR data for the study sites, this
parameter was also inversely estimated during this step to identify plausible ABR values for the geographic loca-
tion and endemic prevalence. The model outputs were compared against age-stratified mf prevalence data by
calculating binomial log-likelihoods for each parameter vector. Note that the datasets used in this work did not
include age-stratified mf prevalence data, so the age profiles were derived from the observed overall community
prevalence according to the procedure presented in Smith et al.51. The derivation of the age prevalence structures
for onchocerciasis is given in the SI. Next, a Sampling-Importance-Resampling algorithm was used to select
n = 500 samples with replacement from the pool of N parameter vectors with probabilities proportional to their
relative log-likelihood values. This step generated the n parameter vectors most likely to describe the data. The n
resampled posterior parameter vectors were used to compute distributions of variables of interest from the fitted
model (ex. age-prevalence curves, worm breakpoints and infection trajectories following treatments). Note that
this approach means that none of the biological parameters of the model are fixed a priori, but rather the initial
priors are updated by the mf data and are thus informed by the local transmission setting26.
Model-based calculations of site-specific transmission thresholds. Using a numerical stability
analysis approach, we calculated the TBR and the mf prevalence breakpoints for each of the best-fitting parame-
ter vectors55,56,58,59. To calculate the TBR for each parameter vector, we progressively decrease the average number
of black flies per human, m, from its original value to a threshold value below which the model always converges
to zero mf prevalence. The product of the number of bites per fly per month, β, and this newly found m value is
termed as the TBR. We similarly calculate the mf prevalence breakpoints. Given a particular biting rate (either the
ABR or TBR), we estimate the minimum L* below which the model predicts zero mf prevalence. The correspond-
ing mf prevalence at this threshold L* value is termed as the mf breakpoint. The distribution of mf breakpoints at
a particular biting rate in a site can be described by an empirical inverse cumulative density function, which we
used in conjunction with exceedance calculations59 to quantify the values of mf breakpoint prevalence thresholds
reflecting various elimination probabilities. Here, we used the mf breakpoint corresponding to an elimination
probability of 95% as the elimination target.
In this study, we also consider the impact of “slash and clear” on the ATP thresholds, as ATP is an important
entomological indicator considered in intervention programmes against onchocerciasis. The ATP is calculated as
the product of the ABR and the population averaged number of L3 larvae per black fly27,60, and the ATP thresh-
old thought to indicate that local transmission is no longer sustainable has been fixed at 20 by WHO27. Here, we
modelled the site-specific ATP threshold as the product of the biting rate and L* thresholds calculated for a site as
described above (at either ABR or TBR). When VC is implemented, the TBR is assumed to be the relevant biting
Scientific Reports | (2019) 9:15274 | https://doi.org/10.1038/s41598-019-51835-0 9www.nature.com/scientificreports/ www.nature.com/scientificreports
rate and the corresponding L* threshold is used in the ATP calculations. When VC is not used, the ATP threshold
is calculated by multiplying the ABR and the corresponding L* threshold.
Note, according to epidemiological theory, crossing below either of these thresholds would lead to the cessa-
tion of vector-borne disease transmission in a local setting55,61,62. However, given the relatively longer life span
of adult worms, it will invariably take more time to achieve the mf threshold compared to the ATP threshold.
Furthermore, in an open environment (i.e. where dispersal or migration of flies is significant), the persistence of
mf despite stopping local transmission once ATP thresholds are crossed would pose a risk of reestablishment of
transmission if MDA is stopped before mf breakpoints are reached. This risk of recrudescence of infection means,
as per the WHO definitions, that achieving permanent transmission interruption in a local setting may require
waiting until the mf thresholds are also met, while meeting the ATP thresholds can be considered as conditional
interruption or suppression of transmission27.
Modeling the effects of mass drug administration. In our simulations, we consider the complemen-
tary impact of “slash and clear” when added to a standard onchocerciasis MDA programme with IVM. The
impact of MDA was modelled by assuming that the drug acts by instantaneously killing certain fractions of the
pre-patent worm (P), patent (W) adult worm, and mf (M) populations. We denote these fractions as ω for worms
and ε for mf. Because there lacks consensus on the efficacy of annual IVM against adult Onchocerca volvulus
parasites, we allow ω to vary from 0.05 to 0.363–71. The population sizes of worms and microfilariae after drug
treatment are calculated by modifying the populations of each parasite stage immediately prior to the treatment:
P(a, t + dt ) = (1 − ωC )P(a, t )
W (a, t + dt ) = (1 − ωC )W (a, t )
at time t = TMDAi
M(a, t + dt ) = (1 − εC )M(a, t )
In the above equation, dt represents a short time-period since the time-point TMDAi when the ith round of MDA
was administered. The parameter C is the population level drug coverage. As IVM is generally also thought to act
by suppressing the production of mf by worms surviving each MDA65,69, we modelled this sterilizing effect by
introducing the parameter δreduc:
∂M ∂M
+ = (1 − δreducC )sαφ[W (a, t ), k]W (a, t ) − µ2M(a, t ), for TMDAi < t ≤ TMDAi + P
∂t ∂a
where α′ = α(1 − δreducC ) reflects the suppressed fecundity (over a period of TP months since the ith MDA) of
adult worms that survive the administration of drugs at each MDA.
Policy scenarios. Because the “slash and clear” intervention acts to reduce the black fly population and the
background population dynamics are highly variable by season, we hypothesized that the timing of the interven-
tion would be important. We considered several different intervention schedules to investigate the impact that
timing and frequency of the intervention will have on its efficacy. For all of these scenarios, the rainy season was
considered to run from April through November and the dry season from December through March, following
the observations in Jacob et al.24. Simulations were started at the beginning of the rainy season in April. In the
first scenario, we assume that it is known when the rainy season (corresponding to the biting season) is expected
to occur and we implement “slash and clear” during the first month of the biting season. In reality, the timing of
peak biting is somewhat unpredictable. Therefore, in the second scenario, we considered clearing vegetation every
other month during the biting season. This schedule was based on the proposal by Jacob et al.24 to clear vegeta-
tion every two months. Finally, we considered a third scenario where “slash and clear” is implemented monthly
throughout the year. We model these intervention scenarios in combination with a standard annual MDA pro-
gramme at the WHO-recommended coverage of 80%. For each intervention scenario, the intervention timelines
to suppress or interrupt transmission, marked by the achievement of either the ATP threshold or mf breakpoint,
respectively, were calculated for both site-specific and global WHO thresholds and then compared to quantify the
impact of the intervention.
Uncertainty Analysis. Note that while the study sites chosen are located in Uganda, the annual MDA sce-
narios do not reflect the Ugandan onchocerciasis elimination strategy. In order to be generally applicable, we
modelled a standard annual MDA intervention strategy to investigate the combined effect of IVM and “slash and
clear”, but in practice the Ugandan policy is moving towards enhancing their elimination programmes by imple-
menting biannual MDA12. To assess the sensitivity of the results to the annual MDA programme, we repeated the
scenarios described above under a biannual MDA programme also at 80% coverage. Additionally, it is unlikely
that seasonal patterns will remain constant from year to year. Therefore, as a sensitivity analysis, we repeated these
simulations while shifting the rainfall patterns by 1, 3, and 6 months to assess how sensitive the results are to the
timing of the intervention in relation to the biting season.
Data availability
All data generated or analyzed during this study are included in this published article and its Supplementary
Information Files. Model code is available at https://github.com/EdwinMichaelLab/SlashAndClear.
Received: 17 May 2019; Accepted: 9 October 2019;
Published: xx xx xxxx
Scientific Reports | (2019) 9:15274 | https://doi.org/10.1038/s41598-019-51835-0 10www.nature.com/scientificreports/ www.nature.com/scientificreports
References
1. World Health Organization. Integrating neglected tropical diseases into global health and development: fourth WHO report on
neglected tropical diseases. (2017).
2. World Health Organization. Accelerating work to overcome the global impact of neglected tropical diseases: a roadmap for
implementation: executive summary. (2012).
3. Reimer, L. J. et al. Fit for purpose: do we have the right tools to sustain NTD elimination? BMC Proc. 9, S5 (2015).
4. Klepac, P., Funk, S., Hollingsworth, T. D., Metcalf, C. J. E. & Hampson, K. Six challenges in the eradication of infectious diseases.
Epidemics 10, 97–101 (2015).
5. Klepac, P., Metcalf, C. J., McLean, A. R. & Hampson, K. Towards the endgame and beyond: complexities and challenges for the
elimination of infectious diseases. Philos. Trans. R. Soc. Lond. B Biol. Sci. 368, 20120137 (2013).
6. Peterson, G. D. In Ecological Paradigms Lost: Routes of Theory Change 371 (2005).
7. Davies, J. B. Sixty years of onchocerciasis vector control: a chronological summary with comments on eradication, reinvasion, and
insecticide resistance. Annu. Rev. Entomol. 39, 23–45 (1994).
8. Boatin, B. The Onchocerciasis Control Programme in West Africa (OCP). Ann. Trop. Med. Parasitol. 102, 13–17 (2008).
9. Hougard, J. M., Yameogo, L., Seketeli, A., Boatin, B. & Dadzie, K. Y. Twenty-two years of blackfly control in the onchocerciasis
control programme in West Africa. Parasitol. Today 13, 425–431 (1997).
10. Cupp, E. W., Sauerbrey, M. & Richards, F. Elimination of human onchocerciasis: History of progress and current feasibility using
ivermectin (Mectizan (R)) monotherapy. Acta Trop. 120, S100–S108 (2011).
11. Katabarwa, M. et al. Transmission of Onchocerca volvulus by Simulium neavei in Mount Elgon focus of Eastern Uganda has been
interrupted. Am. J. Trop. Med. Hyg. 90, 1159–1166 (2014).
12. Katabarwa, M. N. et al. After 70 years of fighting an age-old scourge, onchocerciasis in Uganda, the end is in sight. Int Health 10,
i79–i88 (2018).
13. Katabarwa, M. N. et al. Transmission of onchocerciasis in Wadelai focus of northwestern Uganda has been interrupted and the
disease eliminated. J Parasitol Res 2012 (2012).
14. Lakwo, T. et al. Interruption of the transmission of Onchocerca volvulus in the Kashoya-Kitomi focus, western Uganda by long-term
ivermectin treatment and elimination of the vector Simulium neavei by larviciding. Acta Trop. 167, 128–136 (2017).
15. Lakwo, T. L. et al. The disappearance of onchocerciasis from the Itwara focus, western Uganda after elimination of the vector
Simulium neavei and 19 years of annual ivermectin treatments. Acta Trop. 126, 218–221 (2013).
16. Lakwo, T. L., Ndyomugyenyi, R., Onapa, A. W. & Twebaze, C. Transmission of Onchocerca volvulus and prospects for the
elimination of its vector, the blackfly Simulium neavei in the Mpamba–Nkusi focus in Western Uganda. Med. Vet. Entomol. 20,
93–101 (2006).
17. Luroni, L. T. et al. The interruption of Onchocerca volvulus and Wuchereria bancrofti transmission by integrated chemotherapy in
the Obongi focus, North Western Uganda. PLoS One 12 (2017).
18. Ndyomugyenyi, R., Lakwo, T., Habomugisha, P. & Male, B. Progress towards the elimination of onchocerciasis as a public-health
problem in Uganda: opportunities, challenges and the way forward. Ann. Trop. Med. Parasitol. (2013).
19. Ndyomugyenyi, R., Tukesiga, E., Büttner, D. W. & Garms, R. The impact of ivermectin treatment alone and when in parallel with
Simulium neavei elimination on onchocerciasis in Uganda. Trop. Med. Int. Health 9, 882–886 (2004).
20. World Health Organization. African Programme for Onchocerciasis Control. Report of the consultative meetings on strategic
options and alternative treatment strategies for accelerating onchocerciasis elimination in Africa. (2015).
21. Boussinesq, M., Fobi, G. & Kuesel, A. C. Alternative treatment strategies to accelerate the elimination of onchocerciasis. Int Health
10, i40–i48 (2018).
22. Baker, R. & Abdelnur, O. Localized onchocerciasis vector control in the Bahr el Ghazal Region of South-Western Sudan. II. Control.
Trop. Med. Parasitol. 37, 135–142 (1986).
23. Buckley, J. Studies on Human Onchocerciasis and Simulium in Nyanza Province, Kenya: II. The Disappearance of S. neavei from a
Bush-Cleared Focus. J. Helminthol. 25, 213–222 (1951).
24. Jacob, B. G. et al. Community-directed vector control to supplement mass drug distribution for onchocerciasis elimination in the
Madi mid-North focus of Northern Uganda. PLoS Negl. Trop. Dis. 12 (2018).
25. Dietze, M. C. et al. Iterative near-term ecological forecasting: Needs, opportunities, and challenges. Proc. Natl. Acad. Sci. USA 115,
1424–1432 (2018).
26. Michael, E. et al. Substantiating freedom from parasitic infection by combining transmission model predictions with disease surveys
(vol 9, 4324, 2018). Nat Commun 9 (2018).
27. World Health Organization. Guidelines for stopping mass drug administration and verifying elimination of human onchocerciasis.
(2016).
28. World Health Organization. Conceptual and operational framework of onchocerciasis elimination with ivermectin treatment.
(2010).
29. Verver, S. et al. How Can Onchocerciasis Elimination in Africa Be Accelerated? Modeling the Impact of Increased Ivermectin
Treatment Frequency and Complementary Vector Control. Clin. Infect. Dis. 66, S267–S274 (2018).
30. Lamberton, P. H. L. et al. Onchocerciasis Transmission in Ghana: Persistence under Different Control Strategies and the Role of the
Simuliid Vectors. PLoS Negl. Trop. Dis. 9 (2015).
31. Traore, S. et al. The elimination of the onchocerciasis vector from the island of Bioko as a result of larviciding by the WHO African
Programme for Onchocerciasis Control. Acta Trop. 111, 211–218 (2009).
32. Dadzie, Y., Amazigo, U. V., Boatin, B. A. & Seketeli, A. Is onchocerciasis elimination in Africa feasible by 2025: a perspective based
on lessons learnt from the African control programmes. Inf Dis Poverty 7 (2018).
33. Bockarie, M. J., Kelly-Hope, L. A., Rebollo, M. & Molyneux, D. H. Preventive chemotherapy as a strategy for elimination of neglected
tropical parasitic diseases: endgame challenges. Philos. Trans. R. Soc. Lond. B Biol. Sci. 368, 20120144 (2013).
34. Castro, M., Perez, D., Guzman, M. G. & Barrington, C. Why Did Zika Not Explode in Cuba? The Role of Active Community
Participation to Sustain Control of Vector-Borne Diseases. Am. J. Trop. Med. Hyg. 97, 311–312 (2017).
35. Sommerfeld, J. & Kroeger, A. Innovative community-based vector control interventions for improved dengue and Chagas disease
prevention in Latin America: introduction to the special issue. Trans. R. Soc. Trop. Med. Hyg. 109, 85–88 (2015).
36. De Urioste-Stone, S. M. et al. Development of a community-based intervention for the control of Chagas disease based on
peridomestic animal management: an eco-bio-social perspective. Trans. R. Soc. Trop. Med. Hyg. 109, 159–167 (2015).
37. Elsinga, J. et al. Community participation in mosquito breeding site control: an interdisciplinary mixed methods study in Curacao.
Parasit Vectors 10 (2017).
38. Thomsen, E. K. et al. Underpinning Sustainable Vector Control through Informed Insecticide Resistance Management. PLoS One 9
(2014).
39. Chanda, E., Ameneshewa, B., Bagayoko, M., Govere, J. M. & Macdonald, M. B. Harnessing Integrated Vector Management for
Enhanced Disease Prevention. Trends Parasitol 33, 30–41 (2017).
40. World Health Organization. Handbook for integrated vector management. (2012).
41. Bockarie, M. J., Pedersen, E. M., White, G. B. & Michael, E. Role of Vector Control in the Global Program to Eliminate Lymphatic
Filariasis. Annu. Rev. Entomol. 54, 469–487 (2009).
Scientific Reports | (2019) 9:15274 | https://doi.org/10.1038/s41598-019-51835-0 11You can also read