Comparatives, Quantifiers, Proportions: A Multi-Task Model for the Learning of Quantities from Vision - Association for ...
←
→
Page content transcription
If your browser does not render page correctly, please read the page content below
Comparatives, Quantifiers, Proportions:
          A Multi-Task Model for the Learning of Quantities from Vision
                Sandro Pezzelle∗ , Ionut-Teodor Sorodoc∗† , Raffaella Bernardi∗‡
                  ∗
                    CIMeC - Center for Mind/Brain Sciences, University of Trento
                                 †
                                   Universitat Pompeu Fabra Barcelona
    ‡
      DISI - Department of Information Engineering and Computer Science, University of Trento
           ∗
             sandro.pezzelle@unitn.it, † ionutteodor.sorodoc@upf.edu
                              ‡
                                raffaella.bernardi@unitn.it

                       Abstract                                  ‘twenty-two’) denote the exact, absolute cardinal-
                                                                 ity of the items belonging to one set (e.g., the set
      The present work investigates whether differ-              of students who passed the exam).
      ent quantification mechanisms (set compari-
                                                                    Second, during language acquisition, these ex-
      son, vague quantification, and proportional es-
      timation) can be jointly learned from visual               pressions are neither learned at the same time nor
      scenes by a multi-task computational model.                governed by the same rules. Recent evidence
      The motivation is that, in humans, these                   showed that children can understand comparatives
      processes underlie the same cognitive, non-                at around 3.3 years (Odic et al., 2013; Bryant,
      symbolic ability, which allows an automatic                2017), with quantifiers being learned a few months
      estimation and comparison of set magnitudes.               later, at around 3.4-3.6 years (Hurewitz et al.,
      We show that when information about lower-
                                                                 2006; Minai, 2006; Halberda et al., 2008). Cru-
      complexity tasks is available, the higher-level
      proportional task becomes more accurate than
                                                                 cially, knowing the meaning of numbers, an ability
      when performed in isolation. Moreover, the                 that starts not before the age of 3.5 years (Le Corre
      multi-task model is able to generalize to un-              and Carey, 2007), is not required to understand
      seen combinations of target/non-target objects.            and use these expressions. As for proportions,
      Consistently with behavioral evidence show-                they are acquired significantly later, being fully
      ing the interference of absolute number in                 mastered only at the age of 9 or 10 (Hartnett and
      the proportional task, the multi-task model no             Gelman, 1998; Moss and Case, 1999; Sophian,
      longer works when asked to provide the num-
                                                                 2000).
      ber of target objects in the scene.
                                                                    Third, converging evidence from cognition
1     Introduction                                               and neuroscience supports the hypothesis that
                                                                 some important components of these expressions
Understanding and producing sentences like                       of quantity are grounded on a preverbal, non-
‘There are more cars than parking lots’, ‘Most of                symbolic system representing magnitudes (Piazza,
the supporters wear blue t-shirts’, ‘Twenty percent              2010). This system, often referred to as Approx-
of the trees have been planted last year’, or ‘Seven             imate Number System (ANS), is invariant to the
students passed the exam’, is a fundamental com-                 sensory modality and almost universal in the an-
petence which allows speakers to communicate                     imal domain, and consists in the ability of holis-
information about quantities. Crucially, the type                tically extracting and comparing approximate nu-
of information conveyed by these expressions, as                 merosities (Piazza and Eger, 2016). In humans, it
well as their underlying cognitive mechanisms, are               is present since the youngest age, with 6-month-
not equivalent, as suggested by evidence from lin-               old infants being able to automatically com-
guistics, language acquisition, and cognition.                   pare sets and combine them by means of proto-
   First, comparatives (‘more’, ‘less’), quantifiers             arithmetical operations (Xu and Spelke, 2000; Mc-
(‘some’, ‘most’, ‘all’), and proportions (‘20%’,                 Crink and Wynn, 2004). Since it obeys Weber’s
‘two thirds’) express a comparison or relation be-               law, according to which highly differing sets (e.g.
tween sets (e.g., between the set of cars and the                2:8) are easier to discriminate than highly similar
set of parking lots). Such relational information                sets (e.g. 7:8), ANS has been recently claimed to
is rather coarse when expressed by comparatives                  be a ratio-based mechanism (Sidney et al., 2017;
and vague quantifiers, more precise when denoted                 Matthews et al., 2016). In support of this, be-
by proportions. In contrast, numbers (‘one’, ‘six’,              havioral findings indicate that, in non-symbolic

                                                           419
                                    Proceedings of NAACL-HLT 2018, pages 419–430
                New Orleans, Louisiana, June 1 - 6, 2018. c 2018 Association for Computational Linguistics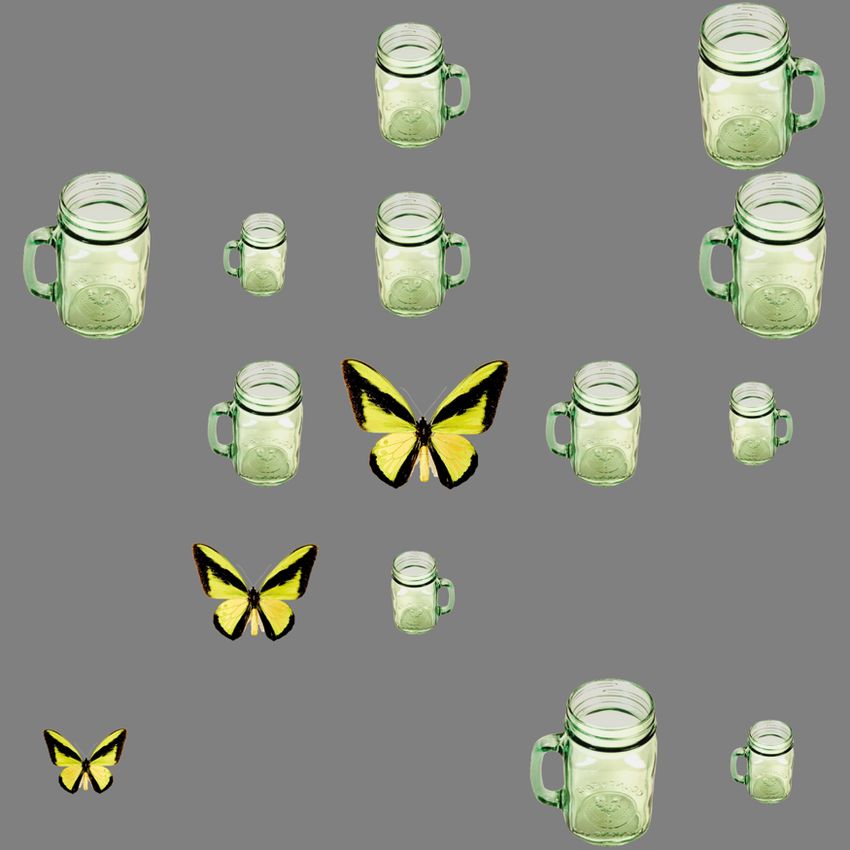
ity.1 To perform proportional estimation (the most
                                                                   complex), the model builds on the representations
                                                                   learned to perform vague quantification and, in
                                                                   turn, set comparison (the least complex). We show
                                                                   that the multi-task model achieves both higher ac-
                                                                   curacy and higher generalization power compared
                                                                   to the one-task models. In contrast, we prove that
Figure 1: Toy representation of the quantification tasks
                                                                   introducing the absolute number task in the loop is
and corresponding outputs explored in the paper. Note
that quantification always refers to animals (target set).         not beneficial and indeed hurts the performance.
                                                                      Our main contribution lies in the novel applica-
                                                                   tion and evaluation of a multi-task learning archi-
contexts (e.g. visual scenes), proportional values                 tecture on the task of jointly modeling 3 different
are extracted holistically, i.e. without relying on                quantification operations. On the one hand, our
the pre-computed cardinalities of the sets (Fab-                   results confirm the interdependency of the mech-
bri et al., 2012; Yang et al., 2015). Indeed, peo-                 anisms underlying the tasks of set comparison,
ple are fairly accurate in providing the propor-                   vague quantification, and proportional estimation.
tion of targets in a scene, even in high-speed set-                On the other, we provide further evidence on the
tings (Healey et al., 1996; Treisman, 2006). Sim-                  effectiveness of these computational architectures.
ilarly, in briefly-presented scenes, the interpreta-
tion of quantifiers is shown to be best described                  2     Related Work
by proportional information (Pezzelle et al., under
                                                                   2.1    Quantities in Language & Vision
review).
   Altogether, this suggests that performing (1)                   In recent years, the task of extracting quantity in-
set comparison, (2) vague quantification, and (3)                  formation from visual scenes has been tackled via
proportional estimation, which all rely on infor-                  Visual Question Answering (VQA). Given a real
mation regarding relations among sets, underlies                   image and a natural language question, a VQA
increasingly-complex steps of the same mecha-                      computational model is asked to understand the
nism. Notably, such complexity would range                         image, the linguistic query, and their interaction
from ‘more/less’ judgements to proportional es-                    to provide the correct answer. So-called count
timation, as suggested by the increasing preci-                    questions, i.e. ‘How many Xs have the property
sion of ANS through years (Halberda and Feigen-                    Y?’, are very frequent and have been shown to
son, 2008), the reported boundary role of ‘half’ in                be particularly challenging for any model (Antol
early proportional reasoning (Spinillo and Bryant,                 et al., 2015; Malinowski et al., 2015; Ren et al.,
1991), and the different age of acquisition of the                 2015; Fukui et al., 2016). The difficulty of the
corresponding linguistic expressions. Finally, the                 task has been further confirmed by the similarly
ratio-based operation underlying these task would                  poor performance achieved even on the ‘diagnos-
be different from (and possibly conflicting with)                  tic’ datasets, which include synthetic visual scenes
that of estimating the absolute numerosity of one                  depicting geometric shapes (Johnson et al., 2017;
set. Indeed, absolute numbers are found to inter-                  Suhr et al., 2017).
fere with the access to proportions (Fabbri et al.,                   Using Convolutional Neural Networks (CNN),
2012).                                                             a number of works in Computer Vision (CV) have
   Inspired by this converging evidence, the                       proposed specific architectures for counting dig-
present work proposes a computational framework                    its (Seguı́ et al., 2015), people in the crowd (Zhang
to explore various quantification tasks in the vi-                 et al., 2015a), and penguins (Arteta et al., 2016).
sual domain (see Figure 1). In particular, we in-                  With a more cognitive flavor, Chattopadhyay et al.
vestigate whether ratio-based quantification tasks                 (2017) employed a ‘divide-and-conquer’ strategy
can be modeled by a single, multi-task learning                    to split the image into subparts and count the ob-
neural network. Given a synthetic scene depicting                  jects in each subpart by mimicking the ‘subitizing’
animals (in our setting, the ‘target’ objects) and                 mechanism (i.e. numerosities up to 3-4 can be
artifacts (‘non-target’), our model is designed to                 rapidly and accurately appreciated). Inspired by
jointly perform all the tasks by means of an ar-                     1
                                                                       The dataset and the code can be downloaded from
chitecture that reflects their increasing complex-                 github.com/sandropezzelle/multitask-quant

                                                             420
the same cognitive ability is Zhang et al. (2015b),          cently, a few studies applied MTL techniques to
who trained a CNN to detect and count the salient            either count or estimate the number of objects in a
objects in the image. Except Suhr et al. (2017),             scene (Sun et al., 2017; Sindagi and Patel, 2017),
who evaluated models against various types of                to our knowledge none of them were devoted to
quantity expressions (including existential quanti-          the learning of various quantification mechanisms.
fiers), these works were just focused on the abso-              In the field of natural language processing
lute number.                                                 (NLP), MTL turned out to be beneficial for ma-
   More akin to our work is Stoianov and Zorzi               chine translation (Luong et al., 2016) and for a
(2012), who showed that hierarchical generative              range of tasks such as chunking, tagging, se-
models learn ANS as a statistical property of (syn-          mantic role labelling, etc. (Collobert et al., 2011;
thetic) images. Their networks were tested on                Søgaard and Goldberg, 2016; Bingel and Søgaard,
the task of set comparison (‘more/less’) and ob-             2017). In particular, Søgaard and Goldberg (2016)
tained 93% accuracy. A few studies specifically              showed the benefits of keeping low-level tasks at
focused on the learning of quantifiers. Sorodoc              the lower layers of the network, a setting which en-
et al. (2016) proposed a model to assign the cor-            ables higher-level tasks to make a better use of the
rect quantifier to synthetic scenes of colored dots,         shared representations. Since this finding was also
whereas Sorodoc et al. (2018) operationalized the            in line with previous evidence suggesting a natu-
same task in a VQA fashion, using real images                ral order among different tasks (Shen and Sarkar,
and object-property queries (e.g. ‘How many dogs             2005), further work proposed MTL models in
are black?’). Overall, the results of these studies          which several increasingly-complex tasks are hi-
showed that vague quantification can be learned              erarchically ordered (Hashimoto et al., 2017).
by neural networks, though the performance is                The intuition behind this architecture, referred
much lower when using real images and complex                to as ‘joint many-task model’ in the source pa-
queries. Finally, Pezzelle et al. (2017) investi-            per (Hashimoto et al., 2017), as well as its techni-
gated the difference between the learning of car-            cal implementation, constitute the building blocks
dinals and quantifiers from visual scenes, showing           of the model proposed in the present study.
that they require two distinct computational oper-
ations. To our knowledge, this is the first attempt
                                                             3     Tasks and Dataset
to jointly investigate the whole range of quantifi-          3.1    Tasks
cation mechanisms. Moreover, we are the first                Given a visual scene depicting a number of ani-
to exploit a multi-task learning paradigm for ex-            mals (targets) and artifacts (non-targets), we ex-
ploring the interactions between set comparison,             plore the following tasks, represented in Figure 1:
vague quantification, and proportions.
                                                             (a) set comparison (hence, setComp), i.e. judg-
2.2   Multi-Task Learning                                        ing whether the targets are ‘more’, ‘same’,
                                                                 ‘less’ than non-targets;
Multi-Task Learning (MTL) has been shown to
be very effective for a wide range of applications           (b) vague quantification (hence, vagueQ), i.e.
in machine learning (for an overview, see Ruder                  predicting the probability to use each of the 9
(2017)). The core idea is that different and yet                 quantifiers (‘none’, ‘almost none’, ‘few’, ‘the
related tasks can be jointly learned by a multi-                 smaller part’, ‘some’, ‘many’, ‘most’, ‘almost
purpose model rather than by separate and highly                 all’, ‘all’) to refer to the target set;
fine-tuned models. Since they share representa-
                                                             (c) proportional estimation (hence, propTarg),
tions between related (or ‘auxiliary’) tasks, multi-
                                                                 i.e. predicting the proportion of targets choos-
task models are more robust and generalize better
                                                                 ing among 17 ratios, ranging from 0 to 100%.
than single-task models. Successful applications
of MTL have been proposed in CV to improve ob-                  Tasks (a) and (c) are operationalized as classi-
ject classification (Girshick, 2015), face detection         fication problems and evaluated through accuracy.
and rotation (Zhang et al., 2014; Yim et al., 2015),         That is, only one answer out of 3 and 17, respec-
and to jointly perform a number of tasks as ob-              tively, is considered as correct. Given the vague
ject detection, semantic segmentation, etc. (Misra           status of quantifiers, whose meanings are ‘fuzzy’
et al., 2016; Li and Hoiem, 2016). Though, re-               and overlapping, task (b) is evaluated by means

                                                       421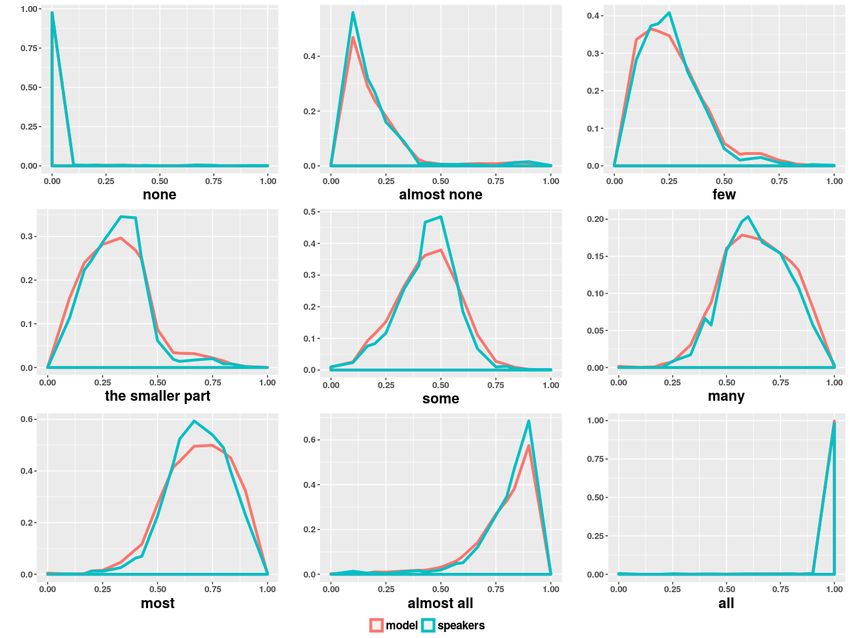
train val test total
no. datapoints 11.9K 1.7K 3.4K 17K
% datapoints 70% 10% 20% 100%
Table 1: Number and partitioning of the datapoints.
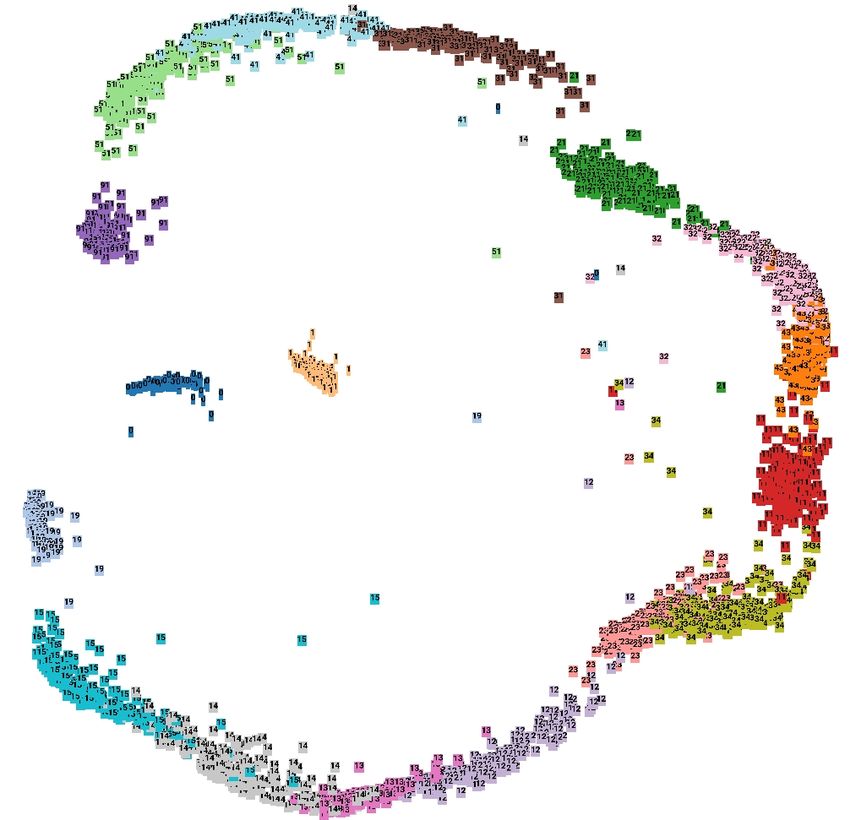
(see Figure 2). In doing so, we employed the
same methodology and materials used in Pezzelle
et al. (under review), where the use of quantifiers
Figure 2: Two scenes included in our dataset. The letf- in grounded contexts was explored by asking par-
most one depicts a ratio 1:4 (3 animals, 12 artifacts, 15 ticipants to select the most suitable quantifier for
total items), the rightmost one a ratio 2:3 (6, 9, 15). a given scene. Since the category of animals was
always treated as the ‘target’, and that of artifacts
as the ‘non-target’, we will henceforth use this ter-
of Pearson’s correlation (r) between the predicted minology throughout the paper. The scenes were
and the ground-truth probability vector (cf. § 3.2), automatically generated by an in-house script us-
for each datapoint.2 The overall r is obtained by ing the following pipeline: (a) Two natural im-
averaging these scores. It is worth mentioning that ages, one depicting a target object (e.g. a butter-
we could either evaluate (b) in terms of a classi- fly) and one depicting a non-target (e.g. a mug)
fication task or operationalize (a) and (c) in terms were randomly picked up from a sample of the
of a correlation with human responses. The for- dataset by Kiani et al. (2007). The sample was
mer evaluation is straightforward and can be eas- obtained by Pezzelle et al. (under review), who
ily carried out by picking the quantifier with the manually selected pictures depicting whole items
highest probability. The latter, in contrast, implies (not just parts) and whose color, orientation and
relying on behavioral data assessing the degree of shape were not deceptive. In total, 100 unique in-
overlap between ground-truth classes and speak- stances of animals and 145 unique instances of ar-
ers’ choice. Though interesting, such evaluation tifacts were included; (b) The proportion of tar-
is less crucial given the discrete, non-overlapping gets in the scene (e.g. 20%) was chosen by se-
nature of the classes in tasks (a) and (c). lecting one among 17 pre-defined ratios between
The tasks are explored by means of a MTL net- targets:non-targets (e.g. 1:4, ‘four non-targets to
work that jointly performs the three quantification one target’). Out of 17 ratios, 8 were positive (tar-
operations (see § 4.2). The intuition is that solving gets > 50%), 8 negative (targets < 50%), and 1
the lower-level tasks would be beneficial for tack- equal (targets = 50%); (c) The absolute number
ling the higher-level ones. In particular, providing of targets/non-targets was chosen to equally repre-
a proportional estimation (‘80%’) after perform- sent the various combinations available for a given
ing vagueQ (‘most’) and setComp (‘more’) should ratio (e.g., for ratio 1:4: 1-4, 2-8, 3-12, 4-16), with
lead to a higher accuracy in the highest-level task, the constraint of having a number of total objects
which represents a further step in complexity com- in the scene (targets+non-targets) ranging from 3
pared to the previous ones. Moreover, lower-level to 20. In total, 97 combinations were represented
tasks might be boosted in accuracy by the higher- in the dataset, with an average of 5.7 combina-
level ones, since the latter include all the opera- tions/ratio (min 2, max 18); (d) To inject some
tions that are needed to carry out the former. In variability, the instances of target/non-target ob-
addition to the MTL model, we test a number of jects were randomly resized according to one of
‘one-task’ networks specifically designed to solve three possible sizes (i.e. medium, big, and small)
one task at a time (see § 4.1). and flipped on the vertical axis before being ran-
domly inserted onto a 5*5-cell virtual grid. As re-
3.2 Dataset
ported in Table 1, 17K scenes balanced per ratio
We built a large dataset of synthetic visual scenes (1K scenes/ratio) were generated and further split
depicting a variable number of animals and ar- into train (70%), validation (10%), and test (20%).
tifacts on the top of a neutral, grey background Ground-truth classes for the tasks of setComp
2
We also experimented with Mean Average Error and dot and propTarg were automatically assigned to each
product and found the same patterns of results (not reported). scene while generating the data. For vagueQ,
422
we took the probability distributions obtained on             One-Task-Frozen These models are simple, 2-
a dataset of 340 scenes by Pezzelle et al. (un-               layer (ReLU) Multi-Layer Perceptron (MLP) net-
der review) and we applied them to our data-                  works that take as input a 2048-d frozen represen-
points, which were built in the exact same way.               tation of the scene and output a vector containing
These probability distributions had been collected            softmax probability values. The frozen represen-
by asking participants to select, from a list of              tation of the scene had been previously extracted
9 quantifiers (reported in § 3.1), the most suit-             using the state-of-art Inception v3 CNN (Szegedy
able one to describe the target objects in a visual           et al., 2016) pretrained on ImageNet (Deng et al.,
scene presented for 1 second. In particular, they             2009). In particular, the network is fed with the
were computed against the proportion of targets in            average of the features computed by the last Con-
the scene, which in that study was shown to be                volutional layer, which has size 25*2048.
the overall best predictor for quantifiers. To il-
                                                              One-Task-End2end These models are MLP
lustrate, given a scene containing 20% of targets
                                                              networks that take as input the 203*203-pixel im-
(cf. leftmost panel in Figure 2), the probability
                                                              age and compute the visual features by means of
of choosing ‘few’ (ranging from 0 to 1) is 0.38,
                                                              the embedded Inception v3 module, which outputs
‘almost none’ 0.27, ‘the smaller part’ 0.25, etc.
                                                              25*2048-d vectors (the grey and colored box in
It is worth mentioning that, for scenes contain-
                                                              Figure 1). Subsequently, the 25 feature vectors are
ing either 100% or 0% targets the probability of
                                                              reduced twice via ReLU hidden layers, then con-
choosing ‘all’ and ‘none’, respectively, is around
                                                              catenated, reduced (ReLU), and fed into a softmax
1. In all other cases, the distribution of probabili-
                                                              layer to obtain the probability values.
ties is fuzzier and reflects the largely overlapping
use of quantifiers, as in the example above. On               4.2    Multi-Task Model
average, the probability of the most-chosen quan-
                                                              The multi-task-prop model performs 3
tifier across ratios is 0.53. Though this number
                                                              tasks at the same time with an architecture that re-
cannot be seen as a genuine inter-annotator agree-
                                                              produces in its order the conjectured complexity
ment score, it suggests that, on average, there is
                                                              (see Figure 3 and its caption for technical details).
one quantifier which is preferred over the others.
                                                              The model has a core structure, represented by lay-
4       Models                                                ers 1-5 in the figure, which is shared across tasks
                                                              and trained with multiple outputs. In particular,
In this section, we describe the various models im-           (a) layers 1, 2, and 3 are trained using information
plemented to perform the tasks. For each model,               regarding the output of all 3 tasks. That is, these
several settings and parameters were evaluated by             layers are updated three times by as many back-
means of a thorough ablation analysis. Based on               propagation passes: One on the top of setComp
a number of factors like performance, speed, and              output, the second on the top of vagueQ output,
stability of the networks, we opted for using ReLU            the third on the top of propTarg output; (b) lay-
nonlinear activation at all hidden layers and the             ers 4 and 5 are affected by information regarding
simple and effective Stochastic Gradient Descent              the output of vagueQ and propTarg, and thus up-
(SGD) as optimizer (lr = 0.01). We run each model             dated twice; (c) layers 6 and 7 are updated once,
for 100 epochs and saved weights and parameters               on the top of the output of propTarg. Importantly,
of the epoch with the lowest validation loss. The             the three lower layers in Figure 3 (concatenation,
best model was then used to obtain the predictions            ReLU, softmax) are not shared between the tasks,
in the test set. All models were implemented using            but specialized to output each a specific prediction.
Keras.3                                                       As can be noted, the order of the tasks reflects their
                                                              complexity, since the last task in the pipeline has
4.1      One-Task Models                                      2 more layers than the preceding one and 4 more
We implemented separate models to tackle one                  than the first one.
task at a time. For each task, in particular, both
a network using ‘frozen’ (i.e. pretrained) visual             5     Results
features and one computing the visual features in             Table 2 reports the performance of each model
an ‘end-to-end’ fashion were tested.                          in the various tasks (note that the lowest row
    3
        https://keras.io/                                     and the rightmost column report results described

                                                        423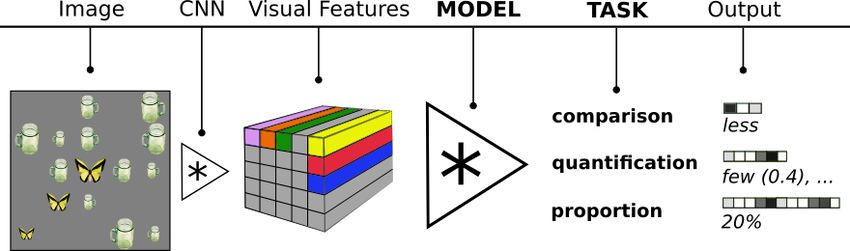
Figure 3: Architecture of the multi-task-prop model jointly performing (a) set comparison, (b) vague quan-
tification, and (c) proportional estimation. Given a 203*203-pixel image as input, the model extracts a 25*2048
representation from the last Convolutional layer of the Inception v3. Subsequently, the vectors are reduced twice
via ReLU hidden layers to 1024 and 512 dimensions. The 512-d vectors are concatenated and reduced, then a
softmax layer is applied to output a 3-d vector with probability distributions for task (a). The same structure (i.e.,
2 hidden layers, concatenation, reduction, and softmax) is repeated for tasks (b) and (c). All the tasks are trained
with cross-entropy. To evaluate tasks (a) and (c), in testing, we extract the highest-probability class and compute
accuracy, whereas task (b) is evaluated via Pearson’s correlation against the 9-d ground-truth probability vector.

in § 6.1). In setComp, all the models are neatly              i.e. object classification). On the other hand, com-
above chance/majority level (0.47). In particular,            puting the visual features in an end-to-end fashion
the one-task-end2end model achieves a re-                     leads to a significant improvement, suggesting that
markable 0.90 acc., which is more than 10% bet-               the network learns to pay attention to features that
ter compared to the simple one-task-frozen                    are helpful for specific tasks.
model (0.78). The same pattern of results can be
observed for vagueQ, where the Pearson’s correla-                The most interesting results, however, are those
tion (r) between the ground-truth and the predicted           achieved by the multi-task model, which turns out
probability vector is around 0.96, that is more than          to be the best in all the tasks. As reported in
30% over the simpler model (0.62). This gap in-               Table 2, sharing the weights between the various
creases even more in propTarg, where the accuracy             tasks is especially beneficial for propTarg, where
of the frozen model is more than 40 points below              the accuracy reaches 0.92, that is, more than 25
the one achieved by the one-task-end2end                      points over the end-to-end, one-task model. An
model (0.21 against 0.66). These results firmly in-           almost perfect performance of the model in this
dicate that, on the one hand, the frozen representa-          task can be observed in Figure 4, which reports
tion of the visual scene encodes little information           the confusion matrix with the errors made by the
about the proportion of targets (likely due to the            model. As can be seen, the few errors are between
the different task for which they were pretrained,            ‘touching’ classes, e.g. between ratio 3:4 (43% of
                                                              targets) and ratio 2:3 (40%). Since these classes

                                                        424
model          setComp         vagueQ        propTarg    nTarg
                                                accuracy       Pearson r      accuracy   accuracy
                            chance/majority       0.470          0.320          0.058     0.132
                            one-task-frozen       0.783          0.622          0.210     0.312
                           one-task-end2end       0.902          0.964          0.659     0.966
                            multi-task-prop       0.995          0.982          0.918       –
                           multi-task-number      0.854          0.807            –       0.478

Table 2: Performance of the models in the tasks of set comparison (setComp), vague quantification (vagueQ),
proportional estimation (propTarg), and absolute number of targets (nTarg). Values in bold are the highest.

differ by a very small percentage, we gain indirect                  75% (brown), and so on, until reaching 10% (light
evidence that the model is learning some kind of                     blue). Proportions 0% (blue) and 100% (yellow)
proportional information rather than trivial associ-                 are neatly separated from the other clusters, being
ations between scenes and orthogonal classes.                        at the extremes of the ‘clock’.
   To further explore this point, one way is to in-                     An improvement in the results can be also ob-
spect the last layer of the proportional task (i.e.                  served for setComp and vaqueQ, where the model
the 32-d turquoise vector in Figure 3). If the                       achieves 0.99 acc. and 0.98 r, respectively. Fig-
vectors contain information regarding the propor-                    ure 6 reports, for each quantifier, the probabil-
tion of targets, we should expect scenes depicting                   ity values predicted by the model against the
the same proportion to have a similar representa-                    ground-truth ones. As can be seen, the red lines
tion. Also, scenes with similar proportions (e.g.                    (model) approximate very closely the green ones
40% and 43%) would be closer to each other than                      (humans). In the following section, we perform
are scenes with different proportions (e.g. 25%                      further experiments to provide a deeper evaluation
and 75%). Figure 5 depicts the results of a two-                     of the results.
dimensional PCA analysis performed on the vec-
tors of the last layer of the proportional task (the                 6     In-Depth Evaluation
32-d vectors).4 As can be noted, scenes depict-                      6.1    Absolute Numbers in the Loop
ing the same proportion clearly cluster together,
                                                                     As discussed in § 1, the cognitive operation under-
thus indicating that using these representations in
                                                                     lying setComp, vagueQ, and propTarg is different
a retrieval task would lead to a very high preci-
                                                                     compared to that of estimating the absolute num-
sion. Crucially, the clusters are perfectly ordered
                                                                     ber of objects included in one set. To investigate
with respect to proportion. Starting from the pur-
                                                                     whether such dissociation emerges at the compu-
ple cluster on the left side (90%) and proceeding
                                                                     tational level, we tested a modified version of our
clockwise, we find 83% (green), 80% (turquoise),
                                                                     proposed multi-task model where propTarg task
   4
       We used https://projector.tensorflow.org/

Figure 4: PropTarg. Heatmap reporting the errors made
by the multi-task-prop model. Note that labels                       Figure 5: PCA visualization of the last layer (before
refer to ratios, i.e. 14 stands for ratio 1:4 (20% targets).         softmax) of the proportional task in the MTL model.

                                                               425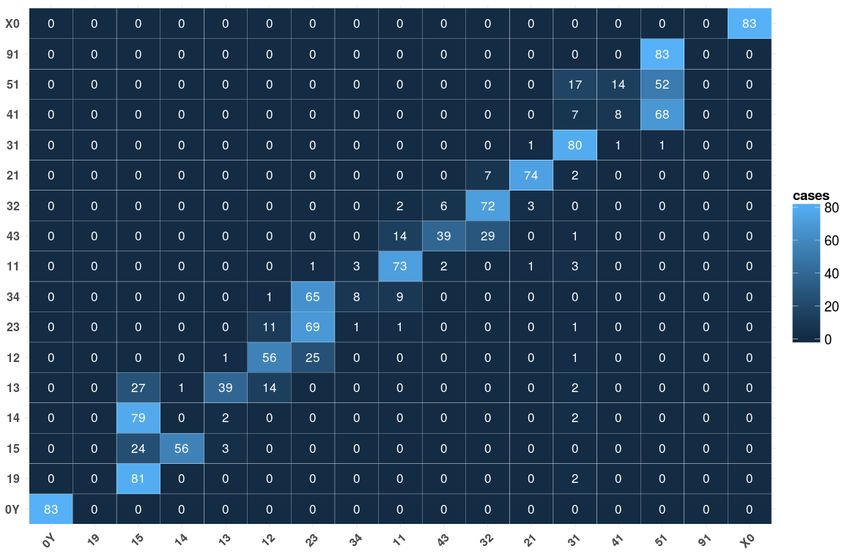
model         setComp     vagueQ     propTarg
                                                                                    accuracy   Pearson r   accuracy
                                                                  chance/majority     0.470      0.320       0.058
                                                                  one-task-frozen     0.763      0.548       0.068
                                                                 one-task-end2end     0.793      0.922       0.059
                                                                  multi-task-prop     0.943      0.960       0.539

                                                                Table 3: Unseen dataset. Performance of the models in
                                                                each task. Values in bold are the highest.

                                                                sible, it might still be the case that the model is
                                                                able to learn even when reversing the order of the
                                                                tasks, i.e. from the conjectured highest-level to
                                                                the lowest-level one. To shed light on this issue,
                                                                we tested the multi-task-prop model after
Figure 6: VagueQ. Probability values predicted by               reversing its architecture. That is, propTarg is now
the multi-task-prop model against ground-truth                  the first task, followed by vagueQ, and setComp.
probability distributions for each quantifier.                     In contrast with the pattern of results obtained
                                                                by the original pipeline, no benefits are observed
                                                                for this version of MTL model compared to
has been replaced with nTarg, namely the task of
                                                                one-task networks. In particular, both vagueQ
predicting the absolute number of targets. One-
                                                                (0.32 r) and propTarg (0.08 acc.) performance
task models were also tested to evaluate the dif-
                                                                are around chance level, with setComp reach-
ficulty of the task when performed in isolation.
                                                                ing just 0.65 acc., i.e. 25 point lower than the
Since the number of targets in the scenes ranges
                                                                one-task-end2end model. The pipeline of
from 0 to 20, nTarg is evaluated as a 21-class clas-
                                                                increasing complexity motivated theoretically is
sification task (majority class 0.13).
                                                                thus confirmed at the computational level.
   As reported in Table 2, the accuracy achieved
by the one-task-end2end model is extremely                      6.3   Does MTL Generalize?
high, i.e. around 0.97. This suggests that, when
                                                                As discussed in § 2.2, MTL is usually claimed to
learned in isolation, the task is fairly easy, but only
                                                                allow a higher generalization power. To investi-
if the features are computed within the model. In
                                                                gate whether our proposed multi-task-prop
fact, using frozen features results in a quite low ac-
                                                                model genuinely learns to quantify from visual
curacy, namely 0.31. This pattern of results is even
                                                                scenes, and not just associations between patterns
more interesting if compared against the results
                                                                and classes, we tested it with unseen combinations
of the multi-task-number model. When in-
                                                                of targets/non-targets. The motivation is that, even
cluded in the multi-task pipeline, in fact, nTarg has
                                                                in the most challenging propTarg task, the model
a huge, 50-point accuracy drop (0.48). Moreover,
                                                                might learn to match a given combination, e.g.
both setComp and vagueQ turn out to be signif-
                                                                3:12, to a given proportion, i.e. 20%. If this is the
icantly hurt by the highest-level task, and expe-
                                                                case, the model would solve the task by learning
rience a drop of around 14 and 17 points com-
                                                                “just” to assign a class to each of the 97 possible
pared to the one-task-end2end model, re-
                                                                combinations included in the dataset. If it learns
spectively. These findings seem to corroborate the
                                                                a more abstract representation of the proportion of
incompatibility of the operations needed for solv-
                                                                targets depicted in the scene, in contrast, it should
ing the tasks.
                                                                be able to generalize to unseen combinations.
                                                                   We built an additional dataset using the exact
6.2   Reversing the Architecture
                                                                same pipeline described in § 3.2. This time, how-
Previous work exploring MTL suggested that                      ever, we randomly selected one combination per
defining a hierarchy of increasingly-complex tasks              ratio (17 combinations in total) to be used only for
is beneficial for jointly learning related tasks                validation and testing. The remaining 80 combina-
(see § 2.2). In the present work, the order of                  tions were used for training. A balanced number
the tasks was inspired by cognitive and linguis-                of datapoints for each combination were gener-
tic abilities (see § 1). Though cognitively implau-             ated in val/test, whereas datapoints in training set

                                                          426
were balanced with respect to ratios, by randomly
selecting scenes among the remaining combina-
tions. The unseen dataset included around 14K
datapoints (80% train, 10% val, 10% test). Table
3 reports the results of the models on the unseen
dataset. Starting from setComp, we note a simi-
lar and fairly high accuracy achieved by the two
one-task models (0.76 and 0.79, respectively). In
vagueQ, in contrast, the one-task-end2end
model neatly outperforms the simpler model (0.92
vs. 0.55 r). Finally, in propTarg both models are
at chance level, with an accuracy that is lower than
0.07. Overall, this pattern of results suggests that         Figure 7: PropTarg. Heatmap with the errors made by
propTarg is an extremely hard task for the sepa-             the multi-task-prop model in the unseen dataset.
rate models, which are not able to generalize to
unseen combinations. The multi-task-prop
                                                             For instance, can these methods be successfully
model, in contrast, shows a fairly high generaliza-
                                                             applied to datasets of real scenes? We firmly be-
tion power. In particular, it achieves 0.54 acc. in
                                                             lieve this to be the case, though the results might
propTarg, that is, almost 10 times chance level.
                                                             be affected by the natural biases contained in those
The overall good performance in predicting the
                                                             images. Also, is this pipeline of increasing com-
correct proportion can be appreciated in Figure 7,
                                                             plexity specific to vision (non-symbolic level),
where the errors are represented by means of a
                                                             or is it shared across modalities, in primis lan-
heatmap. The error analysis reveals that end-of-
                                                             guage? Since linguistic expressions of quantity are
the-scale proportions (0% and 100%) are the easi-
                                                             grounded on a non-symbolic system, we might ex-
est, followed by proportions 75% (3:1), 67% (2:1),
                                                             pect that a model trained on one modality can be
50% (1:1), and 60% (3:2). More in general, neg-
                                                             applied to another, at least to some extent. Even
ative ratios (targets < 50%) are mispredicted to a
                                                             further, jointly learning representations from both
much greater extent than are positive ones. More-
                                                             modalities might represent an even more natural,
over, the model shows a bias toward some propor-
                                                             human-like way to learn and refer to quantities.
tions, that the model seems ‘to see everywhere’.
                                                             Further work is needed to explore all these issues.
However, the fact that the errors are found among
the adjacent ratios (similar proportions) seems to           Acknowledgments
be a convincing evidence that the model learns
representations encoding genuine proportional in-            We kindly acknowledge Gemma Boleda and the
formation. Finally, it is worth mentioning that              AMORE team (UPF), Raquel Fernández and the
in setComp and vagueQ the model achieves very                Dialogue Modelling Group (UvA) for the feed-
high results, 0.94 acc. and 0.96 r, respectively.            back, advice and support. We are also grateful to
                                                             Aurélie Herbelot, Stephan Lee, Manuela Piazza,
7   Discussion                                               Sebastian Ruder, and the anonymous reviewers
                                                             for their valuable comments. This project has re-
In the present study, we investigated whether                ceived funding from the European Research Coun-
ratio-based quantification mechanisms, expressed             cil (ERC) under the European Union’s Horizon
in language by comparatives, quantifiers, and pro-           2020 research and innovation programme (grant
portions, can be computationally modeled in vi-              agreement No 715154). We gratefully acknowl-
sion exploiting MTL. We proved that sharing a                edge the support of NVIDIA Corporation with the
common core turned out to boost the performance              donation of GPUs used for this research. This pa-
in all the tasks, supporting evidence from linguis-          per reflects the authors’ view only, and the EU is
tics, language acquisition, and cognition. More-             not responsible for any use that may be made of
over, we showed (a) the increasing complexity of             the information it contains.
the tasks, (b) the interference of absolute number,
and (c) the high generalization power of MTL.
These results lead to many additional questions.

                                                       427
References Patrice Hartnett and Rochel Gelman. 1998. Early un-
derstandings of numbers: Paths or barriers to the
Stanislaw Antol, Aishwarya Agrawal, Jiasen Lu, Mar- construction of new understandings? Learning and
garet Mitchell, Dhruv Batra, C Lawrence Zitnick, instruction 8(4):341–374.
and Devi Parikh. 2015. VQA: Visual Question An-
swering. In Proceedings of the IEEE International Kazuma Hashimoto, Caiming Xiong, Yoshimasa Tsu-
Conference on Computer Vision. pages 2425–2433. ruoka, and Richard Socher. 2017. A Joint Many-
Carlos Arteta, Victor Lempitsky, and Andrew Zisser- Task Model: Growing a Neural Network for Mul-
man. 2016. Counting in the wild. In European Con- tiple NLP Tasks. In Proceedings of the 2017 Con-
ference on Computer Vision. Springer, pages 483– ference on Empirical Methods in Natural Language
498. Processing (EMNLP). Association for Computa-
tional Linguistics, Copenhagen, Denmark, pages
Joachim Bingel and Anders Søgaard. 2017. Identify- 446–456.
ing beneficial task relations for multi-task learning
in deep neural networks. EACL 2017 page 164. Christopher G Healey, Kellogg S Booth, and James T
Enns. 1996. High-speed visual estimation us-
Peter Bryant. 2017. Perception and understanding ing preattentive processing. ACM Transactions on
in young children: An experimental approach, vol- Computer-Human Interaction (TOCHI) 3(2):107–
ume 4. Routledge. 135.
Prithvijit Chattopadhyay, Ramakrishna Vedantam, Felicia Hurewitz, Anna Papafragou, Lila Gleitman, and
Ramprasaath R. Selvaraju, Dhruv Batra, and Devi Rochel Gelman. 2006. Asymmetries in the acquisi-
Parikh. 2017. Counting everyday objects in every- tion of numbers and quantifiers. Language learning
day scenes. In The IEEE Conference on Computer and development 2(2):77–96.
Vision and Pattern Recognition (CVPR).
Justin Johnson, Bharath Hariharan, Laurens van der
Ronan Collobert, Jason Weston, Léon Bottou, Michael Maaten, Li Fei-Fei, C Lawrence Zitnick, and Ross
Karlen, Koray Kavukcuoglu, and Pavel Kuksa. Girshick. 2017. CLEVR: A diagnostic dataset for
2011. Natural language processing (almost) from compositional language and elementary visual rea-
scratch. Journal of Machine Learning Research soning. In 2017 IEEE Conference on Computer Vi-
12(Aug):2493–2537. sion and Pattern Recognition (CVPR). IEEE, pages
1988–1997.
Jia Deng, Wei Dong, Richard Socher, Li-Jia Li, Kai Li,
and Li Fei-Fei. 2009. Imagenet: A large-scale hi- Roozbeh Kiani, Hossein Esteky, Koorosh Mirpour, and
erarchical image database. In Computer Vision and Keiji Tanaka. 2007. Object category structure in re-
Pattern Recognition, 2009. CVPR 2009. IEEE Con- sponse patterns of neuronal population in monkey
ference on. IEEE, pages 248–255. inferior temporal cortex. Journal of neurophysiol-
Sara Fabbri, Sara Caviola, Joey Tang, Marco Zorzi, and ogy 97(6):4296–4309.
Brian Butterworth. 2012. The role of numerosity in
Mathieu Le Corre and Susan Carey. 2007. One, two,
processing nonsymbolic proportions. The Quarterly
three, four, nothing more: An investigation of the
Journal of Experimental Psychology 65(12):2435–
conceptual sources of the verbal counting principles.
2446.
Cognition 105(2):395–438.
Akira Fukui, Dong Huk Park, Daylen Yang, Anna
Rohrbach, Trevor Darrell, and Marcus Rohrbach. Zhizhong Li and Derek Hoiem. 2016. Learning with-
2016. Multimodal compact bilinear pooling for vi- out forgetting. In European Conference on Com-
sual question answering and visual grounding. In puter Vision. Springer, pages 614–629.
Conference on Empirical Methods in Natural Lan-
Minh-Thang Luong, Quoc V. Le, Ilya Sutskever, Oriol
guage Processing. ACL, pages 457–468.
Vinyals, and Lukasz Kaiser. 2016. Multi-task se-
Ross Girshick. 2015. Fast R-CNN. In Proceedings quence to sequence learning. In International Con-
of the IEEE international conference on computer ference on Learning Representations (ICLR). San
vision. pages 1440–1448. Juan, Puerto Rico.
Justin Halberda and Lisa Feigenson. 2008. Develop- Mateusz Malinowski, Marcus Rohrbach, and Mario
mental change in the acuity of the “Number Sense”: Fritz. 2015. Ask your neurons: A neural-based ap-
The Approximate Number System in 3-, 4-, 5-, and proach to answering questions about images. In
6-year-olds and adults. Developmental psychology Proceedings of the IEEE international conference
44(5):1457. on computer vision. pages 1–9.
Justin Halberda, Len Taing, and Jeffrey Lidz. 2008. Percival G Matthews, Mark Rose Lewis, and Ed-
The development of ‘most’ comprehension and ward M Hubbard. 2016. Individual differences in
its potential dependence on counting ability in nonsymbolic ratio processing predict symbolic math
preschoolers. Language Learning and Development performance. Psychological science 27(2):191–
4(2):99–121. 202.
428Koleen McCrink and Karen Wynn. 2004. Large- Pooja G Sidney, Clarissa A Thompson, Percival G
number addition and subtraction by 9-month-old in- Matthews, and Edward M Hubbard. 2017. From
fants. Psychological Science 15(11):776–781. continuous magnitudes to symbolic numbers: The
centrality of ratio. Behavioral and Brain Sciences
Utako Minai. 2006. Everyone knows, therefore ev- 40.
ery child knows: An investigation of logico-semantic
competence in child language. Ph.D. thesis, Univer- Vishwanath A Sindagi and Vishal M Patel. 2017.
sity of Maryland. CNN-Based cascaded multi-task learning of high-
level prior and density estimation for crowd count-
Ishan Misra, Abhinav Shrivastava, Abhinav Gupta, and ing. In Advanced Video and Signal Based Surveil-
Martial Hebert. 2016. Cross-stitch networks for lance (AVSS), 2017 14th IEEE International Confer-
multi-task learning. In Proceedings of the IEEE ence on. IEEE, pages 1–6.
Conference on Computer Vision and Pattern Recog-
nition. pages 3994–4003. Anders Søgaard and Yoav Goldberg. 2016. Deep
multi-task learning with low level tasks supervised
Joan Moss and Robbie Case. 1999. Developing chil-
at lower layers. In Proceedings of the 54th Annual
dren’s understanding of the rational numbers: A new
Meeting of the Association for Computational Lin-
model and an experimental curriculum. Journal for
guistics. volume 2, pages 231–235.
research in mathematics education pages 122–147.
Darko Odic, Paul Pietroski, Tim Hunter, Jeffrey Lidz, Catherine Sophian. 2000. Perceptions of proportional-
and Justin Halberda. 2013. Young children’s un- ity in young children: matching spatial ratios. Cog-
derstanding of “more” and discrimination of number nition 75(2):145 – 170.
and surface area. Journal of Experimental Psychol-
ogy: Learning, Memory, and Cognition 39(2):451. Ionut Sorodoc, Angeliki Lazaridou, Gemma Boleda,
Aurélie Herbelot, Sandro Pezzelle, and Raffaella
Sandro Pezzelle, Raffaella Bernardi, and Manuela Pi- Bernardi. 2016. “Look, some green circles!”:
azza. under review. Probing the mental scale of Learning to quantify from images. In Proceedings
quantifiers. Cognition . of the 5th Workshop on Vision and Language. pages
75–79.
Sandro Pezzelle, Marco Marelli, and Raffaella
Bernardi. 2017. Be precise or fuzzy: Learning the Ionut Sorodoc, Sandro Pezzelle, Aurélie Herbelot,
meaning of cardinals and quantifiers from vision. In Mariella Dimiccoli, and Raffaella Bernardi. 2018.
Proceedings of the 15th Conference of the European Learning quantification from images: A structured
Chapter of the Association for Computational Lin- neural architecture. Natural Language Engineering
guistics: Volume 2, Short Papers. Association for page 1–30.
Computational Linguistics, Valencia, Spain, pages
337–342. Alina G Spinillo and Peter Bryant. 1991. Children’s
proportional judgments: The importance of “half”.
Manuela Piazza. 2010. Neurocognitive start-up tools Child Development 62(3):427–440.
for symbolic number representations. Trends in cog-
nitive sciences 14(12):542–551. Ivilin Stoianov and Marco Zorzi. 2012. Emergence of
a ‘visual number sense’ in hierarchical generative
Manuela Piazza and Evelyn Eger. 2016. Neural foun- models. Nature neuroscience 15(2):194–196.
dations and functional specificity of number repre-
sentations. Neuropsychologia 83:257–273. Alane Suhr, Mike Lewis, James Yeh, and Yoav Artzi.
2017. A corpus of natural language for visual rea-
Mengye Ren, Ryan Kiros, and Richard Zemel. 2015.
soning. In 55th Annual Meeting of the Association
Exploring models and data for image question an-
for Computational Linguistics, ACL.
swering. In Advances in neural information pro-
cessing systems. pages 2953–2961.
Maojin Sun, Yan Wang, Teng Li, Jing Lv, and Jun
Sebastian Ruder. 2017. An overview of multi-task Wu. 2017. Vehicle counting in crowded scenes with
learning in deep neural networks. arXiv preprint multi-channel and multi-task convolutional neural
arXiv:1706.05098 . networks. Journal of Visual Communication and
Image Representation 49:412–419.
Santi Seguı́, Oriol Pujol, and Jordi Vitria. 2015. Learn-
ing to count with deep object features. In Proceed- Christian Szegedy, Vincent Vanhoucke, Sergey Ioffe,
ings of the IEEE Conference on Computer Vision Jon Shlens, and Zbigniew Wojna. 2016. Rethinking
and Pattern Recognition Workshops. pages 90–96. the Inception Architecture for Computer Vision. In
Proceedings of the IEEE Conference on Computer
Hong Shen and Anoop Sarkar. 2005. Voting between Vision and Pattern Recognition. pages 2818–2826.
multiple data representations for text chunking. In
Conference of the Canadian Society for Computa- Anne Treisman. 2006. How the deployment of atten-
tional Studies of Intelligence. Springer, pages 389– tion determines what we see. Visual Cognition 14(4-
400. 8):411–443. PMID: 17387378.
429Fei Xu and Elizabeth S Spelke. 2000. Large number
discrimination in 6-month-old infants. Cognition
74(1):B1–B11.
Ying Yang, Qingfen Hu, Di Wu, and Shuqi Yang. 2015.
Children’s and adults’ automatic processing of pro-
portion in a Stroop-like task. International Journal
of Behavioral Development 39(2):97–104.
Junho Yim, Heechul Jung, ByungIn Yoo, Changkyu
Choi, Dusik Park, and Junmo Kim. 2015. Rotating
your face using multi-task deep neural network. In
Proceedings of the IEEE Conference on Computer
Vision and Pattern Recognition. pages 676–684.
Cong Zhang, Hongsheng Li, Xiaogang Wang, and Xi-
aokang Yang. 2015a. Cross-scene crowd counting
via deep convolutional neural networks. In Proceed-
ings of the IEEE Conference on Computer Vision
and Pattern Recognition. pages 833–841.
Jianming Zhang, Shugao Ma, Mehrnoosh Sameki, Stan
Sclaroff, Margrit Betke, Zhe Lin, Xiaohui Shen,
Brian Price, and Radomir Mech. 2015b. Salient ob-
ject subitizing. In Proceedings of the IEEE Confer-
ence on Computer Vision and Pattern Recognition.
pages 4045–4054.
Zhanpeng Zhang, Ping Luo, Chen Change Loy, and
Xiaoou Tang. 2014. Facial landmark detection by
deep multi-task learning. In European Conference
on Computer Vision. Springer, pages 94–108.
430You can also read