Ventral and Dorsal Stream Interactions during the Perception of the Müller-Lyer Illusion: Evidence Derived from fMRI and Dynamic Causal Modeling
←
→
Page content transcription
If your browser does not render page correctly, please read the page content below
Ventral and Dorsal Stream Interactions during
                                        the Perception of the Müller-Lyer Illusion:
                                             Evidence Derived from fMRI and
                                                Dynamic Causal Modeling

                                                                                                                                                                                     Downloaded from http://mitprc.silverchair.com/jocn/article-pdf/24/10/2015/1778352/jocn_a_00258.pdf by MIT Libraries user on 17 May 2021
                                                   Thorsten Plewan1, Ralph Weidner1, Simon B. Eickhoff1,2,
                                                                   and Gereon R. Fink1,3

                    Abstract
                    ■ The human visual system converts identically sized retinal                             strength. Dynamic causal modeling was employed to investigate
                    stimuli into different-sized perceptions. For instance, the Müller-                      putative interactions between ventral and dorsal visual streams.
                    Lyer illusion alters the perceived length of a line via arrows                           Bayesian model selection indicated that a model that involved
                    attached to its end. The strength of this illusion can be expressed                      bidirectional connections between dorsal and ventral stream areas
                    as the difference between physical and perceived line length.                            most accurately accounted for the underlying network dynamics.
                    Accordingly, illusion strength reflects how strong a representa-                         Connections within this network were partially modulated by illu-
                    tion is transformed along its way from a retinal image up to a                           sion strength. The data further suggest that the two areas subserve
                    conscious percept. In this study, we investigated changes of                             differential roles: Whereas lateral occipital cortex seems to be di-
                    effective connectivity between brain areas supporting these trans-                       rectly related to size transformation processes, activation in right
                    formation processes to further elucidate the neural underpinnings                        superior parietal cortex may reflect subsequent levels of process-
                    of optical illusions. The strength of the Müller-Lyer illusion was                       ing, including task-related supervisory functions. Furthermore,
                    parametrically modulated while participants performed either                             the data demonstrate that the observerʼs top–down settings modu-
                    a spatial or a luminance task. Lateral occipital cortex and right                        late the interactions between lateral occipital and superior parietal
                    superior parietal cortex were found to be associated with illusion                       regions and thereby influence the effect of illusion strength. ■

                    INTRODUCTION
                                                                                                             separable (albeit interacting) units. According to this expla-
                    Visual illusions demonstrate that contextual information                                 nation, originally postulated by Milner and Goodale (1995),
                    affects perception. For example, the Müller-Lyer illusion                                “vision for perception” involves the ventral visual stream,
                    (Müller-Lyer, 1889) alters the perceived length of a line                                whereas “vision for action” involves brain areas located
                    via arrows attached to its ends that either point inward or                              within the dorsal visual stream.
                    outward. Apparently, two identical retinal stimuli are trans-                                Consistent with this idea, it has been demonstrated
                    formed into different-sized representations, generating dif-                             that brain areas within the ventral visual pathway are,
                    ferent size perceptions. The difference between retinal                                  indeed, closely associated with illusion processing. For in-
                    and perceived size is defined as the strength of the illu-                               stance, the lateral occipital cortex (LOC) contributes to a
                    sion. It indicates the amount of transformation a stimulus                               variety of visual illusions such as illusory contours or optical
                    representation undergoes while being processed to a level                                geometric illusions (Weidner, Boers, Mathiak, Dammers, &
                    where it influences behavior. In the case of the Müller-Lyer                             Fink, 2010; Weidner & Fink, 2007; Brighina et al., 2003;
                    illusion, this strength depends on the arrowsʼ lengths and                               Ritzl et al., 2003; Seghier et al., 2000; Hirsch et al., 1995).
                    the angle enclosed (Pressey & Martin, 1990; Erlebacher &                                     Findings are less conclusive with regard to the dorsal
                    Sekuler, 1969).                                                                          visual stream. On the one hand, the dorsal pathway is not
                        Interestingly, this alteration of perceived size has a rela-                         blind to illusory information (Bruno & Franz, 2009; Bruno,
                    tively weaker effect on visually guided action than con-                                 Bernardis, & Gentilucci, 2008). For example, a study inves-
                    scious report (e.g., Bruno & Franz, 2009). This has been                                 tigating the neural mechanisms underlying the Müller-Lyer
                    taken as evidence that the visual system may contain two                                 illusion confirmed the role of ventral visual areas in illusion
                                                                                                             processing but also demonstrated that illusion strength
                                                                                                             modulates neural activity in the dorsal visual stream,
                    1
                     Research Centre Jülich, 2Heinrich-Heine University, Düssel-                             namely in the right superior parietal cortex (SPC; Weidner
                    dorf, Germany, 3Cologne University                                                       & Fink, 2007).

                    © 2012 Massachusetts Institute of Technology                                                   Journal of Cognitive Neuroscience 24:10, pp. 2015–2029
Downloaded from http://www.mitpressjournals.org/doi/pdf/10.1162/jocn_a_00258 by guest on 28 September 2021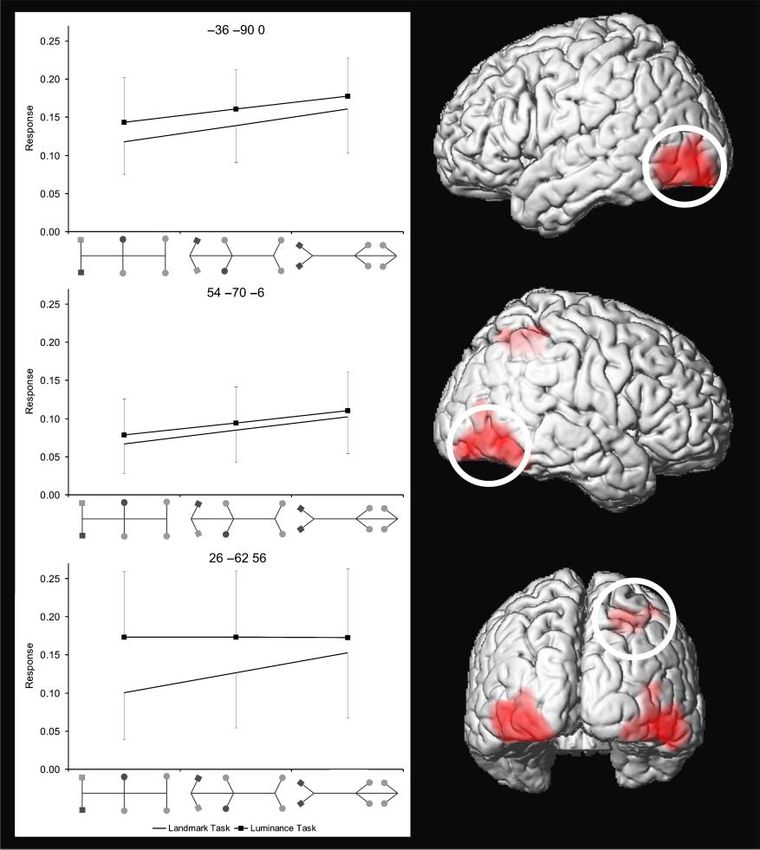
On the other hand, studies involving brain-damaged pa-                                  the experiment in accordance with the Declaration of
                 tients pointed out that extrastriate areas seem to have a                                   Helsinki. The study was approved by the ethics committee
                 more prominent role in illusion processing than SPC (Vallar                                 of the German Society of Psychology. Participantsʼ ages
                 & Daini, 2006; Daini, Angelelli, Antonucci, Cappa, & Vallar,                                ranged from 21 to 39 years (median = 26 years). All par-
                 2002). Subsequently, in a recent study with healthy volun-                                  ticipants had a normal or corrected-to-normal vision.
                 teers, the functional relevance of SPC in the processing
                 of visual illusions was tested by TMS. Whereas TMS over
                                                                                                             Stimuli
                 LOC significantly decreased the strength of the Müller-Lyer

                                                                                                                                                                                Downloaded from http://mitprc.silverchair.com/jocn/article-pdf/24/10/2015/1778352/jocn_a_00258.pdf by MIT Libraries user on 17 May 2021
                 illusion, TMS over right SPC resulted only in a numerical                                   Stimuli were displayed on a shielded LCD monitor mounted
                 (nonsignificant) decrease of illusion strength (Mancini,                                    outside the scanner on the wall behind the subjectʼs head.
                 Bolognini, Bricolo, & Vallar, 2011). On the basis of this ob-                               The screen was seen via a mirror system mounted on top
                 servation, it was concluded that SPC may not be involved                                    of the head coil. There were four possible stimulus posi-
                 in generating the illusion per se. In other words, the right                                tions, which were located diagonally around the center of
                 SPC could be considered as a higher level processing unit                                   the screen. Thus, the stimulus center and the screen center
                 receiving information from LOC rather than interactively                                    were about 1.9° visual angle apart. Locations were allocated
                 contributing to the transformation from retinal to perceived                                randomly with the exception that the location was never
                 size. If that conclusion is correct, illusion related activation                            identical in two consecutive trials.
                 in LOC is expected to causally affect processing in SPC but                                    The stimuli in the present experiment consisted of a
                 not vice versa. This hypothesis is directly amenable to test-                               horizontal line (about 4.4° visual angle) with an arrow-like
                 ing by investigating effective connectivity between ventral                                 element (approximately 0.9° visual angle) at each end and
                 and dorsal stream areas during illusion perception, using                                   a third arrow-like element bisecting the horizontal line
                 fMRI and dynamic causal modeling (DCM; Friston, Harrison,                                   into two segments. All of these elements were bounded
                 & Penny, 2003). Moreover, to dissociate different levels of                                 by either a circle or a diamond (Figure 1). The arrow-like
                 processing, we tested whether signal changes as well as                                     elements were arranged in such a way that they formed
                 the underlying neural dynamics were modulated by endog-                                     a variant of the Müller-Lyer illusion, where one segment
                 enous cognitive settings. Accordingly, healthy volunteers                                   of the line is perceptually enlarged, whereas the other
                 performed either a spatial task, that is, the perceptual land-                              segment is perceptually diminished (Figure 1).
                 mark task (Fink et al., 2000; Bisiach, Ricci, Lualdi, & Colombo,                               Across trials, the stimuli were independently varied with
                 1998), or alternatively a luminance task.                                                   regard to three aspects: (1) the angle between the arrowsʼ
                     In the landmark task, participants indicated whether stim-                              fins, (2) the position at which the horizontal line was
                 uli were correctly prebisected or not. In the luminance                                     bisected, and (3) the luminance of the bounding objects
                 task, the same stimuli were judged with regard to lumi-                                     (i.e., the circle or the diamond).
                 nance aspects of the stimulus. The stimuli used consisted
                 of an adaptation of the Brentano version of the Müller-Lyer
                                                                                                             Angles
                 illusion. During both tasks, illusion strength was modulated
                 by varying the angles of the illusion-inducing arrows.                                      It is known that the illusion strength generated by Müller-
                     On the basis of previous findings ( Weidner et al., 2010;                               Lyer figures depends on the angle enclosed by its arrows
                 Weidner & Fink, 2007), we hypothesized that illusion                                        (Pressey & Martin, 1990; Erlebacher & Sekuler, 1969).
                 strength is coded in both ventral and dorsal stream areas.                                  Thus, the perceived position at which a horizontal line is
                 Furthermore, we expected the connectivity analysis to un-                                   bisected is affected by the angles enclosed by the arrows
                 veil the interactions between these areas, that is, whether                                 (and thus by illusion strength). For instance, with an angle
                 ventral stream areas drive activations in the dorsal stream                                 of 180° (Figure 1, left) no illusion is induced. Accordingly,
                 or vice versa. In addition, we presumed that the spatial                                    a vertical line that bisects the horizontal line at its physical
                 top–down context as induced by the landmark task mod-                                       midpoint is exactly perceived in the middle. Changing the
                 ulates processing within this network. In particular, we                                    angles between the arrowsʼ fins shifts the perceived mid-
                 expected that spatial top–down context would alter higher                                   point away from the actual physical midpoint. Thereby,
                 (postattentive) aspects of illusion coding, whereas early                                   smaller angles increase this perceived shift. Similarly, a
                 (preattentive) levels of representation would remain un-                                    vertical line that bisects the horizontal line at a location
                 affected by top–down settings.                                                              that is physically displaced from the objective midpoint
                                                                                                             (e.g., by 10% of the overall length of the horizontal line)
                                                                                                             is only perceived exactly at this location when no illusion
                 METHODS                                                                                     is induced (i.e., with an 180° angle between the fins of
                                                                                                             the arrow). Again, altering the arrowʼs angles will shift
                 Participants                                                                                the perceived position away from this location. Using the
                 Twenty-four healthy participants (nine women) partici-                                      appropriate angle configuration, the perceived position
                 pated in a single fMRI experiment. Participants were paid                                   can be moved in such a way that it appears to bisect the
                 for their participation and gave informed consent before                                    horizontal line right in the middle. Thus, illusion strength

                 2016        Journal of Cognitive Neuroscience                                                                                      Volume 24, Number 10
Downloaded from http://www.mitpressjournals.org/doi/pdf/10.1162/jocn_a_00258 by guest on 28 September 2021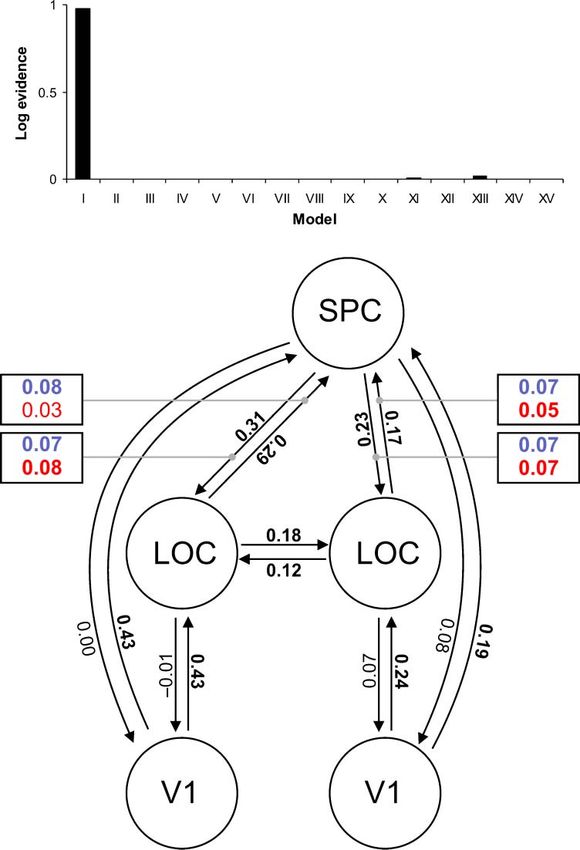
Figure 1. Examples of
                    (Müller-Lyer) figures used in
                    the fMRI experiment. On the
                    left, the neutral figure is shown,
                    which is physically correctly
                    prebisected. The four marks
                    indicate the other possible
                    locations of the midarrow
                    segment (shifted either 5%

                                                                                                                                                                              Downloaded from http://mitprc.silverchair.com/jocn/article-pdf/24/10/2015/1778352/jocn_a_00258.pdf by MIT Libraries user on 17 May 2021
                    or 10% to the left or right,
                    respectively). On the right,
                    the perceived center is shifted
                    to the left (via modulation
                    of the wingsʼ angles) and
                    corresponds to the leftmost
                    mark in the neutral figure. As
                    in the left part of the figure,
                    the (light gray) marks represent
                    the four other possible positions of the midarrow segment (the most right mark resides on the physical middle of the horizontal line). In the
                    landmark task participants had to indicate whether the midarrow segment bisects the horizontal line correct or not. Also the two parts of the
                    figure show two possible configurations of the bounding objects. In the right figure, a “rectangle” is constituted with all four elements having
                    the same luminance, whereas in the left figure, there is a diverging element within the “rectangle.” In the luminance task, the participants
                    were asked to decide whether there was a deviating element within the “rectangle” or not. The dotted lines in the figure serve to elucidate
                    the “rectangle” and were not shown during the experiment.

                    compensates the actual physical displacement (i.e., the                                  Position of Bisection
                    perceived shift equals 10% of the overall length of the
                                                                                                             The Müller-Lyer figures presented during the main experi-
                    horizontal line).
                                                                                                             ment involved different bisection positions. For each angle
                       The strength of the illusion was individually adjusted
                                                                                                             configuration derived during the prescanning procedure,
                    across subjects to account for interindividual variability
                                                                                                             there were five different positions where the midarrow
                    concerning the susceptibility to illusions (Hamburger &
                                                                                                             segment could bisect the horizontal line (see Figure 1):
                    Hansen, 2010). The latter was achieved as follows: Before
                                                                                                             One of these positions was located on the position of sub-
                    the fMRI measurement, participants, while already lying
                                                                                                             jective equality, that is, the participant perceived the arrow
                    in the scanner, saw the illusion-inducing stimuli (as illus-
                                                                                                             exactly at the middle of the horizontal line. Alternatively,
                    trated in Figure 1) and were asked to alter the angles be-
                                                                                                             the midarrow segment was shifted either 5% or 10% (rela-
                    tween the arrows (by button-press) to adjust the strength
                                                                                                             tive to the absolute line length) to the left or right of the
                    of the illusion. The aim of this procedure was to identify
                                                                                                             position of subjective equality.
                    angle configurations that induce perceptual shifts that
                                                                                                                For instance, in the 10% illusion-right condition, the
                    equal 10% or 20% of the overall length of the horizontal
                                                                                                             possible positions ranged from 20% to the left up to
                    line (see below). For this purpose, the horizontal line was
                                                                                                             the physical center of the line, as indicated in Figure 1
                    kept constant across trials, and the midarrow segment was
                                                                                                             (right). To make it more clear, in this condition, the per-
                    shifted 5% or 10% to the left or right side relative to the
                                                                                                             ceived center was shifted 10% to the left relative to the
                    physical midpoint (see Figure 1). Participants were in-
                                                                                                             physical center. Consequently, the positions of bisection
                    structed to adjust the arrows in such a way that both seg-
                                                                                                             were centered around this point with possible shifts of
                    ments of the prebisected line were perceived as equally
                                                                                                             5% or 10% to either side.
                    long (i.e., that the horizontal line appears to be bisected
                                                                                                                The order of conditions as well as the position of the
                    in the middle). Thus, the perceived length of the two line
                                                                                                             bisection were independendly randomized and counter-
                    segments was identical, albeit one segment physically
                                                                                                             balanced across the experiment.
                    occupied 10% or 20% more of the (constant) overall length
                    (see Figure 1). During this prescanning procedure, each
                    adjustment was repeated four times for each of the four
                                                                                                             Luminance of the Bounding Objects
                    line configurations in a randomized order.
                       This procedure ensured individually matched illusion                                  All arrows had objects attached to the wingsʼ ends (Fig-
                    strengths of 10% or 20% across subjects (henceforth,                                     ure 1). Each illusion figure hence comprised the line, the
                    “10% illusion” and “20% illusion”) for both the leftward                                 three arrows and six objects, four of which were of the
                    and rightward pointing Müller-Lyer figure (henceforth,                                   same shape (i.e., four circles and two squares or alter-
                    “-left” and “-right”). These four angle values were used                                 natively four squares and two circles).
                    during the main exeriment. In addition, there was a neu-                                    The four identical objects always constituted an im-
                    tral condition where the arrowʼs fins were fixed to an                                   aginary rectangle, which was either located on the left or
                    180° angle (i.e., vertical lines).                                                       right side of the Müller-Lyer figure (see dotted lines in

                                                                                                                                                    Plewan et al.     2017
Downloaded from http://www.mitpressjournals.org/doi/pdf/10.1162/jocn_a_00258 by guest on 28 September 2021
Figure 1). The objects were presented in a medium gray The fMRI data were analyzed using the statistical para-
(62.70 cd/m2). However, each illusion figure contained metric mapping software SPM (Wellcome Department of
two objects that differed in brightness and were presented Imaging Neuroscience, London; www.fil.ion.ucl.ac.uk/
in a lighter (83.45 or 104.70 cd/m2) or darker gray (7.59 spm/software/spm8). The first three images were excluded
or 38.42 cd/m2). from the analysis, as these were acquired before the MR
signal had reached its steady state.
Three participants did not perform the task properly, as
Task and Design indicated by the behavioral data (i.e., more than 25%
Downloaded from http://mitprc.silverchair.com/jocn/article-pdf/24/10/2015/1778352/jocn_a_00258.pdf by MIT Libraries user on 17 May 2021
errors in one or both tasks) and were accordingly excluded
Stimuli were presented in blocks of five trials (2-sec dura- from further analyses.
tion each). Trials were separated by an intertrial interval. Be- For the remaining sample (21 participants), two onset
tween each trial, the intervalʼs duration was randomly set to regressors (reflecting the experimental conditions) plus
2, 2.25, 2.5, 2.75, or 3 sec. Before each block, a semantic associated parametric regressors (reflecting the illusion
cue was presented for 1.5 sec informing the participants strength) were defined. Onsets were defined by the
whether the landmark task (instruction: length) or the occurrence of a Müller-Lyer figure. Each appearance of a
luminance task (instruction: form) had to be performed. figure within a particular block was regarded as a single
Alternatively, participants were informed that a blank event. The parametric modulators coded the illusion
screen (instruction: break) would be presented. A total of strength of each corresponding figure. Illusion strength
24 blocks of each condition (landmark task, luminance was coded as absolute values, that is, independently of
task) were presented in a randomized order, separated the direction of the arrows (i.e., leftward or rightward
by baseline (break) periods. Each block lasted 24 sec. Thus, pointing). The hemodynamic response was modeled
the overall experimental time was about 29 min. using a canonical hemodynamic response function and
In the landmark task, participants indicated by a right- its first derivative, head movement parameters were
hand button press whether they perceived the horizontal included as confounds. Effects of the first derivatives and
line as correctly prebisected (index finger) or not (middle head movements were not further investigated.
finger). In the luminance task, participants indicated Then, different first-level contrasts were specified: First,
whether all of the four identically shaped elements were of a differential contrast comparing both experimental tasks
the same luminance (index finger) or not (middle finger). was calculated. Second, each experimental regressor
In the baseline condition, the instruction was followed by (including those reflecting parametric modulations) was
a blank screen for the duration of a normal block with compared with the implicit baseline (i.e., not explicitly
no task requirements. modeled time periods where no event occurred). Third,
a differential contrast between both parametrical regres-
sors reflecting task related activations was calculated.
fMRI Measurement These contrasts were taken to the second level, where they
Functional imaging data were acquired by means of a 3-T were subjected to one-sample t tests, using a corrected
TRIO MRI system (Siemens, Erlangen, Germany) using a threshold of p < .01 at the cluster level (cluster-forming
T2*-weighted EPI sequence (repetition time = 2.2 sec, threshold p < .001 at voxel level). The analyses comprised
echo time = 30 msec). A total of 800 volumes were ac- contrasts between the landmark and the control task
quired. Each volume consisted of 36 axial slices (thickness = (landmark > luminance; luminance > landmark), as well
3 mm, distance factor = 10%, field of view = 200 mm, 64 × as contrasts of the parametric regressors, reflecting areas
64 matrix, in-plane voxel size = 3 × 3 mm2). Images were showing increased neural activity with increasing illusion
first spatially realigned to correct for interscan movement. strength and the differential effects of illusion strength
Then, the mean EPI image for each participant was com- for each task. To identify visual input areas for the DCM
puted and spatially normalized to the Montreal Neurological analysis (see below), a third test was calculated reflecting
Institute template using the “unified segmentation” func- the impact of both tasks (landmark + luminance task >
tion in SPM8 (Ashburner & Friston, 2005). The data were baseline).
then smoothed using a Gaussian kernel of 8 mm FWHM.
VOIs
Data Analysis On the basis of previous findings (Weidner & Fink, 2007),
we included bilateral LOC and right SPC in our considera-
Data Processing tions about suitable connectivity models. In addition, we
Behavioral data were analyzed using the free statistical added primary visual cortex ( V1) bilaterally as input re-
software R (R Foundation for Statistical Computing, Vienna, gions. Consistent with Weidner and Fink (2007), the pre-
Austria; www.R-project.org), SPSS 19 (IBM SPSS Statis- sent analysis of illusion strength revealed three significant
tics, Version 19), and G*Power 3 (Faul, Erdfelder, Lang, clusters of neural activity (see Results): bilateral LOC (right
& Buchner, 2007). LOC: x = 54, y = −70, z = −6; left LOC: x = −36, y = −90,
2018 Journal of Cognitive Neuroscience Volume 24, Number 10
Downloaded from http://www.mitpressjournals.org/doi/pdf/10.1162/jocn_a_00258 by guest on 28 September 2021z = 0) and right SPC (x = 26, y = −62, z = 56). Note that was defined within a search radius of 10 mm around the
the former coordinates represent the peak coordinates corresponding group maxima. Then, the time series were
of clusters covering temporo-occipital brain areas in both extracted as the first eigenvariate of all voxel time series
hemispheres, commonly known as LOC. Therefore, we within a sphere (radius = 3 mm) centered on the indi-
termed both areas as LOC, well aware of the fact that the vidual peak coordinates within the search VOI. Two par-
individual coordinates of the local maxima in these ticipants in which not all VOIs could reliably be identified
regions do not precisely cover congruent locations. were excluded, leaving a sample of 19 participants for
The three cluster peak coordinates served as centers connectivity analysis.
Downloaded from http://mitprc.silverchair.com/jocn/article-pdf/24/10/2015/1778352/jocn_a_00258.pdf by MIT Libraries user on 17 May 2021
for the VOI extraction. Additionally, two input regions
bilaterally in V1 were determined (right V1: x = 22, y =
−92, z = −4; left V1: x = −18, y = −96, z = −16) by
DCM
masking baseline contrasts with ROIs of the right and
left V1 as generated within the SPM Anatomy toolbox In the last few years, DCM (Friston et al., 2003) has suc-
(Eickhoff et al., 2005). Probabilistic cytoarchitectonic cessfully been used to investigate the underlying dynamics
maps as used in the Anatomy toolbox have been shown of visual processing (e.g., Cardin, Friston, & Zeki, 2011;
to largely correspond to functional localizer scans, espe- Stephan, Marshall, Penny, Friston, & Fink, 2007; Mechelli,
cially in visual cortices (Wilms et al., 2010). Again, these Price, Friston, & Ishai, 2004; Mechelli, Price, Noppeney, &
group maxima served as centers for VOI extraction. Friston, 2003). Therefore, for analysis of effective con-
For every participant and each VOI, the individual ac- nectivity, we employed DCM, as implemented in SPM8
tivations ( p < .05, uncorrected; cf. Eickhoff, Heim, Zilles, (DCM8). To compare alternative hypotheses on the exam-
& Amunts, 2009) were calculated. For each VOI, a voxel ined system as reflected by possible connectivity models,
Figure 2. Outline of a possible DCM model that includes all possible connection between the chosen brain areas. The reciprocal pathways
between primary visual cortex ( V1) and LOC or SPC, respectively, were constant in all tested models. All other connections were systematically
varied. The interaction of the SPC and LOC were of particular interest; therefore, we used “illusion strength” as modulator on these sites.
Plewan et al. 2019
Downloaded from http://www.mitpressjournals.org/doi/pdf/10.1162/jocn_a_00258 by guest on 28 September 2021a random-effects Bayesian model selection was used
(Stephan, Penny, Daunizeau, Moran, & Friston, 2009).
Using DCM, it is important to have a circumscribed
and finite model space (Stephan et al., 2010). As outlined
above, our DCM models consisted of bilateral V1, LOC,
and right SPC. Reciprocal connections between V1 and
(left/right) LOC or right SPC, respectively, as well as a
reciprocal link between left and right LOC were taken as
Downloaded from http://mitprc.silverchair.com/jocn/article-pdf/24/10/2015/1778352/jocn_a_00258.pdf by MIT Libraries user on 17 May 2021
core modules for all models tested (Catani, Jones, Donato,
& Ffytche, 2003; Felleman & Van Essen, 1991; Lamme
& Roelfsema, 2000; Loenneker et al., 2011; Stephan
et al., 2007; Zanon, Busan, Monti, Pizzolato, & Battaglini,
2009). Because LOC and SPC have been shown to be
related to the processing of illusion strength (Weidner &
Fink, 2007), we hypothesized that an interaction of these
areas would be mandatory to explain the illusion effect.
Because the neural mechanisms of ventral (LOC) and
dorsal (SPC) stream interaction remain to be elucidated,
we considered models that reflect all possible interactions
between these areas. Overall, these considerations re-
sulted in 15 different models, which could be categorized
roughly into three groups of models (see Figure 2): mod-
els comprising only bidirectional connections (e.g., LOC ↔
SPC; Figure 2 I–III), unidirectional models (e.g., LOC →
SPC, SPC → LOC; Figure 2 IV–IX) and a group of mixed
models including differential connections on either side
(e.g., left LOC ↔ SPC/right LOC → SPC; Figure 2 X–XV).
Within every model, we modulated the connections be-
tween LOC and SPC with illusion strength to detect dif-
ferences related to increasing illusion strength (under both
experimental conditions).
Model Selection and Parameter Inference Figure 3. Examples of stimuli as presented in the fMRI experiment.
The 20% illusion condition is shown in A (rightward pointing) and
To identify the most likely generative model among E (leftward pointing); B and D illustrate the 10% illusion condition.
the 15 different DCM models, we used a random-effects The angles (α10, α20) represent mean angles as assessed during the
Bayesian model selection procedure (Stephan et al., behavioral pretest, across the whole group, individual angle estimates
differed. A neutral stimulus is shown in C, and the borders and physical
2009). To test whether the coupling parameters were con-
middle are indicated by the bright stripes.
sistently expressed across participants, the connectivity
parameters (intrinsic connections and context-dependent
modulations) of the model with the highest exceedance paired t test revealed a significant difference between both
probability were then entered into a second level analysis illusion conditions, t(41) = −22.52, p < .01, dz = 3.47.
by means of t tests.
Main Experiment
Participants performed well in both tasks as indicated by
RESULTS an average of only 1.76% (SD = 2.16) trials without re-
Behavioral Data sponse across the group. In both tasks, the detection rate
of the critical item did not differ [i.e., subjectively correctly
Pretest bisected line: 0.89 (SD = 0.07) vs. coherent luminance
The results of the angle adjustments performed to match within object: 0.86 (SD = 0.10), t(20) = 1.29, p = .21,
illusion strength are shown in Figure 3. For further analyses, dz = 0.27]. At the same time, more false-positive responses
the two values of each condition were pooled together. To were observed during the landmark task (0.15, SD = 0.07)
generate a 20% illusion, the mean interior angle between relative to the luminance task (0.05, SD = 0.06), t(20) =
both wings was adjusted to α20 = 74.94° (SD = 20.19), 4.64, p < .01, dz = 1.06. A longer mean RT for the lumi-
whereas the angles in the 10% illusion condition on aver- nance task (1.59 sec, SD = 0.36) as compared with the
age were set to a mean of α10 = 127.26° (SD = 15.4). A landmark task (1.31 sec, SD = 0.21) indicated that the
2020 Journal of Cognitive Neuroscience Volume 24, Number 10
Downloaded from http://www.mitpressjournals.org/doi/pdf/10.1162/jocn_a_00258 by guest on 28 September 2021former task was more difficult (t(20) = −5.41, p < .01,
dz = 1.14). To further investigate this effect, a multivariate
repeated MANOVA of RTs with the factors task (landmark
vs. luminance) and illusion strength (strong, weak, neutral)
was calculated. The MANOVA revealed a significant effect
of Task, F(1, 20) = 35.39; p < .01, ηp2 = 0.64, and Illusion
Strength, F(2, 19) = 13.07; p < .01, ηp2 = 0.58, as well as a
significant Task × Figure interaction, F(2, 19) = 24.08; p <
Downloaded from http://mitprc.silverchair.com/jocn/article-pdf/24/10/2015/1778352/jocn_a_00258.pdf by MIT Libraries user on 17 May 2021
.01, ηp2 = 0.72. In the landmark task, the participants re-
sponded faster when the neutral figure was presented
and RT increased along with a stronger illusion. Addition-
ally, a direct comparison of the single effects revealed
that RTs in all three illusion conditions differed from each
other (neutral vs. weak: t(20) = −5.63, p < .01, dz = 1.07;
neutral vs. strong: t(20) = −7.14, p < .01, dz = 1.22; weak
vs. strong: t(20) = −5.63, p < .01, dz = 1.56). In con-
Figure 4. RTs (in msec) as observed during the main experiment.
The top line represents the mean RTs across all participants during the
trast, an opposite trend was observed in the luminance
luminance task, while the lower line shows the same information for task (see also Figure 4). In this condition, the fastest re-
the landmark task. The luminance task generated longer RTs. The sponses were observed for strong illusion figures. Direct
RTs during the landmark task were differentially affected by illusion comparisons within the luminance task indicated that
strength (i.e., stimulus configuration). there was solely a difference between neutral and strong
Table 1. List of Activations
Brain Region Side Coordinates Clustersize T p
A. Illusion Strength
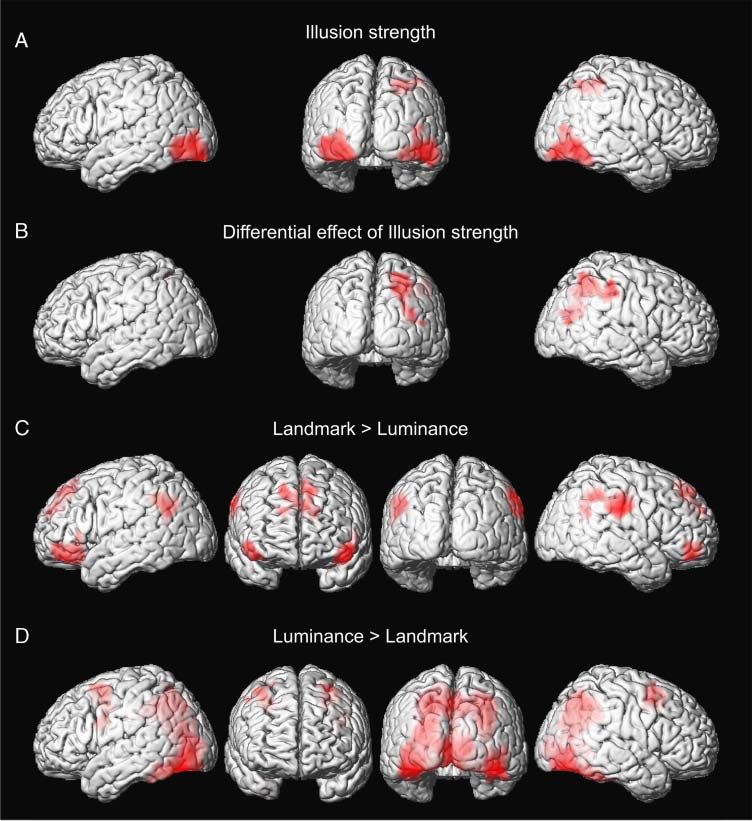
Inferior temporal gyrus R 54 −70 −6 1644 9.20Figure 5. Surface rendering
of the fMRI results obtained
in the conventional SPM8
analysis. In A, the effect of
the parametric modulation
of illusion strength is shown,
while B illustrates the
differential effect of illusion
strength between landmark
Downloaded from http://mitprc.silverchair.com/jocn/article-pdf/24/10/2015/1778352/jocn_a_00258.pdf by MIT Libraries user on 17 May 2021
and luminance task. Areas
more activated during the
landmark task when compared
with the luminance task are
shown in C, and D displays
relative neural activations
in the luminance task when
compared with the landmark
task. Views are shown from
the left, anterior, posterior,
and right direction. Because
of exclusively posterior
activations in A and B, no view
from the anterior is presented.
illusion figures (t(20) = 2.91, p < .01, dz = 0.63; all other task revealed no significant increase in activation asso-
p > .08). ciated with illusion strength in the luminance task. To
test for the specific effects of each level of the parametric
regressor, we extracted the fitted response (as imple-
Functional Imaging
mented in SPM8; cf. Henson, 2003) derived from the peak
Illusion Strength voxels of the activation clusters in LOC and SPC (as percent
The main effect of the Strength of the Müller-Lyer illusion signal change). There was a significant increase in activity
was tested using parametric regressors. Consistent with related to illusion strength and the landmark task within
previous findings (Weidner & Fink, 2007), activation posi- SPC. Whereas in the luminance condition the response
tively associated with the magnitude of the illusion (inde- in SPC remained constant irrespective of illusion strength,
pendent of the task) was detected bilaterally along LOC the response in SPC increased along with increasing illu-
(see Table 1A; Figure 5A), reaching from the inferior occip- sion strength during the landmark task (see Table 1B;
ital gyrus to the inferior temporal gyrus. Local maxima Figures 5B and 6). At the same time, activation in bilat-
were located in the left inferior occipital and the right in- eral LOC similarly increased in both tasks with increasing
ferior temporal gyrus, respectively. In addition, there was illusion strength (see Figure 6).
a significant activation in dorsal parietal cortex, with a peak
maximum within right SPC posterior to the postcentral
Landmark and Luminance Task
gyrus and in the vicinity of the intraparietal sulcus.
The latter activation in SPC was mainly driven by the Comparing the landmark to the luminance task yielded five
parametric response of the landmark task. Testing the significant clusters of activation (see Table 1C; Figure 5C).
differential effects of illusion strength separately for each Bilateral activation was observed in inferior parietal cortex,
2022 Journal of Cognitive Neuroscience Volume 24, Number 10
Downloaded from http://www.mitpressjournals.org/doi/pdf/10.1162/jocn_a_00258 by guest on 28 September 2021involving the right supramarginal gyrus as well as the right pattern of activation was revealed in the medial and the
angular gyrus and furthermore the left angular gyrus. Frontal superior frontal gyrus in posterior direction slightly reach-
activations were observed in bilateral superior and medial ing into precentral gyrus (Table 1D; Figure 5D).
frontal areas. In addition, there was bilateral activity in the
anterior parts of inferior frontal cortex (pars orbitalis).
The opposite contrast (luminance > landmark task) re- DCM
vealed high activation within a cluster covering large parts
of the ventral and dorsal visual stream, involving primary Bayesian Model Selection
Downloaded from http://mitprc.silverchair.com/jocn/article-pdf/24/10/2015/1778352/jocn_a_00258.pdf by MIT Libraries user on 17 May 2021
visual cortex (calcarine sulcus) extending ventrally to the A sample of 15 models, based on our predefined frame of
fusiform gyrus and dorsally to inferior parietal cortex and V1, LOC, and SPC, was set up. The main focus was directed
SPC, also covering adjacent areas. Furthermore, a bilateral on connections between LOC and SPC. Consequently, we
Figure 6. The graphs on the left display the fitted responses in percent signal change (within peak coordinates; brain rendering corresponds to
Figure 5A: illusion strength) associated with the different figure configurations. The white circle indicates the activation locations. The upper and
middle graph represent activations of the left and right LOC, respectively, and the lower graph shows activation of the right SPC. The lines with
squares indicate responses during the luminance task, the bare lines indicate responses during the landmark task.
Plewan et al. 2023
Downloaded from http://www.mitpressjournals.org/doi/pdf/10.1162/jocn_a_00258 by guest on 28 September 2021Figure 7. Top: Bars indicate
the relative log evidence of
each tested DCM model
(model numbers correspond
to those displayed in Figure 2).
All models except Models I, XI,
and XIII resulted in a log
evidence ofand modulatory influences expressed by its parameters. side (left: t(18) = −0.46, ns, dz = 0.48; right: t(18) =
The results are summarized in Figure 7 and Table 2. All −1.86, ns, dz = 0.43), that is, intrinsic connectivity from
feedforward connections (coupling from V1 to LOC and LOC to SPC was not different from the reverse connections
SPC) were significantly greater than zero. The same was from SPC to LOC.
true for connections between the left and right LOC The bidirectional connections between LOC and SPC
as well as for connections from the left and right LOC were differentially modulated by the landmark (Figure 7,
to the right SPC and vice versa. As indicated by non- blue numbers) and the luminance task (Figure 7, red num-
significant effects, feedback connections (coupling from bers). To investigate the pattern of the modulatory effects,
Downloaded from http://mitprc.silverchair.com/jocn/article-pdf/24/10/2015/1778352/jocn_a_00258.pdf by MIT Libraries user on 17 May 2021
LOC and SPC to V1) constitute a relevant part of the model we calculated a repeated-measures ANOVA with the fac-
but appeared to be less consistently expressed across tors Task (landmark, luminance), Direction (SPC → LOC,
subjects. LOC → SPC), and Side (left, right). There was no significant
The interconnections between bilateral LOC and SPC main effect (all p > .46). However, there was a significant
were of particular interest. All connections were significantly Task × Direction interaction, F(1, 18) = 6.73, p = .018,
greater than zero. Additionally, no direction-dependent ηp2 = 0.27, although no other interaction reached signifi-
effects were observed for the intrinsic connections be- cance (all p > .23). The significant interaction indicates
tween LOC and SPC, neither on the left nor on the right a differential influence exerted by top–down setting on
Table 2. Parameters of the Model with the Best Fit, Including Intrinsic Connections and Modulations of the Instrinsic Connections
Intrinsic Connection Mean SD t p
Left V1 → left LOC 0.43 0.15 12.53connections from LOC to SPC as compared with connec- coded already on a preattentive level (Busch & Müller,
tions from SPC to LOC. 2004). Accordingly, the perceived size of an object is pre-
sumably altered by the illusion, in both, the luminance as
well as the landmark condition, thus implying mental size
DISCUSSION
scaling. Nonetheless, because of the nonspatial nature of
We investigated effective connectivity within a network of the luminance task, size information is not behaviorally
brain areas involved in processing the strength of the relevant and therefore does not affect RTs.
Müller-Lyer illusion. The figures inducing the illusion Brain areas supporting such transformations are ex-
Downloaded from http://mitprc.silverchair.com/jocn/article-pdf/24/10/2015/1778352/jocn_a_00258.pdf by MIT Libraries user on 17 May 2021
were presented either in the context of a landmark task pected to show increased hemodynamic responses along
or a luminance task. with stimuli inducing a stronger illusion. This pattern was
Results from the conventional fMRI analysis of regional observed in LOC. Notably, the effect of illusion strength
specialization indicated that the landmark task (com- in LOC was without reference to specific task demands,
pared with the luminance task) activated inferior parietal indicating that the coding of perceived size in LOC is
cortex bilaterally, slightly stronger pronounced within the implemented early on, that is, at a preattentive level.
right hemisphere, which is consistent with previous ex- Therefore, LOC is a likely candidate for executing mental
periments using similar tasks ( Weidner & Fink, 2007; size transformations (Bennett & Warren, 2002; Bundesen
Fink, Marshall, Weiss, Toni, & Zilles, 2002; Fink, Marshall, & Larsen, 1975).
Weiss, & Zilles, 2001; Fink et al., 2000). As indicated by In general, LOC is closely associated with object process-
the behavioral data, the luminance task was more de- ing (Malach et al., 1995). Evidence derived from studies
manding than the landmark task. Accordingly, activations on monkeys as well as on human participants suggests
were observed in a variety of brain regions including ven- that this area responds to size-invariant object properties
tral visual areas and dorsal stream areas including supe- (Sawamura, Georgieva, Vogels, Vanduffel, & Orban, 2005;
rior parietal areas as well as dorsomedial and dorsolateral Grill-Spector et al., 1999). In addition to these size-invariant
frontal areas. representations, single-cell recordings in monkeys revealed
During both tasks, the strength of the Müller-Lyer illu- that a large fraction of neurons in LOC are size-dependent
sion was systematically altered by varying the angles of (Lueschow, Miller, & Desimone, 1994). The joint presence
the illusion inducing arrows. Illusion strength modulated of size-dependent and size-invariant neurons in LOC may
the hemodynamic response bilaterally in LOC and in right indicate that this region could be involved in both generat-
SPC, which replicates previous findings on the Müller-Lyer ing as well as holding size invariant representations. Con-
illusion (Weidner & Fink, 2007). To further elucidate this sistent with this notion, the current data suggest that LOC
issue, the current study investigated effective connectivity is involved in transforming initial retinal information into
within this network of LOC and SPC using DCM (Friston size invariant representations.
et al., 2003). A model comprising bidirectional connec- Whereas hemodynamic responses in LOC were found
tions between SPC and LOC was found to be superior to to be task-independent, connectivity analysis revealed
all other models. Following the idea of effective connectiv- that illusion-related transfer of information from LOC to
ity (Friston, 1994), this indicates that LOC and SPC exert SPC was affected by top–down settings. Although connec-
influence upon each other. tions from LOC to SPC were generally enhanced by a
The hemodynamic response as investigated by stan- stronger illusion, the spatial task further increased this
dard SPM analysis suggests that both regions play differ- influence from LOC onto SPC. Thus, these findings sup-
ential roles in generating size invariant representations. port the view that illusion-induced processes are, at least
Furthermore, connectivity data as revealed by DCM indi- in part, amenable to top–down modulation (Coren & Porac,
cate that both areas reciprocally modulated their activa- 1983, 1984; Tsal, 1984).
tion during this process.
Right SPC
Hemodynamic responses observed in SPC also reflected
LOC
illusion strength. Remarkably, this was true only for the
Increasing the strength of the Müller-Lyer illusion in- landmark condition. During the luminance condition
creases the mismatch between retinal and perceived (i.e., without any explicit spatial task demands), the hemo-
size. Hence, more transformation is required to convert dynamic response pattern in SPC was virtually unaffected
one representation into another. It has previously been by the illusion. Thus, illusion coding in SPC presumably
demonstrated that mental size scaling is time consuming reflects postattentive processing, emerging after an initial
(Bennett & Warren, 2002; Bundesen & Larsen, 1975). This perceived size representation has been generated.
notion is confirmed by our behavioral data. RTs for spa- In healthy participants, right SPC has often been shown
tial judgments increased along with increasing illusion to be involved in forming spatial judgments (Fink et al.,
strength. In the luminance condition, RTs were unaffected 2000, 2001, 2002). Consequently, the data suggest that
by illusion strength. However, illusory size information is SPC requires explicit representations of (perceived) spatial
2026 Journal of Cognitive Neuroscience Volume 24, Number 10
Downloaded from http://www.mitpressjournals.org/doi/pdf/10.1162/jocn_a_00258 by guest on 28 September 2021information. Our data imply that SPC utilizes perceived eye movements were recorded. Indeed, participants made
size representations only when these are relevant for an more saccades during the luminance task as compared
ongoing (spatial) task. with the landmark task. Consequently, eye movement-
Interestingly, the role of SPC in spatial judgments is less related activations might be expected to be stronger in
clear when brain-damaged patients are considered. A re- the luminance as compared with the landmark condition.
cent study compared effects of neuromodulation (tran- Accordingly, stronger right parietal activation as observed
scranial direct current stimulation) of parietal cortex in in the landmark task is unlikely to result from differential
healthy participants and brain-damaged patients (Sparing eye movements.
Downloaded from http://mitprc.silverchair.com/jocn/article-pdf/24/10/2015/1778352/jocn_a_00258.pdf by MIT Libraries user on 17 May 2021
et al., 2009). It was found that neuromodulation can have Furthermore, differential saccade patterns are known
similar effects on spatial processing in patients and healthy to activate brain areas including frontal and supplemen-
participants, albeit those effects are more variable in pa- tary eye fields (Luna et al., 1998; Petit, Clark, Ingeholm,
tients. Additionally, it is a common finding that illusion & Haxby, 1997). Our data, however, indicate that illusion
perception is preserved following brain injuries in SPC strength was associated with increased activation in right
(Olk, Harvey, Dow, & Murphy, 2001; Vallar, Daini, & SPC as well as bilaterally in LOC. In contrast, no activation
Antonucci, 2000; Ro & Rafal, 1996). In contrast, illusion associated with illusion strength was observed in the fron-
perception is impaired when occipital areas are affected tal and supplementary eye fields, even when lowering the
(Vallar & Daini, 2006; Daini et al., 2002). In accordance statistical threshold ( p ≤ .001, uncorrected). The data
with that, a recent study using TMS provided evidence thus suggest that activations observed along with illusion
for an involvement of lateral occipital areas in generating strength were not triggered by differential eye movements.
the Müller-Lyer illusion, whereas no clear support was Nonetheless, differential task difficulty constitutes a puta-
found for a critical involvement of right SPC (Mancini tive confound for the interpretation of any task comparison.
et al., 2011). It was further suggested that SPC might be The luminance task compared with the landmark task
involved in integrating and updating size-invariant repre- revealed a widespread activation pattern, including brain
sentations, but not in generating the illusion effect itself areas reflecting task difficulty. This study, however, focuses
(Mancini et al., 2011). This assumption is strengthened on the signal pattern related to the landmark task. There
by the connectivity data resulting from our DCM analy- was an increase in neural activity associated with increas-
sis, which indicates that SPC influences activation in LOC ing illusion strength, although this was elicited basically by
along with illusion strength. Hence, the SPC to LOC inter- the easier task. A ceiling effect of activity in the luminance
actions most likely reflect processes initiated after size scal- task also seems improbable as both tasks evoke a similar
ing has been performed, rather than processes generating increase in LOC along with increasing illusion strength. In
the illusion. For instance, object representations formed addition, the present findings parallel those of an earlier
and represented in LOC most likely increase in complexity study on the Müller-Lyer illusion (Weidner & Fink, 2007).
along with illusion strength. Thus, further processing re- Although this previous study employed a much easier
quires additional information from SPC, consequently the luminance task, the activation pattern related to illusion
interaction between the two regions is likely to be en- strength was almost identical. Moreover, the present DCM
hanced. It has previously been reported that dorsal stream analysis indicates stronger connectivity patterns during the
visual areas amplify and focus processing in lower-order (easier) landmark task. On the basis of the available data,
visual areas (Seghier et al., 2000; Hupe et al., 1998). For it cannot completely be ruled out that task difficulty con-
example, Bullier suggested that information from parietal tributes to this finding, however, it appears highly unlikely
areas is used to guide processing in ventral stream visual that the current findings on the Müller-Lyer illusion are
areas via “retroinjection” (Bullier, 2001). Our data confirm solely driven by differential task difficulty.
the notion that dorsal areas affect activation in ventral
stream areas during a visual task. However, this influence
Conclusion
presumably reflects an evaluation rather than a generation
of the object representation. In conclusion, the current study offers new insights into
the mechanisms underlying illusion processing. So far,
ventral and dorsal visual stream have often been regarded
Task Difficulty and Eye Movements
as functional independent entities subserving different func-
Although both tasks were designed to be matched with tions (Cavina-Pratesi, Goodale, & Culham, 2007; Shmuelof &
regard to task difficulty, participants took longer to perform Zohary, 2005), and especially their role in illusion processing
the luminance task. Accordingly, the luminance task may has been debated (Bruno & Franz, 2009; Bruno et al., 2008).
have elicited more eye movements, thus activating brain Our data indicate that perceiving the Müller-Lyer illusion
regions involved in saccade generation. These brain areas involves a network of brain areas comprising both ventral
are known to reside in parietal cortex (Grefkes & Fink, and dorsal stream areas. However, whereas bilateral LOC
2005; Culham & Kanwisher, 2001). Therefore, an additional is involved in size-scaling and in generating size invari-
behavioral control experiment, identical to the fMRI experi- ant object representations, right SPC further processes
ment, was performed. Eight participants were tested and these representations. Top–down settings specifically alter
Plewan et al. 2027
Downloaded from http://www.mitpressjournals.org/doi/pdf/10.1162/jocn_a_00258 by guest on 28 September 2021connections from LOC to SPC as well as the coding of illusion the Müller-Lyer illusion through attentional manipulation.
information within SPC. Additionally, task-independent and Perception, 12, 49–54.
Coren, S., & Porac, C. (1984). Structural and cognitive
illusion-related interactions from SPC to LOC reflect a fa- components in the Müller-Lyer illusion assessed via
cilitating processing unit, e.g., accounting for the (conscious) Cyclopean presentation. Perception & Psychophysics,
integration of the illusion stimuli. We therefore conclude 35, 313–318.
that the generation of size invariant object representa- Culham, J. C., & Kanwisher, N. (2001). Neuroimaging of
tions are formed in LOC. Dorsal stream areas are involved cognitive functions in human parietal cortex. Current
Opinion in Neurobiology, 11, 157–163.
in further utilizing these representations. Daini, R., Angelelli, P., Antonucci, G., Cappa, S., & Vallar, G.
Downloaded from http://mitprc.silverchair.com/jocn/article-pdf/24/10/2015/1778352/jocn_a_00258.pdf by MIT Libraries user on 17 May 2021
(2002). Exploring the syndrome of spatial unilateral neglect
through an illusion of length. Experimental Brain Research,
Acknowledgments 144, 224–237.
We are grateful to Petra Engels, Dorothe Krug, and Oliver Eickhoff, S. B., Heim, S., Zilles, K., & Amunts, K. (2009). A
Haumann for their support during data acquisition. We are also systems perspective on the effective connectivity of overt
grateful to all our volunteers and our colleagues at the Institute speech production. Philosophical Transactions, Series A,
of Neuroscience and Medicine, Research Centre Jülich. Mathematical, Physical, and Engineering Sciences, 367,
2399–2421.
R. W. is supported by the Deutsche Forschungsgemeinschaft Eickhoff, S. B., Stephan, K. E., Mohlberg, H., Grefkes, C.,
(WE 4299/2-1). Fink, G. R., Amunts, K., et al. (2005). A new SPM toolbox
Reprint requests should be sent to Thorsten Plewan, Kognitive for combining probabilistic cytoarchitectonic maps and
Neurowissenschaften, Institut für Neurowissenschaften und functional imaging data. Neuroimage, 25, 1325–1335.
Medizin (INM-3), Forschungszentrum Jülich, Leo-Brandt-Str. 5, Erlebacher, A., & Sekuler, R. (1969). Explanation of the
52425 Jülich, Germany, or via e-mail: t.plewan@fz-juelich.de. Müller-Lyer illusion: Confusion theory examined. Journal
of Experimental Psychology, 80, 462–467.
Faul, F., Erdfelder, E., Lang, A.-G., & Buchner, A. (2007).
G*Power 3: A flexible statistical power analysis program
REFERENCES for the social, behavioral, and biomedical sciences.
Behavior Research Methods, 39, 175–191.
Ashburner, J., & Friston, K. J. (2005). Unified segmentation. Felleman, D. J., & Van Essen, D. C. (1991). Distributed
Neuroimage, 26, 839–851. hierarchical processing in the primate cerebral cortex.
Bennett, D. J., & Warren, W. (2002). Size scaling: Retinal Cerebral Cortex, 1, 1–47.
or environmental frame of reference? Perception & Fink, G. R., Marshall, J. C., Shah, N. J., Weiss, P. H.,
Psychophysics, 64, 462–477. Halligan, P. W., Grosse-Ruyken, M., et al. (2000). Line
Bisiach, E., Ricci, R., Lualdi, M., & Colombo, M. R. (1998). bisection judgments implicate right parietal cortex
Perceptual and response bias in unilateral neglect: Two and cerebellum as assessed by fMRI. Neurology, 54,
modified versions of the Milner landmark task. Brain 1324–1331.
and Cognition, 37, 369–386. Fink, G. R., Marshall, J. C., Weiss, P. H., Toni, I., & Zilles, K.
Brighina, F., Ricci, R., Piazza, A., Scalia, S., Giglia, G., & (2002). Task instructions influence the cognitive strategies
Fierro, B. (2003). Illusory contours and specific regions involved in line bisection judgements: Evidence from
of human extrastriate cortex: Evidence from rTMS. The modulated neural mechanisms revealed by fMRI.
European Journal of Neuroscience, 17, 2469–2474. Neuropsychologia, 40, 119–130.
Bruno, N., Bernardis, P., & Gentilucci, M. (2008). Visually Fink, G. R., Marshall, J. C., Weiss, P. H., & Zilles, K. (2001).
guided pointing, the Müller-Lyer illusion, and the functional The neural basis of vertical and horizontal line bisection
interpretation of the dorsal-ventral split: Conclusions from judgments: An fMRI study of normal volunteers.
33 independent studies. Neuroscience and Biobehavioral Neuroimage, 14, S59–S67.
Reviews, 32, 423–437. Friston, K. J. (1994). Functional and effective connectivity
Bruno, N., & Franz, V. H. (2009). When is grasping affected in neuroimaging: A synthesis. Human Brain Mapping,
by the Müller-Lyer illusion? A quantitative review. 2, 56–78.
Neuropsychologia, 47, 1421–1433. Friston, K. J., Harrison, L., & Penny, W. D. (2003). Dynamic
Bullier, J. (2001). Integrated model of visual processing. causal modelling. Neuroimage, 19, 1273–1302.
Brain Research Reviews, 36, 96–107. Grefkes, C., & Fink, G. R. (2005). The functional organization
Bundesen, C., & Larsen, A. (1975). Visual transformation of the intraparietal sulcus in humans and monkeys.
of size. Journal of Experimental Psychology: Human Journal of Anatomy, 207, 3–17.
Perception and Performance, 1, 214–220. Grill-Spector, K., Kushnir, T., Edelman, S., Avidan, G.,
Busch, A., & Müller, H. J. (2004). Visual search for Itzchak, Y., & Malach, R. (1999). Differential processing
apparent-length targets is modulated by the Müller-Lyer of objects under various viewing conditions in the human
illusion. Spatial Vision, 17, 417–441. lateral occipital complex. Neuron, 24, 187–203.
Cardin, V., Friston, K. J., & Zeki, S. (2011). Top–down Hamburger, K., & Hansen, T. (2010). Analysis of individual
modulations in the visual form pathway revealed with variations in the classical horizontal-vertical illusion.
dynamic causal modeling. Cerebral Cortex, 21, 550–562. Attention, Perception & Psychophysics, 72, 1045–1052.
Catani, M., Jones, D. K., Donato, R., & Ffytche, D. H. (2003). Henson, R. N. A. (2003). Analysis of fMRI timeseries: Linear
Occipito-temporal connections in the human brain. Brain, time-invariant models, event-related fMRI and optimal
126, 2093–2107. experimental design. In R. S. J. Frackowiak (Ed.), Human
Cavina-Pratesi, C., Goodale, M. A., & Culham, J. C. (2007). fMRI brain function (2nd ed., pp. 793–822). Oxford: Elsevier.
reveals a dissociation between grasping and perceiving the Hirsch, J., DeLaPaz, R. L., Relkin, N. R., Victor, J., Kim, K.,
size of real 3D objects. PLoS One, 2, e424. Li, T., et al. (1995). Illusory contours activate specific regions
Coren, S., & Porac, C. (1983). The creation and reversal of in human visual cortex: Evidence from functional magnetic
2028 Journal of Cognitive Neuroscience Volume 24, Number 10
Downloaded from http://www.mitpressjournals.org/doi/pdf/10.1162/jocn_a_00258 by guest on 28 September 2021You can also read