New York City's Covid-19 Economy Will Not Snap Back - A report by James A. Parrott
←
→
Page content transcription
If your browser does not render page correctly, please read the page content below
New York City’s Covid-19 Economy
Will Not Snap Back
A report by James A. Parrott

February 2021
James A. Parrott is Director of Economic and Fiscal Policies at the Center for New
York City Affairs at The New School.

Acknowledgments
Funding support provided by the Robin Hood Foundation, JPMorgan Chase Foundation, New
York City Workforce Development Fund, New York Community Trust, 21st Century ILGWU
Heritage Fund, and Consortium for Worker Education. Lina Moe, Sierra Lewandowski, Sky
Morgan, and Raven Brown of the Center's Covid-19 Economic Research Project assisted with
the report. Thanks also go to Bruce Cory for editorial assistance, to Ana Holschuh for
designing the cover and the report webpage, and to Kristin Morse and Seth Moncrease for
general support.

Photography by Matias Campa.

                                         Copyright © 2021 The New School
                                         Center for New York City Affairs
                                         72 Fifth Avenue, 6th floor
                                         New York, NY 10011
                                         212-229-5418
                                         centernyc@newschool.edu
                                         www.centernyc.org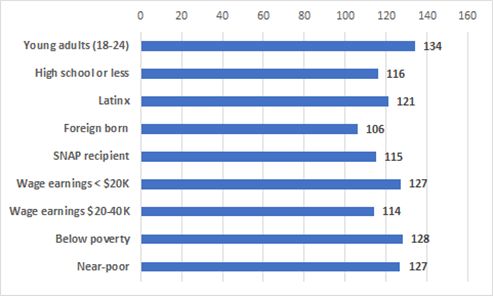
Table of Contents

1.    Introduction and Highlights ................................................................................................................. 1
2.    The post-April jobs rebound slowed in the fall, and stalled with winter’s second Covid-19 wave...... 6
3.    Job losses by industry, with comparisons to the U.S. ........................................................................ 10
4.    Job losses concentrated among persons of color, young, and less-educated ................................... 14
5.    Critical importance of unemployment insurance benefits ................................................................ 18
6.    Several worrisome labor market developments................................................................................ 21
7.    Growing hardships moderated by federal assistance ........................................................................ 24
8.    Pandemic exacerbates wage and income inequality ......................................................................... 28
9.    The NYC economy and jobs not likely to “snap back” in 2021........................................................... 30
10. Conclusion and Policy Needs ............................................................................................................. 32

Center for New York City Affairs at The New School                                                                              February 2021
1

1. Introduction and Highlights

Last year New York City experienced its worst single-year job-loss since the 1930s. In 2020, the
city lost 750,000 payroll and self-employed/independent contractor jobs on average between the
months of February and December, nearly one out of every six jobs. While the new year is
brightened by the late December $900 billion federal aid package and the return of responsible
and capable leadership in the White House towards containing the coronavirus, 2021 will bring
monumental challenges in addressing the lopsided economic impact of the pandemic in the U.S.
and in New York City.
This lopsided impact exacerbates previously existing income inequalities. The devastating
effects have had a concentrated impact on predominantly low-income workers of color, young
adults, and women. For those who were better off to begin with, jobs, benefits, and careers are
mostly intact. There is a business version of this lopsided impact as well, with many tech and
media companies flourishing and Wall Street recording one of its best years ever while
Broadway, restaurants, and the tourism sector have crashed through the floor. It has been called a
K-shaped recovery for good reason; many in the bottom half of the economy have lost jobs or
earnings and are experiencing housing insecurity, while most of those in the top half of the
income distribution retain their jobs, and many have seen their financial assets rise in value.
Thousands more New York City jobs will return in 2021 after vaccinations are widespread and
social distancing restrictions ease, but businesses that have failed will not reopen and they will
not be bringing their workers back. Together with the fact that recovery in restaurants, tourism,
and the arts will be very drawn out, the city will still be short roughly 350,000-400,000 payroll
and independent contractor jobs a year from now, and it likely will take at least until late 2023 or
2024 for the city to return to the pre-pandemic employment level.
Signs of serious economic distress are multiplying, long-term unemployment is skyrocketing,
many of the new jobs emerging are lower quality than the jobs that have been lost, and many of
those returning to jobs are only working part-time. The city’s underemployment rate is 25
percent. Four rounds of federal aid in 2020 have helped the unemployed and small businesses,
and while President Biden has proposed a $1.9 trillion package to extend unemployment benefits
and other assistance nationwide through September, this may not be sufficient to restore the
quantity and quality of the New York City jobs and businesses that have been sacrificed in the
interests of public health. Federal aid has kept the poverty rate from skyrocketing, and the Biden
package could cut child poverty nearly in half, but it will be years before the New York City
labor market is as favorable as it was in the years before the pandemic for tens of thousands of
less-educated, lower-paid, and young workers.
This report examines the Covid-19 economic and employment impact in New York City at the
end of January 2021 and assesses the several labor market challenges for the year ahead. We

Center for New York City Affairs at The New School                                    February 2021
2

look at the demographic and industry contours of the job market effects and investigate how the
pandemic has exacerbated wage and income inequality.

Highlights—New York City’s Covid-19 Economy Will Not Snap Back
•   New York City lost 750,000 payroll and self-employed/independent contractor jobs on average
    between the months of February and December in 2020. The loss for the entire year was the worst
    single-year city job decline since the 1930s and much worse than during the 2008-09 Great Recession
    or as a result of the 2000-to-2003 recession and 9/11 impact.

•   The partial rebound since last spring has been called a K-shaped recovery for good reason; many in
    the bottom half of the economy have lost jobs or earnings and are experiencing severe housing and
    food insecurity, while most of those in the top half of the income distribution retain their jobs, and
    many have seen their financial assets rise in value.

•   The second wave of Covid-19 infections that started to rise in early October led to the reinstatement
    of business restrictions and put New York City’s halting jobs rebound in reverse at the end of 2020.
•   From the early days of the pandemic, it has been clear that communities of color have been the
    hardest hit both in terms of the disease itself and when it comes to job loss and economic hardship:

        o   An estimated 68 percent of lost jobs were held by workers of color. The real numbers likely
            are higher since persons of color tend to be among the “last hired, first fired.”
        o   Latinx workers were 21 percent more likely to have lost jobs than other workers. Young
            adults were 34 percent more likely to have lost work, and workers with a high school
            education or less were 16 percent more likely to have suffered job dislocation.
        o   Black workers were not overly concentrated relative to their workforce share among those
            losing jobs. However, since they account for nearly half of all workers in Essential industries,
            including health care, social assistance, and government employees, they were at greater risk
            of exposure to Covid-19.
        o   Unemployment among men of color was twice that for white men in the last half of 2020.
            While unemployment rates for white women and women of color were similar, the disparity
            between white women and white men was greater (2-to-1) than in previous years, since more
            women stayed home during the pandemic to care for children not attending daycare or school.
        o   Nearly two-thirds of those likely to have lost jobs had annual workplace earnings of less than
            $40,000, while only nine percent had earnings of more than $100,000.

•   Total payroll employment in New York City was down by 11 percent at the end of 2020, more than
    twice the national five percent decline.

        o   Leisure and hospitality jobs and administrative and support services jobs tied to New York’s
            dependence on office-based industries account for over half of the city’s job losses and
            largely explain the city’s greater job loss relative to the nation’s.
        o   Strong pandemic demand for media content and movie and television entertainment
            generated a slight job gain in the information sector, one of only two industries where New
            York City outperformed the nation.
        o   Homebound families buying online and having food delivered have supported a 74 percent
            growth in delivery jobs, slightly better than the nation’s 67 percent gain. These numbers do
            not include the growing use of independent contractors by gig companies and labor
            contractors, such as those used by Amazon. Delivery jobs are noteworthy for being of low
            quality, offering rock-bottom pay with no benefits, no paid leave, and no employment rights.

Center for New York City Affairs at The New School                                           February 2021
3
• The 20 percent job decline from February to December for the Face-to-Face, predominantly low-
wage, service industries far exceeds the five percent decline for the Remote industries, and the three
percent decline for the Essential industry category.
o Employment in the arts, entertainment, and recreation sector was down by 63 percent at the
end of 2020 compared to February, by far the greatest net decline in any industry. Jobs in
hotels and restaurants were down by 40 percent.
• As of mid-January, there were 2.6 million New York State residents receiving unemployment
benefits, with New York City accounting for half of that number, or 1.3 million people.
o New York City’s unemployed workers have received an estimated $36 billion in
unemployment benefits since March of 2020. The benefit payout to city residents nearly
doubled in January 2021 from December with the reinstatement of a federally funded weekly
supplemental.
o The federal share of unemployment insurance (UI) benefits averaged about 75 percent last
year and rose to 90 percent in January with the reinstatement of the federal supplement and
because more workers transitioned onto federal funded extended benefits.
• Signs of serious labor market stress are multiplying:
o An estimated 500,000 New Yorkers are considered long-term unemployed (without work for
more than six months).
o Because many workers returning to work can only find part-time work, there are an estimated
320,000 involuntarily part-time workers.
o 240,000 workers have left the city’s labor force over the past year, reflecting discouragement
at the prospect of finding work or the need to care for family members.
o If those leaving the labor force and involuntarily part-time workers are added to the official
estimate of the unemployed, 993,000 New York City workers were either unemployed or
underemployed in December, an underemployment rate of 24.5 percent.
• Sharply rising numbers of New Yorkers have sought some form of public assistance over the past
year:
o The number of public assistance recipients rose by 20 percent between February and June,
remained at that level through September, then finished the year about 50,000 higher than in
February.
o The number of city residents receiving Supplemental Nutrition Assistance Program (SNAP)
benefits rose by 220,000 from March until September before dropping back to end the year
165,000 higher than in February.
o As of November, an estimated 336,000 city residents had lost health insurance as a result of
losing a payroll employment job during the pandemic, and Medicaid enrollment rose by
426,000.
• It is clear that Federal economic assistance has mattered greatly in relieving hardships for millions of
New Yorkers and Americans. However, little has been done in New York, other than modest
philanthropic efforts, to address economic assistance needs among undocumented workers, who
accounted for eight percent of New York City’s pre-pandemic workforce.
Center for New York City Affairs at The New School February 20214
• The extreme lopsided nature of the prolonged pandemic downturn has vastly intensified economic
inequality in New York City and elsewhere. The pandemic brought to a screeching halt the
considerable gains achieved by those in the bottom half of the wage distribution in New York City in
recent years and has laid bare racial and income disparities in health, access to health care, and great
unevenness in housing conditions, paid leave, and access to broadband.
o The unemployment insurance safety net has certainly helped, but wage losses from the
disappearance of jobs and the increased incidence of part-time work have been greater.
o Although average wages in the Face-to-Face sector are only one-third those in the Remote
sector, total 2020 estimated wage losses were $28 billion in the Face-to-Face industries
compared to $11 billion in Remote industries.
o Three-fourths of the city’s average monthly job loss in 2020 took place in Face-to-Face
industries, compared to 10 percent in Remote industries.
o On the other hand, the 2020 booming stock market boosted capital gains and dividends for
many in the top 20 percent of income distribution and proportionately much greater for the
top one percent. For the first three quarters of 2020, profits at the large Wall Street securities
firms were the second-highest in 40 years of data.
• The earnings potential for hundreds of thousands of city residents has been eroded as long-term
unemployment deepens and time out of the labor force lengthens. Educational achievement and
access to higher education critical for upward mobility have faltered. The pre-pandemic number of
jobs in New York City was the culmination of a decade of recovery and sustained growth that brought
tens of thousands of usually sidelined New Yorkers into the labor market. The pandemic has reversed
that progress, adding new barriers, creating legions of long-term unemployed, and forcing women to
give up their place in the job market to shoulder family responsibilities.
• Even when a large share of the population has been vaccinated and social distancing restrictions ease,
jobs and businesses will not “snap back” in 2021.
o At this point, conditions suggest that New York City will gain 200,000-250,000 jobs during
2021 (between December 2020 and December 2021). Since the details of President Biden’s
American Rescue Plan proposal are still evolving and have not yet been enacted, our forecast
does not factor in the impact of those investments.
o New York City likely will end 2021 still short between 350,000 and 400,000 payroll and
independent contractor jobs due to the continuing impact on tourism, the arts, restaurants,
building services, and other industries.
o The bulk (roughly three-quarters) of the city’s net job gain in 2021 likely will occur in the
Face-to-Face industries, led by restaurants, arts, entertainment and recreation, educational
services, and personal services. Professional services (including parts of the tech sector) and
health care also will add jobs in 2021. But New York City might not regain all of its
pandemic job loss until the end of 2023 or into 2024.
• President Biden’s proposed $1.9 trillion pandemic relief package includes several significant
programs in addition to beefing up funding for vaccine delivery and public health investments. The
additional relief efforts include $1,400 stimulus payments and further extension of federal
unemployment insurance benefits, and major initiatives to augment housing, nutrition, schools, and
child care investments, provide state and local fiscal relief, and a significant enhancement of the Child
Tax Credit to reduce child poverty by more than 40 percent. As necessary as these measures are, they
may not return the New York City labor market to the pre-pandemic high employment level that
Center for New York City Affairs at The New School February 20215
created positive labor market connection for tens of thousands of less-educated, lower-paid, and
young workers.
• To counter the pandemic labor market turmoil, all levels of government need to ensure that workforce
development organizations are well-positioned to respond to changing job demands and training
needs, and that they are able to effectively advise young adults on both short- and long-term career
choices.
• Given the myriad problems the pandemic has surfaced regarding inadequate worker protections and
leave policies, as well as a greater awareness of racial and gender disparities in compensation
practices and of flaws in the worker safety net particularly pertaining to gig and independent
contractor workers, policymakers need to take more systematic approaches to addressing inequities
and raising job quality.
• Immediate State policy priorities include permanently improving New York’s partial unemployment
insurance program and providing economic relief to workers previously excluded from federal
programs.
Center for New York City Affairs at The New School February 20216
2. The post-April jobs rebound slowed in the fall, and stalled with
winter’s second Covid-19 wave
The second wave of Covid-19 infections that started to rise in early October put New York
City’s halting jobs rebound in reverse at the end of 2020. Initial unemployment claims started to
rise again, and the number of payroll jobs fell by 10,000 in December, a month that usually
brings a seasonal hiring surge. As the early epicenter of the coronavirus outbreak, the job decline
last spring was much greater in New York City than nationally, and by the end of the year the
city’s job level was still down more than twice that of the nation overall: -11 percent vs 5
percent. (See Figure 1.)
Figure 1
As of December, New York City jobs were 11% below the pre-pandemic February level,
while nationally, jobs were 5% below the February level.
Source: U.S. Department of Labor (USDOL), New York Department of Labor (NYSDOL); not seasonally adjusted
Current Employment Statistics data.
The expected fall and winter rise in the Covid-19 case rate started in earnest in early October,
with the infection rate per 100,000 population at both the national level and for the New York
metro area surpassing the New York area’s spring peak. (See Figure 2.) The overall U.S.
infection rate had surpassed the New York metro area’s rate in June and stayed well above the
Center for New York City Affairs at The New School February 20217
local rate from then until early January, when the local rate overtook the national infection rate.
In recent weeks, infections fortunately have started to decline. The resurgence in infections in the
fall and early winter led to the reinstatement of business restrictions and put the brakes
temporarily on the recovery.
Figure 2
The New York metro area’s second wave started to rise in mid-October with the Covid-19
case rate passing the national rate in mid-January, then started to recede.
Source: Opportunity Insights Economic Tracker, February 9, 2021
New York City’s February-to-December 2020 job loss was five times worse than what the city
experienced during the 2008-09 Great Recession. It was about a third worse than the 2000-to-
2003 job decline resulting from a combination of the early-2000s national recession and the
economic fallout from the 2001 attacks on the World Trade Center. In fact, 2020’s pandemic job
loss was the worst single-year New York City job decline since the 1930s.
Center for New York City Affairs at The New School February 20218 When you add the loss of about 100,000 independent contractor jobs to the preliminary 507,000 payroll job drop, the city lost over 600,000 jobs between February and December.1 The flattening of the job rebound continued in January according to national data released in early February. On a seasonally adjusted basis, there was a net gain of only 6,000 jobs. The largest increase occurring in professional services and the temporary help industry while job declines continued in manufacturing, and leisure and hospitality. While the national unemployment rate declined from 6.7 in December to 6.3 percent in January, there were still 10.1 million Americans officially jobless. And that statistic does not include the seven million people not in the labor force who want a job and the six million who are involuntarily working only part-time.2 As we will see below, the severity of unemployment is similarly broad in New York City. The net change from last February to December understates the severity of the pandemic job decline. For the six months from April through September, the job shortfall compared to February averaged 775,000. For the entire span of the pandemic in 2020, March through December, the payroll job decline averaged 625,000. Figure 3 shows the monthly job losses relative to February’s pre-pandemic level and includes estimates of the loss of independent contractor jobs among taxi, Uber, and Lyft drivers, and construction and nail salon workers, among others. We estimate that net monthly independent contractor job losses averaged 123,000 from March through December.3 Combining payroll employment and independent contractors, job losses averaged 748,000 for these months. Reflecting the stalled recovery and the effects of the second Covid-19 wave on business activity, initial unemployment insurance (UI) claims filed by city residents have been rising since October. (See Figure 4.) The January 2021 level of 113,000 claims was three-and-a-half times the average of January 2019 and January 2020. Since February of last year, two million initial UI claims have been filed by New York City residents, with some workers undoubtedly filing for a second time after returning to work for a brief period. That is twice the number that filed during all of 2008 and 2009. 1 The New York State Department of Labor (NYSDOL) will release revised “benchmarked” payroll employment data in early March that could deepen the 2020 job loss. The 2020 job data could be revised further in March of 2022 when more comprehensive data for all of 2020 is available. 2 Bureau of Labor Statistics, January 2021 Employment Situation Report, Feb. 5, 2021. 3 Our independent contractor estimates factored in the pandemic-period growth in restaurant and package delivery jobs. Delivery jobs and taxi/Uber/Lyft drivers are all categorized in the transportation industry that represents about 30 percent of all unincorporated independent contractor jobs in New York City. The “other services” industry that includes nail salon workers, accounts for about 13 percent of unincorporated independent contractors. Center for New York City Affairs at The New School February 2021
9

Figure 3
The New York City loss of payroll plus independent contractor jobs averaged 748,000 for the
months of March through December 2020.

Source: Author’s analysis.

Figure 4
Over 113,000 initial UI claims were filed by New York City residents in January this year, more
than three times the average of January 2019 and January 2020.

Source: NYSDOL.

Center for New York City Affairs at The New School                                February 2021
10

3. Job losses by industry, with comparisons to the U.S.

Figure 5 shows the February-to-December net change in New York City payroll employment by
industry, with the industries grouped into the three broad categories that help capture different
Covid-19 economic effects: Essential, Face-to-Face, and Remote. Essential jobs are those in
health care, social assistance, and government. Face-to-Face service and production workers
include those in restaurants, hotels, transportation, most construction, neighborhood personal
services, administrative and building services, and non-essential retail, wholesale trade and

Figure 5
More than 80% of New York City job losses as of December in the Face-to-Face industries; no
Essential or Remote industry has had above-average job decline.

   Source: NYSDOL, not seasonally adjusted Current Employment Statistics.

Center for New York City Affairs at The New School                                  February 2021
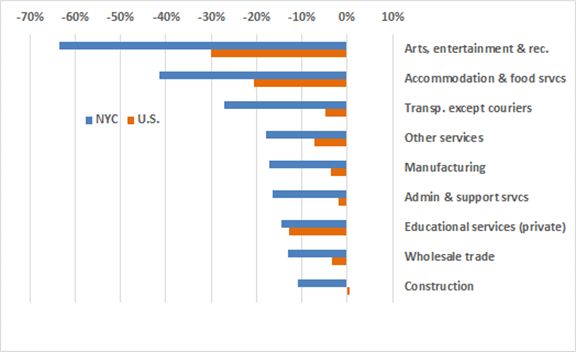
11

manufacturing. Information, financial, professional, and managerial services, many of which can
be performed remotely, constitute the third category—the Remote industries.
Payroll jobs plunged by nearly 20 percent (914,000) between February and April. The last
column in Figure 5 shows the extent to which job levels have rebounded since April. For all
industries taken together, the 407,000 payroll jobs regained between April and December
represent 45 percent of the February-to-April decline. (Nationally, about 64 percent of jobs have
been recovered.)
The Face-to-Face industries collectively accounted for more than 80 percent (411,000 of the
overall 507,000) of the job falloff in those first two months of the pandemic. The 20 percent
decline from February to December for the Face-to-Face industries far exceeds the five percent
decline for the Remote industries and the three percent decline for the Essential industry
category. In New York City, only the information industry has recouped all of the February-to-
April job decline. Other than information, the strongest job rebound has taken place in health
care, followed by retail trade and construction, each having recovered more than 75 percent.
Three industries – finance and insurance; arts, recreation, and entertainment; and accommodation
– continued to lose jobs between April and December.
While the industries within the Face-to-Face category all shared a common fate in suffering
sharp job declines in the early weeks of the pandemic as a result of public health-mandated
restrictions, they are far from a monolith in terms of the continuing Covid-19 impact. While
construction and retail trade have rebounded by more than 75 percent, several Face-to-Face
industries have only regained 40-45 percent of April job losses, with accommodation and
wholesale trade having regained only about a quarter of their job losses. As noted above, the arts,
entertainment, and recreation sector has not regained any jobs as of December, and the arts
employment level was down by 63 percent compared to February, by far the greatest net decline
in any industry.
There are also notable disparities within industries. For example, in retail, clothing store
employment was still down significantly in December, while grocery and drug stores have
gained slightly since February. And within food services, limited service restaurants have done
much better than full service restaurants.
In comparing industry-level job changes between New York City and the United States, four
industries help account for the city’s proportionately greater job loss. Tourism, leisure,
hospitality, and administrative and support services tied to New York’s dependence on office-
based industries account for 55 percent of the city’s February-to-December job decline. Figure 6
compares the city’s job changes in these and other Face-to-Face industries to national changes.
In most industries shown in Figure 6, the New York City decline is twice that (or worse) as for
the country as a whole. The biggest lopsided difference in the figure is in administrative and
support services, an industry that includes building service workers who have suffered because
of empty Manhattan office towers.

Center for New York City Affairs at The New School                                   February 2021
12

Figure 6
Most of New York City’s disproportionate February-to-December job loss compared to the
nation’s stems from a few Face-to-Face industries.

Source: Author’s analysis of NYSDOL and USDOL, not seasonally adjusted Current Employment Statistics.

All of the New York City industries in Figure 6 sustained double-digit job losses. In Figure 7,
featuring essential and remote industries plus retail trade (a Face-to-Face industry), the declines
were all nine percent or less. As noted above, information actually showed a small city job gain
as a result of heightened demand for the movie, television, and media content generated in this
sector. In retail, the explosion in e-commerce has driven a two percent job gain at the national
level as of December, while the weakness in clothing retailing has contributed to the overall
decline in New York City retail jobs. Besides information, the other sector with a large New
York City-U.S. disparity is in government employment; the city’s one percent job falloff pales in
comparison to the six percent drop for the U.S. overall. The 1.3 million government jobs lost at
the national level between February and December exceed the declines in all other sectors except
for restaurants.

Center for New York City Affairs at The New School                                           February 2021
13

Figure 7
Several New York City remote industries have seen greater job declines than at the national
level, although information flips that relationship with a small job gain locally.

Source: Author’s analysis of NYSDOL and USDOL, not seasonally adjusted Current Employment Statistics

That leaves us with one very specific industry that stands out in this unusual economic
environment: delivery jobs. Homebound families buying online and having food delivered from
their favorite restaurants have super-charged growth in delivery jobs, totaling more than a half-
million at the national level. While New York City’s 74 percent delivery job growth surpassed
the nation’s 67 percent gain, the local job growth has been a mere 14,000. That’s because Labor
Department data only captures payroll jobs. There likely are multiples of that number of delivery
jobs being added (both in the city and more broadly) where workers are hired as independent
contractors, with many working through delivery apps like Uber Eats or Door Dash or through
labor contractors serving Amazon. There is no question that delivery jobs are in high demand,
but they also are noteworthy for being of low quality, offering rock-bottom pay with no benefits,
no paid leave, and no rights. But at the moment, delivery jobs are the only ones being created.

Center for New York City Affairs at The New School                                          February 2021
14

 4. Job losses concentrated among persons of color, young, and less-
    educated

From the early days of the pandemic, it has been clear that communities of color have been the
hardest hit both in terms of the disease itself and when it comes to job loss and economic
hardship—68 percent of lost jobs were held by workers of color. Figure 8 below updates our
estimates of the demographic composition of workers losing jobs in 2020.These estimates are
based on the average composition of the workforce by industry pre-pandemic, since precise data
on the demographic makeup of those losing jobs does not exist. Generally, those who are
considered to face more challenges in the job market, including entry-level workers, and those
who are less-educated, younger, recent immigrant, and persons of color, have a large presence in
the Face-to-Face industries hardest hit by pandemic job losses. But it is likely these estimates
understate the impact on these workers, since they are likely to comprise those who were hired
most recently. In the years just before the pandemic, as the city economy added jobs at an
unprecedented pace in and the unemployment rate had reached historic lows. (See Figure 8.)

Figure 8
Demographic characteristics of Covid-19 dislocated NYC workers, December 2020

Source: Authors’ estimates based and ACS, 2018 5year sample, IPUMS.

Center for New York City Affairs at The New School                                 February 2021
15 Figure 9 identifies the demographic groups disproportionately affected by Covid-19-related job losses using an index of concentrated job loss measuring the ratio of each demographic’s share of job loss to that demographic’s share of baseline employment. For example, the 134 reading for the index of concentrated job loss for young adults indicates that they were 34 percent more likely to have lost work during the pandemic than workers in other age groups, on average. Latinx workers were 21 percent more likely to have lost jobs, and workers with a high school education or less were 16 percent more likely to have suffered job dislocation. While Black workers were not overly concentrated relative to their workforce share among those losing jobs, since they account for 47 percent of all workers in essential industries, including health care, social assistance, and government employees, they were at greater risk of exposure to Covid-19.4 Figure 9 Index of concentrated job loss—the ratio of a demographic’s dislocated worker share to their baseline employment share (x 100), February-to-December 2020 job losses. Source: Figure 8. Demographic data from New York’s unemployment insurance system corroborates the disproportionate job loss impact on several groups. Demographic characteristics are not publicly 4 Columbia University’s New York City Poverty Tracker survey found that 31 percent of Black workers continued to work on-site at the peak of the Covid-19 outbreak, more than twice the rate of Latinx workers and three times the rate for white workers. Sophie Collyer, Sonia Huq, Kahlen Washington, and Christopher Wimer, “Spotlight on Covid-19: Nearly half of all New York City workers lost employment income from the pandemic, deepening economic insecurity and racial inequity across the city,” University Center on Poverty & Social Policy, Columbia Population Research Center, and the Robin Hood Foundation, October 2020. Center for New York City Affairs at The New School February 2021
16

available for New York City unemployment insurance recipients. However, since the city
accounted for nearly 54 percent of all recipients for the last half of 2020, statewide demographic
data are reasonably representative of New York City. Women represented 51.3 percent of
recipients during the last half of 2020, significantly greater than their 46.5 percent share during
the last half of 2019. Similarly, there were much greater shares of recipiency for the last half of
2020 compared to the last half of 2019 among young workers less than 22 and those 22-34,
Latinx and Asian workers, and military veterans.5
While unemployment rates for New York City men and New York City women were similar for
the June-to-November 2020 period (15 and 16 percent, respectively), a substantial disparity
existed between white men and men of color. (See Figure 10.) White men had an average
unemployment rate over that period of nine percent, half the 18 percent unemployment
experienced by men of color. The disparity between white women and white men is much
greater than what has been in previous years, likely reflecting a greater incidence of women
staying home during the pandemic to care for children, including school-age children learning
from home.

Figure 10
While average unemployment rates for New York City men and women were similar for a 6-
month period in 2020, unemployment among white men was half of that for men of color.

Source: CNYCA analysis of Current Population Survey, June-November 2020

5
 Data on the characteristics of unemployment insurance recipients are available from the U.S. Department of
Labor’s Employment and Training Administration, ETA 203 report.

Center for New York City Affairs at The New School                                                February 2021
17

The lopsided nature of the pandemic’s economic effects could not be starker. As Figure 11
indicates, nearly two-thirds (64 percent) of those likely to lose jobs had annual workplace
earnings of less than $40,000, while only nine percent had earnings of more than $100,000. In a
similar vein, as Figure 9 showed, workers living in households with income below the federal
poverty line were 28 percent more likely to have lost work, and those in near-poor households
(incomes 100-200 percent of federal poverty) were 27 percent more likely than all workers on
average to have lost a job.

Figure 11
Earnings and income characteristics of Covid-19 dislocated NYC workers, November 2020

Source: CNYCA estimates based and ACS, 2018 5-year sample, IPUMS.

Center for New York City Affairs at The New School                                 February 2021
18

5. Critical importance of unemployment insurance benefits

As noted earlier, the level of initial regular State unemployment claims filed by New York City
residents has been rising since October. The January weekly average of 28,200 was 36 percent
greater than in November. In addition, there were an estimated weekly average of 21,000 city
residents submitting initial claims for Pandemic Unemployment Assistance in January, a level
nearly twice the November weekly average. As of mid-January, there were 2.6 million New
York State residents receiving unemployment benefits, with New York City accounting for half
of that number, or 1.3 million. See Figure 12 for the statewide level of UI beneficiaries from five
programs.

Figure 12
The second Covid-19 wave has pushed the level of continuing UI claims up again, with a
growing portion of recipients exhausting 26 weeks of regular state UI benefits and receiving
extended benefits.

Source: USDOL, Employment and Training Administration

In addition to those receiving regular New York State unemployment insurance (UI) benefits,
Figure 12 incudes self-employed workers, independent contractors, and others who do not
normally qualify for regular State UI and who instead receive Pandemic Unemployment

Center for New York City Affairs at The New School                                   February 2021
19

Assistance (PUA); and also workers receiving Pandemic Emergency Unemployment
Compensation (PEUC), which kicks in after the 26-week limit on State UI benefits elapses. Both
PUA and PEUC were authorized by the Federal CARES Act enacted in late March 2020, with
benefits paid entirely by the Federal government. Both programs were extended until mid-March
2021by the Emergency Coronavirus Relief Act enacted in late December.
There are also unemployed workers receiving extended benefits (EB); this is a permanent
Federal-State UI program triggered when a state’s unemployment rate reaches a specified
average level for the previous 13 weeks.6 In New York, the EB program provides up to 20 weeks
of benefits following exhaustion of regular State benefits. Under the CARES Act, PEUC was
designed to provide extended benefits first; after PEUC benefits are exhausted, a worker who is
still unemployed becomes eligible for the EB program.
Workers losing their jobs at the beginning of the pandemic in March began exhausting regular
UI benefits in September and moved to the PEUC program. As the chart indicates, part of the
decline in the number of regular UI recipients can be explained by those workers transitioning to
the PEUC program.
As of mid-January, there were a little over 400,000 regular State UI recipients in New York, 1.3
million receiving PUA benefits, and nearly 900,000 receiving either PEUC or EB extended
benefits. It is reasonable to assume that about half of each category represents New York City
residents.
Data from the State Comptroller’s office indicate that unemployed workers in New York State
received $65.2 billion in unemployment benefits from March last year through January of this
year. As Figure 13 indicates, New York City’s unemployed workers have received an estimated
$36 billion of that total. The benefit payout to city residents nearly doubled in January from
December with the reinstatement of a federally funded supplemental weekly UI payment. The
Emergency Coronavirus Relief Act provided for a $300 weekly supplement (half the $600
weekly amount that was provided to all UI recipients from April through July). A six-week $300
federal supplement was provided in August and September of 2020 out of FEMA funds. New
York State disbursed most of that supplement during September. No federal supplement was
provided from October through December.
The Federal government has funded the bulk of UI benefits paid in New York since March. For
the four months from April through July, the federal share of all benefits paid was 76 percent.
The federal share rose to 78 percent for the months of August through December. Even though
there were only six weeks of federal supplemental benefits during that time, recipients of regular
State UI benefits began exhausting their 26-week eligibility for State benefits in September and
transitioned to federally funded extended benefits. In January of this year, the federal share of UI
benefits rose to 90 percent, mainly because of the reinstatement of a $300 federal supplement but
also as more workers transitioned onto federal funded extended benefits. With the uptick in

6
 Figure 12 also shows the small number covered by “work-sharing” arrangements involving reductions in hours
worked in lieu of layoffs—in mid-January there were about 8,000 work-sharing participants.

Center for New York City Affairs at The New School                                             February 2021
20

initial regular UI claims in recent months there has been a net increase in regular UI recipients,
but that number has been topped by the increase in the numbers receiving extended benefits.7

Figure 13
New York City residents have received nearly $36 billion in UI payments between March 2020
and January 2021.

Source: New York State Comptroller, Open Books New York; estimates for New York City share based on city’s
share of monthly regular state UI benefits from the NYSDOL.

7
  Analysis of New York State Comptroller data on state agency payments from Open Book New York and
NYSDOL data on regular state unemployment insurance benefits. As of February 4, 2021, New York’s UI Trust
Fund had borrowed $9.6 billion from the U.S. Treasury to pay benefits. U.S. Treasury Direct, Title XII Advance
Activities Schedule as of February 4, 2021.
https://www.treasurydirect.gov/govt/reports/tfmp/tfmp_advactivitiessched.htm
If Federal loan repayment is not waived, the UI Trust Fund will have to repay the amount borrowed from employer
UI payroll taxes. State UI benefit payments are funded through employer payroll taxes, not the State budget.

Center for New York City Affairs at The New School                                               February 2021
21

    6. Several worrisome labor market developments

As bad as is the sheer level of job displacement and unemployment that persists into 2021, there
are additional dimensions of labor market weakness that need to be recognized. Long-term
unemployment is soaring, hundreds of thousands of those called back to work are working only
part-time, and a quarter of a million New Yorkers have dropped out of the labor force.
        Long-term unemployment
In the national unemployment report released on February 5 it was reported that, according to the
household survey, 40 percent of those unemployed had been jobless for more than 26 weeks, the
standard definition of long-term unemployment. The numbers could be higher in New York City.
Just looking at the UI participation data suggests the numbers of long-term unemployed here are
very high. Long-term unemployment makes it less likely for works to attain new jobs or
comparable jobs, and is a factor in longer-term economic hardship, health conditions, and family
stability.8
As noted in the previous section, nearly 900,000 state residents were receiving extended
unemployment benefits as of mid-January, meaning that they have been jobless for more than 26
weeks. The statewide number receiving PUA benefits has averaged 1.2 million since mid-May
and was 1.3 million in the first two weeks of January of this year. PUA benefits was extended in
December through mid-March. If the same proportion of recipients in the PUA program has
exceeded 26 weeks as in the regular State UI program (where 69 percent of recipients have
transitioned to either the PEUC or EB extended UI programs), that would mean about 900,000
PUA recipients are long-term unemployed. That makes a total of 1.8 million UI recipients. As
discussed further below, an estimated 25 percent of UI recipients are receiving partial UI
benefits, meaning that they have returned to work but only on a part-time basis, retaining access
to a portion of their UI benefits.9 Reducing the 1.8 million recipients by 25 percent who may be
working part-time leaves 1.35 million workers statewide. Applying the city’s share of January’s
recipiency level yields approximately 650,000 individuals who may be considered long-term
unemployed.
Thus, conservatively taking three-quarters of the above estimate suggests that nearly 500,000
city residents are long-term unemployed in this 11th month since the onset of the pandemic.
        Part-time employment
Since neither of the regular government labor market surveys provides current information on
part-time employment, it is difficult to pinpoint the extent to which part-time employment may
have grown in New York City over the past year. However, we can plausibly suggest that there
has been a substantial increase in part-time work from data on partial UI benefits. As mentioned

8
  Josh Bivens, “Long-Term Unemployment Has Not Damaged the Productivity of Workers, A Review of the
Evidence on Long-Term Unemployment’s Lasting Effects on Workers, Households, and the Economy,” Economic
Policy Institute, September, 2014.
9
  James Parrott, “N.Y. Needs better unemployment benefits now,” New York Daily News, February 2, 2021.

Center for New York City Affairs at The New School                                        February 2021
22
above, a worker may receive partial UI benefits if they return to work but their employer can
only offer them part-time hours. The U.S. Labor Department’s Employment and Training
Administration publishes data on the number of weeks of partial UI benefits paid each month.
That data is used to construct the series presented in Figure 14, indicating that partial UI benefits
have represented an average of 25 percent of UI weeks compensated for the months of October
through December, compared to about nine percent for the same months in 2019. Twenty-five
percent of the estimated number of New York City UI recipients in January would yield about
320,000 involuntarily part-time workers.10
Figure 14
A rapidly rising share of NYS regular UI recipients have returned to work but only on a part-
time basis.
Source: USDOL, Employment and Training Administration
Workers leaving the labor force and the effect on the unemployment rate
Prior to the pandemic New York City’s seasonally adjusted labor force level had fluctuated in a
narrow range of plus or minus one percent of 4.08 million for the previous seven years. From
February 2020 to January 2021, the city’s labor force fell by 240,000 or 5.9 percent. Such a
sudden drop reflects a substantial number of workers leaving the labor force for reasons that
include discouragement at the prospect of finding work or the need to care for family members.
Among states, New York State had the fourth-greatest labor decline over this period: 4.7 percent,
trailing only Iowa, Vermont, and Nevada. Nationally, the labor force declined by 2.4 percent
10
According to BLS estimates for alternative measures of labor utilization for 2020, New York City had an annual
average involuntary part-time employment rate of 5.0 percent. Applying this 5 percent rate to the size of the city’s
labor force in December 2020 would yield 190,000. https://labor.ny.gov/stats/nys/alternative_measures.shtm
Center for New York City Affairs at The New School February 202123
between last February and this January. Among states, only Iowa had a steeper labor force
decline over the past 11 months than New York City (-7.6 percent vs. -5.0 percent).
The official unemployment rate for New York City in December 2020 was 11.4 percent,
reflecting unemployment of 433,000 workers. However, if the 240,000 labor force dropouts are
added back, the unemployment rate would rise to 16.6 percent. And if the estimate of 320,000
involuntarily part-time workers is factored in, a total of 993,000 city workers were either
unemployed or underemployed, translating into an underemployment rate of 24.5 percent.
To better gauge the ongoing social and economic effects of the coronavirus epidemic, we turn to
the U.S. Census Bureau’s Household Pulse Survey, which periodically queries a sample of all
households. Figure 15 reports on the two main reasons (other than retirement) that respondents
gave for not working in the week prior for the nation overall and for the five largest metro areas.
For the New York metro area, 6.6 percent of adults reported not working due to caring for
children not in school or daycare, and 17 percent reported not working because of the impact of
the virus on their employer.11
Figure 15
Not working due to caring for children not in school or daycare, or because of the Coronavirus
impact on an employer’s business were prominent reasons for not working among those
reporting a reason in the Jan. 6-18 Household Pulse Survey
Source: U.S. Census Bureau, Household Pulse Survey, Week 22, Jan. 6-18, 2021.
11
Depending on the area, from 50-68 percent of respondents did not provide a reason for not working.
Center for New York City Affairs at The New School February 202124 7. Growing hardships moderated by federal assistance The unprecedented extent of job loss and under-employment coupled with its concentrated impact among low-income workers is a sure recipe for greater economic hardships. This section reviews income losses and data on rising hardships and takes stock of the extent to which federal economic assistance has moderated what would otherwise have been a catastrophic poverty increase. The Census Household Pulse Survey for mid-January found that more than two-thirds of all New York City metropolitan households with incomes less than $50,000 had experienced some loss of employment income (either through a furlough, layoff, or reduction in hours or pay) since the onset of the pandemic in mid-March. For households with incomes of $150,000 or more, fewer than 40 percent had experienced some earnings losses. At all income levels below $100,000, the extent of earnings losses were greater in the metro area than in New York State overall and at the national level. (See Figure 16.) Figure 16 Two-thirds of NYC metro area households with less than $50,000 in income lost employment income at some point between Mar. 13, 2020 and Jan. 18, 2021. Source: U.S. Census Bureau, Household Pulse Survey, Week 22, Jan. 6-18, 2021. Despite the large numbers of New York City residents receiving UI benefits (including weekly supplements for a total of five and a half months in 2020), sharply rising numbers have sought some form of public assistance since February. This has occurred following a long-term decline Center for New York City Affairs at The New School February 2021
25

in public assistance recipiency in the city over the past decade, and a decline in poverty since
2013. The number of public assistance recipients (either of Temporary Assistance for Needy
Families or State Safety Net Assistance) in New York City rose by 20 percent between February
and June, then remained at that level through September before beginning to recede to 15 percent
as of the end of 2020. (See Figure 17.) The number of city residents receiving Supplemental
Nutrition Assistance Program (SNAP) benefits rose by 220,000 from March until September
before dropping back to a December level 11 percent greater than in March.

Figure 17
Spring 2020 saw large jump in New York City public assistance rolls and Medicaid enrollments
have risen 426,000 since February 2020.

Source: NYS Office of Temporary Assistance and Disability, and NYS Department of Health

As of November, an estimated 336,000 city residents had lost health insurance as a result of
losing a payroll employment job during the pandemic. Of this number, 288,000 previously had
employer-provided health insurance; 48,000 had purchased their own health insurance but
presumably without earnings will no longer be able to buy their own insurance.12 Although the
Remote industries were responsible for far fewer job losses, a much higher percent of their
workers had employer-provided health insurance (86 percent compared to 55 percent for Face-
to-Face workers). The estimate of 336,000 payroll workers losing health insurance is broadly
consistent with the February to November increase in Medicaid enrollment for New York City of

12
  CNYCA analysis of American Community Survey data on health insurance coverage together with analysis of
payroll employment changes. An estimated 73,000 payroll workers losing jobs did not have any health insurance
previously, and 98,000 were covered by Medicaid previously and presumably would continue on Medicaid after
losing their job.

Center for New York City Affairs at The New School                                               February 2021
26

426,000.13 (See Figure 15 on the growth in Medicaid rolls.) Much of the difference might be
accounted for by self-employed workers and independent contractors losing work and the ability
to buy their own health insurance.

The Census Household Pulse survey confirms that low-income households in the New York City
area are experiencing significant hardship. During the first part of January, the survey found that
64 percent of New York City metro area households with incomes under $50,000 had difficulty
“paying usual household expenses in the last seven days.” This was 10 percentage points higher
than for the nation overall; similar higher-than-national-average levels were found in all five of
the nation’s largest metro areas. See Figure 18.

Figure 18
64% of New York metro area households with incomes under $50,000 found it “somewhat
difficult” or “very difficult” to pay usual household expenses during the pandemic

Source: U.S. Census Bureau, Household Pulse Survey, Week 22, Jan. 6-18, 2021.

Hundreds of thousands of New Yorkers are already behind on their rent, and while both the State
and the federal government have placed moratoria on evictions, significant amounts of back rent
are building up for many renters that will have to be resolved at some point. The Covid-19
assistance package enacted in December included $1.3 billion for rental assistance for New York
tenants, and President Biden has proposed additional assistance in his American Rescue Plan.
Many of the workers losing jobs and earnings in the pandemic economy were not that far from
hardship prior to March of last year. The Columbia University New York City Poverty Tracker
survey found that workers losing employment income were twice as likely to be in poverty prior

13
     NYS Department of Health, Monthly Medicaid enrollment data.

Center for New York City Affairs at The New School                                   February 2021
27 to the pandemic compared to those who were able to work from home, and that 40 percent of those losing employment income faced food hardship before the pandemic, compared to only five percent of those who began to work from home.14 Longstanding food hardships have been compounded during the Covid-19 era. While prior to Covid-19, 12 percent of New Yorkers visited a food pantry at least once in a 12-month period, in September and October of 2020, 32 percent of adults reported that they had used a food pantry at least once in the 12 prior months.15 Although Supplemental Nutrition Assistance Program (SNAP) benefits provide crucial assistance, in July and August the Poverty Tracker survey found that 60 percent of New York City SNAP households still turned to food pantries to get enough food to make it through the month.16 The December Federal assistance bill increased monthly SNAP benefits by 15 percent and funded additional food assistance. The considerable Federal assistance provided since the early days of the pandemic have helped moderate the rise in poverty even if they have not gone very far to date in restoring lost employment opportunities. Columbia University researchers estimate that nationally the CARES Act reduced the supplemental poverty measure by five-and-a-half percentage points from what it otherwise would have been in April of 2020. Rather than 19.4 percent of the U.S. population being in poverty, stimulus checks and the federal expansion of unemployment benefits lowered it to 13.9 percent. As impact of the stimulus checks wound down the CARES Act poverty reduction moderated to 3.3 percentage points and slipped further to 1.4 percentage points in August after the $600 supplemental unemployment benefit payments ended on July 31.17 The Columbia researchers also estimated that, in extending federal unemployment assistance, and providing a $300 weekly UI supplement, the December package reduced national poverty by one percentage point for 2021 (from 13.6 percent to 12. 6 percent) from what it would have been had the measure not passed.18 The estimated child poverty reduction impact of President Biden’s expanded child tax credit is discussed in the final section. It is clear that Federal economic assistance has mattered greatly in relieving hardships for millions of New Yorkers and Americans. However, little has been done in New York other than modest philanthropic efforts to address economic assistance needs among undocumented workers, who accounted for eight percent of New York City’s pre-pandemic workforce.19 14 Collyer, et.al., October 2020. 15 Sophie Collyer, Chantal Bannerman, Rebecca Charles, Katherine Friedman, and Christopher Wimer, “Food hardship in New York City is rising as New Yorkers wait for a second federal stimulus bill,” Columbia University Center on Poverty & Social Policy, Columbia Population Research Center, and Robin Hood, November 2020. 16 Collyer, et.al., November 2020. 17 Zachary Parolin, Megan Curran, Jordan Matsudaira, Jane Waldfogel, and Christopher Wimer, “Monthly Poverty Rates in the United States during the COVID-19 Pandemic,” Columbia University Center on Poverty & Social Policy, October 15, 2020. 18 Zachary Parolin, Sophie Collyer, Megan Curran, and Christopher Wimer, “The Potential Poverty Reduction Effect of President-Elect Biden’s Economic Relief Proposal,” Columbia University Center on Poverty & Social Policy, January 14, 2021. 19 James A. Parrott and Lina Moe, The New Strain of Inequality: The Economic Impact of Covid-19 in New York City, Center fore New York City Affairs at The New School, April 15, 2020, p. 18. Center for New York City Affairs at The New School February 2021
You can also read