2020 Graduate Outcomes - short-term graduate outcomes in australia November 2020 - QILT
←
→
Page content transcription
If your browser does not render page correctly, please read the page content below

short-term graduate
               outcomes in australia

                    November 2020

2020 Graduate Outcomes
        Survey
Acknowledgements

The QILT survey program, including the 2020 Graduate Outcomes Survey (GOS), is funded by the Australian Government Department of
Education, Skills and Employment. Without the active support of Dr Andrew Taylor, Phil Aungles, Dr Sam Pietsch, Gabrielle Hodgson, Dr
Michael Gao, Wayne Shippley and Ben McBrien this research would not be possible.

The Social Research Centre would especially like to thank the higher education institutions that contributed to the GOS in 2020.

We are also very grateful to the graduates who took the time to provide valuable feedback about their employment, further study and
experience with their course.

The 2020 GOS was led by Graham Challice and the project team consisted of Shane Compton, Lisa Bolton, Natasha Vickers, James
Morrison, Cynthia Kim, Alistair Wilcox, Paddy Tobias, Joe Feng, Dean Pennay, Shane Smith, Benjamin Desta, Bobby Hoque and Amida
Cumming.

For more information on the conduct and results of the QILT survey program see the Quality Indicators for Learning and Teaching (QILT)
website. The QILT team can be contacted by email at qilt@srcentre.com.au.

2020 GOS National Report                                                                                                                 i
Contents
Acknowledgements                              i
Contents                                     ii
List of tables and figures                  iii
Introduction                                 1
        Labour market outcomes               2
        Institutions                        12
        Skills utilisation                  24
        Further study                       26
        Satisfaction                        28
Appendix 1 Survey methodology               36
Appendix 2 Labour market and graduate satisfaction
definitions                                 46
Appendix 3 2020 GOS item summary           48
Appendix 4 Study area concordance           61
Appendix 5 Additional tables                64

2020 GOS National Report                             ii
List of tables and figures
Table 1 Undergraduate employment rates, by survey round, GOS Figure 1 Average hours worked per week for employed undergraduates, by
2019 and GOS 2020 (%) 2 full-time/part-time status and by survey round, GOS 2019 and GOS 2020
3
Table 2 Graduate employment and study outcomes, by study level,
2019 and 2020 6 Figure 2 Proportion of employed undergraduates who were away from
work, by full-time/part-time status and by survey round, GOS 2019 and
Table 3 Undergraduate employment outcomes, by study area, 2019 GOS 2020 (%) 4
and 2020(%) 9
Figure 3 Full-time and overall employment rates, by study level, 2009–
Table 4 Undergraduate median full-time salaries, by study area, 2020 (%) 7
2019 and 2020 11
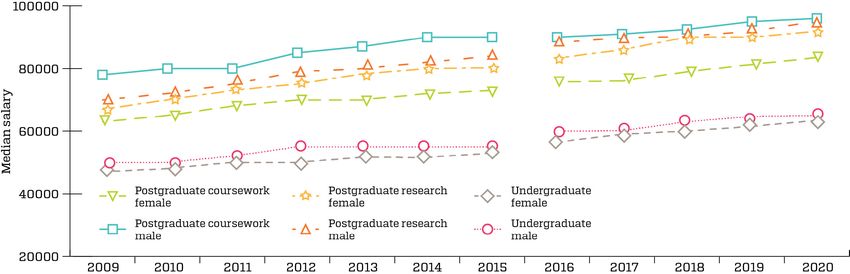
Figure 4 Median salaries by gender and level of study, 2009-2020 ($)
Table 5 Undergraduate full-time employment rate and median full- 8
time salary by university, 2019 and 2020 (%) 13
Figure 5 Undergraduate full-time employment rate by university, 2020
Table 6 Undergraduate overall employment rate and labour force (%) 17
participation by university, 2019 and 2020 (%) 15
Figure 6 Undergraduate median full-time salaries by university, 2020 ($)
Table 7 Undergraduate labour force indicators , 2018-2020 (NUHEIs 18
only) 21
Figure 7 Undergraduate full-time employment rate by NUHEI, 2018-2020
Table 8 Main reason not working more hours, of undergraduates (%) 19
employed part-time, by preference for more hours, 2020 (%)
24 Figure 8 Undergraduate median full-time salaries by NUHEI, 2018-2020
(%) 20
Table 9 Main reason for working in job in 2020 that doesn’t fully use
skills and education, 2020 (%) 25 Figure 9 Undergraduate satisfaction 2010–2020 (% agreement)
31
Table 10 Undergraduate further full-time study status in 2020, by
original field of study (%) 27 Figure 10 Postgraduate coursework satisfaction, 2010–2020 (%
agreement) 31
Table 11 Study area of undergraduates in further full-time study in
2020 (%) 28 Figure 11 PREQ 2007-2020 (% agreement) 32
Table 12 Undergraduate satisfaction (% agreement) 29 Figure 12 Overall satisfaction of undergraduates, UK (NSS) and Australia
(CEQ), 2008–2020 (% agreement) 33
Table 13 Postgraduate coursework satisfaction (% agreement)
29
Table 14 Postgraduate research satisfaction (% agreement)
30
Table 15 Undergraduate satisfaction by study area, 2019 and 2020
(% agreement) 35
2020 GOS National Report iii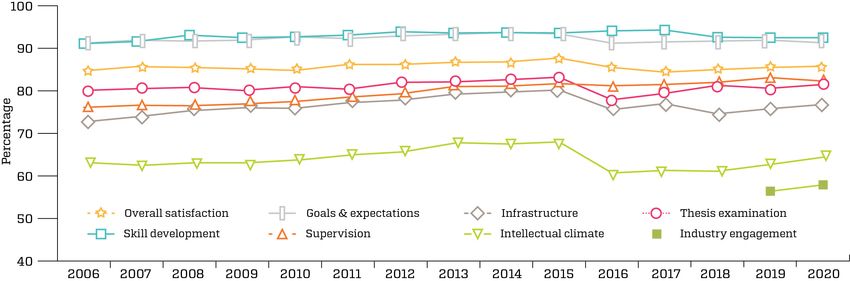
Introduction
This National Report focuses on the main indicators over time as outlined on the QILT website such as Labour Market Outcomes (rates
of full-time employment, overall employment, labour force participation and median full-time salaries), Further Study Outcomes
and Graduate Satisfaction. The report also discusses some areas of focus such as the impact of COVID-19 on labour force outcomes,
gender differences and the gender pay gap, skills utilisation including graduate occupations and reasons for skills based or time based
“underemployment”. The Graduate Outcomes Survey (GOS) also collects information relevant to themes beyond the scope of this report,
such as the importance of the course, how well the course prepared graduates for work and further study, foundation, collaborative and
adaptive graduate attributes and more detailed labour force breakdowns, including graduates working in their own businesses, unpaid
work and unemployment levels. Reporting of graduate labour market outcomes in this report focuses on domestic graduates only. In the
past, tracking labour market outcomes of international graduates has proved more difficult, though from the 2021 Graduate Outcomes
Survey it is proposed to engage in more intensive efforts in this area. Reporting of graduate satisfaction focuses on all graduates, both
domestic and international graduates combined.

This report is supported by a PowerBI workbook which allows readers to further explore the data presented in this report. It is also
supported by a set of additional static tables which provide additional data and detail out of scope of this report, but which may be of
interest to the reader.

The GOS was first implemented in 2016 to replace the Australian Graduate Survey (AGS). The AGS comprised the Graduate Destinations
Survey (GDS), which had been in place since the 1970s, and the Course Experience Questionnaire (CEQ) and Postgraduate Research
Questionnaire (PREQ), which had been in place since the 1990s. Please note that the introduction of the GOS in 2016 represented a break in
time series from the previous AGS and this is represented in time series charts and tables in this report. More information can be found in
the 2016 GOS Methodological Report. This break is represented as a break in the line on time series charts in this report.

The 2020 GOS was primarily conducted as a national online survey among 112 higher education institutions including all 41 (Table 6)
universities and 71 (Table 7) Non-University Higher Education Institutions (NUHEIs). A total of 131,780 valid survey responses were
collected across all study levels, representing a response rate of 42.3 per cent, which is a slight decrease from 44.2 per cent, achieved in
2019.

The following report provides high level results from the GOS 2020. Further detail is available from https://www.qilt.edu.au/about-this-
site/graduate-employment

2020 GOS National Report                                                                                                                       1
Labour market outcomes                                                                                                                       Graduate
The impact of the COVID-19 pandemic                                                                                                          employment rates
The COVID-19 has had a major impact on the Australian labour market, including graduate employment outcomes. As could be expected,           have declined
graduate employment rates have declined between 2019 and 2020. The full-time undergraduate employment rate, for example, fell from
72.2 per cent to 68.7 per cent, the second lowest result ever since the 68.1 per cent reported in 2014.                                      between 2019 and
However, measuring the impact of the pandemic is complicated by the structure of the GOS, which is administered across three periods         2020.
each year – in November of the previous year and in February and May of the current year. The May survey round is the largest, accounting
for around two-thirds of responses collected.

                                                                                                                                             72.2%
Since economic and social restrictions imposed in response to COVID-19 were introduced in Australia progressively from late January 2020,
they would be expected to affect graduate outcomes in the May 2020 results but would not be reflected in the earlier November 2019 and
February 2020 data.

Undergraduate results from each of the 2020 GOS survey rounds are shown in Table 1. Survey results from a particular round are best
compared with the equivalent round in other survey years, since results by round are not adjusted for seasonal effects.                      undergraduates in full-time
                                                                                                                                             employment (2019)

                                                                                                                                             68.7%
A downturn in graduate labour market outcomes was already evident in the November round of the GOS, with full-time employment
falling from 71.0 per cent in November 2019 to 68.0 per cent in November 2020. This fall of three percentage points was nearly as large as
the fall of 3.7 percentage points between May 2019 and May 2020 (from 72.7 per cent to 69.0 per cent).

Table 1 Undergraduate employment rates, by survey round, GOS 2019 and GOS 2020 (%)
                                                                                                                                             undergraduates in full-time
                                                 GOS 2019                                           GOS 2020
                                                                                                                                             employment (2020)
                              November       February        May       Total      November        February       May       Total

Full-time employment              71.0          70.2         72.7       72.2          68.0           69.7        69.0      68.7

Overall employment                85.9          83.2         87.2       86.8          84.8           81.2        85.4       85.1

Results by survey round therefore suggest a weakening of the labour market for recent graduates which predates, but was then worsened
by, the onset of the COVID-19 pandemic. This is consistent with results from the ABS Labour Force Survey which show that that the
national unemployment rate reached a low point of 5.0 per cent in late 2018 and early 2019 before increasing to 5.3 per cent in October
2019 and then 7.1 per cent in May 2019 (seasonally adjusted). Therefore, in interpreting results in the remainder of this report which are
not disaggregated by survey round, it should be borne in mind that the downturn in graduate outcomes is likely the result of both the
pandemic and general labour market conditions.

2020 GOS National Report                                                                                                                                                   2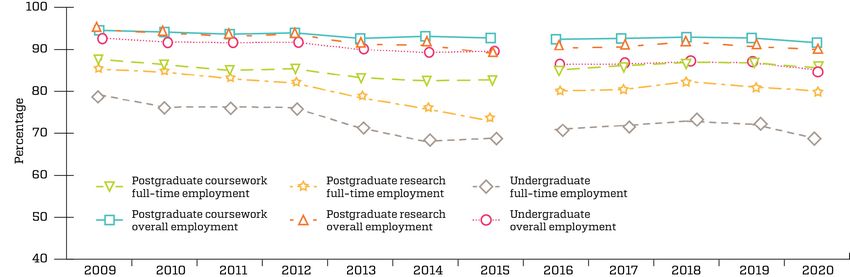
The COVID-19 restrictions have had an impact on graduate employment outcomes beyond the headline employment rates. The GOS                  Following the
follows ABS Labour Force Survey concepts and definitions in measuring graduate employment outcomes. This means graduates are
considered employed if they work at least one hour in the survey reference week, or usually work one hour per week. Graduates are           implementation
considered to be employed full-time if they actually work 35 hours per week or more, or usually work that many hours. Examining the hours
                                                                                                                                            of COVID-19
actually worked by employed graduates therefore provides an additional insight into employment trends.

The average number of actual hours worked by graduates dipped markedly in the May 2020 round of the GOS. As shown in Figure 1, hours
                                                                                                                                            restrictions, the
worked by employed undergraduates declined only slightly between November 2018 and November 2019 and were essentially stable                average number of
between the February 2019 and February 2020 rounds of the survey. Between May 2019 and May 2020, however, there was a substantial
fall in average hours worked per week from 32.2 hours to 28.4 hours.                                                                        actual hours worked
The reduction in working hours was particularly pronounced for graduates working on a part-time basis. For these graduates, average         by graduates, dipped
hours worked per week fell 22 per cent between May 2019 and May 2020 (from 18.9 hours to 14.7 hours), while for graduates working full-
time the reduction was 6 per cent (from 41.1 hours to 38.5 hours).                                                                          markedly in the May
                                                                                                                                            2020 round of the
Figure 1 Average hours worked per week for employed undergraduates, by full-time/part-time
status and by survey round, GOS 2019 and GOS 2020                                                                                           GOS.

2020 GOS National Report                                                                                                                                       3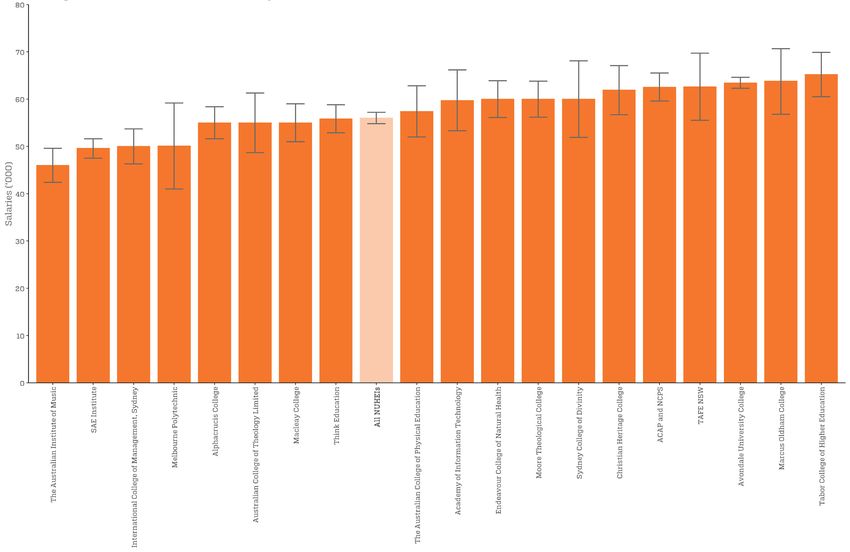
24.3%
Another item in the GOS that reflects the impact of pandemic restrictions is the proportion of graduates reporting they have been away
from work for any reason, which includes people temporarily stood down due to COVID-19. These graduates, who could potentially have
been in receipt of payments under the JobKeeper program, form part of the employed population in accordance with standard ABS Labour
Force Survey concepts used in the GOS.

As with hours worked, there were no substantial changes in the proportion of employed undergraduates who were away from work             proportion of undergraduates
between the November rounds of the 2019 and 2020 GOS, or the February rounds of the respective surveys. In the May 2020 round,           employed part-time who were
however, there was a sharp increase in the proportion away from work to 13.0 per cent compared with 2.4 per cent in May 2019.            away from work, May 2020

                                                                                                                                         4.7%
Again, the impact of the pandemic was far greater on graduates working part-time. Although the proportion of full-time employees who
were away from work more than trebled between May 2019 and May 2020 (increasing from 1.4 per cent to 4.7 per cent), the proportion of
part-time employees who were away from work increased six-fold (from 4.0 per cent to 24.3 per cent).

 Figure 2 Proportion of employed undergraduates who were away from work, by full-time/part-time
 status and by survey round, GOS 2019 and GOS 2020 (%)                                                                                   proportion of undergraduates
                                                                                                                                         employed full-time who were
                                                                                                                                         away from work, May 2020

2020 GOS National Report                                                                                                                                                4
68.7%
The greater impact of the pandemic restrictions on graduates working part-time is likely due to the nature of the industries and workplaces
in which they are employed. Graduates employed on a part-time basis are more likely to be employed in non-professional occupations such
as Sales, Community and personal services and Clerical and administration occupations. They are therefore more likely to be employed in
industries requiring face to face interaction, for example Arts and recreation services, Accommodation and food services, Administrative
and support services and Retail trade, which have more often been required to cut back their operations. In contrast, graduates employed undergraduates in full-time
full-time are more likely to be employed in professional occupations which can often be undertaken via remote working arrangements employment (2020)
85.6%
or which have continued in person in industries such as Health care and social assistance, Professional, scientific and technical services,
Education and training, Public administration and safety and Financial and insurance services.
Study level
In general, younger and less experienced persons fare worse in a downturn, as shown in recent months by ABS Labour Force Surveys and
has occurred in previous recessions. The 2020 Graduate Outcomes Survey confirms these findings, as shown by Table 2. For example, the postgraduate coursework
full-time employment rate among postgraduate coursework graduates fell from 86.8 per cent in 2019 to 85.6 per cent in 2020, a decline graduates in full-time
of 1.2 percentage points. There was a broadly similar fall in the full-time employment rate among postgraduate research graduates employment (2020)
80.1%
from 81.1 per cent in 2019 to 80.1 per cent in 2020, a decline of 1.0 percentage points. This compares with the much sharper decline in
the undergraduate full-time employment rate of 3.5 percentage points. Similarly, the overall employment rate fell more sharply among
undergraduates by 1.7 percentage points in comparison with falls of 1.1 percentage points among postgraduate coursework graduates
and 0.7 percentage points among postgraduate research graduates. When there are fewer job opportunities available, persons become
discouraged from seeking work and this is shown by the reduction in the labour force participation rate among undergraduates falling from
92.4 per cent in 2019 to 91.4 per cent in 2020, a fall of 1.0 percentage points. There was a smaller fall in the labour force participation rate
postgraduate research graduates
among postgraduate coursework graduates of 0.8 percentage points while it actually rose slightly among postgraduate research graduates
in full-time employment (2020)
by 0.4 percentage points.
Reporting of graduate salaries in the 2020 GOS includes all graduates employed full-time. The GOS asks graduates about their
‘usual’ salary level so it is likely COVID-19 will have less impact on the reporting of graduate salaries, at least in the short-term. The
median undergraduate salary level increased from $62,600 in 2019 to $64,700 in 2020, an increase of $2,100 or 3.2 per cent. Female
undergraduates continue to earn less than male undergraduates in 2020, $63,400 compared with $65,000 respectively, a difference of
$1,600. This equates to a gender pay gap of 2.5 per cent, decreasing from 4.9 per cent in 2019.
Higher level qualifications generally lead to improved salary outcomes in addition to improved employment outcomes. The median salary
of undergraduates employed full-time in 2020 was $64,700 per year while for postgraduate coursework graduates it was $87,400 and for
postgraduate research graduates it was $93,000, as shown in Table 2. The median undergraduate salary increased by $2,100 or 3.2 per cent
in 2020, while the postgraduate coursework salary increased by $2,100 or 2.4 per cent and postgraduate research increased by $3,000 or
3.2 per cent. 18.5 per cent of undergraduates proceeded to further study immediately following completion of their degree in 2020, very
2020 GOS National Report 564.7k
slightly down from 18.9 per cent in 2019. This result is perhaps a little surprising since in the past graduates have been more inclined to
undertake further study when there were fewer job opportunities available. This may be the result of COVID-19 restrictions being in place
for a relatively short period of time when the survey was undertaken and it may take time for graduates to adjust their behaviour. It will be
important to monitor the propensity to engage in further study should the downturn in economic and labour market conditions persist.
Median salary employed full-time –
Table 2 Graduate employment and study outcomes, by study level, 2019 and 2020 undergraduates (2020)
Type of Study Undergraduate Postgraduate Postgraduate research
87.4k
coursework
Year 2019 2020 2019 2020 2019 2020
In full-time employment (as a proportion of 72.2 68.7 86.8 85.6 81.1 80.1
those available for full-time work) (%)
Overall employed (as a proportion of those 86.8 85.1 92.7 91.6 90.7 90.0
available for any work) (%)
Median salary employed full-
Labour force participation rate (%) 92.4 91.4 96.3 95.5 93.9 94.3
time – postgraduate coursework
Median salary, employed full-time ($) 62,600 64,700 85,300 87,400 90,000 93,000 graduates (2020)
In full-time study (%) 18.9 18.5 6.0 6.7 5.8 7.1
93.0k
Time Series
As noted above, the undergraduate full-time employment rate of 68.7 per cent in 2020 is the second lowest ever with the low point of
68.1 per cent being reported in 2014, as shown by Figure 3. The overall employment rate of 85.1 per cent is the lowest on record with the
previous lowest figure being 85.9 per cent during the last recession in 1992. The postgraduate coursework full-time employment rate
of 85.6 per cent is the lowest reported since the 85.1 per cent reported in 2016. Similarly, the postgraduate research graduate full-time
Median salary employed full-time
employment rate of 80.1 per cent is the lowest reported since the 80.1 per cent reported in 2016.
– postgraduate research graduates
(2020)
2020 GOS National Report 6Figure 3 Full-time and overall employment rates, by study level, 2009–2020 (%) Over the longer term the gender gap in graduate salaries has tended to decline over time though change has been slow and the gender gap remains, as shown by Figure 4. In 2009, female undergraduates earned $47,000, which was $3,000 or 6.0 per cent lower than their male counterparts. As noted above, in 2020, the gender gap in undergraduate median salaries had fallen to $1,600 or 2.5 per cent. Similarly, the gender gap in postgraduate coursework salaries has declined over time, with females earning $15,000 or 19.2 per cent lower in 2009 in comparison with a gap of $12,500 or 13.0 per cent in 2020. The gender gap in postgraduate research graduate salaries has also tended to decline over time, falling from $3,000 or 4.3 per cent in 2009 to $2,000 or 2.1 per cent in 2019. However, it increased to $3,100 or 3.3 per cent in 2020, Note, there are a much smaller number of survey responses for postgraduate research graduates and hence there tends to be more variation in the data at this level of study. 2020 GOS National Report 7
Figure 4 Median salaries by gender and level of study, 2009-2020($)

Study area
The 2020 GOS shows graduates from more vocationally oriented study areas tend to have greater success in the labour market
immediately upon graduation. For example, the undergraduate full-time employment rate among Pharmacy graduates actually improved
by 0.7 percentage points from 95.7 per cent in 2019 to 96.4 per cent in 2020, as shown by Table 3. The full-time employment rate among
Teacher education undergraduates only slightly dipped from 80.8 per cent in 2019 to 80.6 per cent in 2020.

The 2020 GOS confirms findings from the recent ABS Labour Force Surveys that workers in service type activities like the events and
entertainment industries have been most impacted by the COVID-19 restrictions. For example, the largest falls in undergraduate full-time
employment by study area have been in Communications, down from 60.1 per cent in 2019 to 52.8 per cent in 2020, a fall of 7.3 percentage
points, Creative arts down 7.1 percentage points, Architecture and built environment, down 6.8 percentage points and Dentistry, down 6.2
percentage points.

2020 GOS National Report                                                                                                                   8
96.4%
Table 3 Undergraduate employment outcomes, by study area, 2019 and 20201(%)
                                  Full-time              Full-time                Overall                 Overall              Labour force            Labour force
                                 employment             employment              employment              employment             participation           participation
       Study area
                                    2019                   2020                    2019                    2020                 rate 2019               rate 2020
 Science and                          63.4                    59.1                   82.4                    81.7                    84.1                   84.3
 mathematics                                                                                                                                                                full-time employment rate of
 Computing and                        75.9                    72.1                   82.9                    81.3                    94.7                   93.8
                                                                                                                                                                            Pharmacy undergraduates -
 information                                                                                                                                                                highest (2020)
 systems
 Engineering                          84.8                    83.0                   88.4                    87.6                    95.3                   95.3
 Architecture and                     74.5                    67.7                   86.3                    82.3                    93.9                   93.5
 built environment
 Agriculture and                      72.6                    67.4                    89.1                   84.4                    92.7                   93.6
 environmental
 studies
 Health services and                  70.5                    67.2                   89.9                    87.6                    92.9                   92.9

                                                                                                                                                                            45.8%
 support
 Medicine                              91.1                   86.7                    91.9                   90.8                    88.3                   88.9
 Nursing                              76.3                    72.7                   90.4                    89.2                    97.3                   96.2
 Pharmacy                             95.7                    96.4                    97.5                   95.8                    98.5                   96.3
 Dentistry                            86.2                    80.0                    93.7                   90.6                    94.7                   90.4
                                                                                                                                                                            full-time employment rate of
 Veterinary science                   81.9                    78.2                    91.6                   89.9                    84.9                   88.1
                                                                                                                                                                            Creative arts undergraduates -
 Rehabilitation                       92.4                    87.3                   96.2                    94.4                    98.7                   97.9            lowest (2020)
 Teacher education                    80.8                    80.6                   92.7                    90.9                    95.3                   94.4
 Business and                         76.6                    74.3                   88.0                    86.4                    96.6                   95.3
 management
 Humanities, culture                  64.3                    60.9                   83.9                    83.4                    90.0                   88.6
 and social sciences
 Social work                          70.2                    67.2                   84.8                    85.0                    95.3                   94.3
 Psychology                           63.4                    61.4                   86.3                    84.4                    88.7                   88.1
 Law and paralegal                    77.3                    75.7                   86.5                    85.7                    94.8                   94.4
 studies

1 Where a graduate completes combined degrees across two study areas, their outcomes are included in both study areas. ‘All study areas’ figures count each graduate once
only.

2020 GOS National Report                                                                                                                                                                                     9
Full-time Full-time Overall Overall Labour force Labour force
employment employment employment employment participation participation
Study area
2019 2020 2019 2020 rate 2019 rate 2020
Creative arts 52.9 45.8 81.8 78.7 90.7 87.7
Communications 60.1 52.8 82.8 79.2 90.0 87.3
Tourism, 56.4 52.4 83.4 82.4 96.5 91.3
hospitality, personal
services, sport and
recreation
All study areas* 72.2 68.7 86.8 85.1 92.4 91.4
Standard deviation 11.8 12.8 4.6 4.7 4.1 3.7
(percentage points
(pp))
Median undergraduate full-time salaries in 2020 ranged between study areas from a high of $84,000 down to $49,600, with a
standard deviation of $7,800, as shown by Table 4. The areas with the highest graduate salaries were Dentistry at $84,000, Medicine
$75,000, Social work $70,000, Teacher education $70,000, and Engineering $69,500. The study areas with the lowest full-time median
undergraduate salaries were Pharmacy at $49,600, Creative arts $52,000, Tourism, hospitality, personal services, sport and recreation,
$53,500 and Communication, $55,600. The variation in salary between study areas was higher for male graduates, with a standard
deviation of $8,300 compared to $7,400 for female graduates.
The gender gap in undergraduate salaries immediately upon graduation can be explained, in part, by the fact that females are more likely
to graduate from study areas which receive lower levels of remuneration. However, it is also the case that at the undergraduate level
females earn less overall than their male counterparts within most study areas. The study areas which exhibit the highest gaps between
male and female salaries include Dentistry with a gap of $10,700, Law and paralegal studies $4,900, Business and management $3,400,
Humanities, culture and social sciences $3,100, and Science and Mathematics $2,800. Social Work and Engineering were the exceptions
where female undergraduate median salaries are higher than or equal to their male counterparts. This demonstrates that beyond subject
choice, the gender gap in median graduate salaries persists due to a range of other factors such as occupation, age, experience, personal
factors and possible inequalities within workplaces.
2020 GOS National Report 1084.0k
Table 4 Undergraduate median full-time salaries, by study area, 2019 and 20202
Male ($) 2019 Male ($) 2020 Female ($) Female ($) Total ($) 2019 Total ($) 2020
2019 2020
Study area
Science and 63,400 65,400 59,900 62,600 60,000 64,000 Median undergraduate salary,
mathematics
Dentistry– highest
Computing and 64,600 65,200 63,000 65,000 64,000 65,000
Information
Systems
Engineering 67,800 69,400 67,000 70,000 67,500 69,500
Architecture and 65,000 65,000 55,000 62,600 60,300 64,700
built environment
Agriculture and 60,500 62,300 56,200 60,100 60,000 61,500
environmental
studies
Health services and 65,100 66,000 62,600 65,000 63,000 65,100
49.6k
support
Medicine 73,400 75,300 73,000 74,000 73,100 75,000
Nursing 63,000 65,400 62,600 64,200 62,600 64,200
Pharmacy 48,000 49,600 48,000 49,600 48,000 49,600
Dentistry 88,500 90,000 84,000 79,300 88,200 84,000
Median undergraduate salary,
Veterinary science n/a n/a 55,000 57,500 55,000 57,800
Pharmacy– lowest
Rehabilitation 65,000 65,000 64,700 65,000 64,700 65,000
Teacher education 68,600 70,000 67,800 69,900 68,000 70,000
Business and 60,000 62,500 57,600 59,100 59,500 60,000
management
Humanities, culture 63,000 65,000 60,000 61,900 61,000 62,600
and social sciences
Social work 66,700 68,000 67,600 70,000 67,600 70,000
Psychology 64,700 65,000 60,000 62,800 61,300 63,000
Law and paralegal 67,600 68,900 61,300 64,000 63,200 65,000
studies
2 Where a graduate completes combined degrees across two study areas, their outcomes are included in both study areas. ‘All study areas’ figures count each graduate once
only
2020 GOS National Report 11Male ($) 2019 Male ($) 2020 Female ($) Female ($) Total ($) 2019 Total ($) 2020
2019 2020
Study area
Creative arts 54,800 52,200 50,000 51,600 52,000 52,000
Communications 52,800 57,400 54,800 55,300 54,300 55,600
Tourism, n/a n/a 49,300 n/a 50,000 53,500
hospitality, personal
services, sport and
recreation
All study areas* 64,700 65,000 61,500 63,400 62,600 64,700
Standard deviation 8,400 8,300 8,400 7,400 8,600 7,800
($)
Institutions
Universities
Employment and salary outcomes vary across institutions. It is important to acknowledge that factors beyond the quality of teaching, There were only three
careers advice and the like, such as course offerings, the composition of the student population and variations in state/territory and universities that
regional labour markets, may also impact on employment and salary outcomes. Note also that the figures in parentheses in the tables
experienced an increase
that follow indicate the confidence intervals for the survey estimates. Since the number of survey responses for each institution can be
relatively small, the confidence intervals may overlap for survey estimates from one year to the next, broadly indicating the change in
in their undergraduate
labour market outcomes may not be statistically significant. full-time employment rate
Most universities experienced falls in undergraduate full-time employment in line with the overall decline in labour market conditions
between 2019 and 2020
in 2020, as shown by Table 5. However, there were only three universities that experienced an increase in their undergraduate full-time (University of Southern
employment rate between 2019 and 2020 and these were all regional universities. They were the University of Southern Queensland Queensland, University
where the undergraduate full-time employment rate increased from 76.1 per cent to 78.9 per cent, an increase of 2.8 percentage points,
of New England, Southern
the University of New England, up from 78.2 per cent to 80.6 per cent, an increase of 2.4 percentage points and Southern Cross University,
up slightly from 74.9 per cent to 75.1 per cent, an increase of 0.2 percentage points, while noting the point made above about the likely
Cross University) all
statistical significance of changes in survey estimates from one year to the next. Graduates from regional universities are more likely to be of which are regional
older, study externally and part-time and maintain a continuing connection with the labour market which explains, in part, why graduates universities.
from these universities may have fared better in the current downturn. Also graduates from regional universities are more likely to have
completed vocational degrees and, as noted above, these graduates have also fared better in the current downturn.
2020 GOS National Report 12Table 5 Undergraduate full-time employment rate and median full-time salary by university, 2019 and 2020 (%)
Full-time employment rate Median full-time salary
University 2019 2020 2019 2020
Australian Catholic University 74.5 (72.7, 76.3) 72.4 (70.6, 74.1) 62,600 (61,700, 63,500) 64,000 (62,900, 65,100)
Bond University 65.5 (60.3, 70.1) 61.2 (55.3, 66.8) 57,200 (53,400, 61,000) 62,000 (57,500, 66,500)
Central Queensland University 79.6 (77.5, 81.4) 73.0 (69.8, 75.9) 68,000 (66,400, 69,600) 69,700 (67,000, 72,300)
Charles Darwin University 81.7 (78.5, 84.3) 79.1 (75.4, 82.2) 69,000 (67,300, 70,700) 68,000 (66,500, 69,500)
Charles Sturt University 86.4 (85.1, 87.6) 84.7 (83.2, 86.0) 67,100 (65,800, 68,400) 68,900 (67,700, 70,000)
Curtin University 72.4 (70.6, 74.1) 69.7 (67.9, 71.4) 65,200 (64,500, 66,000) 65,700 (64,500, 67,000)
Deakin University 72.8 (71.4, 74.2) 70.4 (68.9, 71.9) 60,000 (59,600, 60,400) 65,000 (63,800, 66,200)
Edith Cowan University 58.9 (56.5, 61.3) 57.1 (54.5, 59.7) 63,600 (61,500, 65,600) 65,300 (63,400, 67,300)
Federation University Australia 75.3 (72.0, 78.2) 67.2 (63.6, 70.6) 64,000 (62,000, 66,000) 64,000 (60,800, 67,200)
Flinders University 65.3 (63.0, 67.6) 63.1 (60.6, 65.6) 62,600 (60,300, 65,000) 64,500 (63,100, 65,900)
Griffith University 64.6 (62.8, 66.4) 62.1 (60.2, 63.9) 60,000 (59,200, 60,800) 60,200 (58,800, 61,500)
James Cook University 80.3 (78.3, 82.2) 75.9 (73.5, 78.0) 65,000 (63,600, 66,400) 65,900 (63,900, 67,900)
La Trobe University 70.2 (68.4, 72.0) 64.5 (62.4, 66.6) 60,000 (59,100, 60,900) 62,000 (60,400, 63,600)
Macquarie University 70.9 (69.4, 72.4) 67.8 (66.1, 69.5) 60,500 (59,300, 61,800) 62,600 (61,300, 63,900)
Monash University 74.7 (73.3, 76.0) 72.3 (70.9, 73.7) 61,000 (60,000, 62,000) 63,500 (62,200, 64,800)
Murdoch University 61.4 (58.4, 64.3) 54.8 (51.7, 57.9) 62,500 (59,800, 65,200) 65,700 (63,500, 67,900)
Queensland University of Technology 70.3 (67.8, 72.7) 68.0 (66.4, 69.5) 59,000 (57,700, 60,300) 62,600 (61,700, 63,500)
RMIT University 71.4 (69.9, 72.8) 64.3 (62.4, 66.0) 58,700 (57,100, 60,300) 60,000 (58,500, 61,500)
Southern Cross University 74.9 (71.8, 77.8) 75.1 (72.1, 77.8) 65,000 (63,400, 66,600) 65,700 (64,300, 67,100)
Swinburne University of Technology 72.5 (70.4, 74.4) 70.2 (68.1, 72.1) 65,000 (63,700, 66,300) 68,000 (65,900, 70,100)
The Australian National University 69.5 (66.5, 72.4) 69.2 (66.5, 71.7) 62,600 (61,200, 64,000) 64,000 (62,800, 65,200)
The University of Adelaide 67.4 (65.4, 69.3) 63.5 (61.2, 65.8) 62,000 (60,800, 63,300) 62,000 (60,100, 63,900)
The University of Melbourne 61.5 (59.2, 63.7) 57.0 (54.7, 59.3) 56,900 (55,100, 58,700) 59,500 (58,400, 60,500)
The University of Notre Dame Australia 77.3 (74.5, 79.8) 73.8 (71.0, 76.4) 64,000 (61,900, 66,100) 65,200 (63,700, 66,700)
The University of Queensland 72.8 (71.3, 74.3) 70.8 (69.2, 72.4) 61,800 (60,600, 63,000) 62,600 (61,700, 63,500)
2020 GOS National Report 13Full-time employment rate Median full-time salary
University 2019 2020 2019 2020
The University of South Australia 73.5 (71.6, 75.3) 67.8 (65.7, 69.9) 62,600 (61,600, 63,700) 62,600 (61,300, 64,000)
The University of Sydney 80.1 (78.4, 81.6) 75.1 (73.7, 76.4) 62,600 (61,900, 63,300) 65,000 (64,600, 65,400)
The University of Western Australia 57.8 (54.4, 61.1) 54.5 (50.8, 58.1) 56,000 (53,300, 58,700) 55,500 (52,800, 58,300)
Torrens University 62.2 (59.1, 65.1) 59.9 (56.7, 62.9) 50,000 (48,500, 51,500) 52,200 (49,600, 54,800)
University of Canberra 75.7 (73.4, 77.8) 71.5 (69.2, 73.7) 63,900 (61,900, 65,900) 66,800 (64,900, 68,600)
University of Divinity 76.7 (63.9, 85.0) n/a n/a n/a
University of New England 78.2 (76.4, 79.8) 80.6 (78.8, 82.2) 68,900 (67,900, 69,900) 70,000 (68,400, 71,600)
University of New South Wales 80.2 (78.6, 81.7) 76.2 (74.4, 77.8) 65,000 (64,500, 65,500) 67,500 (66,400, 68,600)
University of Newcastle 76.5 (74.9, 78.1) 74.4 (72.4, 76.2) 64,700 (63,900, 65,500) 65,200 (64,500, 65,800)
University of Southern Queensland 76.1 (74.3, 77.7) 78.9 (77.0, 80.6) 69,400 (68,100, 70,700) 70,700 (69,800, 71,600)
University of Tasmania 78.2 (76.4, 79.8) 72.3 (70.3, 74.2) 68,000 (66,900, 69,100) 70,300 (68,900, 71,700)
University of Technology Sydney 76.6 (75.2, 77.8) 70.8 (69.2, 72.3) 60,000 (59,100, 60,900) 62,000 (60,800, 63,300)
University of the Sunshine Coast 61.7 (59.0, 64.2) 59.3 (56.5, 62.0) 60,600 (58,400, 62,800) 62,600 (60,400, 64,800)
University of Wollongong 72.8 (70.7, 74.7) 67.9 (65.4, 70.3) 60,200 (58,800, 61,600) 62,600 (60,900, 64,300)
Victoria University 65.8 (62.9, 68.6) 57.8 (54.7, 60.7) 61,500 (58,800, 64,200) 60,100 (56,500, 63,600)
Western Sydney University 67.7 (66.0, 69.2) 58.8 (56.8, 60.8) 62,600 (62,100, 63,100) 63,400 (62,500, 64,400)
All universities 72.5 (72.2, 72.8) 69.1 (68.8, 69.4) 62,600 (62,600, 62,600) 64,700 (64,300, 65,100)
* Note: Cells marked with n/a had too few responses for meaningful analysis.
In 2020, universities with high median full-time undergraduate salaries immediately following graduation include the University of
Southern Queensland, $70,700, University of Tasmania, $70,300, University of New England, $70,000, Central Queensland University,
$69,700 and Charles Sturt University, $68,900. Note, a similar caveat applies with these universities having a larger number of graduates
who studied externally, were older, studied part-time and maintained a continuing connection with the labour market while studying which
explains, in part, why graduates from these universities may have reported higher salaries immediately upon graduation.
2020 GOS National Report 14Table 6 Undergraduate overall employment rate and labour force participation by university, 2019 and 2020 (%)
Overall employed (as a proportion of those available for Labour force participation rate (%)
any work) (%)
University
2019 2020 2019 2020
Australian Catholic University 90.8 (89.8, 91.7) 88.0 (87.0, 88.9) 95.8 (95.1, 96.4) 94.3 (93.6, 94.9)
Bond University 80.4 (76.7, 83.3) 72.3 (67.5, 76.5) 91.6 (89.0, 93.3) 90.4 (87.1, 92.7)
Central Queensland University 89.7 (88.5, 90.8) 87.1 (84.9, 88.8) 94.5 (93.5, 95.2) 93.7 (92.2, 94.9)
Charles Darwin University 92.0 (90.1, 93.4) 90.1 (87.8, 91.8) 92.4 (90.7, 93.6) 93.2 (91.3, 94.5)
Charles Sturt University 92.6 (91.7, 93.4) 91.9 (90.9, 92.7) 94.7 (94.0, 95.3) 94.7 (93.9, 95.3)
Curtin University 86.4 (85.2, 87.5) 86.6 (85.5, 87.7) 94.6 (93.8, 95.2) 94.1 (93.3, 94.7)
Deakin University 88.1 (87.2, 88.9) 88.2 (87.3, 89.0) 93.9 (93.3, 94.5) 92.4 (91.7, 93.0)
Edith Cowan University 83.1 (81.5, 84.5) 80.9 (79.1, 82.5) 94.1 (93.0, 94.9) 93.1 (91.9, 94.0)
Federation University Australia 90.7 (89.1, 92.0) 87.8 (85.9, 89.2) 93.5 (92.2, 94.5) 93.0 (91.6, 94.1)
Flinders University 85.4 (84.0, 86.7) 84.7 (83.1, 86.0) 90.6 (89.5, 91.5) 91.4 (90.3, 92.4)
Griffith University 85.3 (84.1, 86.3) 84.0 (82.8, 85.1) 92.4 (91.5, 93.1) 91.9 (91.1, 92.7)
James Cook University 89.3 (87.9, 90.4) 89.0 (87.5, 90.2) 94.1 (93.1, 94.9) 94.0 (92.9, 94.8)
La Trobe University 87.8 (86.8, 88.7) 85.9 (84.7, 87.1) 92.5 (91.7, 93.2) 93.0 (92.1, 93.7)
Macquarie University 85.2 (84.2, 86.1) 85.5 (84.4, 86.5) 93.7 (93.0, 94.2) 93.5 (92.8, 94.1)
Monash University 88.6 (87.8, 89.4) 86.6 (85.8, 87.4) 91.4 (90.7, 92.1) 90.3 (89.6, 90.9)
Murdoch University 82.4 (80.3, 84.2) 78.8 (76.5, 80.8) 92.7 (91.3, 93.8) 92.8 (91.3, 93.9)
Queensland University of Technology 88.0 (86.4, 89.4) 86.6 (85.6, 87.5) 95.9 (94.8, 96.7) 95.2 (94.6, 95.7)
RMIT University 86.7 (85.8, 87.6) 81.5 (80.2, 82.6) 93.6 (92.9, 94.1) 92.1 (91.2, 92.8)
Southern Cross University 88.1 (86.2, 89.7) 87.2 (85.4, 88.7) 91.9 (90.3, 93.1) 92.4 (91.1, 93.5)
Swinburne University of Technology 86.0 (84.6, 87.2) 82.9 (81.5, 84.2) 91.5 (90.4, 92.4) 91.2 (90.2, 92.1)
The Australian National University 83.6 (81.5, 85.3) 86.9 (85.2, 88.3) 88.8 (87.2, 90.2) 91.0 (89.7, 92.1)
The University of Adelaide 84.5 (83.3, 85.6) 81.9 (80.4, 83.2) 88.0 (87.0, 88.9) 86.0 (84.8, 87.1)
The University of Melbourne 82.4 (81.3, 83.5) 81.7 (80.5, 82.9) 84.0 (83.0, 84.8) 83.1 (82.1, 84.0)
The University of Notre Dame Australia 87.8 (85.8, 89.4) 87.6 (85.8, 89.1) 96.7 (95.5, 97.5) 93.6 (92.3, 94.6)
The University of Queensland 87.0 (86.1, 87.9) 86.0 (85.0, 86.9) 93.1 (92.3, 93.7) 91.6 (90.8, 92.3)
The University of South Australia 88.3 (87.2, 89.3) 85.5 (84.2, 86.7) 93.9 (93.0, 94.6) 93.7 (92.8, 94.5)
The University of Sydney 89.3 (88.2, 90.3) 86.6 (85.7, 87.5) 91.2 (90.3, 92.0) 90.7 (90.0, 91.4)
2020 GOS National Report 15Overall employed (as a proportion of those available for Labour force participation rate (%)
any work) (%)
University
2019 2020 2019 2020
The University of Western Australia 80.9 (79.0, 82.6) 79.7 (77.6, 81.7) 82.5 (80.9, 84.0) 85.3 (83.6, 86.9)
Torrens University 81.3 (79.2, 83.1) 79.8 (77.7, 81.7) 92.0 (90.6, 93.1) 89.5 (87.9, 90.7)
University of Canberra 88.8 (87.3, 90.0) 86.5 (85.0, 87.8) 95.3 (94.3, 96.0) 94.5 (93.5, 95.3)
University of Divinity 89.6 (81.9, 93.1) 91.1 (82.3, 95.2) 82.8 (75.9, 86.7) 73.8 (65.4, 80.1)
University of New England 87.3 (86.1, 88.3) 86.5 (85.2, 87.6) 91.7 (90.8, 92.4) 90.3 (89.3, 91.1)
University of New South Wales 88.5 (87.4, 89.6) 86.7 (85.4, 87.8) 94.2 (93.4, 94.9) 93.9 (92.9, 94.6)
University of Newcastle 90.7 (89.8, 91.6) 88.2 (87.0, 89.3) 95.1 (94.4, 95.7) 93.5 (92.6, 94.3)
University of Southern Queensland 88.9 (87.8, 89.9) 89.7 (88.5, 90.7) 94.6 (93.8, 95.2) 94.5 (93.6, 95.2)
University of Tasmania 90.3 (89.3, 91.2) 87.2 (86.1, 88.3) 87.2 (86.2, 88.1) 83.4 (82.3, 84.4)
University of Technology Sydney 88.4 (87.4, 89.2) 85.8 (84.8, 86.8) 96.1 (95.5, 96.5) 93.8 (93.0, 94.4)
University of the Sunshine Coast 84.2 (82.6, 85.6) 82.8 (81.0, 84.3) 92.7 (91.6, 93.6) 91.9 (90.6, 92.9)
University of Wollongong 87.9 (86.6, 89.0) 87.4 (85.9, 88.7) 93.8 (92.8, 94.5) 93.4 (92.2, 94.3)
Victoria University 83.3 (81.5, 85.0) 79.6 (77.6, 81.4) 92.5 (91.2, 93.6) 90.9 (89.5, 92.1)
Western Sydney University 82.1 (81.0, 83.1) 76.2 (74.7, 77.6) 92.6 (91.9, 93.3) 91.4 (90.4, 92.2)
All universities 87.0 (86.8, 87.2) 85.3 (85.1, 85.5) 92.4 (92.3, 92.6) 91.6 (91.5, 91.8)
NUHEIs
Since the number of students enrolled in individual Non-University Higher Education Institutions (NUHEIs) tends to be much smaller than
at university level, data for individual NUHEIs have been pooled across the 2018, 2019 and 2020 surveys to improve the robustness and
validity of data, as occurs on the ComparED website. Also, given the COVID-19 restrictions were only implemented towards the end of the
2020 GOS and, pooled data across three survey years diminishes variation in the data, the focus here is on survey estimates at a point in
time rather than changes over time. Using this three-year aggregation, a number of NUHEIs have full-time undergraduate employment
rates over 80 per cent, including Marcus Oldham College, 96.0 per cent, Moore Theological College Council, 91.9 per cent, Sydney College of
Divinity, 82.8 per cent, International College of Hotel Management, 80.8 per cent, TAFE Queensland, 80.4 per cent and Avondale University
College, 80.3 per cent. The same caveats about labour market outcomes at institution level apply even more so among NUHEIs which
exhibit greater variation in course offerings by level of education and study area than among universities.
Table 7 shows undergraduate median full-time salaries for NUHEIs. NUHEIs with high median full-time undergraduate salaries include
Tabor College of Higher Education, $65,200, Marcus Oldham College, $63,800, Avondale University College, $63,400, TAFE NSW, $62,600,
and ACAP and NCPS, $62,500.
2020 GOS National Report 16Figure 5 Undergraduate full-time employment rate by university, 2020 (%) 2020 GOS National Report 17
Figure 6 Undergraduate median full-time salaries by university, 2020 ($)

2020 GOS National Report                                                   18
Figure 7 Undergraduate full-time employment rate by NUHEI, 2018-2020 (%)

2020 GOS National Report                                                   19
Figure 8 Undergraduate median full-time salaries by NUHEI, 2018-2020 (%)

2020 GOS National Report                                                   20
Table 7 Undergraduate labour force indicators , 2018-2020 (NUHEIs only)

                   NUHEI                         In full-time employment (as a          Overall employed (as a proportion   Labour force participation   Median salary, employed
                                              proportion of those available for full-    of those available for any work)            rate (%)                 full-time ($)
                                                          time work) (%)                               (%)
  Academy of Information Technology                      60.7 (52.3, 68.5)                      68.3 (60.9, 74.8)                91.0 (85.8, 94.3)       59,700 (53,300, 66,200)
  ACAP and NCPS                                         58.3 (54.4, 62.0)                       82.1 (79.6, 84.2)                93.9 (92.3, 95.0)       62,500 (59,600, 65,500)
  Adelaide Central School of Art                               n/a                              80.4 (72.7, 85.0)                73.9 (68.6, 77.4)                n/a
  Adelaide College of Divinity                                 n/a                                     n/a                       75.9 (66.0, 81.3)                n/a
  Alphacrucis College                                   69.8 (62.4, 76.2)                       79.7 (75.3, 83.4)                84.1 (80.5, 87.0)       55,000 (51,600, 58,400)
  Australian Academy of Music and                              n/a                              82.1 (69.8, 88.8)                93.3 (83.0, 96.5)                n/a
  Performing Arts
  Australian College of Christian Studies                      n/a                                     n/a                             n/a                        n/a
  Australian College of Nursing                                n/a                                     n/a                             n/a                        n/a
  Australian College of Theology Limited                 64.7 (58.6, 70.3)                      80.9 (77.6, 83.6)                81.8 (79.1, 84.2)       55,000 (48,700, 61,300)
  Australian Institute of Business Pty Ltd                     n/a                                     n/a                             n/a                        n/a
  Australian Institute of Management                           n/a                                     n/a                             n/a                        n/a
  Education & Training
  Australian Institute of Professional                         n/a                                     n/a                             n/a                        n/a
  Counsellors
  Avondale University College                            80.3 (76.4, 83.4)                      86.7 (83.8, 88.9)                95.3 (93.3, 96.4)       63,400 (62,300, 64,600)
  BBI - The Australian Institute of                            n/a                                     n/a                             n/a                        n/a
  Theological Education
  Box Hill Institute                                     52.9 (44.4, 61.1)                      85.1 (79.5, 89.0)                91.0 (86.4, 93.6)                n/a
  Campion College Australia                                    n/a                               78.1 (66.8, 85.1)               84.2 (74.9, 89.0)                n/a
  Canberra Institute of Technology                             n/a                               73.1 (60.5, 81.3)               96.3 (86.1, 98.0)                n/a
  Chisholm Institute                                           n/a                                     n/a                             n/a                        n/a
  Christian Heritage College                             77.6 (70.5, 83.1)                      85.0 (80.0, 88.4)                89.6 (85.5, 92.1)       61,900 (56,700, 67,100)
  Collarts (Australian College of the Arts)              38.7 (32.5, 45.5)                      75.3 (70.6, 79.2)               92.4 (89.2, 94.3)                 n/a
  Eastern College Australia                             80.0 (66.0, 88.2)                       95.3 (88.2, 97.2)                91.5 (84.3, 94.1)                n/a
  Endeavour College of Natural Health                    65.5 (61.7, 69.0)                      89.2 (87.5, 90.5)                92.3 (90.9, 93.3)       60,000 (56,100, 63,900)
  Engineering Institute of Technology                          n/a                                     n/a                             n/a                        n/a

2020 GOS National Report                                                                                                                                                       21
NUHEI In full-time employment (as a Overall employed (as a proportion Labour force participation Median salary, employed
proportion of those available for full- of those available for any work) rate (%) full-time ($)
time work) (%) (%)
Excelsia College n/a n/a n/a n/a
Health Education & Training Institute n/a n/a n/a n/a
Holmes Institute n/a n/a n/a n/a
Holmesglen Institute 73.4 (64.7, 80.2) 88.4 (83.0, 91.7) 93.1 (88.7, 95.4) n/a
INSEARCH 32.2 (25.9, 39.3) 60.2 (56.4, 63.8) 78.3 (75.5, 80.8) n/a
International College of Hotel 80.8 (67.9, 87.8) 96.7 (87.3, 98.3) 96.8 (87.8, 98.3) n/a
Management
International College of Management, 73.9 (67.8, 79.0) 84.8 (80.0, 88.3) 95.8 (92.6, 97.4) 50,000 (46,300, 53,700)
Sydney
ISN Psychology Pty Ltd n/a 75.9 (NA, NA) 87.9 (NA, NA) n/a
Jazz Music Institute n/a n/a n/a n/a
Kaplan Business School n/a 82.8 (72.0, 87.9) 90.6 (81.6, 93.4) n/a
Kaplan Higher Education Pty Ltd n/a n/a n/a n/a
Kent Institute Australia n/a n/a n/a n/a
King's Own Institute n/a n/a n/a n/a
LCI Melbourne 49.1 (40.8, 57.4) 77.6 (70.7, 82.4) 94.4 (89.3, 96.1) n/a
Le Cordon Bleu Australia n/a n/a n/a n/a
Leo Cussen Centre for Law n/a n/a n/a n/a
Macleay College 60.9 (54.3, 66.9) 76.7 (71.7, 80.7) 89.3 (85.6, 91.7) 55,000 (51,000, 59,000)
Marcus Oldham College 96.0 (92.9, 97.5) 98.7 (96.4, 99.4) 98.1 (95.6, 99.0) 63,800 (56,800, 70,700)
Melbourne Institute of Technology 78.8 (66.4, 86.8) 78.9 (67.7, 86.3) 92.7 (83.8, 96.3) n/a
Melbourne Polytechnic 58.8 (50.2, 66.7) 84.5 (79.4, 88.0) 91.7 (87.6, 93.9) 50,100 (41,000, 59,200)
Moore Theological College 91.9 (87.2, 94.4) 89.9 (86.2, 92.0) 86.8 (83.5, 88.8) 60,000 (56,200, 63,800)
Morling College n/a n/a n/a n/a
Nan Tien Institute n/a n/a n/a n/a
National Art School 37.5 (29.8, 46.1) 76.6 (71.7, 80.5) 81.5 (77.7, 84.4) n/a
North Metropolitan TAFE n/a 69.7 (56.9, 79.5) 73.3 (63.1, 80.9) n/a
2020 GOS National Report 22NUHEI In full-time employment (as a Overall employed (as a proportion Labour force participation Median salary, employed
proportion of those available for full- of those available for any work) rate (%) full-time ($)
time work) (%) (%)
Perth Bible College n/a n/a n/a n/a
Photography Studies College 54.3 (43.0, 64.9) 84.6 (76.9, 88.9) 94.5 (88.5, 96.4) n/a
(Melbourne)
SAE Institute 40.0 (37.1, 43.0) 66.9 (64.5, 69.3) 91.5 (90.0, 92.7) 49,600 (47,500, 51,600)
South Metropolitan TAFE n/a n/a n/a n/a
SP Jain School of Management n/a n/a n/a n/a
Stott's Colleges n/a n/a n/a n/a
Study Group Australia Pty Limited n/a n/a n/a n/a
Sydney College of Divinity 82.8 (76.0, 87.5) 90.6 (86.6, 93.0) 87.9 (84.1, 90.4) 60,000 (51,900, 68,100)
Tabor College of Higher Education 61.1 (53.0, 68.5) 81.4 (76.5, 84.8) 95.9 (92.7, 97.2) 65,200 (60,500, 69,900)
TAFE NSW 57.1 (51.6, 62.5) 77.1 (72.8, 80.7) 93.1 (90.2, 94.9) 62,600 (55,500, 69,700)
TAFE Queensland 80.4 (70.7, 86.8) 81.8 (73.5, 87.2) 96.5 (90.5, 98.3) n/a
TAFE South Australia n/a n/a n/a n/a
The Australian College of Physical 67.9 (60.1, 74.5) 90.1 (85.2, 93.1) 96.5 (92.9, 98.0) 57,400 (52,000, 62,800)
Education
The Australian Institute of Music 55.7 (50.4, 60.8) 84.3 (81.2, 86.8) 95.6 (93.6, 96.8) 46,000 (42,400, 49,600)
The Cairnmillar Institute n/a n/a n/a n/a
The College of Law Limited n/a n/a n/a n/a
The MIECAT Institute n/a n/a n/a n/a
Think Education 69.6 (65.6, 73.3) 88.7 (86.7, 90.2) 90.3 (88.6, 91.6) 55,800 (52,900, 58,800)
UOW College n/a n/a 77.4 (64.9, 85.6) n/a
VIT (Victorian Institute of Technology) n/a n/a n/a n/a
Wentworth Institute of Higher n/a n/a n/a n/a
Education
Whitehouse Institute of Design, 45.7 (35.1, 56.6) 63.5 (54.3, 71.6) 92.6 (86.1, 95.9) n/a
Australia
William Angliss Institute 70.0 (59.5, 78.0) 85.1 (76.6, 89.8) 94.0 (87.2, 96.3) n/a
All NUHEIs 61.4 (60.3, 62.5) 80.4 (79.8, 81.1) 90.1 (89.6, 90.5) 56,000 (54,800, 57,200)
Standard deviation 18.5 11.5 7.3 8,800
* Note: Cells marked with n/a had too few responses for meaningful analysis.
2020 GOS National Report 2321.8%
Skills utilisation
The GOS includes a rich array of information about the nature of graduate employment. This section focuses on three commonly used
measures of skills utilisation or the quality of graduate jobs; the proportion of graduates employed part-time seeking more hours of work,
the proportion of graduates employed in managerial and professional occupations and, the proportion of graduates stating they believed
their job did not allow them to fully utilise their skills or education. These provide benchmarks of the underutilisation of skills, and as such,
of employed undergraduates are
it is important to monitor changes in these measures over time.
seeking more hours of work
36.5%
In 2020, the proportion of employed undergraduates seeking more hours of work, that is, underemployed part-time workers, was
21.8 per cent and this was higher than the 19.8 per cent in 2019 and 19.2 per cent in 2018. The main reasons that undergraduates were
underemployed part-time workers in 2020 were because there were no more hours available in their current position, 36.5 per cent, they
were studying, 12.6 per cent, because there were no suitable jobs in their area of expertise, 7.3 per cent, or because there were no suitable
jobs in my local area, 6.2 per cent. of underemployed undergraduates,
seeking more hours of work, said
Table 8 Main reason not working more hours, of undergraduates employed part-time, by preference for more there were no more hours available
hours, 2020 (%) in their current posititon
12.6%
Seeking Seeking Seeking Not seeking Not seeking Not seeking
more hours – more hours – more hours – more hours – more hours – more hours –
Male Female Total Male Female Total
Studying 14.5 11.6 12.6 52.4 36.1 40.0
Short-term illness or injury 0.5 0.5 0.5 0.4 0.4 0.4
of underemployed undergraduates,
Long-term health condition or disability 0.5 0.5 0.5 0.8 1.4 1.3
seeking more hours of work, said
Caring for children 0.8 2.8 2.2 1.4 9.9 7.9
they were currently studying
Caring for family member with a health 0.5 0.6 0.6 0.3 0.8 0.7
condition or disability
Subtotal – Personal factors 16.8 16.0 16.3 55.4 48.7 50.3
No suitable jobs in my area of expertise 7.2 7.3 7.3 0.9 0.6 0.7
No suitable jobs in my local area 7.0 5.9 6.2 0.6 0.5 0.5
Considered to be too young by employers 0.5 0.7 0.7 0.2 0.1 0.1
Considered too old by employers 0.9 0.8 0.8 0.1 0.1 0.1
No jobs with a suitable number of hours 6.0 5.0 5.3 0.2 0.4 0.4
2020 GOS National Report 2469.5%
Seeking Seeking Seeking Not seeking Not seeking Not seeking
more hours – more hours – more hours – more hours – more hours – more hours –
Male Female Total Male Female Total
No more hours available in current position 33.5 37.8 36.5 4.4 4.7 4.6
Subtotal – Labour market factors 55.2 57.4 56.7 6.4 6.3 6.3 of undergraduates employed full-
Other 28.1 26.6 27.1 38.3 45.0 43.4 time were working in managerial or
professional occupations
28.1%
Total 100.0 100.0 100.0 100.0 100.0 100.0
The proportion of undergraduates working in managerial and professional occupations is one measure of skills utilisation. These
occupations are defined by the ABS as being commensurate with requiring bachelor level or higher qualifications. In 2020, four months
after graduation, 69.5 per cent of undergraduates employed full-time were working in managerial or professional occupations which was
slightly lower than the 69.9 per cent reported in 2019, 72.1 per cent reported in 2018 and 72.2 per cent in 2017. Further information relating of undergraduates employed full-
to graduate occupations is available from the QILT Website, including Excel tables and a data visualisation workbook. time said they were working in a job
Graduates were also asked to indicate whether or not they believed that they were working in a job that allowed them to fully use their that did not fully utilise their skills
skills or education. In 2020, 28.1 per cent of undergraduates employed full-time indicated they were working in a job that did not allow or education
20.1%
them to fully use their skills or education, slightly down from 28.3 per cent in 2019, up from 27.1 per cent in 2018 and comparable to 28.2 per
cent in 2017. In 2020 around one fifth, 20.1 per cent, of undergraduates who reported they were not fully utilising their skills or education,
stated that this was because there were no suitable jobs in their area of expertise, with a further 14.1 per cent saying this was because
there were no suitable jobs in their local area. However, 20.0 per cent of undergraduates stated that they were not fully utilising their skills
or education because they were satisfied with their current job. Graduates employed part-time were more likely to state that they did not
use their skills or education in their current job because they were engaging in further study with 24.2 per cent of all employed graduates of undergraduates employed full-
stating this reason in comparison with 9.3 per cent of graduates employed full-time. time said they were working in a
job that did not fully utilise their
Table 9 Main reason for working in job in 2020 that doesn’t fully use skills and education, 2020 (%) skills or education because there
were no suitable jobs in their area of
Employed full-time Total employed expertise’
Studying 9.3 24.2
I'm satisfied with my current job 20.0 12.3
Changing jobs / careers 1.2 0.9
Entry level job / career stepping stone 2.8 1.4
Caring for children or family member 1.3 1.6
2020 GOS National Report 25Employed full-time Total employed Subtotal – Personal factors 34.6 40.5 No suitable jobs in my area of expertise 20.1 19.5 No suitable jobs in my local area 14.1 13.1 Considered to be too young by employers 6.2 4.1 Not enough work experience 3.8 3.4 No jobs with a suitable number of hours 1.5 1.8 Cannot find a job NFI 2.3 2.7 My job is temporary only / casual only 0.8 0.7 Subtotal - Labour market factors 48.8 45.3 Other 16.6 14.2 Total 100.0 100.0 Further study In 2020, four months after graduation, 18.5 per cent of undergraduates were engaged in further full-time study. This represents a slight decrease from 18.9 per cent in 2019, 19.4 per cent in 2018 and 20.7 per cent in 2017. As noted above, it will be important to monitor the proportion of undergraduates engaged in further full-time study in the future since previously, further study has been inversely related to economic and labour market conditions. Both postgraduate coursework and postgraduate research graduates were much less likely than those who had completed an undergraduate program to move into further study after completing their qualification, at 6.7 per cent and 7.1 per cent respectively. Study areas with the highest proportion of undergraduates proceeding to full-time study in 2020 included Science and mathematics, 37.3 per cent, Psychology, 31.7 per cent, Veterinary science 26.8 per cent, and Humanities, culture and social sciences, 25.1 per cent and Medicine 24.4 per cent. Undergraduates who had completed degrees in study areas with a strong vocational orientation tended, not surprisingly, to be less likely to proceed on to further full-time study in 2020. These included Nursing, 3.1 per cent, Rehabilitation, 3.1 per cent, and Teacher education, 7.7 per cent. 2020 GOS National Report 26
Table 10 Undergraduate further full-time study status in 2020, by original field of study3 (%)

Science and mathematics
                                Study area

Computing and Information Systems
                                                                                       In full-time study – Total

                                                                                                    37.3

                                                                                                    11.3
                                                                                                                                                                            37.3%
                                                                                                                                                                            the highest proportion of
                                                                                                                                                                            undergraduates proceeding to
Engineering                                                                                         11.1
                                                                                                                                                                            further full-time study
Architecture and built environment                                                                  17.2
                                                                                                                                                                            (Science and mathematics)
Agriculture and environmental studies                                                               15.2

Health services and support                                                                         21.3

Medicine                                                                                            24.4

Nursing                                                                                              3.1

Pharmacy                                                                                             9.6

Dentistry                                                                                           13.4

                                                                                                                                                                            3.1%
Veterinary science                                                                                  26.8

Rehabilitation                                                                                       3.1

Teacher education                                                                                    7.7

Business and management                                                                             10.9

Humanities, culture and social sciences                                                             25.1
                                                                                                                                                                            the lowest proportion of
Social work                                                                                          8.9                                                                    undergradautes proceeding to
Psychology                                                                                          31.7                                                                    further full-time study
Law and paralegal studies                                                                           19.0
                                                                                                                                                                            (Nursing & Rehabiliatation)
Creative arts                                                                                       22.5

Communications                                                                                      13.5

Tourism, hospitality, personal services, sport and recreation                                       16.8

All study areas                                                                                     18.5

3 Where a graduate completes combined degrees across two study areas, their outcomes are included in both study areas. ‘All study areas’ figures count each graduate once
only.

2020 GOS National Report                                                                                                                                                                                   27
In 2020, Health was the most popular area for further full-time study following an undergraduate degree, with 30.7 per cent of those Undergraduate satisfaction
proceeding to further study selecting this area. with their studies (%)
Table 11 Study area of undergraduates in further full-time study in 2020 (%)
Field of education Further study
Natural and physical sciences 11.9
Information technology 3.0
Engineering and related technologies 4.1
80.7%
Architecture and building 2.5
Agriculture, environmental and related studies 1.5
Health 30.7
Education 9.2
Management and commerce 6.6
Overall satisfaction
Society and culture 21.1
Creative arts 6.8
Food, hospitality and personal services 0.3
Mixed field qualification 1.8
Other 0.7
All fields 100.0
Satisfaction
Study level
The Course Experience Questionnaire (CEQ), administered since 1993, invites coursework graduates four months after completing
their course to express agreement or disagreement on a five-point scale with statements about various aspects of their course that
have been shown to influence student learning. Core questions cover teaching, generic skills and overall satisfaction.
2020 GOS National Report 28You can also read