COVID-19 and the labour market: Estimating the employment effects of South Africa's national lockdown - DPRU Working Paper 202107 May 2021
←
→
Page content transcription
If your browser does not render page correctly, please read the page content below
COVID-19 and the labour market:
Estimating the employment effects of
South Africa’s national lockdown

By Timothy Köhler, Haroon Bhorat, Robert Hill and Benjamin Stanwix

DPRU Working Paper 202107
 May 2021
COVID-19 and the labour market:
Estimating the employment effects of South Africa’s national lockdown

 DEVELOPMENT POLICY RESEARCH UNIT

 TIM KÖHLER
 tim.kohler@uct.ac.za

 HAROON BHORAT
 haroon.bhorat@uct.ac.za

 ROBERT HILL
 robert.hill@uct.ac.za

 BEN STANWIX
 benjamin.stanwix@uct.ac.za

 Working Paper 202107

 ISBN 978-1-920633-89-9

 May 2021

 © DPRU, University of Cape Town 2021
 This work is licensed under the Creative Commons Attribution-Non-Commercial-Share Alike 2.5 South Africa License. To view a copy of this licence,
 visit http://creativecommons.org/licenses/by-nc-sa/2.5/za or send a letter to Creative Commons, 171 Second Street, Suite 300, San Francisco,
 California 94105, USA.
Abstract

Like most around the world, the South African government quickly implemented a relatively stringent
national lockdown in response to the COVID-19 pandemic. Although much research documenting the
pandemic’s economic effects exists, these studies are largely descriptive in nature and are therefore
unable to distinguish changes in employment attributable to lockdown policy versus other pandemic-
related factors such as foreign policy and consumption-related behavioural responses. In this paper, we
seek to specifically isolate and provide causal evidence on the effect of South Africa’s lockdown policy
in particular. To do so, we adopt a quasi-experimental econometric technique to exploit variation in
legislated industry-level permission to work and the coincidental timing of the lockdown and data
collection dates of nationally representative labour force data. We find that the national lockdown
decreased the probability of employment for those not permitted to work by 8 percentage points
relative to the control group. This significant, negative effect holds across several robustness tests.
Using this estimate we can approximate that, of the 2.2 million fewer people employed, South Africa’s
lockdown policy directly accounted for just under 600 000 (or 26% of total jobs lost), suggesting the
majority of job loss can be attributed to other pandemic-related factors. We further show that the
lockdown particularly jeopardized the livelihoods of those in the informal sector, with an estimated
effect nearly 3 times larger than the overall effect. The vulnerability of this group to the economic
consequences of the pandemic is of concern, given that their informality presents a challenge for
government to provide targeted relief. To prevent further widening labour market inequalities, our
analysis emphasises the importance of effective policy to support the livelihoods of those in the
informal economy.

JEL codes:
D04, J08, J20, J48, J88

Keywords:
South Africa, labour market, COVID-19, pandemic, employment, causal inference, quasi-experimental,
inequality

Acknowledgements
This paper forms part of the “SA Future Economy” project with the Wits School of Governance and
Telkom.

Working Papers can be downloaded in PDF (Adobe Acrobat) format from www.dpru.uct.ac.za. A limited number
of printed copies are available from the Communications Manager: DPRU, University of Cape Town, Private Bag
X3, Rondebosch, Cape Town, 7700, South Africa. Tel: +27 (0)21 650 5701, email: sarah.marriott@uct.ac.za.

Corresponding authors

Prof. Haroon Bhorat (DPRU Director)
email: haroon.bhorat@uct.ac.za

Recommended citation

Köhler, T., Bhorat, H., Hill, R. and Stanwix, B. (2021). COVID-19 and the labour market: Estimating the
employment effects of South Africa’s national lockdown. Development Policy Research Unit Working Paper
202107. DPRU, University of Cape Town.

Disclaimer

The Working Paper series is intended to catalyse policy debate. They express the views of their respective
authors and not necessarily those of the Development Policy Research Unit (DPRU).

Contents
1. Introduction .................................................................................................................................... 2
2. Data and identification strategy ..................................................................................................... 3
 2.1. The Quarterly Labour Force Survey ........................................................................................ 3
 2.2. Identification strategy: Propensity Score-Matched Difference-in-Differences ...................... 4
 2.2.1. Difference-in-differences ................................................................................................ 5
 2.2.2. Propensity Score Matching ............................................................................................. 6
 2.3. Descriptive statistics ............................................................................................................... 8
3. Quasi-experimental results ........................................................................................................... 13
 3.1. Main results .......................................................................................................................... 14
 3.2. Effect heterogeneity: Triple difference-in-differences estimates ........................................ 16
 3.3. Robustness tests ................................................................................................................... 17
4. Conclusion ..................................................................................................................................... 19
Reference list ........................................................................................................................................ 21
Appendix ............................................................................................................................................... 24

 1

DPRU WP202107

1. Introduction
South Africa has been one of the countries affected most adversely by the COVID-19 pandemic in
Africa. By the end of April 2021, South Africa accounted for the highest number of confirmed cases
per capita on the continent with over 1.5 million cumulative cases, representing over a third (35%) of
total confirmed African cases. In response, like most governments around the world, South Africa
implemented a national lockdown to prepare the necessary health infrastructure as well as to delay
and minimise the spread of the virus. This initial lockdown, which began on 26 March 2020 and lasted
for five weeks, was relatively stringent by international standards (Bhorat et al., 2020; Gustafsson,
2020), making no allowance for any non-essential activities outside the home. Following this, a phased
easing of restrictions was introduced in five levels, with the initial lockdown period classified as level
5. Regulation under levels 4 (1 to 31 May) and 3 (1 June to 17 August) gradually permitted specific
categories of ‘non-essential’ work to resume. Estimates using pre-crisis data suggest that just 40% of
the employed were permitted to work under level 5, rising to 71% under level 3 (Francis et al., 2020).1

Although the pandemic continues to pose important risks to public health, South Africa’s lockdown
was always expected to lead to substantial short- and long-term economic costs. Official labour force
data shows that there were approximately 2.2 million fewer people employed in the second quarter
of 2020 relative to the first 2 – essentially erasing the last 10 years of job growth in the economy. Only
a partial recovery can be observed in data from the third and fourth quarters of the year, with net
employment still down 1.4 million relative to pre-pandemic levels. Research conducted during the
lockdown suggests that job losses have been concentrated among a range of already vulnerable
groups, particularly individuals in the poorest households (Köhler and Bhorat, 2020), less-skilled and
low-wage workers (Jain et al., 2020; Ranchhod and Daniels, 2020), informal workers (Benhura and
Magejo, 2020), those with transient employment or persistent non-employment histories (Espi et al.,
2020), those living in poor urban communities (Visagie and Turok, 2020), and women – particularly
the poorest (Hill and Köhler, 2020; Casale and Posel, 2020; Casale and Shepherd, 2020). Many of these
findings are consistent with those observed in labour markets across the world (International Labour
Organization (ILO), 2020).

Despite the large amount of important work that has already been done to measure the various socio-
economic impacts of South Africa’s lockdown, many of these studies are largely descriptive in nature.
However, changes in net employment from before to during the pandemic need not be solely
attributable to lockdown policy, but additionally to other pandemic-related factors such as mortality
and morbidity, foreign policy, and consumption-related behavioural responses. In this paper, we seek
to address these confounders and isolate the effect of South Africa’s lockdown policy on employment
in particular. To do so, we use representative labour force data – the Quarterly Labour Force Survey
(QLFS) – and employ a quasi-experimental econometric approach – a propensity score-matched (PSM)
difference-in-differences (DiD) approach – to estimate the immediate causal effect of the country’s
lockdown on employment by exploiting industry-level variation in legislated permission to work and
the coincidental timing of the national lockdown and the data collection dates of the QLFS. Simply put,
we examine the effect of the lockdown on the probability of employment amongst workers who were
not permitted to work, relative to those who were.

Several findings from our analysis stand out. In our descriptive analysis, we show that employment
loss was concentrated amongst the youth, those with lower levels of formal education, those living in
urban areas, the private sector, non-union members, the secondary sector (particularly manufacturing
and construction), and low- and semi-skilled workers. Notably, the lockdown disproportionately
affected informal-sector workers, who accounted for one in every two net jobs lost, despite

1 The assumptions to arrive at these estimates are discussed in detail in Francis et al. (2020).
2 A similar change in employment is observed if one alternatively uses year-on-year changes.

 2
COVID-19 and the labour market:
 Estimating the employment effects of South Africa’s national lockdown

representing just 25% of pre-pandemic employment. This latter finding is consistent with our quasi-
experimental findings. We find that the national lockdown decreased the probability of employment
for those not permitted to work, by eight percentage points relative to the control group – a finding
that holds across several robustness tests. We find larger effects for more stringent lockdown levels
and distinct sub-groups – specifically own-account workers (most of whom are in the informal sector)
– who experienced a nearly three times larger negative employment effect than the overall average
treatment effect. This latter finding is indicative that working in the informal sector seems to be a key
determinant of not being employed during the lockdown period. Finally, we use our main estimated
effect to approximate the proportion of aggregate job loss that is directly attributable to the lockdown
policy as opposed other pandemic-related factors discussed above. We calculate that of the 2.2 million
quarter-on-quarter contraction in employment, South Africa’s specific lockdown policy directly
accounted for about 583 500, or 26.1% of total jobs lost. However, depending on assumptions, this
pure lockdown effect may be as low as 285 000 (12.7% of total jobs lost). Overall, this suggests that
the majority of South Africa’s short-term job loss can be attributed to other pandemic-related factors,
such as foreign policy or changes in consumer behaviour.

The rest of the paper is structured as follows. In Section 2, we describe our data, identification
strategy, and present several descriptive statistics on labour market outcomes prior to and during the
first three months of South Africa’s national lockdown. In Section 3, we present and discuss our main
findings from our quasi-experimental models. In Section 4, we reflect on our results and conclude.

2. Data and identification strategy

2.1. The Quarterly Labour Force Survey

The analysis in this paper uses individual-level survey data from Statistics South Africa’s (StatsSA)
Quarterly Labour Force Survey (QLFS). The QLFS is a cross-sectional, nationally representative
household survey, conducted every quarter since 2008, that contains detailed information on a wide
array of demographic and socioeconomic characteristics and labour market activities for individuals
aged 15 years and older. There are a number of important differences in the 2020 QLFS data that are
worth noting in some detail here. Prior to the COVID-19 pandemic in South Africa, the QLFS sample
consisted of nearly 70 000 individuals living in approximately 30 000 dwelling units, with data being
collected via face-to-face interviews. However, towards the end of March 2020, StatsSA suspended
face-to-face data collection as a result of COVID-19. Because of this, 621 sampled dwelling units (or
2% of the sample) were not interviewed in the quarter 1 dataset. To adjust for this, StatsSA used the
panel component of the survey and made imputations where possible, using data from the previous
quarter.

To continue providing labour market statistics for the remainder of the year during the national
lockdown, StatsSA changed its data collection mode from face-to-face interviews to computer-
assisted telephone interviewing (CATI). To facilitate this, and unlike in previous quarters, the sample
that was surveyed in 2020Q1 and for which StatsSA had contact numbers was surveyed again in
2020Q2. The result was that the 2020Q2 data included about 71% of the 2020Q1 sample because not
all dwelling units had contact numbers. 3 The obvious concern here is that this will produce 2020Q2
estimates that suffer from selection bias; that is, it is likely that the underlying characteristics of
‘telephone’ and ‘non-telephone’ households are different. For example, we know from the 2020Q1
data that individuals in ‘non-telephone households’ were significantly more likely to be unemployed
relative to those in ‘telephone households’. To address this source of bias, StatsSA took a number of

3Additionally, amongst those who did have contact numbers, some contact numbers were found to be invalid or were not answered during
data collection, and some households indicated that they were no longer residing at the dwelling units they had occupied during 2020Q1.
All of these were regarded as non-contact and were adjusted for during the weighting processes.

 3
DPRU WP202107

steps to adjust the calibrated survey weights, using the 2020Q1 data and several bias-adjustment
factors (StatsSA, 2020d), which we do not discuss in detail here.

Table 1 below presents an overview of the sample sizes and weighted estimates of the South African
labour market for 2020Q1 and 2020Q2. We use the relevant bias-adjusted sampling weights provided
by StatsSA unless otherwise indicated and restrict the sample to the working-age population (those
aged 15 to 64 years). Looking at the aggregated data, the bias-adjusted 2020Q2 weights appear to be
appropriately computed. From an unweighted sample of 66 657 individuals, the weighted estimate of
the South African population in 2020Q1 is 57.8 million. The relevant 2020Q2 estimate is just under 58
million, despite the 2020Q2 sample consisting of nearly 20 000 fewer individuals. In contrast, the
weighted estimates of specific labour market groups (such as the labour force and number of
employed) are statistically significantly different in size between quarters, which is expected given the
pandemic and associated government responses. Despite this, it should be noted that the sampling
bias adjustments by StatsSA relied on observable characteristics, such as age, gender, and race;
however, respondents may still be unobservably different from non-respondents, and hence possibly
from the broader population. At the time of writing, an explicit external review of the construction of
these weights has yet to be conducted and would require more information than is available in the
public QLFS documentation.

Table 1: Sample sizes and weighted population estimates, by quarter

 2020Q1 2020Q2
 Unweighted Weighted Unweighted Weighted

 Total 66 657 57 792 395 47 103 57 973 917
 Working-age population 41 827 38 873 945 29 495 39 021 017
 Labour force 24 549 23 452 204 13 023 18 443 066 *
 Employed 17 044 16 382 555 10 001 14 148 215 *
 Unemployed 7 505 7 069 649 3 022 4 294 851 *
 Discouraged 3 149 2 918 028 1 865 2 470 782 *
 Not economically active 14 129 12 503 712 14 607 18 107 168 *
Source: QLFS 2020Q1 and 2020Q2 (StatsSA, 2020a and 2020b). Authors’ own calculations.
Notes: [1] Relevant estimates weighted using sampling weights. [2] Labour market groups restricted to the working age (15 to 64 years). [3]
Official (narrow) definitions of unemployment used. [4] * denotes statistical significance of a different 2020Q2 estimate relative to the
relevant 2020Q1 estimate at the 95% confidence level.

2.2. Identification strategy: Propensity Score-Matched Difference-in-Differences

Our aim in this paper is to estimate the causal effect of South Africa’s national lockdown on
employment probability, for which we require a suitable identification strategy. Using vocabulary from
the randomised evaluation literature, the ideal way to estimate a causal effect entails randomised
assignment of treatment (in this case, a national lockdown). Such randomisation would, subject to
several conditions, allow us to directly measure the effect of the policy in isolation. In the context of
South Africa’s national lockdown, however, treatment was not assigned randomly. Every worker in
the country was legally obligated to adhere to the lockdown regulations as they were specified and
adjusted over time. However, being permitted and able to continue working was dependent on job
type, which does provide a neat division of ‘treated’ and ‘untreated’ individuals over time. As such,
we estimate the causal effect of the lockdown by exploiting between-industry variation in legislated
permission to work, as per the relevant Government Gazettes. We cross-examine these lockdown
regulations with over 150 three-digit industry codes in the QLFS data to identify individuals who were
and were not permitted to work. To address selection bias and ensure that employment probabilities
are driven only by differences in treatment, we then employ a propensity score matching (PSM)
reweighting technique that seeks to provide a comparable set of individuals across our treatment and
control groups. We then use the timing of the national lockdown, and the timing of the QLFS data

 4
COVID-19 and the labour market:
 Estimating the employment effects of South Africa’s national lockdown

collection interviews, to estimate difference-in-differences (DiD) models on a matched panel sample.
This approach is outlined in more detail below.

2.2.1. Difference-in-differences

Our DiD approach exploits across-group (treatment and control) and across-time (before and during
the national lockdown) variation. We use the 2020Q1 QLFS (January to March 2020) as our pre-
treatment period and the 2020Q2 QLFS (April to June 2020) as our post-treatment period. 4 This is
motivated by the observation that the lockdown was implemented from the end of March 2020,
coinciding with the change in QLFS quarters. We thus can compare employment outcomes effectively
for those not permitted to work versus those permitted to work over the period. Specifically, our
treatment group consists of all the individuals in our sample who, as per legislation, were not
permitted to work during the national lockdown. Our control group thus consists of those who were
legally permitted to work. We additionally include in the control group anyone who was able to work
due to specific characteristics of their occupation and sector. This sub-category of workers includes
those working in the public sector and those, amongst the employed, who report working from
home. 5,6 In our analysis to follow, we estimate several specifications using alternative control group
definitions to examine the sensitivity of our results.

Importantly, South Africa’s lockdown rules were not time-invariant. As noted above, from April 2020
the country adopted a five-stage risk-adjusted lockdown strategy which outlined who was permitted
to work at each lockdown level. To account for this, we make use of QLFS 2020Q2 ‘interview date’
data provided by StatsSA, which indicates whether an individual was surveyed in April, May or June
2020. These periods fortunately coincide with changes in the national lockdown levels, with Level 5 in
place from 1 to 30 April, Level 4 from 1 to 31 May, and Level 3 from 1 to 30 June in the 2020Q2 data. 7
For example, individuals were included in the treatment group if they were not permitted to work
under Level 5 regulations and they were interviewed in April during Level 5, and similarly for Levels 4
and 3. Regardless of permission to work as per legislation or lockdown level, all individuals working in
the public sector or working from home were assigned to our main control group. In some instances,
firms in a given industry were permitted to operate, but only at partial capacity. However, we cannot
identify which workers were permitted to work in these ‘limited capacity industry’ situations. To
address this, we assign relevant individuals to the control group (i.e. ‘permitted to work’) if they were
permitted to work in a ‘limited capacity industry’, in which the legislated capacity was equal to or
exceeded 50%. In our analysis, we use alternative thresholds to examine the sensitivity of our results
to this assumption.

Based on the PSM reweighting approach discussed below, our DiD model is estimated according to
the following specification using Ordinary Least Squares (OLS):

 = 0 + 1 + 2 + 3 × + 4 + + ,

where is the outcome of interest for individual in time period (in this case, a binary employment
variable using the conventional definition 8), is a binary treatment variable, is a

4 It should be noted that our identification strategy cannot account for seasonality, which may be important to note considering that the
South African economy went into recession prior to the pandemic in 2020Q1.
5
 The relevant work-from-home variable was included as an additional variable in the 2020Q2 QLFS as part of a special COVID-19 module
and was only asked of the employed. We exploit the panel nature of the 2020Q1 and 2020Q2 QLFS datasets to impute responses in 2020Q1
based on individuals’ 2020Q2 responses to this question.
6 We include the unemployed who have worked before in the sample and use the relevant three-digit previous industry variable to assign

them to treatment and control groups.
7 We cannot account for any changes in legislature within lockdown levels, given that the frequency of the interview date data is monthly.
8 Here we make use of StatsSA’s conventional definition of employment as per the standard ILO definition. This includes any working-aged

individual who worked even for an hour in the week prior to the survey, as well as those who did not work because they were temporarily

 5
DPRU WP202107

binary variable equal to one for the post-treatment period (2020Q2) and zero otherwise (2020Q1),
and is the regression error term. Furthermore, even though PSM accounts for pre-existing
observational differences between individuals in the treatment and control groups, and the matched
DiD approach controls for pre-existing unobservable differences (under the parallel trend assumption)
and time-variant observational differences, we further control for a vector of pre-existing individual-
level characteristics, (including a categorical national lockdown level variable), to improve (i) the
plausibility of the DiD identifying assumption and (ii) the efficiency of our estimates. Finally, we exploit
the panel nature of the data to control for individual fixed effects (FE), represented by . 3 is the
main coefficient of interest, as it measures the causal effect of the onset of lockdown policy; that is,
the average difference in outcomes between the treatment and control groups in the post-treatment
period relative to the pre-treatment period.

2.2.2. Propensity Score Matching

Individuals in the treatment and control group may differ by characteristics other than treatment
itself, which will likely bias the employment effects we are trying to identify. To address such selection
bias, we use a common approximate matching technique – PSM – which seeks to identify similar
individuals across treatment and control groups. Put differently, PSM attempts to ensure balance in a
set of common observable characteristics across treatment and control groups in the pre-treatment
period. The idea is to compare individuals who, conditional on a set of observables, have very similar
probabilities of being in the treatment group (propensity scores), even though those individuals differ
with regard to actual treatment status. If two individuals have the same propensity scores conditional
on a vector of observable covariates but one is in the treatment group and the other is not, then the
two individuals are regarded as observationally exchangeable and differences in their observed
outcomes of interest are attributable to differences in treatment. 9

We first estimate propensity scores, and thereafter use these probabilities to construct and use
inverse probability weights (IPW) in our DiD regressions on the matched sample. To estimate these
scores, we use a logit model to estimate the probability of being in the treatment group based on a
vector of observable covariates. 10 These include age, age squared, sex, race, marital status, highest
level of education, province, household geographic area, lockdown level, and type of employment.
Our inclusion of specific covariates in the propensity score model is guided by the aim of credibly
satisfying the conditional independence assumption (CIA): conditional on the propensity score, the
outcome of interest is independent of treatment. This entails including variables that are thought to
be related to both the treatment and the outcome of interest but are unaffected by the treatment
itself. We adopt a parsimonious model and avoid including too many variables, given that doing so
may exacerbate the common support problem. 11 Using nearest-neighbour matching using a relatively
small caliper of 0.02, we match exclusively on pre-treatment data, given that post-treatment
characteristics may be endogenous, as follows:

 ( ) ≝ ( = 1 | ),

absent but definitely had a job to return to. Because the conventional inclusion of this latter group may not be appropriate in the context
of a lockdown, we make use of several alternative employment definitions as a robustness test in Section 3.3.
9 Assuming the conditional independence assumption (CIA) holds; that is, treatment (legislature not permitting work) conditional on the

propensity score is independent of potential outcomes or is “as good as random”.
10 The choice of using a logit as opposed to a probit model for the binary treatment case is not critical, because these models usually yield

similar estimates; however, the former is used because the logistic distribution has higher density mass in the bounds (Caliendo and
Kopeinig, 2008).
11 When there is an insufficient overlap in observables of individuals in the treatment and control groups to find appropriate matches (Bryson

et al., 2002).

 6
COVID-19 and the labour market:
 Estimating the employment effects of South Africa’s national lockdown

where is a binary variable equal to one if an individual is included in the treatment group
and zero if included in the control group, and is the vector of observable covariates discussed
above. We then generate IPWs using these scores to reweight observations as follows:

 1−
 = � − �,
 1−

where is the final inverse probability weight of individual , which is equal to the QLFS sampling
weight ( ) multiplied by a function of the dichotomous treatment variable and the estimated
 1 1
propensity score . 12 This function is equivalent to for treated observations and for control
 1−
observations, and is based on inverse-probability regression (Brunell and DiNardo, 2004). That is, it
weighs up treated observations with lower propensity scores and control observations with higher
propensity scores. Table 2 presents diagnostic statistics to examine covariate balance between
treatment groups in the raw and matched samples. Our PSM approach appears to have worked
relatively well. For every covariate in the matched sample, the standardised differences are all close
to zero, and the variance ratios are all close to one. 13 This is reflected by the propensity score
histogram in Figure 1 which highlights sufficient overlap in the distribution of propensity scores across
treatment groups and implies that matching on the estimated propensity score balanced the
covariates.

Table 2: Propensity score matching balance summary diagnostics of pre-treatment covariates

 Standardised Variance
 Variable differences ratio
 Raw Matched Raw Matched
 Sex
 Male 0.211 0.026 0.982 0.993
 Female -0.252 -0.020 0.923 0.991
 Race
 Black/African 0.090 -0.021 0.880 1.035
 Coloured -0.040 0.007 0.904 1.019
 Indian/Asian 0.006 0.011 1.037 1.072
 White -0.093 0.019 0.747 1.070
 Education
 Primary education or less 0.086 0.053 1.214 1.122
 Secondary incomplete 0.216 -0.013 1.114 0.997
 Secondary complete 0.042 -0.012 1.033 0.992
 Tertiary -0.411 -0.020 0.469 0.948
 Age and geographic area
 Age -0.115 0.058 1.003 1.042
 Urban 0.064 -0.007 0.935 1.008
 Traditional areas 0.005 -0.002 1.007 0.997
 Farms -0.152 0.025 0.488 1.161
Source: QLFS 2020Q1 (StatsSA, 2020a). Authors’ own calculations.
Notes: [1] Labour market groups restricted to the working-age population (15 to 64 years). [2] Propensity scores estimated for the panel
through logit regression on a pre-treatment vector of covariates using a caliper of 0.02 and independent and identically distributed (i.i.d.)
standard errors.

12This latter function is normalised using min-max normalisation prior to being included in this formula.
13Despite these results suggesting success in achieving balance of observables, inference here is regarded as informal because we do not
have standard errors for these statistics.

 7
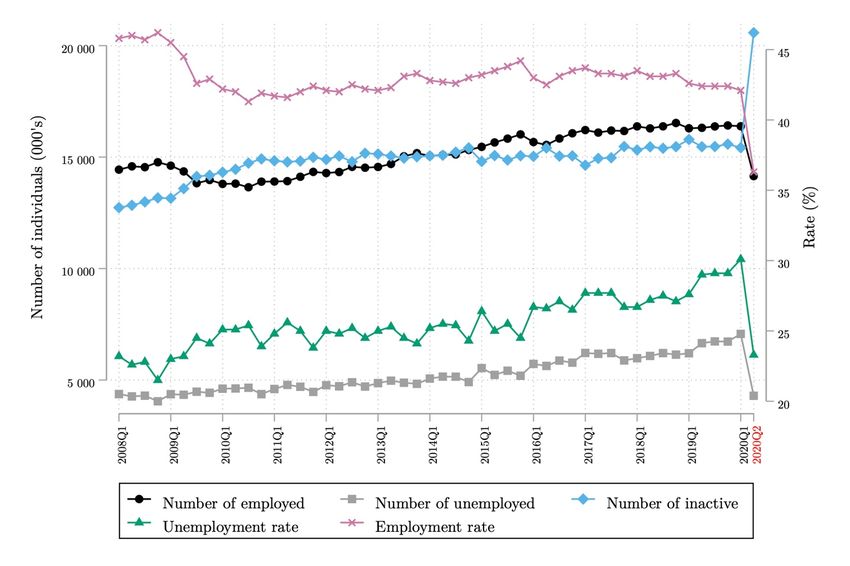
DPRU WP202107

Figure 1: Kernel density plots and histogram of propensity scores, by treatment group and sample

Source: QLFS 2020Q1 (StatsSA, 2020a). Authors’ own calculations.
Notes: [1] Labour market groups restricted to the working-age population (15to 64 years). [2] Propensity scores estimated for the panel
through logit regression on a pre-treatment vector of covariates using a caliper of 0.02 and independent and identically distributed (i.i.d.)
standard errors.

2.3. Descriptive statistics

Prior to presenting and discussing our quasi-experimental estimates, we present several descriptive
statistics of aggregate and between-group changes in net employment since the beginning of the QLFS
in 2008, highlighting the recent effects of the pandemic. Expectedly, the pandemic led to a substantial
reduction in the number of employed in the country. Relative to 2020Q1, there were more than 2.2
million less employed people in 2020Q2 – a 14% decrease, which is equivalent to employment levels
between 2008 and 2012. This drop in employment was coupled with a decrease in the number of
official (searching) unemployed individuals (by nearly 40%, or 2.7 million), and an even larger absolute
increase in the number of economically inactive individuals (by 33%, or more than 5 million). 14 These
shifts can to a large extent be explained by the nature of the national lockdown policy, which restricted
the ability of people to work and to search for work. Together, these large shifts explain the, if
observed alone, misleading decrease in the official unemployment rate from 30% to 23% – the lowest
recorded since the start of the QLFS – reflecting a simple definitional consequence. These unusual
changes in employment, unemployment and inactivity have been observed in labour markets across
the world (ILO, 2020), but must be accepted as nothing more than a statistical anomaly brought about
by the inability of the unemployed to search for jobs.

14 This latter group are not classified amongst the discouraged unemployed because, when asked why they were not looking for work,

individuals in this group responded with reasons ‘Other’ than discouragement. This reason can be attributed to the national lockdown policy,
which restricted any activity deemed ‘non-essential’ outside the home.

 8
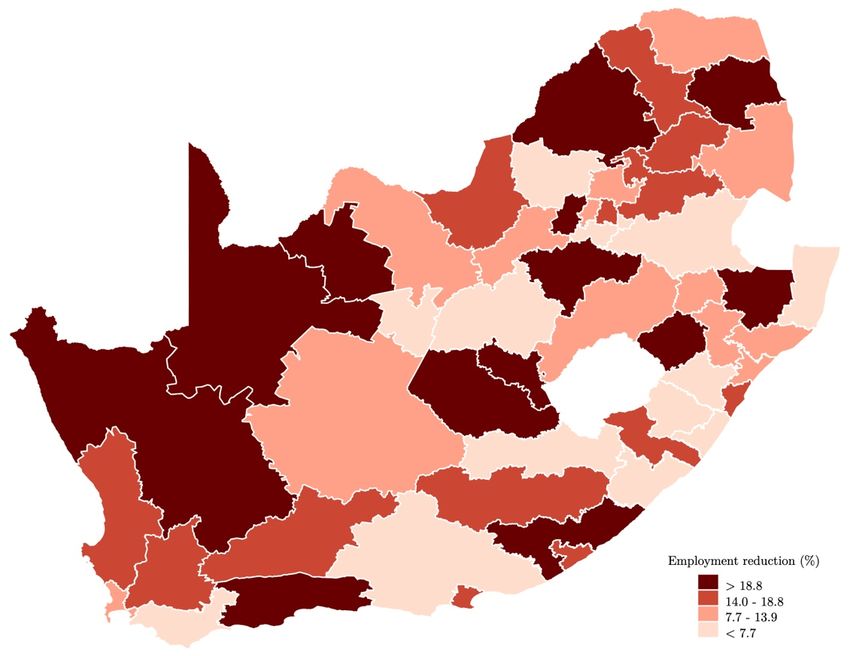
COVID-19 and the labour market:
 Estimating the employment effects of South Africa’s national lockdown

Figure 2: Trends in key labour market indicators, 2008Q1-2020Q2

Source: QLFS 2008Q1 to 2020Q2 (StatsSA). Authors’ own calculations.
Notes: [1] All estimates weighted using relevant sampling weights. [2] Official (narrow) definition of unemployment used throughout.

The observed changes in aggregate labour market outcomes above are important to consider,
however they hide substantial underlying between and within-group variation. Along multiple
dimensions in South African labour market, the distribution of job loss has been uneven.
Geographically, Figure 3 highlights the significant variation in net employment changes across the
country. By province, Gauteng (GP), KwaZulu-Natal (KZN), and the Western Cape (WC) – the largest
provinces in terms of their national employment shares – experienced the largest absolute reductions
in employment with approximately 1.4 million fewer people employed. Gauteng alone accounts for
nearly 30% of total jobs lost. In relative terms, however, the Northern Cape, Free State, and Limpopo
were hardest hit, with 23%, 17%, and 17% fewer people employed, respectively.

 9
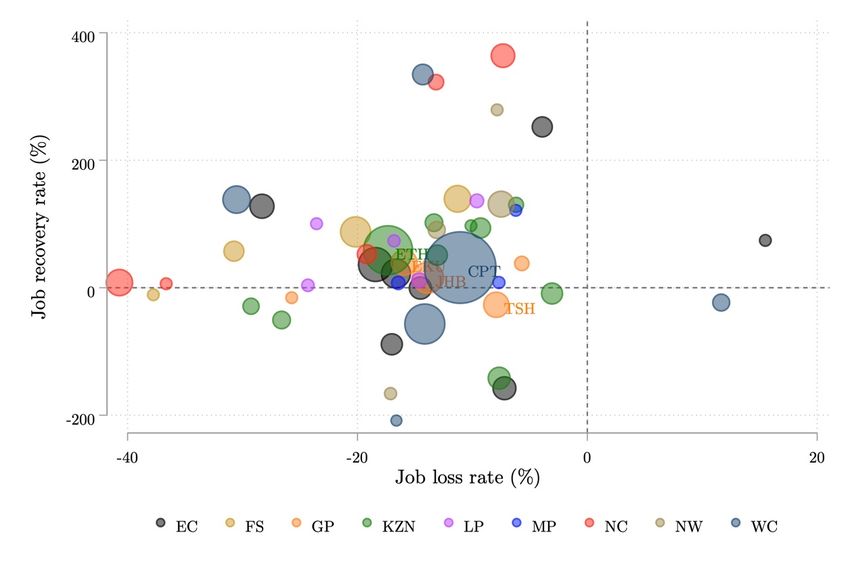
DPRU WP202107

Figure 3: District-level variation in net employment loss, 2020Q1-2020Q2

Source: QLFS 2020Q1 and 2020Q2 (StatsSA, 2020a and 2020b). Authors’ own calculations.
Notes: [1] Sample restricted to working-age population (15 to 64 years). [2] All estimates weighted using relevant sampling weights.

Just as the distribution of job loss was unequal, so too is that of recovery. Figure 4 presents a
scatterplot of job loss and recovery rates for each of South Africa’s 52 municipal districts, weighted by
share of national employment and colour-coded by province. The majority of districts are located in
the upper-left quadrant, with most exhibiting a severe immediate employment contraction and a
subsequent modest recovery. Of the largest districts, eThekwini in KZN – who experienced the most
severe contraction of 17%, closely followed by Ekurhuleni and the City of Johannesburg in GP (16%
and 14%) – had recovered almost 60% of net employment lost from 2020Q1-2 by the end of the year.
On the other hand, the cities of Cape Town and Johannesburg had recovered just under a third (32%)
and 16% of lost employment, respectively.

 10
COVID-19 and the labour market:
 Estimating the employment effects of South Africa’s national lockdown

Figure 4: District-level weighted scatterplot of net employment loss and recovery, by province

Authors’ own calculations. Source: QLFS 2020Q1, 2020Q2, and 2020Q4 (StatsSA, 2020a, 2020b, and 2020c).
Notes: [1] Sample restricted to working-age population (15 to 64 years). [2] All estimates weighted using relevant sampling weights. [3]
Markers weighted by pre-pandemic share of national employment in 2020Q1. [4] Job loss = percentage reduction in net employment from
2020Q1 to 2020Q2; job recovery = net employment gain from 2020Q2 to 2020Q4 as a percentage of net employment loss from 2020Q1 to
2020Q2. [5] EC = Eastern Cape, FS = Free State, GP = Gauteng, KZN = KwaZulu-Natal, LP = Limpopo, MP = Mpumalanga, NC = Northern Cape,
NW = North West, WC = Western Cape, ETH = eThekwini, EKU = Ekurhuleni, JHB = City of Johannesburg, CPT = City of Cape Town, TSH =
Tshwane.

Demographically, perhaps most significantly, youth accounted for about half (50.6%, or 1.1 million) of
employment loss, despite representing only over a third (36.6%) of pre-pandemic employment.
African/Black individuals accounted for nearly 78% of the aggregate reduction in net employment, or
1.7 million people – a slightly disproportionate burden given the group’s share of pre-pandemic
national employment of 75%. On the other hand, just 150 000 (7%) fewer White individuals were
employed despite accounting for 11.3% of the pre-pandemic employed. Considering gender, although
men accounted for a slightly higher share of employment loss (55.5%), women were slightly
disproportionately affected given their smaller share of pre-pandemic employment (43.7%).
Employment loss was disproportionately concentrated amongst individuals with relatively lower
levels of formal education, those living in urban areas, those working in the informal sector, the private
sector, and the non-unionised. Individuals whose highest level of education is less than Grade 12
(matric) or equivalent accounted for more than 70% of employment loss, despite representing only
45% of pre-pandemic employment. Notably, although employment loss in the informal sector and
private households together represent about half of total employment loss, these sectors accounted
for just under 28% of pre-pandemic employment, highlighting a disproportionate burden.
Remarkably, almost all (93.8%) jobs lost were in the private sector, despite the public sector
accounting for 17.4) of pre-pandemic employment. Similarly, nearly all those who lost jobs (95.2%)
were non-union members.

The tertiary sector accounted for most of the total employment decrease (67.1%), but this is not
unexpected given that the sector accounted for most jobs (72.2%) prior to the pandemic. The
remaining job loss (30.6%) was accounted for by the secondary sector, exceeding its share of pre-
pandemic employment. These latter job losses were mostly in manufacturing (334 000 jobs lost) and

 11
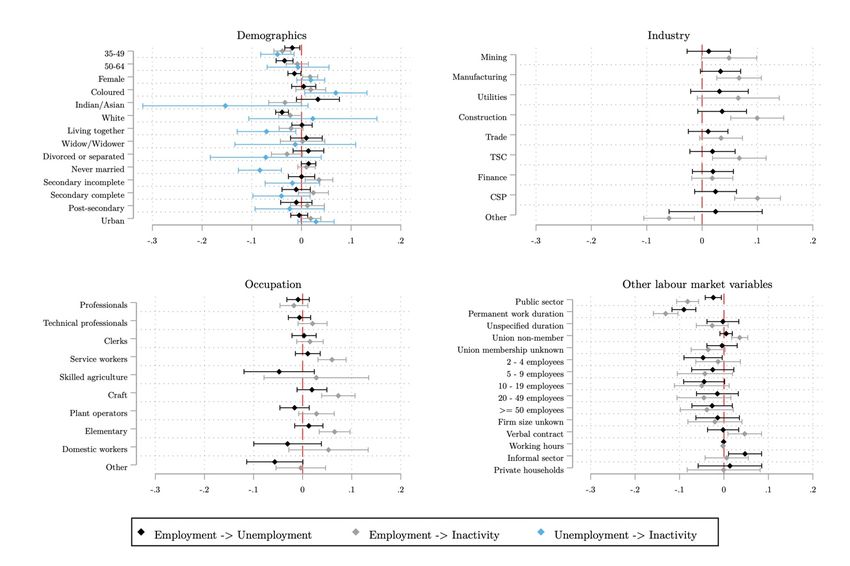
DPRU WP202107

construction (297 000 jobs lost). The primary sectors appear to have been relatively well insulated
from the negative employment effects. By occupation, lower- and semi-skilled workers account for
almost all jobs lost, with employment levels amongst high-skilled workers remaining statistically
unchanged. Amongst low-skilled occupations, one in every four (or 250 000) domestic workers lost
their jobs, accounting for 11.2% of total employment loss despite representing just 6% of the pre-
pandemic employed. More than half a million (530 000) other less-skilled workers lost their jobs,
including farm labourers, manufacturing labourers, helpers and cleaners in offices and hotels, and
street food vendors. Amongst the semi-skilled, shares of total job loss by occupation largely followed
pre-pandemic employment shares. The notable exception is craft workers (for example, bricklayers,
motor vehicle mechanics, and building electricians) who alone accounted for 20% of total employment
loss despite representing just 12% of pre-pandemic employment.

The inability for many to participate in the labour market due to the lockdown policy resulted in many
of the previously employed and jobseekers to shift into inactivity. Nearly one in every four (22.05%)
of those who were employed in 2020Q1 were no longer employed in the following quarter, with most
(16.14%) becoming economically inactive. More than half (55%) of the searching unemployed in
2020Q1 became inactive the next quarter. By exploiting the longitudinal nature of the 2020 QLFS data
due to the change in survey mode, we examine the conditional correlates of transitioning into various
labour market states through the use of multivariate linear probability models (LPMs) by regressing
select dependent variables on a vector of pre-pandemic demographic and labour market
characteristics. We present the results of these models visually in several coefficient plots in Figure 5,
while the complete results are presented in Table A1 in the Appendix. Our results confirm much of
our prior descriptive analysis but provide a more in-depth account of the dynamics of the South
African labour market during the beginning of the pandemic. Broadly, the pandemic
disproportionately affected workers in the informal sector, the youth, and those with lower levels of
formal education, whereas union members and public sector workers exhibit a notable extent of job
protection.

Specifically, our estimates suggest that those employed in the informal sector were significantly more
likely to become unemployed, whereas those less likely to experience such a transition include
women, older individuals, White relative to African/Black individuals, and those whose contract is of
a permanent nature. We observe no significant variation in the probability of transitioning from
employment to unemployment by industry or occupation. Notably, those working in the public sector
were significantly less likely to transition from employment to either unemployment or inactivity.
Considering the latter transition, women were more likely to become inactive after being employed
(as opposed to becoming unemployed, as observed above), in addition to those with less than a
complete secondary education, union non-members, and those with verbal employment contracts.
Youth were also more likely to experience an employment-inactivity transition relative to older
individuals.

 12
COVID-19 and the labour market:
 Estimating the employment effects of South Africa’s national lockdown

Figure 5: Coefficient plots of conditional probabilities of transitioning between labour market
statuses, 2020Q1-2020Q2

Source: QLFS 2020Q1 and 2020Q2 (StatsSA, 2020a and 2020b). Authors’ own calculations.
Notes: [1] Sample restricted to working-age population (15 to 64 years). [2] All estimates weighted using relevant bias-adjusted weights for
2020Q2. [3] Estimates obtained by regressing select labour market status transitions from 2020Q1 to 2020Q2 on a vector of observable
covariates in 2020Q1. Estimates as per models (2), (4), and (5), with full results presented in Table A1. [4] 90% confidence intervals presented
as capped spikes. [5] Reference groups = 15–34, African/Black, Married, Primary education or less, Western Cape, Limited job duration, Union
member, Firm size = 1 employee, Formal sector, Agriculture, Legislators.

3. Quasi-experimental results
We now turn to presenting our main results as per our PSM-DiD regression models. First, Table 3
presents the unweighted and weighted estimates of our treatment groups and outcome of interest –
employment – prior to and during the first three months of the national lockdown. 15 Employment
among both the treatment and control groups reduced substantially – by 13.6% on aggregate. This
observation that both groups experienced a reduction in employment is not a concern for our DiD
analysis given that this can be considered as a group ‘fixed effect’, which is controlled for in the model.
However, and notably, this contraction in employment was much more severe among the treatment
group which exhibited a reduction of 24.5% - a nearly 5 fives larger reduction than the control group
(4.9%). This simple between-group comparison over time is suggestive of a significant treatment effect
of the national lockdown, explored in more detail in our PSM-DiD regressions to follow.

15 The sample sizes in the treatment period are expectedly smaller given the reduction in the QLFS sample.

 13
DPRU WP202107

Table 3: Sample sizes and weighted estimates of treatment groups, by period

 Pre-lockdown (2020Q1) During lockdown (2020Q2)
 Treatment Control Total Treatment Control Total

 Observations (unweighted) 10 355 11 999 22 354 6 439 8 240 14 679
 Observations (weighted) 9 933 383 11 236 771 21 170 154 9 171 160 11 327 857 20 499 017
 Employed (unweighted) 7 471 9 572 17 043 3 770 6 231 10 001
 Employed (weighted) 7 293 494 9 088 427 16 381 921 5 508 271 8 639 945 14 148 215
Source: QLFS 2020Q1 and 2020Q2 (StatsSA, 2020a and 2020b). Authors’ own calculations.
Notes: [1] Sample restricted to working-age individuals (15-64 years). [2] Relevant estimates weighted using sampling weights.

3.1. Main results

Given the importance of the parallel trends assumption in identifying causal effects in a DiD design,
we estimate and present an event study plot to examine whether the treatment and control groups
were comparable on dynamics in the pre-treatment period. Including leads and lags in the DiD model
in this way allows one to check both the degree to which the post-treatment treatment effects were
dynamic, and whether the two groups were comparable on outcome dynamics pre-treatment
(Cunningham, 2020). We present the unconditional model coefficients and 95% confidence intervals
in Figure 6 to examine the parallel trends assumption prior to controlling for a vector of covariates,
individual FEs, and the matched sample. Firstly and importantly, all of the pre-treatment coefficients
are not statistically significant from zero, implying that individuals in the treatment group did not
statistically significantly differ from those in the control group on average. Secondly, post-treatment
the probability of employment decreases and is statistically significantly different from zero –
indicative of a significant treatment effect.

Figure 6: Event study plot of the unconditional effect of the lockdown on the probability of
employment

Source: QLFS 2016Q2, 2017Q2, 2018Q2, 2019Q2, 2020Q1, and 2020Q2 (StatsSA). Authors’ own calculations.
Notes: [1] Figure presents OLS coefficients of interaction terms of treatment and period from the DiD regression of the effect of the lockdown
on the probability of employment, without controlling for individual FEs or the vector of control variables. [2] Sample restricted to working-

 14
COVID-19 and the labour market:
 Estimating the employment effects of South Africa’s national lockdown

age population (15 to 64 years). [3] All estimates weighted using relevant sampling weights. [4] Standard errors clustered at the individual
level. [5] Capped spikes represent 95% confidence intervals. [6] Treatment group here excludes those who can work from home due to data
limitations in pre-treatment years.

We next present our main PSM-DiD estimates for the estimated effect of South Africa’s national
lockdown on the probability of employment in Table 4, where the coefficient of interest represents
the difference in employment probability between those permitted and not permitted to work from
before to during the national lockdown period. Our preferred model is (6) which is restricted to the
matched sample and controls for individual FEs and a vector of covariates. We estimate that those not
permitted to work (treatment) were 6.4 percentage points more likely to be employed prior to the
intervention on average. From before to after the onset of the lockdown, those permitted to work
exhibited a decrease in the probability of employment of 7.3 percentage points. Our main estimate of
interest – the DiD term – suggests that the lockdown decreased the probability of employment for
those not permitted to work by 8 percentage points relative to the control group, significant at the
1% level.

Table 4: Propensity score-matched difference-in-difference estimates of the effect of the lockdown
on employment

 Probability of employment
 Sample: Unmatched Matched
 (1) (2) (3) (4) (5) (6)

 -0.075*** -0.048*** 0.061*** -0.064*** -0.057*** 0.064***
 Treatment
 (0.007) (0.008) (0.013) (0.009) (0.010) (0.015)
 -0.084*** -0.079*** -0.065*** -0.089*** -0.092*** -0.073***
 Post
 (0.006) (0.009) (0.008) (0.010) (0.015) (0.014)
 -0.049*** -0.055*** -0.085*** -0.023 -0.025 -0.080***
 Treatment x Post
 (0.012) (0.012) (0.010) (0.017) (0.017) (0.012)

 0.809*** 0.135*** 0.170 0.959*** 0.056 -0.159
 Constant
 (0.005) (0.050) (0.299) (0.021) (0.104) (0.326)
 Controls N Y Y N Y Y
 Fixed effects N N Y N N Y

 Observations 37 033 36 583 27 303 22 328 22 278 15 576
 Adjusted R2 0.020 0.104 0.081 0.020 0.100 0.097
Source: QLFS 2020Q1 and 2020Q2 (StatsSA, 2020a and 2020b). Authors’ own calculations.
Notes: [1] Sample restricted to working-age population (15 to 64 years). [2] All estimates weighted using relevant inverse probability weights.
[3] Standard errors clustered at the individual level.

In Table 5, we analyse how the treatment effect varies by lockdown level, hypothesising that the effect
will be larger during more stringent lockdown levels where a larger group of workers were not
permitted to work (for instance, level 5) relative to more lenient levels (level 3). When we disaggregate
treatment by lockdown level, 16 we find (as expected) that the estimated effect is larger for more
stringent lockdown levels: those not permitted to work in level 5 were 9.3 percentage points less likely
to be employed during the lockdown relative to the control group, while for level 4 this decreases to
7.8 percentage points. We find no significant effect on differential employment probabilities during
level 3. This latter null result may be driven by the fact that most individuals in our sample were
permitted to work in level 3. On the other hand, the latter estimation relied on a particular small,
matched sample due to a small treatment group. As such, we do not consider this estimate reliable
considering the small sample size.

16 We do so by only including individuals in the treatment group for a given lockdown level if they were not permitted to work in the lockdown

level and they were interviewed during the lockdown level.

 15
DPRU WP202107

Table 5: Propensity score-matched difference-in-difference estimates of the effect of the lockdown
on employment, by lockdown level
 Sample: Matched
 Lockdown level: Overall Level 5 Level 4 Level 3
 (1) (2) (3) (4)

 0.064*** 0.012 0.208* 0.197
 Treatment
 (0.015) (0.038) (0.116) (0.221)
 -0.073*** -0.058*** -0.046 -0.176*
 Post
 (0.014) (0.016) (0.029) (0.092)
 -0.080*** -0.093*** -0.078** -0.021
 Treatment x Post
 (0.012) (0.022) (0.032) (0.123)

 -0.159 0.637 0.369 -4.826
 Constant
 (0.326) (0.496) (1.011) (5.346)
 Controls Y Y Y Y
 Fixed effects Y Y Y Y

 Observations 15 576 10 752 7 328 642
 Adjusted R2 0.097 0.125 0.110 0.390
Source: QLFS 2020Q1 and 2020Q2 (StatsSA, 2020a and 2020b). Authors’ own calculations.
Notes: [1] Sample restricted to working-age population (15 to 64 years). [2] All estimates weighted using relevant inverse probability weights.
[3] Standard errors clustered at the individual level.

3.2. Effect heterogeneity: Triple difference-in-differences estimates

The above estimated effect ought to be interpreted as an average treatment effect on the treated
(ATT); however, it is plausible that this effect varies between different groups of workers, particularly
among those in more vulnerable labour market positions. To investigate possible heterogeneity, we
re-estimate our above PSM-DiD model by interacting the DiD term with binary variables for specific
vulnerable sub-groups using triple difference-in-difference models. 17 The results of these models for
select sub-groups of individuals are presented in Table 6.

We find statistically significant, negative effects for two distinct groups: individuals living in urban
areas versus those in rural areas, and own-account workers versus employees. We estimate a
particularly large effect for the latter group. Specifically, our estimates suggest that the national
lockdown decreased the probability of employment for those who live in urban areas and were not
permitted to work by 5.3 percentage points relative to the control group. Amongst own-account
workers, the relative effect was a reduction in the probability of employment by 22.4 percentage
points – an effect nearly three times larger compared to the ATT of eight percentage points observed
above. 18 We do not find any evidence of variation in effects by sex, age, education, or skill level.
Importantly, given that the vast majority of own-account workers work in the informal sector (86.4%
of own-account workers, or 1.4 million workers as of 2020Q1), this result is arguably indicative of the
disproportionate effect of the lockdown on informal sector workers – in line with our descriptive
analysis in Section 2. 19 What this suggests is that, while the ostensible disproportionate effects
amongst other vulnerable groups (the youth, less-educated, and less-skilled) seem to be muted in
these conditional estimates, working in the informal sector seems to be a key determinant of not
being employed during the lockdown period.

17 Also referred to as difference-in-difference-in-difference (DiDiD) models.
18 Importantly, these effects by group (i.e. for urban individuals and own-account workers) do not imply that only these groups were affected
by the lockdown, but rather that the effects relevant to them are statistically significantly different relative to their counterparts (i.e. non-
urban individuals and non-own-account workers).
19 The informal sector here includes workers in private households. As opposed to own-account workers, we are unable to estimate a triple

DiD effect for an explicit informal sector group of workers, given that only the employed were asked the relevant question in the QLFS.

 16
COVID-19 and the labour market:
 Estimating the employment effects of South Africa’s national lockdown

Table 6: Propensity score-matched triple difference-in-difference estimates
 Completed
 Own account Low-skill
 Group: Male Urban Youth secondary or
 worker worker
 more

 0.064** 0.074* 0.069*** 0.056*** 0.060*** 0.082***
 Treatment
 (0.031) (0.042) (0.018) (0.020) (0.020) (0.023)
 -0.105*** -0.074*** -0.065*** -0.069*** -0.074*** -0.063***
 Post
 (0.023) (0.024) (0.014) (0.016) (0.014) (0.015)
 -0.049** -0.033 -0.076*** -0.099*** -0.053*** -0.084***
 Treatment x Post
 (0.024) (0.027) (0.017) (0.020) (0.015) (0.018)
 0.002 -0.015 -0.023 0.128*** 0.034
 Group n. e.
 (0.060) (0.050) (0.033) (0.048) (0.028)
 0.000 -0.012 -0.010 0.025 0.049 -0.051*
 Treatment x Group
 (0.035) (0.043) (0.035) (0.030) (0.057) (0.030)
 0.046** 0.000 -0.025 -0.007 -0.009 -0.037
 Post x Group
 (0.021) (0.026) (0.024) (0.021) (0.038) (0.023)
 -0.036 -0.053* 0.010 0.042 -0.224*** 0.038
 Treatment x Post x Group
 (0.030) (0.032) (0.033) (0.030) (0.075) (0.035)

 -0.168 -0.169 0.726*** -0.202 -0.144 -0.181
 Constant
 (0.354) (0.350) (0.084) (0.348) (0.345) (0.343)
 Controls Y Y Y Y Y Y
 Fixed effects Y Y Y Y Y Y

 Observations 15 576 15 576 15 576 15 576 15 576 15 576
 Adjusted R2 0.096 0.095 0.092 0.095 0.098 0.094
Source: QLFS 2020Q1 and 2020Q2 (StatsSA, 2020a and 2020b). Authors’ own calculations.
Notes: [1] Sample restricted to working-age population (15 to 64 years). [2] All estimates weighted using relevant inverse probability weights.
[3] Standard errors clustered at the individual level. [4] n.e. = not estimated. [5] All models estimated on the matched sample.

3.3. Robustness tests

In this section, we conduct several robustness tests to examine the sensitivity of our results to
alternative (i) control group definitions, (ii) ‘limited capacity industry’ assumptions, and (iii)
employment definitions. Regarding (i), in our main results our treatment group consistently consists
of individuals legally not permitted to work during a given lockdown level at the time they were
interviewed, and the control group consists of individuals who were legally permitted to work, as well
as anyone able to work during the lockdown (measured by working in the public sector or from home).
Here we re-estimate our PSM-DiD models to examine the implications of including the latter two
groups of workers in the control group. Regarding (ii), in our main results we assume that individuals
were permitted to work if their industry’s legislated capacity was equal to, or exceeded, 50%, and not
otherwise. This is an arbitrary threshold and has implications for who is included in our control group,
thus influencing our results. To examine the sensitivity of our results to this assumption, we re-
estimate our PSM-DiD models using several alternative threshold assumptions to assign relevant
individuals to the control group, as outlined in Table A3 in the appendix. 20

Regarding (iii), our use of the conventional definition of employment as per ILO standards may not be
the most appropriate in the lockdown context. As discussed by Ranchhod and Daniels (2020), under
the conventional definition, the employed includes those workers temporarily absent from work. In
usual circumstances this group constitutes a small proportion of the employed (less than a percent in

20 Table A3 presents the four alternative assumptions we make, and their implications for our treatment-group samples. Under a ‘very

progressive’ assumption, we assign individuals to the control group if any proportion of their industry was permitted to work. As expected,
this results in the relatively largest control group of 31 500 observations. Under the ‘very conservative’ assumption, we assign individuals to
the control group only if 100% of their industry was permitted to work. This results in a much larger treatment group and smaller control
group. Intuitively, moving from ‘very progressive’ to ‘very conservative’ increases (decreases) the size of our treatment (control) group. Our
main results – which use the ‘50%’ assumption – can be regarded as moderate in this regard.

 17
You can also read