Budget Outlook for 2020-2024 - City of Vancouver
←
→
Page content transcription
If your browser does not render page correctly, please read the page content below
Budget Outlook for 2020–2024
2020 – 2024 Budget Outook

lights of City services..................................................................................................................... pg 7

                                        CONTENTS
ncing affordability with quality
rvices and programs...................................................................................................................... pg 8
 Budget overview ............................................................................................................................ pg 9
                          Preparing for the 2020-2024 Financial Planning & Budget Cycle..........................................2
 - 2023 Looking ahead ................................................................................................................. pg 11
                          Budget 2020 Priorities ..................................................................................................................................3
                                        Fiscal Capacity ..................................................................................................................................................4
                                        Economic Context ...........................................................................................................................................8
                                        Balancing Affordability - Property Tax and Small Business ......................................................9
                                        Business Transformation and Continuous Process Improvement ..........................................11
                                        Highlights of City Services Delivered Last Year ...............................................................................12
                                        Operating Budget ..........................................................................................................................................13
                                        Capital Planning and Budgeting .............................................................................................................22
                                        Operating and Capital Budget Risks 2020-2024 ............................................................................26
                                        Summary ..............................................................................................................................................................27

                                        PREPARING FOR THE
                                        2020-2024 FINANCIAL
                                        PLANNING & BUDGET CYCLE
                                        Each year the City of Vancouver prepares a Budget Outlook as a preview to start the annual City
                                        budgeting process. Through the budgeting process the City prepares an annual budget, including an
                                        operating and a capital budget, within the context of its five-year financial plan and four-year capital
                                        plan.

                                        In the spring and early summer, City staff prepares and presents the Budget Outlook to City Council,
                                        including a review of the external and internal factors that can influence the City’s financial plans. This
                                        includes considerations like the economy, increased costs related to negotiated labour agreements and
                                        other pressures and challenges, such as the Employer Health Tax, impacting the cost to run our city.

                                        The vast majority of the City’s annual budget goes towards funding of existing, core services — things
                                        like libraries, policing, fire and rescue services, utilities including water and sewer, facilities such as
                                        recreation centres, and other city infrastructure.

                                        The City engages with the public through the annual Civic Service Satisfaction Survey for their feedback
                                        on how we are doing at delivering core services to our residents and businesses. We also use this survey
                                        to identify any service issues or other factors that impact the perception of Vancouver as a livable city
                                        with good quality of life.

                                        The 2019 survey results tell us that overall satisfaction with City services continues to be positive and
                                        that a large majority of both residents and businesses say they are getting good value for their tax
                                        dollars. The full report is posted on the City’s web site.

                                        There is always room for improvement, especially as our city continues to grow and change. City staff
                                        continually looks for innovative ways — including the use of new technology and more efficient ways of
                                        working — to improve the quality of services that can be delivered within existing, available funding.

                                                                                                                                             2
2020 – 2024 Budget Outook
BUDGET 2020 PRIORITIES
The Budget Outlook includes City Council’s priorities for alignment of spending for Budget 2020, both in
terms of ongoing work, and for new projects and initiatives in response to Council motions and direction.
The primary priority is to maintain and improve the core services that meet the needs of residents. Four
additional priorities will also guide City staff’s development of departmental service plans and budgets.
City staff will review current strategies and programs to confirm the alignment of both existing, and new,
programs and initiatives to the priorities of this new Council.
Deliver Quality Core Services that Meet Residents’ Needs
Address Protect and Build Increase Focus Accelerate Action
Affordability and our Economy on Diversity and on Climate Change
the Housing Crisis Critical Social Issues
Between now and presentation of the draft budget to Council in late fall, the City will embark on its
annual public engagement process for the budget. Starting in mid-August, the public will have multiple
opportunities — online, in person, in workshops, etc. — to share with City Council and City staff their
thoughts on how we build the budget, as well as their own priorities for the services and programs we
should fund more, or less. Check for details at vancouver.ca/budget later this summer.
32020 – 2024 Budget Outook
FISCAL CAPACITY
Vancouver, like other Canadian cities, offers a broad range of services but has limited revenue sources.
The City adheres to prudent fiscal stewardship with careful financial planning that balances short-term
operating needs with long-term public amenity and infrastructure requirements. The City’s financial
planning process is guided by a set of financial sustainability guiding principles and financial health
targets.
I. Financial Sustainability Guiding Principles
Fiscal Prudence
• Live within our means
• Consider long-term implications in all decisions
• Maintain a stable and predictable revenue stream
• Keep debt at a manageable level
• Build in flexibility and contingencies for emerging priorities and opportunities
Affordability and Cost Effectiveness
• Deliver services that are relevant and result in desired public outcomes
• Ensure value for money through productivity and innovation
• Keep property tax and user fees affordable and competitive
Asset Management
• Maintain assets in state of good repair
• Optimize operating and capital investments to meet public and economic needs while achieving
value for the investment
II. Funding Strategy for Capital Investments
The City takes a comprehensive approach to assessing the short- and long-term economic indicators to
inform the development of the Capital Plan. The City funds capital investments from a range of sources
(who pays) using a balanced mix of payment methods (when to pay). Throughout the 4 yeas, the Capital
Plan is increased as additional funds are identified to undertake additional work.
Funding Sources
• Property Tax and User Fees - Operating revenues (e.g. property tax, water and sewer fees,
parking revenue) typically fund most capital work.
• Development Contributions - Consistent with the City’s Financing Growth Policy (2004), new
and expanded amenities and infrastructure to support growth are funded in part through
development contributions (e.g. DCLs, voluntary CACs, connection charges).
CACs are voluntary public benefit contributions offered by a rezoning applicant to address the
impacts of rezoning. Allocation of CACs by the City is generally guided by Community Plans
42020 – 2024 Budget Outook
and Public Benefit Strategies, and applicable Council policies in areas such as housing, childcare,
cultural and heritage. CACs typically come in two forms: in-kind onsite amenity and cash
contributions.
• Partner Contributions - The City receives funding from provincial and federal governments,
from TransLink for road work, and from non-profit agencies, foundations and philanthropists
particularly in the area of childcare and affordable housing.
Payment Methods
• Pay In Advance: Capital reserves are like savings accounts, used to accumulate funds from
current revenues or other sources over time to fund future capital investments. This method
is typically used when other partners are involved and the City wishes to make clear its own
commitment is protected. In other cases, the commitment is made as part of a community
planning process and funded through development fees, while the timing of the project may not
occur for a significant period of time.
• Pay-as-you-go: The City uses current revenues, user fees and other sources to fund capital
investments. Pay-as-you-go is also used for some of the City’s utility renewal — such as water
infrastructure — that all taxpayers benefit from. This method enables residents and businesses
to contribute on an ongoing basis to capital investments which are fundamental to the health of
the city; and ensures the City’s borrowing capacity is preserved for important, one-off capital
investments that are not appropriate or are too costly to be funded on a pay-as-you-go basis.
• Pay Over Time: Like most major Canadian cities and senior levels of government, the City uses
debt in its mix of payment methods to fund capital investments, allowing payment to be made
over a longer timeframe to align with the useful life of the underlying capital assets. This ensures
that more residents and businesses that benefit from the capital investments participate in
paying for them. When used strategically, paid back within 10 years (much shorter than a typical
mortgage and the average lifecycle of a capital asset), and within best practices for responsible
borrowing, debt financing allows the City to continue to renew its infrastructure on a regular basis
and provide new amenities when necessary to accommodate growth, while maintaining its fiscal
health.
The City takes a very careful approach to its use of debt, funding repayment over 10 years while
ensuring a balanced operating budget and keeping property tax and fees at an affordable level.
The City’s consistently strong credit ratings and favorable borrowing rates reflect this careful
approach.
III. Long-term Financial Plan
When developing its long-term financial plan, the City has maintained a commitment to strong financial
discipline and continued management of debt to ensure that operating and capital investments will not
unduly burden the Operating Budget through debt servicing, operating costs and asset lifecycle costs.
Both Moody’s and Standard & Poor’s credit rating agencies have acknowledged the City’s efforts by
awarding it with the highest credit rating.
Keep Debt at a Manageable Level
The City determines its long-term borrowing capacity for regular, non-utility related capital programs
by limiting the ratio of annual debt servicing to operating expenditures at a maximum of 10%. This is to
ensure that the City does not accumulate debt at unacceptable levels, and that annual debt servicing
does not put undue pressure on the annual budget.
As part of our long-term debt management strategy, the water utility has transitioned its infrastructure
lifecycle replacement programs from debt financing to pay-as-you-go. This will help lower the City’s
overall debt and save interest costs over the long term. Looking ahead, we will continue to explore
52020 – 2024 Budget Outook
opportunities, where appropriate, to transition our general capital program and the sewer utility to a
higher proportion of pay-as-you-go to improve the City’s long-term debt profile and maintain our credit
ratings.
Maintain Strong Credit Ratings and Access to
Low Borrowing Costs
The City’s strong credit ratings (Aaa/AAA) are WHEN DEVELOPING ITS
among the best for Canadian cities and are
supported by a diverse economy and a strong LONG-TERM FINANCIAL
and stable tax base. Continued management
of debt within target levels is critical to PLAN, THE CITY
maintaining and enhancing the City’s credit
ratings. A strong credit rating reflects the HAS MAINTAINED A
City’s financial management and its capacity to
adjust to changes in the financial environment. COMMITMENT TO STRONG
It is estimated that long-term borrowing costs
would increase by 5-10 basis points for each FINANCIAL DISCIPLINE
level of downgrade, or approximately $1 million
in additional interest over the term of each AND CONTINUED
$100 million debenture issue.
MANAGEMENT OF DEBT
Keep Property Tax and Fees Affordable and
Competitive
Property taxes in recent years have seen a
modest increase — ranging from 1.4% to 4.3%
— in line with most other Metro Vancouver municipalities. During this period, the City has enhanced
our network of public amenities in the areas of housing, community services and public safety, and has
invested in core infrastructure, such as sewer separation and renewal and upgrading transportation
infrastructure for pedestrians, bicycles, and vehicles. All these were accomplished through continuous
innovation, business transformation and productivity enhancement, while absorbing above-inflation
wage increases.
Looking ahead, the growing need for asset renewal and new infrastructure and amenities to support
growth will put further pressure on the City’s budget. Understanding the long-term impacts on our
tax and fee payers arising from both our operating and capital investment decisions, including debt
servicing, ongoing operating costs and asset lifecycle costs, was a key consideration in developing the
2019-2022 Capital Plan.
Maintain Assets in State of Good Repair
Maintaining core infrastructure and amenities in a state of good repair is critical to the City’s long-term
financial health and resilience, and helps ensure asset management obligations are not deferred and
infrastructure deficits do not accumulate to unacceptable levels — one of the key factors that credit
rating agencies consider as part of rating reviews. The City has developed service-centric facilities asset
management, which ensures that the City’s core service needs direct and inform long- and short-term
decisions for new space and existing spaces, including redevelopment, retrofits, and level of investment
in capital maintenance.
Optimize Facilities Investments
Before adding new facilities, the City will consider optimizing partnerships with other levels of
government, non-profits and private partners, as well as repurposing and right-sizing existing facilities,
and continue to advance on co-location and functional integration of services to enhance operational
efficiency. All new facilities will be designed with flexible, adaptable, and expandable spaces to
accommodate changing demographics and future growth.
62020 – 2024 Budget Outook
IV. Financial Health Indicators
For long-term financial planning purposes, the City tracks a number of metrics to provide an indication
of its financial health and long-term borrowing capacity, which inform both the operating and capital
planning process. Below are two key financial health metrics and trends over the next decade:
Debt Servicing as % of Operating Revenue Net Debt per Capita
14% 1,200
1,100
12%
1,000
900
10%
800
Net debt per capita ($)
8% 700
600
History
6%
500
Forecast
400 Capital plan debt per capita, net
4% Upper Benchmark
300 Forecast
2% 200
100
0%
0
20
20
20
20
20
20
20
20
20
20
20
20
20
25
10
15
00
05
20
25
10
15
00
05
In developing the Capital Plan, a key constraining factor is the impact on the operating budget and
property tax increase arising from debt servicing and pay-as-you-go funding to support the capital
program, as well as future operating costs and asset lifecycle costs. Our goal is to stabilize the debt
level over the long term and minimize the year-over-year budget impact driven by our capital program,
thereby maintaining our property tax and user fees at affordable and competitive levels.
Through our proactive debt management strategy over the last decade, including the transition of the
City’s water utility from debt financing to pay-as-you-go, we have created room in our debt capacity to
accelerate the asset renewal program. It is expected that the Capital Plan will continue to grow over the
next decade as our infrastructure ages.
The projected growth in net debt per capita reflects a thoughtful, gradual increase in both operating
and capital investments to renew and upgrade our infrastructure and amenities. The trajectory could
reverse should future Councils choose to transition more capital work from debt financing to pay-as-
you-go sooner. Lowering debt financing would achieve long-term interest savings, but result in higher
property tax, utility rates and fee impacts during transition years. The City will continue to monitor and
adjust our financial strategy to strike a balance between debt financing and pay-as-you-go.
72020 – 2024 Budget Outook
ECONOMIC CONTEXT
When developing our financial plans, the City considers global, regional, and local economic factors.
Understanding these constantly changing factors allows the City to manage near-term risks and
uncertainties, while also planning for long-term financial resilience and sustainability.
Metro Vancouver’s economy is forecast by the Conference Board of Canada to be moderate, from
an average growth of 3.8% between 2015 and 2018, to 2.3% in 2019 and 2.4% in 2020. Employment
growth is anticipated to pick up to from 1.8% in 2018 to 2.1% for 2019 before slowing in 2020 to 1.0%.
The Unemployment rate is forecast to rise from a recent low of 4.3% in 2018 to 4.6% for 2019 before
stabilizing to an average of 4.4% through 2023. Inflation for the region is forecast to stabilize at 2.0%
through 2023 after higher inflation in recent years including 2.9% for 2018.
Projected Real GDP Growth 2020–2023
GDP growth in Vancouver is forecast to be among the fastest growing of
the metropolitan areas in the country
3.0%
2.5% 2.5%
2.5%
2.3% 2.3%
2.2% 2.2%
2.1%
2.0%
2.0% 1.9% 1.9% 1.9%
1.6% 1.6%
1.5%
1.0%
0.5%
0.0%
Mo
Qu
W
Ot
Ha
Vi
Re
Ha
Sa
Va
Ed
Ca
To
cto
inn
sk
taw
ro
gin
lga
nc
mo
mi
lifa
eb
nt
ato
nt
o
rea
lto
ipe
ria
ec
x
ry
a
n
a-G
uv
o
to
n
on
l
g
Ci
er
n
ati
ty
ne
au
82020 – 2024 Budget Outook
BALANCING AFFORDABILITY
– PROPERTY TAX AND
SMALL BUSINESS
The City strives to balance the affordability and competitiveness of property taxes, utility fees, and user
fees while sustaining the breadth and quality of public amenities, infrastructure, and services available
to businesses and residents. While increasing numbers of businesses and residents add to Vancouver’s
economic and social vitality, there is in turn a growing demand for services. By transforming the way
services are delivered, the City has maintained or increased its services, and demonstrated leadership
as a sustainable and livable city with budgets defined by modest tax and fee increases relative to other
Metro Vancouver municipalities.
When compared to other major Metro Vancouver municipalities, in 2018 Vancouver’s business tax rate
(un-averaged) was among the lowest ($4.61 per $1,000), its business tax rate ratio (un-averaged) was
the most improved (3.82 in 2018 from 4.93 in 2001), its commercial building permit value was the highest
($1.8B), and its commercial assessment base increased the most (407% since 2001).
In April 2019, Council approved a 2% tax shift ($15.8 million) from non-residential properties (Classes 2,
4, 5 and 6) to residential properties (Classes 1, 8 and 9) over three years, at a rate of 1% in 2019, 0.5% in
2020 and 0.5% in 2021. Incorporating the 1% tax shift in 2019 would achieve a tax share of approximately
55.9% residential and 44.1% non-residential. Vancouver’s business tax rate (un-averaged) has reduced
to $3.99 per $1,000 (2018: $4.61 per $1,000) and its business tax rate ratio (un-averaged) has reduced
significantly to 3.05 (2018: 3.82). While the tax shift intends to support the business sector, it does
increase the tax burden for residential taxpayers, including rental and social housing.
2019 Preliminary Combined Municipal Property Tax
and Utility Fees for Median Single-Family Home ($)
District of West Vancouver 6,023
City of White Rock 4,422
City of New Westminster 4,393
City of Port Moody 4,389
District of North Vancouver 4,362
City of Surrey 4,051
City of Richmond 3,931
Average 3,903
City of Vancouver 3,852
City of Coquitlam 3,768
City of North Vancouver 3,662
City of Burnaby 3,499
Corporation of Delta 3,440
City of Maple Ridge 3,410
Township of Langley 3,377
City of Pitt Meadows 3,366
City of Port Coquitlam 3,309
City of Langley 3,097
0 1,000 2,000 3,000 4,000 5,000 6,000 7,000
92020 – 2024 Budget Outook
In recent years, the influx of investment capital
and speculative real estate demand in Vancouver
has continued to drive up land values, resulting THE CITY DOES NOT
in significant volatility year-over-year in property
assessments and the resulting taxes, causing GENERATE HIGHER TAX
hardship for some residents and small businesses.
In British Columbia, the majority of real estate REVENUE AS A RESULT
properties are assessed at their highest and best
use (market value), and taxes are allocated to OF RISING PROPERTY
individual properties based on such values. In
the case where a property is under-developed, VALUES
its assessed value could substantially increase to
reflect the value of its development potential.
The City does not generate higher tax revenue
as a result of rising property values. The required tax levy to be collected is determined by Council as
part of the annual budget, and tax rates are lowered to offset assessment increases. However, relative
assessment increases for individual properties do shift the tax burden from one property to another in
any given year.
The challenge is particularly prevalent for small business tenants, as most landlords pass on all
property taxes, on both rented space and development potential, to tenants through their triple net
lease agreements. As tenants do not benefit from an increase in property values in the same way that
an owner does upon redevelopment or sale, the practice could cause significant financial distress for
small business and not-for-profit tenants who have very limited ability to absorb and/or finance such an
unanticipated surge in expenses during their lease term (typically five years or longer).
While there are a number of Provincial mitigations available for eligible residential properties (e.g. s19(8)
of the Assessment Act, Property Tax Deferment and Home Owner Grant), those measures do not apply
to commercial properties. Land assessment averaging is an optional tool available to Council under
the Vancouver Charter. However, this program alone may not be adequate in addressing assessment
volatility arising from development potential.
An Inter-governmental Working Group was established in November 2018 to identify viable policy
tools to provide targeted and time-limited tax relief to properties that are impacted by assessment
volatility arising from development potential. It is comprised of Provincial staff from the Ministry of
Municipal Affairs & Housing, the Ministry of Finance, BC Assessment, City of Vancouver, and other Metro
Vancouver municipalities. A key recommendation that is under consideration by the Province is splitting
the “development potential” value from the “existing use” value for under-developed properties (“Split
Assessment”), and creation of a commercial sub-class to capture the “development potential” value.
With the new sub-class, City Council could define eligible properties for Split Assessment, set a lower
tax rate (compared to commercial) for the development potential, and limit the duration of such tax
relief. With support from the Province, Split Assessment could provide the most targeted and time-
limited tax relief to small businesses and not-for-profits currently residing in under-developed properties
in neighborhoods that are experiencing a significant pace of change.
102020 – 2024 Budget Outook
BUSINESS TRANSFORMATION
AND CONTINUOUS PROCESS
IMPROVEMENT
Over the years, the City has continued to look at opportunities to improve processes and evolve our
service delivery models to improve the quality and efficiency of our services. For example, in 2009,
the City began the 3-1-1 operation which provided a single point-of-access to City information and
non-emergency services. Also in 2009, the Vancouver Services Review (VSR) was launched by City
Council to implement a comprehensive core services review. The program achieved cost savings and
reduced redundancy through shared services consolidation in key support services such as Information
Technology, Accounting, Finance, Supply Chain Management, Communications and Facilities Management.
Transformational projects such as the Digital Strategy, multi-family organics and integrated recycling,
electronic pay notification, the One Card, the capital outlook, bylaw adjudication, online permits,
and comprehensive budget and service planning are examples of major transformations and smaller
improvement projects that resulted in significant cost savings and improvements to City services.
The City’s Continuous Process Improvement program (CPI) was established in 2016. The CPI program is
designed to embed a culture of continuous process improvement across the City by assisting departments
in applying best practices in process optimization. CPI utilizes Lean and Six Sigma principles to streamline
processes and eliminate activities that do not add value to the end user, thus achieving improved value for
money for taxpayers. The benefits from these projects increase the City’s capacity to better serve our user
without adding resources, and decrease the time required to complete key processes.
In 2017 and 2018, the CPI program, which was implemented by teams across City departments, had a
cumulative impact of approximately $4M toward operating savings, addressing cost escalations, and
revenue and capacity increases. Some of the projects that were implemented included:
• Finance, Risk and Supply Chain Management - Increasing investment revenue through Cash
Management Optimization
• Park Board - Operating savings through operational improvements in Recreation and Parks;
improved recognition of Rink Rental revenue through process optimization
• Real Estate & Facilities Mgmt. - Operating savings through optimization of Commercial Lease
Management
• Engineering - $2.6M reduction in Sewer Connection program deficit and increased staff capacity to
improve client service delivery levels
• Capacity & Customer Services Improvements equivalent to over 6,000 person days/year and
reduced the time customers had to wait for City services by 105,000 days. Engineering Services
alone saved 99,000 days in client wait time, as a direct result of Engineering improvement projects.
For 2019, the CPI program is looking at a broad range of projects which will improve service levels for
users as well as generate operating savings, revenue and capacity increases, address cost escalations,
and generate customer service improvements. In 2019, over 35 projects are underway or planned, such as
improving procurement processes for affordable housing projects, and projects specific to Engineering
Services that will focus on finding improvements in wait times for utility connection permits, improving
garbage collections, improving the residential parking permit process, and further improvements to permit
review processes to ensure a full cost recovery model.
In development of the 2020-2024 service plans and budget over the next few months, departments will
look at these improvements to build capacity to absorb additional volumes, cost pressures and new work
aligned to Council priorities.
112020 – 2024 Budget Outook
HIGHLIGHTS OF CITY SERVICES
DELIVERED LAST YEAR
4,502 City-facilitated
childcare spaces
(cumulative)
3,640 5,180 people received
1,489 km 35,714 cumulative
homelessness services
water mains tonnes garbage social and
maintained collected* 1,853 cumulative
supportive purpose-built rental
2,136 km 48,216 housing units
committed**
units committed**
sewer mains tonnes compostables
maintained collected*
75% 6.4M 3,000
landfill gas collected in-person library visits street use
permits issued
11,200
on-street metered
3,432 tonnes littercan 6.9M online library visits (e.g. food trucks, spaces managed
waste collected patios)
2.4M items available
776,824
54,447 business licences issued 1,306 attendees at civic theatres
7,742 hectares of park space
134,763 maintained 830,633
building and development, square feet
building and
trades inspections
combined permit
20,021 trees planted community arts
and culture space
applications
65 rezoning 2.7M swim
applications received participants $13.3M grants to
cultural organizations
53,024 crimes reported; 770,753 calls made to 3-1-1
586 City-owned
on average, 1 crime every 71,660 VanConnect service buildings managed
9 minutes and 55 seconds requests
2,252 fires with damage 24% reduction in GHG
167 public engagement
22,936 safety inspections projects emissions from City-owned
36,901 medical incidents buildings (since 2007)
2,393 residents trained in 665 Freedom of Information Aaa/AAA 2018 credit rating
emergency preparedness requests received
2018 data displayed, unless otherwise indicated.
12 * City provides services primarily to single and multi-family
residential properties (4 or less dwelling units)
** Housing Vancouver Strategy (2018-2027)2020 – 2024 Budget Outook
OPERATING BUDGET
Operating budget revenues and expenditures for 2019: $1.513 billion
Property tax and utility fees for water, sewer and solid waste make up 75% of the revenue in the 2019
Budget. These revenue sources are highly predictable. The remaining 25% of revenues are more variable,
such as revenues from property development-related fees and permits.
In 2019, Vancouver’s property tax revenue increased by 5.05% (including the Council-directed
tax increase of 4.15% and additional taxes generated from new development of 0.9%). The City of
Vancouver’s preliminary combined 2019 municipal property tax and utility fees for a median single-family
home is in line with the regional average (among the municipalities that comprise Metro Vancouver).
Public safety accounts for 30% of the City’s operating expenditures and Engineering public works
and utilities expenditures (water, sewer, solid waste, neighbourhood energy) account for another
30%. Together, these services make up more than half of the City’s operating expenditures budget.
Community-related services, such as parks and recreation, libraries, community services and planning,
comprise 22% of the operating budget. Over the past 10 years, the City’s expenditures have increased
due to an increase in costs downloaded from senior levels of government (including policing DNA costs,
the Employer Health Tax, affordable housing, homelessness, etc.), collective agreement wage increases
higher than inflation for public safety, and Engineering utility costs primarily due to increases in regional
utilities costs and renewal of aging infrastructure.
Overall, salary and benefit costs represent the largest component of the City’s operating budget, at
58%. While utilities represent 23% of operating budget, approximately 50% of those costs are passed
on to the City directly by Metro Vancouver. A further 9% of the operating budget goes to interest and
debt payments for capital investments, as well as transfers to other funds and allocations. This includes
transfers to the Capital Fund which, along with development revenues and other external contributions,
funds the City’s capital investment. The remaining 22% of the operating budget goes to other non-salary
costs, including facilities costs, grant payments and equipment.
2019 OPERATING REVENUES
2019 Operating Revenues
($1,407.3 MILLION) 2019 Operating Expenditures
($1,513.5 Milion) by Service Area ($1,513.5 Milion)
11 4%
4%3 1 7%
21%
4% 7%
5% 2% 18% 30%
6% 2%
4%
22% 9%
55% 5%
30%
20% 9%
7% 23%
55% | Property Taxes PUBLIC SAFETY ENGINEERING & UTILITIES
21% | Police 23% | Utilities
20%| Utility Fees
9% | Fire 7% | Engineering
6% | Licence and Development Fees
Public Works
5% | Parking
4% | Program Fees CORPORATE SUPPORT COMMUNITY-RELATED SERVICES
7% | Corporate Support 9% | Parks & Recreation
4% | Cost Recoveries, Grants
and Donations 7% | Debt & Capital 5% | Community Services
(Non-Utility) 4% | Library
3% | Rental, Lease and Other
4% | Contingencies & 2% | Development,
1% | Bylaw Fines
Transfers Buildings & Licensing
1% | Revenue Sharing
2% | Planning, Urban Design
1% | Investment Income & Sustainability
132020 – 2024 Budget Outook
2020 OPERATING
MUNICIPALITIES ACROSS
BUDGET OUTLOOK
Looking toward 2020, the projected growth in
CANADA ARE FACING
revenues is fairly predictable and consistent with
prior years; however, wage cost increases, which THE CHALLENGE OF
are uncertain in 2020 and beyond, will be a key
factor in determining the City’s rate of expense COSTS RISING FASTER
growth. Keeping wage growth at levels affordable
to taxpayers will be an important part of THAN INFLATION
achieving a balanced five-year budget. Also, focus
on renewal of our infrastructure (streets, bridges,
water and sewer pipes, and community and civic
facilities) will require increased investment.
Through the first half of 2019, Council has provided direction to staff to begin work on a number of new
initiatives. As staff begin the work building the 2020 budget, the allocation of staff time and budget to
further these initiatives will require a combination of prioritization, efficiencies, identification of initiatives
to stop or defer, new revenue sources, and/or tax and fee increases.
Costs rising faster than inflation
Municipalities across Canada are facing the challenge of costs rising faster than inflation, as outlined
in a recent study by the Federation of Canadian Municipalities, experiencing a combination of several
pressures and trends:
• The growth of urban centers driven by changes to the economy and migration patterns and
the challenges faced by municipalities in relation to that growth, including the ongoing cost of
operating and maintaining new and expanded infrastructure and public amenities.
• The need for renewal of infrastructure that was built decades ago and is reaching end of life (as
noted in the Capital Plan). Regional utility charges passed on to the City by Metro Vancouver are
forecast to increase between 10% and 12% for water and between 2% and 6% for sewer annually
from 2020-2024, driven by major infrastructure investments.
• Significant market driven escalation in costs such as construction and technology.
• Downloading of responsibility for services that historically have been the responsibility of other
levels of government.
• Impacts of senior level policies on local conditions, such as income assistance rates, health system
responses to complex mental health issues, and homelessness response.
• Public safety wage increases higher than inflation. While this factor is dependent on future
collective agreement settlements, the national trend has been for growth above inflation.
Over the last 10 years, the City’s average tax increase has been below the average of Metro Vancouver
municipalities.
142020 – 2024 Budget Outook
Vancouver vs. Metro Vancouver 10-Year Average
Property Tax Increase (2010-2019)
5.00%
4.00%
3.00%
2.00%
1.00%
-W
-N
-P
- W Coq
-V
-N
-C
-N
-B
- R aby
-A
-D
-L
-P
- M Mea
-P
-S
-T
ur
an
or
ow y Ci
or
itt
oq
ur
ich
ew
elt
or
or
ap
an
v
es
hit
er
rey dy
t
n
tM
gle
th
th
uit
le
a
t V itlam Dist
mo
ns
co
eR
W
ag
Rid s
lam uve
hip
Va
Va
o
es
an
uv
nd
oc
o
e
do
u
t
nc
nc
co
ge
er
mi
of
k
ty
w
ou
o
u
ns
La
ve
ter
ve
ng
r
r
rC
ley
ity
ric
t
The outlook for 2020-2024 shows the potential of a significant gap between the growth in expenses
(significantly dependent on the terms of future collective agreement settlements) and growth in
revenues (of which property tax has been below the average for Metro Vancouver).
This trend—shared by all municipalities—will require continued improvements in the way services
are delivered in all areas of the City, including process improvements, information technology
transformation, and modernization of service delivery models to address the higher costs of labour,
facilities, and operations.
Collective agreements, other challenges and opportunities
Collective agreements
The City and related boards have negotiated collective agreements for all unions as represented by
Vancouver Firefighters Union, CUPE Local 15, CUPE Local 1004, IATSE, CUPE Local 391, International
Brotherhood of Electrical Workers Local 213, and Teamsters Local 31, which will expire at the end of
2019, adding uncertainty to the five-year financial plan.
The arbitrated settlement between Vancouver Police Union and Vancouver Police Board expired at
the end of 2018, and has not been finalized for 2019. As a result of arbitrated settlements expiring in
2019 for the Vancouver Firefighters Union, the final year of the settlement (2019) includes annual wage
increases of 2.5%, higher than the equivalent increase of 2% for civic unions for the same final year.
Given the magnitude of public safety wages relative to the rest of the City, the recent trend of public
safety wage increases above inflation will continue to put significant pressure on the City’s budget and
property tax rates.
152020 – 2024 Budget Outook
Compounded Annual Wage Increases
25%
20%
15%
10%
5%
0%
20
20
20
20
20
20
20
20
20
20
20
20
20
21
22
23
12
13
14
15
16
17
18
19
CPI 10.5% CUPE 12.4% POLICE 19.5% FIRE 18.9%
(2018–2022 forecast)
Other Challenges
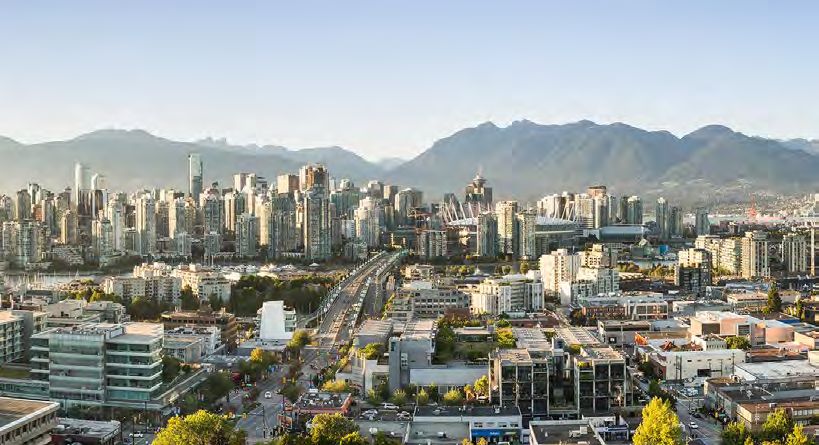
Vancouver is a rapidly growing city and the central hub of the Metro Vancouver region, serving as the
main financial district and offering a wide array of attractions. Over the past 10 years (2008-2018),
inflation-adjusted growth of operating expenditures is 29.1% due to costs downloaded from senior levels
of government, mitigating the gaps created by senior level responses to various social issues such as
mental health and homelessness crisis, collective agreements wage increases higher than inflation in the
public safety sector, costs of renewing aging infrastructure, and maintaining existing service levels to
meet the needs of a growing population. Examples of some of the challenges the City faces include:
• The opioid crisis – In 2017, Council approved $3.5 million to respond to this urgent crisis. In 2018,
additional investments of $0.3 million for opioid crisis response as well as $0.2 million for ongoing
micro cleaning grants were included. The 2018 budget also included an investment of $0.7 million
in a VPD Drug Containment Facility for safe and proper handling and processing of drug exhibits
that may be contaminated by fentanyl and/or other suspicious substances.
• Insufficient new affordable housing for low- to moderate-income individuals and families – In
2019, the City invested an additional $30 million in capital and $7.7 million in operating costs to
support housing needs and affordability.
There is also evidence of change in the income distribution in Vancouver that may suggest loss of renter
households at the lower end of the income spectrum. The share of renter households earning below
$30,000/year fell from 34% in 2005 to 28% in 2015, while the share of renter households earning over
$80,000/year increased from 13% to 28% in the same period. While rising median incomes may account
for some of this change, these trends indicate a risk to the long-term diversity and resilience of our City—
reinforcing the need to meet the Housing Vancouver objective to ensure the “right supply” of housing
that meets the needs of all incomes (Statistics Canada Census 2016 updated every five years).
• Deterioration of Single Room Occupancy (SRO) hotels and the aging social housing stock is
having a cumulative impact on homelessness, street disorder and related crisis response costs
at the municipal level. The City will pursue a multi-year partnership plan with the Province of BC
(primarily through BC Housing) and the Government of Canada (primarily through the Canada
Mortgage and Housing Commission) in order to clarify roles and responsibilities and mitigate the
risk of uncertain financing for social housing projects.
162020 – 2024 Budget Outook
• Affordability is contributing to severe challenges for vulnerable residents. A total of 2,233
individuals were identified as experiencing homeless in the 2019 Homeless Count (a 2% increase
since 2018). The number of sheltered individuals increased by 87 people, and the number of
unsheltered individuals decreased by 44 people between 2018 and 2019, with seniors and
Indigenous people overrepresented among individuals experiencing homeless compared to their
share of the overall population. Continued partnership with the Province for expanded investments
in provisional homelessness interventions will be important to keep this crisis from expanding.
• Inadequate access to treatment for people with serious mental health challenges and addictions
puts pressure on local services. There has been an 88% increase in mental health-related
emergency room visits between fiscal year 2009/2010 and fiscal year 2018/2019 with 4,811
Mental Health Act Apprehensions in 2018. The Vancouver Police Department provides significant
resources to respond to these emergencies, and there is a need to ensure that appropriate
treatments are available to those in need before an emergency occurs.
• The Provincial government increased income assistance rates on October 1, 2017 and then on
April 1, 2019. However, the rates have not increased significantly in 20 years, despite substantial
increases in rents over this period, increasing the risk of homelessness and requiring investment in
support services to provide housing options for people with mental illnesses, drug addiction and
other issues.
• Existing rental stock is aging, requiring upgrades and refurbishment, with potential displacement
of long-term tenants who are not able to afford new market housing.
• The decision by the RCMP and Provincial government to limit the financial contribution for the cost
of DNA analysis services resulted in costs downloaded to municipalities, including Vancouver.
• In 2018, the target of adding 1,000 new childcare spaces from the Capital Plan for 2015-2018
has been surpassed. However, the availability of childcare spaces continues to be well below the
number needed to meet current demand. The City’s Capital Plan for 2019-2022 includes creating
1,000 new spaces for children between 0-12 years to ensure more children have access to quality
childcare, a key goal under Vancouver’s Healthy City Strategy. Continued partnerships with senior
levels of government are important for creating additional future childcare spaces.
Opportunities
While there are a number of challenges in our current environment, there are also many opportunities
ahead for the City in the near future.
• We are fortunate that both the Federal and Provincial governments have announced funding
programs for major infrastructure over the next several years, many of which are directly aligned
to the City’s strategies and needs. The Federal government’s “Investing in Canada Infrastructure
Program” includes a focus on green infrastructure, social infrastructure, trade and transportation
infrastructure and public transit infrastructure.
• Commitments to financial support for housing through CMHC is also a key opportunity for the
City’s housing program. Provincially, support for housing and childcare are key issues for the
City. Over the next few years, we will focus on engaging with senior government through these
programs.
• Final approval of funding for the Broadway Millennium line extension has been announced and
the project is proceeding. The $2.83 billion project will be funded and delivered by the Provincial
government, with financial contributions from the Federal government and in-kind contributions
from the City of Vancouver. Bringing rapid transit to this core employment area of the city will be a
major support to the city’s economic growth. Planning for the Broadway Corridor is underway.
• As a City with one of the most favorable economic forecasts in Canada, Vancouver will continue to
see benefits in job growth and population growth over the next few years.
172020 – 2024 Budget Outook
• The City continues to be a leader in service delivery including using technology to increase our
online services and public engagement activities, and will continue to look for opportunities to
improve our service delivery models through innovation, technology, and continuous improvement
to support a growing city.
• While affordability is a factor for many residents, programs such as the Leisure Access Program,
library services, and availability of parks, open spaces and public plazas provide free and
subsidized programs for residents.
• With successes this year for the Empty Homes Tax and the regulations for short-term rentals
to support the City’s rental market, Vancouver has led the way on many critical issues. We will
continue to advance new and innovative programs to address the challenges and opportunities of
a growing city.
OPERATING BUDGET 2020-2024 OUTLOOK
Budget decisions will be considered as part of a five-year financial plan to ensure Council priorities are
addressed, and to enable proactive planning for revenues and business transformation opportunities,
while also responding to emerging issues. The 2020 budget is the first year of the five-year financial
outlook and highlights some of the City’s main drivers of the operating budget. These are estimates that
help to initiate the budget process by framing the challenges and opportunities which staff will consider
over the next few months in developing the proposed 2010 Budget and Five-year Financial Plan. For
reference, in 2020, a 1% increase in property tax increase would equate to approximately $8 million of
funding for the operating budget.
Operating Budget Preliminary Revenue Changes
2020 2021 2022 2023 2024
($ in millions)
Property Tax
Increase in property tax revenue: estimated ~ 4.9%
$39 $41 $43 $45 $48
(as published in the 2019 - 2023 Financial Plan)
New construction tax revenue $5 $5 $5 $5 $5
Utilitiy Fees
Increase in utility fee revenue
$28 $28 $26 $32 $29
(average blended rate estimated ~ 9%)
User Fees
Inflationary increases in program fees, licence and development fees $3 $3 $3 $3 $3
Total Preliminary Revenue Changes $75 $77 $77 $85 $85
Note: totals may not add due to rounding
Through a preliminary scan of the financial drivers, it is estimated that operating revenues will increase in
the following areas:
• Property tax was initially estimated to grow by approximately 4.9% annually (as indicated in the
2019-2023 financial plan) to cover the fixed cost base increasing at approximately 3.9% peryear
and increased funding for asset renewal in the Capital Plan. Taxes from new development are
estimated at $5 million annually. The five-year outlook reflects an unbalanced budget which could
possibly lead to higher taxes than the 4.9% assumed in the five-year period if other revenues or
cost savings are not identified.
182020 – 2024 Budget Outook
• Utility fees are initially estimated to increase by 9% annually on average for the next five years, based
on Metro Vancouver regional utility charge forecasts (estimated at 8% shown in the 2019-2023
financial plan).
• Program fee and development fee revenues are estimated at this time to increase in line with inflation.
• Revenue from the Empty Homes Tax is anticipated to cover the ongoing costs of administering the
program, with any additional revenue to be used to fund affordable housing programs.
• Through the budget process over the next several months, staff will review existing revenue sources
for potential increased revenues as well as other potential revenue opportunities including revenue
sharing from the Province from the legalization of cannabis, and from the expansion of the traffic fine
revenue sharing program. Note that staff are analyzing the impact of ride sourcing on revenue and
cost however positive or negative impacts are not available at this time.
Operating Budget Preliminary Expense Pressures ($ in millions) 2020 2021 2022 2023 2024
External Agency Costs passed on to the City
Increased Metro Vancouver charges for Water and Sewer utility $13 $13 $16 $16 $18
Anticipated external party cost increases (including EComm) $1 $1 $1 $1 $1
Debt, Transfers and Capital Program Costs
Pay-as-you-go Sewer & Water, Transfers and Debt Financing $17 $23 $14 $26 $18
Infrastructure renewal strategy in the 2019-2022 Capital Plan $6 $5 $10 $9 $9
Operating impacts of capital projects $6 $6 $6 $6 $6
Salary and Benefits Costs
Salary and benefit projected increases
$5 $5 $5 $5 $5
(contractual increments and projected benefit cost increases)
2020 MSP Premiums phased out ($3)
CPP increase $2 $2 $2 $3 $3
VFRS Operational Review staffing recommendations $4 $3 $4 $3
VPD Operational Review staffing recommendations $4 $4 $4 $2
Other Cost Pressures
Inflationary costs (Hydro, gas rates, IT, rents & leases, insurance, grants) $10 $6 $6 $7 $6
Workplace $3 $2 $2 $2 $2
Other costs $4 $4 $4 $4 $4
Snow contingency $2 $2 $2 $2 $2
Total Preliminary Expense Pressures
$74 $76 $76 $86 $74
(Excluding impact of collective agreements)
+ impact of wage increases to be determined
Note: totals may not add due to rounding
192020 – 2024 Budget Outook
Through the preliminary scan of the financial drivers, it is estimated that operating expenses will increase
in the following areas:
• An additional $5 million to $10 million will be allocated each year to maintain our infrastructure and
public amenities in a state of good repair as outlined in the 2019-2022 Capital Plan. Over the five
years this equates to approximately 1% of property taxes and is built into the five -year financial
plan. There will be increasing costs related to: higher debt servicing costs; ongoing operating and
asset lifecycle costs for new infrastructure and public amenities; increased use of pay-as-you-go
for Water and Sewer utilities capital.
• Regional utility charges passed on to the City by Metro Vancouver are forecast to increase
between 10% and 12% for Water and between 2% and 6% for Sewer annually from 2020-2024,
driven by major infrastructure investments. These are estimates and more information will be
available once rates are confirmed by Metro Vancouver.
• The outlook for 2020-2024 shows the risk of potential increases in wage expenses, significantly
dependent on the terms of future collective agreement settlements all of which will be expired by
the end of 2019.
• The Provincial government announced an Employer Health Tax that came into effect on January 1,
2019 with an incremental impact of $15M in 2019. This was accompanied by the announcement of
the elimination of Medical Services Plan (MSP) premiums effective January 1, 2020 which equates
to one-time reduction of $3 million for the 2020 budget.
• The Federal government has announced increases to the Canada Pension Plan contribution rate
starting in 2019 which will drive an approximate cost increase of $2 million per year for 2020-2022
and $3 million per year for 2023-2024.
• Cost increases passed on from external agencies and senior levels of government are estimated
to be $1 million to $2 million per year. In addition, indirect cost pressures in the areas of housing,
mental health and addiction, childcare, and emergency medical response, which are primarily the
responsibility of the Provincial and Federal governments, continue to add to the City’s budget
pressure.
• Reinstatement of $2 million of the Council Contingency which was reduced in the 2019 budget,
and includes a contingency for storm and snow events. Staff are considering setting up a storm/
snow stabilization reserve to address the unpredictability of storms and their associated costs.
City staff have identified budget expenditure pressures which exceed revenue estimates including
considerations for collective agreements, which if not mitigated would require a tax increase above the
4.9% projected in the financial plan, possibly up to 6-7%, to maintain existing service levels including
staffing increases to Fire and Police services.
In addition, Council has put forward a number of motions over the past months, some of which will have
budget implications over the next few years.
202020 – 2024 Budget Outook
Major Council Motions
2020 2021 2022 2023 2024
(Preliminary Operating Impact estimate) ($ in millions)
Climate change
Global warming (sea level and storm water) $5 - $6 $5 - $6 $5 - $6 $5 - $6 $5 - $6
Carbon neutral before 2050 $2 - $3 $2 - $3 TBD
City-wide Plan $7 $5 $3
Other initiatives $7 - $8 TBD
Estimated Expense Pressure $21 - $24 TBD
Financial impacts of motions related to other boards will be incorporated during the budget process.
A cost increase of $8M for tax funded expenses would require a tax increase of approximately 1% to fund.
Major Council Motions
2020 2021 2022 2023 2024
(Preliminary Capital Funded estimate) ($ in millions)
Climate change $14 - $19 $50 - $100
Vancouver’s Watershed Revival Plan $2 - $3 TBD
Canadian Pride in Vancouver’s Chinatown Memorial Square $1 TBD
Formalize the False Creek to the Fraser River Blueways $1 TBD
Estimated Total Cost $18 - $24 TBD
Over the next few months, as part of the budget process, staff will work to reprioritize existing resources,
adjust service models, and look for additional revenue sources or cost savings in order to accommodate the
major Council motions. Where these programs cannot be accommodated within existing resources, staff
will bring back to Council options for potential tradeoffs in services or additional tax/fee impacts.
Major capital funding required by numerous Council Motions will be reviewed for the opportunity to:
reprioritize within the existing budget, reduction of scope to be able to implement at lower cost, or review
of funding sources to determine an appropriate municipal funding source. The tax impact of capital
projects is dependent on type of funding source.
The final 2020 Budget will incorporate feedback from public consultation with Vancouver residents and
business owners, to be conducted over the late summer and fall of 2019.
212020 – 2024 Budget Outook
CAPITAL PLANNING AND
BUDGETING
The City owns approximately $25 billion of infrastructure and public amenities (excluding land),
encompassing: underground water and sewer infrastructure; roadways, sidewalks and bikeways;
affordable housing; community facilities, parks and open spaces; public safety facilities; and service
yards. There are two principal goals as the City plans and manages its capital assets over the medium
and longer term: (a) renewing aging infrastructure and amenities to maintain them in a state of good
repair; and (b) upgrading and expanding infrastructure and amenities to meet the needs of a growing
city. The City incorporates these goals into its 10-year Capital Strategic Outlook.
Shorter-term implementation is organized around the four-year Capital Plan and the Annual Capital
Budget. The four-year Capital Plan matches City Council’s and Park Board’s term in office: the current
Capital Plan timeline covers the 2019-2022 period. The 2019-2022 Capital Plan was approved by City
Council and Park Board in July 2018, and the required borrowing authority components were approved
by voters in October 2018.
The 2019-2022 Capital Plan sets outs the objectives to be achieved for one-time projects (e.g. to
renew and expand the Marpole Library) and ongoing programs (e.g. to repave approximately 23 km of
arterial streets over the four-year period). In total, the Capital Plan for 2019-2022 contemplates $2.8
billion of investment: $2.2 billion worth of City-led capital investments and $0.6 billion worth of in-kind
contributions achieved through development. The Capital Plan is intended to be an evolving document,
as some adjustments are needed as the City executes on the four-year plan. Since January 2019, City
Council has added $16 million to the 2019-2022 Capital Plan, of which $7 million was from additional
partnership funding (primarily funding from TransLink, the regional transportation authority).
Original 2019-2022 Capital Plan approved by Changes to 2019-2022 Capital Plan
Council in July 2018 ($ millions) approved by Council in Jan 2019 ($ millions)
Service Categories City-led City-led
In-kind In-kind
Capital Total Capital Total
Contributions Contributions
Investments Investments
Affordable Housing $140 $400 $540 $0.8 – $541
Childcare $86 $38 $123 $4.7 – $128
Parks & Open Spaces $264 – $264 – – $264
Arts & Culture $142 $43 $185 $0.6 – $186
Community Facilities $146 $88 $234 – – $234
Public Safety $48 – $48 $0.3 – $48
Civic Facilities & Equipment $108 – $108 – – $108
Transportation & Street Use $311 – $311 $7.6 – $318
One Water (Water, Sewer &
$616 – $616 – – $616
Green Infrastructure)
Solid Waste $92 – $92 – – $92
Renewable Energy $41 – $41 $1.5 – $43
Technology $100 – $100 $0.1 – $100
Overhead $20 – $20 – – $20
Emerging Priorities $88 – $88 – – $88
Total $2,203 $569 $2,771 $16 – $2,787
22You can also read