CONVENIENCE RETAIL: WHAT'S IN STORE FOR 2021? - Discovering Pockets of Demand February 9, 2021
←
→
Page content transcription
If your browser does not render page correctly, please read the page content below

Discovering Pockets of Demand

CONVENIENCE
RETAIL: WHAT’S IN
STORE FOR 2021?

February 9, 2021
Today’s Presenters

 Krishnakumar                Nik Modi                Jeff Neihart                                     Kennith Fries
   (KK) Davey            Managing Director,     Vice President & GM,                                  Vice President,
    President,         Beverages, Tobacco &      Client Development                                      C-Stores
Strategic Analytics   Household Personal Care         Crossmark                                         Crossmark
        IRI             RBC Capital Markets

                                                            © 2021 Information Resources Inc. (IRI). Confidential and Proprietary.   2
SECTION 1
IRI Perspectives

                   © 2021 Information Resources Inc. (IRI). Confidential and Proprietary.   3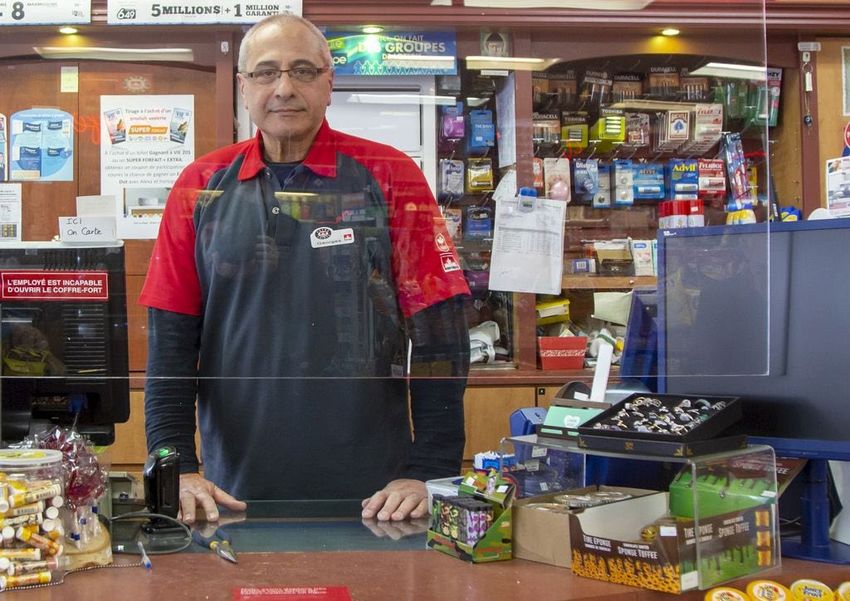
Convenience Channel Growth Tends to Be Cyclical
and Is Often Driven by Macro Economic Trends
Convenience Channel Edible Sales – Quarterly % Change vs. YA                                                                                                                                    Dollar Sales

                                                  12
                                                       10
   GREAT
                                              9                                                        8 8
 RECESSION                                6                 6                                   5 6          6
                                                                                                                                                                                     5         COVID-19
                                4 3 3                                                 4
   3 3 4                      3       3                                           4       3 4                     3 3 3 2                          3        3 3 4 3 3                     4
                                                                                                                                                                                                    3 3
                                                                2                                                                             1         2                                      2
                                                                              1                                           1

            -1                                                           -1                                                              -1
                 -2                                                 -2
                      -3 -3
2008 2009             2010       2011         2012              2013              2014          2015         2016             2017                2018               2019                2020

                                                                Disposable
                                                                  Income
                                                                                                              Housing                                                          Gas Prices
             Mobility
                                                                                                               Starts

                                                                                                        Source: IRI POS data Convenience channel for edible scan products. Includes archived data.
                                                                                                                               © 2021 Information Resources Inc. (IRI). Confidential and Proprietary.     4
C&G’s 2020 Sales Dipped Dramatically with Mobility and Gas Prices in April-May;
 Restricted Mobility Continues to Hold Convenience & Foodservice Sales Back
 C&G Total Store Weekly $ % Change vs. YA
 Weekly U.S. All Grades All Formulations Retail Gasoline Prices (Dollars per Gallon) % Change vs. YA
                                                                                                                                           Convenience Stores $ % Chg                           Mobility % Chg
                                                                                                                                          Gas Prices % Chg vs YA                                Restaurant $ % chg. vs. YA
 15
 10
  5
  0
 -5
-10
-15
-20
-25
-30
-35
-40
-45
-50
-55
-60
-65
-70
-75
-80
-85
-90
-95

      01-   01-   02-   02-   03-   03-     03-       04-      04-       05-       05-      06-       06-       07-      07-       08-       08-      08-       09-      09-       10-      10-       11-       11-        12-       12- 12-
      05-   19-   02-   16-   01-   15-     29-       12-      26-       10-       24-      07-       21-       05-      19-       02-       16-      30-       13-      27-       11-      25-       08-       22-        16-       20- 27-
      20    20    20    20    20    20      20        20       20        20        20       20        20        20       20        20        20       20        20       20        20       20        20        20         20        20 20

                                          Source: IRI POS data, U.S. Energy Information Administration, Google Mobility based on Retail and Recreation % Chg from pre-COVID-19 baseline (Jan 3-Feb 6, 2020), IRI On
                                                                                                                                            Premise bases on full service dining, includes restaurants that have closed.
                                                                                                                                                  © 2021 Information Resources Inc. (IRI). Confidential and Proprietary.         5
Convenience Slowed Down in 2020 as E-commerce,                                                                                                                                                 Key Criteria
Grocery, Club and Dollar Channels Emerged as Key Winners                                                                                                                                      for Shopping

Total CPG % Change vs. YA                                                                                                                                                                • One-stop shop

                                                                                                                                                                  Trend vs.
                                                                                                                                                                                         • Selection,
                                                               2019 vs. 2018                                         2020 vs. 2019                               2019 growth               variety, value
 Total Omnichannel                                                     3.2%                                                      15.5%                                                   • Safety, self-
     MULO Brick & Mortar                                             1.3%                                                      11.5%                                                       checkout,
                                                                                                                                                                                           contact-less
     Grocery Brick & Mortar                                         1.0%                                                         16.3%
                                                                                                                                                                                           payment
     Mass Merch. Brick & Mortar1                                     1.6%                                                   3.6%                                                         • Convenience
     Club (Sam’s, BJ’s & Costco)1                                     2.6%                                                      14.1%                                                      including
                                                                                                                                                                                           curbside pickup,
     Drug1                                             -0.5%                                                               0.9%
                                                                                                                                                                                           delivery
     Convenience                                                       3.4%                                                 2.9%

     E-commerce2                                                                               22.0%                                               58.6%

     Dollar1                                                                       12.7%                                           19.3%

                     Note: Omnichannel includes MULO + C + Costco + Dollar + E-comm. 2020 = data ending Nov 29, 2020, forecast for remainder of year. Source: IRI POS, eMarket Insights and Consumer Panel
                                 1. 2020 vs. 2019 based on 52 weeks ending Nov 29, 2020 vs. YA. 2. E-commerce data includes e-commerce of MULO and Grocery as well as pure plays. Dollar based on Panel
                                                                                                                                         © 2021 Information Resources Inc. (IRI). Confidential and Proprietary.   6
Convenience Volume Sales Declined Across the Second Half
of 2020, While Increased Price/Mix Recovers Some Value
Sales and Price / Mix Trends: Total Store / Edibles / Nonedibles                                                                               Total Store             Edibles           Nonedibles

% Change vs. YA, C&G
                          2019                 2020                   Q1                               Q2                                Q3                                Q4
                                                                                                               5.6
                           3.4                                2.8      2.6     2.9             4.4                                      2.8                               3.3
                   2.8           2.2    2.9     3.0    2.8                                              3.3                     2.1                              2.3
   DOLLAR SALES                                                                                                                                  1.3                               1.3

                                                       4.6                                   3.9              4.1             4.9      4.7      5.1             4.7      4.6      4.9
                                 4.0    4.2     3.8           3.2     2.3     4.2                     3.7
                   3.6
                           3.3
   PRICE / MIX*

                                                                                              0.5              1.5
                           0.1                                        0.3
   VOLUME SALES
                   -0.8                         -0.8          -0.5             -1.2                   -0.4                                                                -1.2
                                 -1.8   -1.2           -1.7                                                                             -1.8                      -2.3
                                                                                                                               -2.7
                                                                                                                                                 -3.6                             -3.5

                                                                     Source: IRI PS data ending 12/27/20; *Dollar sales-weighted price per volume and volume change across categories
                                                                                                                    © 2021 Information Resources Inc. (IRI). Confidential and Proprietary.      7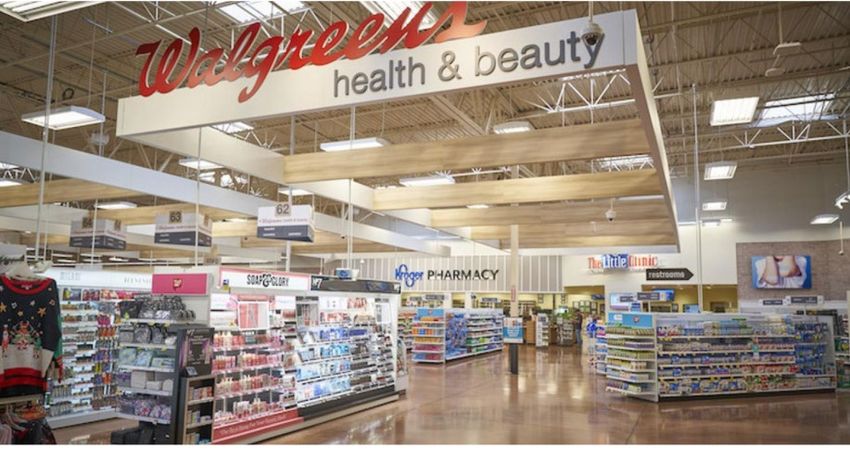
High-Growth Categories Pre-, During-COVID-19 Include Bev Alcohol,
Sports Drinks; Snacks Decelerated as On-the-Go Occasions Eroded
Top 20 Total Store Categories with Sales of $1B+ // C&G // % Change vs. YA
                           Ranked by C&G             CY 2020 $ (MM)                                                    Category Dollar Sales Growth
                                                                             2019                2020
                               2020 $                52 WE 12/27/20                                                    Above Total Store Growth
                   TOTAL STORE                          $164,150               3%                  3%
                    EDIBLE                               $84,735              3%                   3%
                    NONEDIBLE                            $79,416              2%                   3%
                       BEER/ALE/ALCOHOLIC CIDER          $23,246               4%                 14%
                       WINE                               $1,277              6%                  10%
                       SPIRITS/LIQUOR                     $1,731              16%                 31%
                       CIGARETTES                        $56,108              -1%                  1%
                       SMOKELESS TOBACCO                  $8,131              5%                   8%
                       ELECTRONIC SMOKING DEVICES         $4,863              72%                  5%
                       CIGARS                             $3,846              0%                  10%
                       SALTY SNACKS                       $5,363              5%                  -6%
                       CHOCOLATE CANDY                    $2,887              0%                   2%
                       NON-CHOCOLATE CANDY                $2,177              3%                   4%
                       DRIED MEAT SNACKS                  $1,746               4%                  5%
                       PASTRY/DOUGHNUTS                   $1,628              4%                  -7%
                       ENTREES - RFG                      $1,337              -1%                 -8%
                       ENERGY DRINKS                      $9,835              9%                   2%
                       CARBONATED BEVERAGES               $8,630              0%                   0%
                       BOTTLED WATER                      $4,275              3%                  -5%
                       TEA/COFFEE - READY-TO-DRINK        $3,342              0%                  -1%
                       SPORTS DRINKS                      $3,264               6%                  6%
                       BOTTLED JUICES - SS                $1,512              -1%                 -2%
                       MILK                               $1,359              -7%                 0%

                                                                                                                   Source: IRI TSA
                                                               © 2021 Information Resources Inc. (IRI). Confidential and Proprietary.    8
De-Densification of Cities Is Hurting Sales in Urban Markets, While Suburban /
Rural Are Driving Growth; Shifts Indicate a Need for Retooling Assortment
                                                                                                                                                              All Stores             Suburban
Performance by Store Location // Non-Alc LRB + Snacks // C&G Comp Stores                                                                                      Rural                  Urban

                 Dollars, % Change                                    Trips, % Change                                          Dollars per Trip, % Change
     Suburban and rural clusters have led sales        Trip traffic continued to be a weakness across all          Despite fewer trips, shoppers are spending more
   recovery in 2020, while urban stores struggled       clusters as work commutes are disrupted and                    on each trip across all stores; a sign of
   when faced with work-from-home disruptions,           “pantry stocking” behavior remains popular in              avoidance to store exposure and elements of
          gov’t restrictions and civil unrest                             other channels                              stock-up behavior / seeking large packs

                                    0.2                                                    -3.7                                                 4.0
                             -0.2                                                          -4.0                                                 3.9
 Q1’20                                                    Q1’20                                                             Q1’20
                                    0.4                                                     -3.4                                                4.0
                                    0.4                                                    -3.9                                                  4.4

                     -3.6                                                 -15.3                                                                                       13.7
                      -3.0                                                 -14.7                                                                                      13.6
 Q2’20                                                    Q2’20                                                             Q2’20
                     -3.5                                                 -15.1                                                                                       13.7
         -10.0                                                    -21.6                                                                                                 14.8

                                            4.2                                         -6.7                                                                      11.7
                                              5.3                                         -5.6                                                                    11.5
 Q3’20                                                    Q3’20                                                             Q3’20
                                           3.8                                         -7.1                                                                       11.7
                             -0.5                                              -11.1                                                                              11.8

                                           4.2                                      -7.4                                                                            12.5
                                                 6.4                                   -5.4                                                                         12.4
 Q4’20                                                    Q4’20                                                             Q4’20
                                          3.3                                      -8.2                                                                             12.5
                      -2.9                                                 -13.8                                                                                    12.6

                                                                                                                                      Source: C&G Retail data thru 12-31-2020;
                                                                                                            © 2021 Information Resources Inc. (IRI). Confidential and Proprietary.       9
With Flexibility of Work-From-Home, Convenience Is Seeing Increased Weekday
 Sales; Even in Recovery, Many Workers Will Work From Home Part-Time
 Day of Week % Chg, Non-Alcohol LRB + Snacks / Dollars, Comp Stores
                                                                                                                                                       Q1’20               Q2’20               Q3’20             Q4’20

   ALL DAYS                                      WEEKDAYS (Monday – Thursday)                                                                       WEEKENDS (Friday – Sunday)
    FY 2020                                               FY 2020                                                                                          FY 2020
     +1.2%                                                 +2.6%                                                                                            -0.6%

                                                                                                                       13.8
                                                                                      12.5
                       10.0

                                                                                                                 6.2
                                           4.3             5.2                                                                                      4.5                                                        4.8
             4.2 4.2                                                                         3.9                                                                                     4.2
                                                                                                                                              2.0                             2.2                                    2.0
0.2                           0.5                0.9 0.4

                                                                        -0.2                       -0.5                                                                                          -0.7
                                    -2.8                                       -3.1                                           -2.6
      -3.6                                                       -3.5                                                                                                                                   -3.5
                                                                                                          -4.3                                                  -4.4
                                                                                                                                                                       -6.6
                                                                                                                                      -7.6
      All Days                Monday               Tuesday               Wednesday                    Thursday                        Friday                         Saturday                           Sunday

 Dol % Share of
Total Wk (FY2020)             13.8%                 14.2%                      14.8%                      15.3%                       16.3%                            14.0%                            11.5%

 Pt Chg vs. YA
    (FY2020)                   0.1                    -0.1                       0.3                        0.4                         -0.4                             -0.3                             -0.1

                                                                                                                                                               Source: C&G Retail data thru 12-31-2020;
                                                                                                                                     © 2021 Information Resources Inc. (IRI). Confidential and Proprietary.      10
Mornings Continued to Struggle Even in the Last Two Quarters
of 2020; Morning Share Was Lost to Later Day Parts
Time of Day % Chg, Non-Alcohol LRB + Snacks
Q1’20 Q2’20 Q3’20 Q4’20
Dollars, C&G Comp Stores*, All Shoppers
10.8
6.8 7.2 7.4
6.3 6.5
5.2 4.9 5.5
4.2 4.2
1.8 1.7 1.7
0.9 0.6 1.1
0.2
-0.8 -0.1 -0.2
-1.2
-1.4
-3.0
-3.6
-10.2 -10.8
-12.2
Total Day Early Morning Morning Mid Day Afternoon Evening Late Night
(2a-6a) (6a-10a) (10a-2p) (2p-6p) (6p-10p) (10p-2a)
Dol % Share of
Total Day (FY2020) 11.3% 21.9% 22.7% 22.2% 15.7% 6.3%
Pt Chg vs. YA
(FY2020) -0.3 -1.1 0.5 0.2 0.7 -0.1
Source: C&G Retail data thru 12-31-2020;
© 2021 Information Resources Inc. (IRI). Confidential and Proprietary. 11Convenience Relies Heavily On Large Manufacturers, as a Result
the Declines for Large Manufacturers Are More Pronounced
% Share of Total Store Sales by CPG Manufacturer Size / Total U.S. Convenience / Total U.S-Conv
Avg Chg vs YA
2016-19 2019-20 vs. YA vs. YA vs. YA vs. YA
Private Label 2.2 2.4 2.2 2.4 2.0 2.3 2.3
4.1 0.1 -0.2 4.6 0.0 4.6 -0.5 -0.2 -0.1
Extra Small ($100M) 6.7 7.2 7.0 7.1 7.4 7.3
0.2 0.5 0.5 0.4
0.4 0.6
Medium ($>1B) 15.5 0.8 18.7 0.4 19.1 18.7 19.3 19.2 0.5 19.3 0.5
0.0 0.5
72.3 -1.2
67.8 -1.0 -0.6 -1.3
66.8 67.6 -0.5 67.1 66.4 66.4 -1.2
Large ($>6B)
2016 2019 2020 2020 Q1 Q2 Q3 Q4
MULO Large Manufacturers Share
ppt change (2020 vs 2019): -0.8
Note: Note: Large is $6B+ in L52W, Medium $1-6B, Small $100M-1B and Extra SmallMidsize Chains Are Disappearing as Larger Firms
Buy Them Up to Build Scale; Independents Dominate by Number of Stores
Convenience Store Industry Consolidation
Convenience Channel M&A Activity Store Counts by Chain Size
154,535 153,237
In 2017, 7-Eleven acquired 1,108 145,119 148,126
Sunoco stores 19,252 19,969 26,629 34,786 Large Chains
(13%) (13%) (17%) (22%) (>500 Stores)
In 2015 / 2016 / 2017, Circle K parent 30,402 18,045 Small &
35,910 34,948
Alimentation Couche-Tard acquired 1,800 (25%) (24%) (20%) (12%) Midsize Chains
(2-500 Stores)
The Pantry stores, 1,146 Valero stores, and
522 Holiday Stations
Independents
Acquired 1,500 HESS / Wilco HESS stores 89,957 93,209 97,504 100,406
and in 2018 / 2019, 1,100 Andeavor stores (62%) (63%) (63%) (66%)
In 2018, EG Group acquired 1,000 Kroger
Convenience stores, 225 TA stores, 75
Certified Oil stores, and 600 Cumberland 2006 2011 2016 2020
Farms locations
In August 2020, 7-Eleven entered an agreement with Marathon Petroleum Corp. to acquire
the 3,900 store Speedway chain. The addition of Speedway would lift 7-Eleven to 14,000 units.
Source: NACS State of the Industry Report of 2019 Data. IRI Growth Consulting secondary research. IRI Growth Consulting Analysis; https://www.supermarketnews.com/retail-financial/7-eleven-buying-3900-speedway-stores-21-billion-deal
© 2021 Information Resources Inc. (IRI). Confidential and Proprietary. 13Consumer Mobility, a Key Factor in At-Home vs. Away-From-Home Consumption,
is Likely to Increase in Early to Mid-2021 as Vaccine Distribution Expands
Likely Vaccine Adoption Timeline Workplace Mobility Scenarios
Optimistic
Scenario
10 ACTUAL FORECAST Conservative
FEB – APR 2021 JUN – SEP 2021 Scenario
Case counts begin to decline Vaccinated and younger 0
consumers begin to resume
Phase 2 vaccine distribution ‘normal’ activities -10
-20
-30
JAN’21 – FEB’21 APRIL – MAY 2021 SEP 2021+
-40
Millennials and higher
Case counts stabilize. Vaccine becomes available Herd immunity begins
for everyone
income households
$900B Second Stimulus More consumers back to (new) -50 are likely to improve
passed @ 2020 year-end Vaccinated consumers ‘normalcy’ mobility the soonest
begin to resume ‘normal’
$1.9T Stimulus announced activities Certain habits persist at least -60
10/8/2020
11/8/2020
12/8/2020
10/8/2021
11/8/2021
12/8/2021
3/8/2020
4/8/2020
5/8/2020
6/8/2020
7/8/2020
8/8/2020
9/8/2020
1/8/2021
2/8/2021
3/8/2021
4/8/2021
5/8/2021
6/8/2021
7/8/2021
8/8/2021
9/8/2021
1/8/2022
2/8/2022
3/8/2022
4/8/2022
5/8/2022
6/8/2022
through 2021 (e.g., some work
Phase 1 vaccine distribution from home)
Source: CDC, RBC Capital Markets; Google Workplace Mobility, Mobility forecasts represent IRI Strategic Analytics POV.
© 2021 Information Resources Inc. (IRI). Confidential and Proprietary. 14The Channel’s Outlook Is Improving
Opportunities
and Operators Have Upside • Continued or increased
restriction on
Total Store – U.S. Convenience Channel restaurants and bars
Sum of Index • More road trips as
travel shifts away from
air travel, vacations
Optimistic near home
Scenario 107.6 • Changing needs for
103.6 convenience (late night
indulgence, food
delivery).
Base Case
Headwinds
102.8 103.0 103.0
• COVID-19 resurgence
or cold winter weather
can further limit
consumer mobility.
• Greater loss of low-
wage jobs.
YTD CY 2020 CY 2021
Source: IRI CPG Demand Index Forecast; Note: Forecast results based on data available as of 10/14/20. Mobility rates, additional federal stimulus, and economic recovery will impact forecast moving forward.
© 2021 Information Resources Inc. (IRI). Confidential and Proprietary. 15Mobility Changes the Impact of Millennials’ and
Higher Income Households’ CPG Spend Most
Consumer Cohorts Most Impacted by Consumer Mobility
% Change in Total CPG Dollar Growth Associated with 10% Decrease in Mobility1,2
Cohort differences driven by at-home vs. away-from-home
6.7
consumption: High income and younger cohorts shift more spend
to/from away-from-home consumption as mobility factors change
6.4
6.1 6.1
5.9 5.9
5.8
5.5 5.6 Ø 5.7
5.5
5.3
5.1
5.0
5.0 4.9
Generation Gen Z Millennials Gen X Boomers Seniors
Income Low Middle High Low Middle High Low Middle High Low Middle High Low Middle High
1. Based on linear relationship, excluding other factors.
Sources: IRI Strategic Analytics, Proprietary methodology for mobility elasticity. Based on IRI Shopper Loyalty data for 6.5M static households regularly shopping Grocery channel.
© 2021 Information Resources Inc. (IRI). Confidential and Proprietary. 16Once a Traffic Driver, Operators Must Invest to Rebuild Valuable Foodservice
Operations; Focus on New Daypart Solutions, Technology Solutions for Ease
High margin offerings including fountain sales, coffee, and baked goods took
a hit during pandemic due to temporary suspensions to implement new safety
protocols and dip in visits / traffic.
Operators can fight back by boosting customer service, including hiring
additional personnel to staff fresh food offerings; supporting in-store cleanliness;
offering curbside and drive-through fulfillment.
Operators should consider adopting new technologies to accommodate
online orders, curbside pick-up and even delivery.
Shift focus away from morning commute to different day parts to accommodate
work-from-home breaks and school-from-home breaks; evening.
For urban areas, factor in lost commuter traffic and focus on urban dwellers; in
suburban / rural markets, cater to larger populations working and studying from home.
Standout foodservice items should be available all day. Convenience built its
reputation on “all hours” operation, and even limited, but high-quality foodservice
items will drive traffic. Promote complementary items and even household essentials.
Pre-package food items into kits and bento boxes support in-home and
on-the-go dining. C&G stores have an opportunity to reignite America’s love
of road trips with signature offerings.
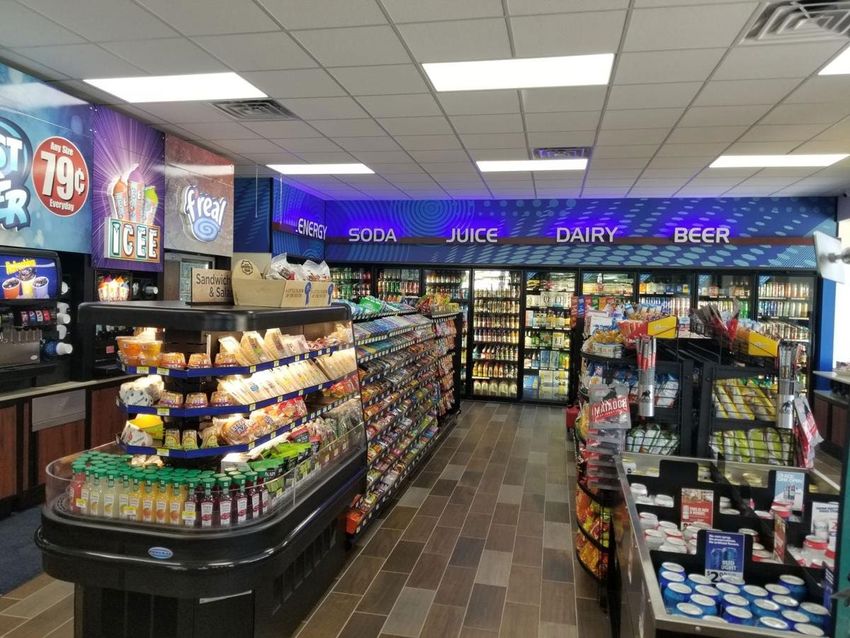
© 2021 Information Resources Inc. (IRI). Confidential and Proprietary. 17Convenience Retailers Focus Investments on Core
Value Proposition: Greater Convenience for Shoppers
NACS Retailer Member Pulse Survey* Provides a Glimpse of What’s in Store for Convenience Operators
21% 21%
have added added
curbside pickup contactless payment
14% 14%
focusing more
have added
on drive-thru delivery
The 7NOW delivery app aims to make
life easier and convenient for shoppers.
7-Eleven customers can order-in their
Enhanced Cleaning Protocols
favorite comfort foods at any time. Will Be a Part of Every
• Offered in 1,300 cities
Successful Store Operation
• Supports 60MM households and Survey Respondents
• Delivery in 30 minutes Indicate They’ll Make Cleaning
• October offers a “Free Hot Pizza” promo Efforts More Visible to Patrons
Source: https://www.cspdailynews.com/company-news/c-store-retailers-continue-see-mixed-results-2020; *Survey conducted in October 2020 among 72 NACS members companies representing 1,762 stores
© 2021 Information Resources Inc. (IRI). Confidential and Proprietary. 18There Are Multiple Paths to Drive Growth
Adopt New Technologies Shift Daypart Focus Leverage Loyalty Programs
-0.6% +6.1%
Right Assortment for Right Stores All Day Standout Food Service Items
Source: IRI analysis; C&G Retail, May – Aug 2020. *Store universe excludes “unassigned” clustered stores within scope of rural, suburban, & urban classification
© 2021 Information Resources Inc. (IRI). Confidential and Proprietary. 19SECTION 2
RBC Perspectives
© 2021 Information Resources Inc. (IRI). Confidential and Proprietary. 20EQUITY I RESEARCH An Inconvenient Truth: What Just Happened? February 2021 RBC Capital Markets, LLC Nik Modi, HPC, Beverages and Tobacco Analyst, (212) 905-5993, nik.modi@rbccm.com This report is priced as of market close February 3, 2021 EST. All values U.S. dollars unless otherwise noted. For Required Conflicts Disclosures, please see page 70.
Source: Google Images

22                      RBC Capital Markets
The pace of change is accelerating

                                                 Year                            Years until
                                               Developed           Technology   mass adoption
                                                 1872              Electricity       46
                                                 1876              Telephone         35
                                                 1897              Radio             31
                                                 1926              Television        26
                                                 1975              PC                16
                                                 1983              Mobile Phone      13
                                                 1991              The Web            7
                                                 2001              iPod               4
                                                 2006              Facebook           3
                                                 2007              iPhone            2.5
Source: RBC Capital Markets

23                                                                                              RBC Capital Markets
COVID = forcing change Source: RBC Capital Markets 24 RBC Capital Markets
The Very Nature of Convenience is
                 Changing

25                                       RBC Capital Markets
Latin root: Conveniens
“to be suitable”
26 RBC Capital MarketsSuitable is not good enough anymore 27 RBC Capital Markets
So what does all this mean for
              C-stores?

28                                    RBC Capital Markets
Probably some more of this…
2.0% Y/Y Chg. in # of US Convenience Stores
1.4%
1.5%
1.2% 1.2%
0.9% 0.9%
1.0%
0.7%
0.5% 0.3%
0.2%
0.0%
-0.5% -0.3%
-1.0%
-1.1%
-1.5%
2011 2012 2013 2014 2015 2016 2017 2018 2019 2020
Source: NACS
29 RBC Capital MarketsLess traffic Source: Google Images 30 RBC Capital Markets
Social unrest

Source: Google Images

31                      RBC Capital Markets
The biggest issue: failure to adapt

Source: Google Images

32                                    RBC Capital Markets
And this does not count as adapting…

Source: Google Images

33                                     RBC Capital Markets
Remember this?

Source: Google Images

34                                       RBC Capital Markets
What could “normal” look like
Homebody?

Source: IRI, RBC Capital Markets

36                                 RBC Capital Markets
Is staying at home more a
         new phenomenon?

37                               RBC Capital Markets
Here’s some data on the “home channel” as of 2018 (pre-COVID)
Games and Puzzles Video Games
3% growth over Top growing
same period last industry at NPD,
year +18% vs. LY
Sweats and
Barware Tools
Sleepwear unit
and Sets
sales +9% over
+52% vs. LY
LY
Source: The NPD Group/Consumer Tracking Service, 12ME Mar ‘18; Retail Tracking Service, 12ME Mar ‘18
38 RBC Capital MarketsNeed some more evidence? One 2018 paper, published in the journal Joule, found that Americans between the ages of 18 and 24 spend 70% more time at home than the general US population. In another 2018 survey, conducted by the marketing research firm Mintel, 28% of millennials between 24 and 31 said that they preferred to drink at home because going out was too much effort, compared to just 15% of baby boomers who agreed with that statement. Source: Joule, Mintel, RBC Capital Markets 39 RBC Capital Markets
Why?

40          RBC Capital Markets
1) People are burnt out

      A survey of more than 300 companies in the US and Canada found nearly 2/3 of employers were demanding
                            longer hours of their employees than they did three years prior.

                           Roughly half said they expected the longer hours to get even longer over the next three years.

                              In the U.S., 85.8% of males and 66.5% of females work more than 40 hours per week.

Source: Business Insider

41                                                                                                                      RBC Capital Markets
2) Even on the couch, people are more “connected” than ever before. Facebook has 2.7B monthly active users – more than the population of
the US and China combined
3.0 Facebook Monthly Active Users 30%
2.5 25%
2.0 20%
1.5 15%
1.0 10%
0.5 5%
0.0 0%
Jun-14
Dec-14
Jun-15
Dec-15
Jun-16
Dec-16
Jun-17
Dec-17
Jun-18
Dec-18
Jun-19
Dec-19
Jun-20
Sep-14
Sep-15
Sep-16
Sep-17
Sep-18
Sep-19
Mar-14
Mar-15
Mar-16
Mar-17
Mar-18
Mar-19
Mar-20
Monthly Active Users (in billions) Y/Y Growth
Source: Company Reports, Google Images.
42 RBC Capital Markets3) It’s scary out there! Source: Google images 43 RBC Capital Markets
It took 20 years for e-commerce to reach 11% penetration. In the past 6 months it’s jumped over 6 pts

                                                   18%
                                                                                          E-commerce Penetration as a % of Total Retail Sales                                      6                      16.1%
                                                   16%                                                                                                                           months
                                                                                                                         20 years
                                                   14%

                                                   12%                                                                                                                                       11.0%

                                                   10%                                                                                                                               9.1%
                                                                                                                                                                       7.3%
                                                         8%
                                                                                                                                                         5.9%
                                                         6%                                                                                4.9%
                                                                                                                             4.0%
                                                                                                               3.4%
                                                         4%                                      2.5%
                                                                                   1.8%
                                                         2%          1.1%

                                                         0%

                                                                                                                                                                                                           2Q'20
                                                              2000

                                                                     2001

                                                                            2002

                                                                                   2003

                                                                                          2004

                                                                                                 2005

                                                                                                        2006

                                                                                                               2007

                                                                                                                      2008

                                                                                                                             2009

                                                                                                                                    2010

                                                                                                                                           2011

                                                                                                                                                  2012

                                                                                                                                                         2013

                                                                                                                                                                2014

                                                                                                                                                                       2015

                                                                                                                                                                              2016

                                                                                                                                                                                     2017

                                                                                                                                                                                            2018

                                                                                                                                                                                                   2019
Source: US Department of Commerce, RBC Capital Markets

44                                                                                                                                                                                                                 RBC Capital Markets
It’s only going to get more profound 45 RBC Capital Markets
Same-day/1-day coverage for Amazon in 2014…

Source: RBC Capital Markets, RBC Elements, Amazon website

46                                                          RBC Capital Markets
…in 2015 (expanded coverage areas in black)

Source: RBC Capital Markets, RBC Elements, Amazon website

47                                                          RBC Capital Markets
Rapid growth of Amazon’s fulfillment capacity, 2014-2018

Source: RBC Capital Markets, company reports

48                                                         RBC Capital Markets
Same-day/1-day coverage for Amazon in 2016 (expanded coverage areas in purple)

Source: RBC Capital Markets, RBC Elements, Amazon website

49                                                                               RBC Capital Markets
Same-day/1-day coverage expansion in 2017 was exponential (expanded coverage areas in green)

Source: RBC Capital Markets, RBC Elements, Amazon website

50                                                                                             RBC Capital Markets
Then came the locust swarm in 2018 (expanded coverage areas in maroon)

Source: RBC Capital Markets, RBC Elements, Amazon website

51                                                                       RBC Capital Markets
Today - In 17 states (incl. DC), almost all (95%+) households have access to same-day or next-day Amazon delivery

                                                            Connecticut                              100.0%   Oregon                      86.8%
                                                            Delaware                                 100.0%   Minnesota                   74.0%
                                                            District of Columbia                     100.0%   Wisconsin                   72.3%
                                                            Florida                                  100.0%   Illinois                    72.0%
                                                            New Jersey                               100.0%   Nevada                      71.3%
                                                            Georgia                                  100.0%   Washington                  70.6%
                                                            North Carolina                           100.0%   New York                    66.9%
                                                            South Carolina                           100.0%   Ohio                        66.3%
                                                            Indiana                                   99.9%   Oklahoma                    45.2%
                                                            Rhode Island                              99.9%   Colorado                    40.4%
                                                            Virginia                                  99.9%   Utah                        35.0%
                                                            New Hampshire                             99.9%   Kansas                      31.3%
                                                            Massachusetts                             99.6%   Kentucky                    25.6%
                                                            Maryland                                  98.2%   Tennessee                   21.8%
                                                            Arizona                                   95.7%   West Virginia               13.7%
                                                            Texas                                     95.3%   Missouri                    10.3%
                                                            California                                94.6%   Iowa                         3.1%
                                                            Pennsylvania                              88.9%   Michigan                     2.2%

                                                                             We estimate ~72% of the total US population now has access
                                                                                         to same-day or next-day delivery.

Source: RBC Capital Markets, RBC Elements, Amazon website, Census Bureau

52                                                                                                                                                RBC Capital Markets
Amazon has patents for drone delivery from a blimp.. But that won’t happen anytime soon, right? Source: CNBC 53 RBC Capital Markets
But that won’t happen anytime soon, right?

54                                                RBC Capital Markets
Amazon will be shipping packages via drone in a matter of months

Source: Forbes, Amazon

55                                                                 RBC Capital Markets
Wrong, it’ll be here sooner than you think

                   Source: Google Images

56                                           RBC Capital Markets
Meet Moby—the 24-hour mobile convenience store that travels to the consumer or can be transported
easily without staff – currently being tested in Shanghai
Source: Moby
57 RBC Capital MarketsYeah, but that’s Shanghai… totally different market 58 RBC Capital Markets
Robomart can be hailed using an app and is currently operating in West Hollywood

Source: Roboticstomorrow.com

59                                                                                 RBC Capital Markets
Uber testing McDonald’s drone delivery…

Source: Uber, Techcrunch

60                                        RBC Capital Markets
Here’s Ford’s solution to “the last 50 feet”

Source: Ford, Bloomberg

61                                             RBC Capital Markets
Have you met FedEx SameDay Bot?

                                  Retailers on board for initial testing:

Source: FedEx, Fortune

62                                                                          RBC Capital Markets
Nuro, founded by former Google engineers, will focus on the last mile: groceries, laundry, packages, take-out, etc. Source: Roboticstomorrow.com 63 RBC Capital Markets
Are you ready for this?

Source: Google Images

64                        RBC Capital Markets
Samsung recently won a patent for smart lenses that can display anything, anywhere based on your
                                            preferences

Source: Patentlyapple.com, RBC Capital Markets

65                                                                                                                                             RBC Capital Markets
How about this?
Walmart and Amazon are looking to introduce virtual/augmented reality shopping.
Source: Yellrobot.com, RBC Capital Markets
66 RBC Capital MarketsMark Twain was a wise man – “History may not repeat, but it does rhyme” Source: Google Images, RBC Capital Markets 67 RBC Capital Markets
The Very Nature of Convenience is
                 Evolving

68                                       RBC Capital Markets
So shouldn’t the convenience store
industry evolve as well?
69 RBC Capital MarketsRight now these 3 items are the largest contributors to C-store traffic Source: Google Images 70 RBC Capital Markets
We’ve known that the gas and cigarette categories are in structural decline, but up until now you’ve had the option to kick the can down the
road
US Industry Volume Y/Y
0.0% 0.0% 0.0%
0.0%
-1.0% -0.5%
-1.0% -1.0%
-2.0%
-3.0% -2.5%
-3.0%-3.0% -3.0%
-4.0% -3.5% -3.5% -3.5% -3.5%
-5.0% -4.5% -4.5% -4.5% -4.5%
-5.0%-5.0%
-6.0% -5.5% -5.5%
-6.0%
-7.0%
4Q'14
1Q'15
2Q'15
3Q'15
4Q'15
1Q'16
2Q'16
3Q'16
4Q'16
1Q'17
2Q'17
3Q'17
4Q'17
1Q'18
2Q'18
3Q'18
4Q'18
1Q'19
2Q'19
3Q'19
4Q'19
1Q'20
2Q'20
Total Domesic Industry Volume Y/Y 2-Year Average Historical Average
Source: McKinsey, Company Filings, RBC Capital Markets
71 RBC Capital MarketsA portion of the US workforce will continue to work remotely either part or full time – meaning less time spent commuting (more time available
to prepare meals) and the potential to transfer at least some of the weekly lunch occasions in home
A recent survey of 317 CFOs suggests 74% have plans to permanently shift at least a portion of
their workforce to remote work; 13% of CFOs have already cut real estate expenses with another
9% planning cuts in the months to come.
What percentage of your workforce will remain permanently remote post-
COVID who were not remote beforehand?
30%
27%
26%
25%
25%
20%
17%
15%
10%
4%
5%
2%
0%
0% 5% 10% 20% 50% >50%
Source: Gartner, press release April 3, 2020
72 RBC Capital MarketsMaybe it’s time to transition from “just in time” to “just in case” Source: Google Images, RBC Capital Markets 73 RBC Capital Markets
“Judy” quick evacuation kits in the Southeast during hurricane season or in the west during forest fire season?

Source: Judy, RBC Capital Markets

74                                                                                                                RBC Capital Markets
Maybe you have more space than you think…

Source: Cartstack

75                                          RBC Capital Markets
Seek unique partnerships

                  Source: Kroger/Walgreens, RBC Capital Markets

76                                                                RBC Capital Markets
Kroger produce, meat, eggs, milk and more to select Walgreens locations Source: Kroger/Walgreens, RBC Capital Markets 77 RBC Capital Markets
Walgreens health and beauty at Kroger

Source: Kroger/Walgreens, RBC Capital Markets

78                                              RBC Capital Markets
After all, you have the advantage from a geographical/frequency standpoint

                                                                                                                  # of Mass Merchandise
                                                       # of Convenience Stores in US
                                                                                                                       Retailers in US
                                                                 152,720
                                                                                                                           8,329

Source: NACS, Statista, RBC Capital Markets – NOTE – Mass stores defined as Wal-Mart + Target + Amazon + Costco

79                                                                                                                                        RBC Capital Markets
Is technology the solution? At least half of frequent C-Store shoppers want more digital offerings, including automated check-outs and ordering online Source: Statista 80 RBC Capital Markets
Most people are misguided in believing that the checkout (or lack thereof) is the disruption…

                   Source: Google Images, RBC Capital Markets

81                                                                                              RBC Capital Markets
…when in reality it is this Source: Google Images, RBC Capital Markets 82 RBC Capital Markets
A combination of artificial intelligence, computer vision, and data pulled from multiple sensors

Source: Google Images

83                                                                                                 RBC Capital Markets
What does this mean? They will know your: Your purchase history What time you enter the store and leave What items you picked up and for how long you held each product How many times you came back to an item What areas of the store you spent the most time in How promotions affected your basket What brand clothes, hats, shoes you wear 84 RBC Capital Markets
Suddenly this doesn’t seem hard to imagine…

                                              Your Cart:
                                              • Charcoal
                                              • Hot Dogs

                                              Your Promotions:

                                              •   $1.00 off ketchup

                                              •   $0.30 off relish

                                              •   $1.65 off mustard

Source: Google Images, RBC Capital Markets

85                                                                    RBC Capital Markets
Imagine.. Being able to offer different promotions to different people based on all of this accumulated data Being able to avoid giving promotions to customers who would have bought the product anyway at full price Knowing the likelihood that these personalized promotions will influence a consumer to buy Having visibility into top and bottom lines 86 RBC Capital Markets
Category Level Lightning Round
Beverage Alcohol, Tobacco, Candy/Confection/Snacking, Food Service
Beverage Alcohol
− Need to go all in on hard seltzer
− Uncork the wine opportunity – partner with food service
− Shoppers are moving to other channels to buy beverage alcohol…will larger pack sizes help?
Tobacco
− Is “white nicotine” the hard seltzer of the tobacco category?
− Low income consumers negatively impacted by COVID more than the average consumer
− Excise taxes are a risk
Candy/Confection/Snacking
− Rethink pack size assortment (more larger bags)
− Occasion-based kits (smores, movie night, seasonal, etc)
− Leverage candy/confection category to be the dessert option for food service business
− Do you really understand consumption patterns across the entire snacking wheel (could free up space that could
be more productive)?
Food Service
− Capitalize on the near-term opportunity of orphaned restaurant spend
− Upgrade the menu/packaging – start building the food service brand NOW (leverage this window of opportunity)
− Partner with local restaurants that are struggling due to the pandemic
− Invest in digital assets (owned apps)
88 RBC Capital MarketsRequired Disclosures
Conflicts Disclosures
The analyst(s) responsible for preparing this research report received compensation that is based upon various factors, including total revenues of the member
companies of RBC Capital Markets and its affiliates, a portion of which are or have been generated by investment banking activities of the member companies of
RBC Capital Markets and its affiliates.
Distribution of Ratings
For the purpose of ratings distributions, regulatory rules require member firms to assign ratings to one of three rating categories - Buy, Hold/Neutral, or Sell -
regardless of a firm's own rating categories. Although RBC Capital Markets' ratings of Outperform (O), Sector Perform (SP), and Underperform (U) most closely
correspond to Buy, Hold/Neutral and Sell, respectively, the meanings are not the same because our ratings are determined on a relative basis.
89 RBC Capital MarketsRequired Disclosures
Conflicts Policy
RBC Capital Markets Policy for Managing Conflicts of Interest in Relation to Investment Research is available from us on request. To access our current policy,
clients should refer to https://www.rbccm.com/global/file-414164.pdf or send a request to RBC CM Research Publishing, P.O. Box 50, 200 Bay Street, Royal Bank
Plaza, 29th Floor, South Tower, Toronto, Ontario M5J 2W7. We reserve the right to amend or supplement this policy at any time.
Dissemination of research and short-term trade ideas
RBC Capital Markets endeavors to make all reasonable efforts to provide research simultaneously to all eligible clients, having regard to local time zones in overseas
jurisdictions. RBC Capital Markets' equity research is posted to our proprietary website to ensure eligible clients receive coverage initiations and changes in ratings,
targets and opinions in a timely manner. Additional distribution may be done by the sales personnel via email, fax, or other electronic means, or regular mail. Clients
may also receive our research via third party vendors. RBC Capital Markets also provides eligible clients with access to SPARC on the Firm’s proprietary INSIGHT
website, via email and via third-party vendors. SPARC contains market color and commentary regarding subject companies on which the Firm currently provides
equity research coverage. Research Analysts may, from time to time, include short-term trade ideas in research reports and / or in SPARC. A short-term trade idea
offers a short-term view on how a security may trade, based on market and trading events, and the resulting trading opportunity that may be available. A short-term
trade idea may differ from the price targets and recommendations in our published research reports reflecting the research analyst's views of the longer-term (one
year) prospects of the subject company, as a result of the differing time horizons, methodologies and/or other factors. Thus, it is possible that a subject company's
common equity that is considered a long-term 'Sector Perform' or even an 'Underperform' might present a short-term buying opportunity as a result of temporary
selling pressure in the market; conversely, a subject company's common equity rated a long-term 'Outperform' could be considered susceptible to a short-term
downward price correction. Short-term trade ideas are not ratings, nor are they part of any ratings system, and the firm generally does not intend, nor undertakes any
obligation, to maintain or update short-term trade ideas. Short-term trade ideas may not be suitable for all investors and have not been tailored to individual investor
circumstances and objectives, and investors should make their own independent decisions regarding any securities or strategies discussed herein. Please contact
your investment advisor or institutional salesperson for more information regarding RBC Capital Markets' research.
For a list of all recommendations on the company that were disseminated during the prior 12-month period, please click on the following link:
https://rbcnew.bluematrix.com/sellside/MAR.action
The 12 month history of SPARCs can be viewed at https://www.rbcinsightresearch.com/.
Analyst Certification
All of the views expressed in this report accurately reflect the personal views of the responsible analyst(s) about any and all of the subject securities or issuers. No
part of the compensation of the responsible analyst(s) named herein is, or will be, directly or indirectly, related to the specific recommendations or views expressed by
the responsible analyst(s) in this report.
Third-party-disclaimers
The Global Industry Classification Standard (“GICS”) was developed by and is the exclusive property and a service mark of MSCI Inc. (“MSCI”) and Standard & Poor’s Financial Services LLC (“S&P”) and is licensed for use by RBC.
Neither MSCI, S&P, nor any other party involved in making or compiling the GICS or any GICS classifications makes any express or implied warranties or representations with respect to such standard or classification (or the results to
be obtained by the use thereof), and all such parties hereby expressly disclaim all warranties of originality, accuracy, completeness, merchantability and fitness for a particular purpose with respect to any of such standard or
classification. Without limiting any of the foregoing, in no event shall MSCI, S&P, any of their affiliates or any third party involved in making or compiling the GICS or any GICS classifications have any liability for any direct, indirect,
special, punitive, consequential or any other damages (including lost profits) even if notified of the possibility of such damages.
RBC Capital Markets disclaims all warranties of originality, accuracy, completeness, merchantability or fitness for a particular purpose with respect to any statements made to the media or via social media that are in turn quoted in this
report, or otherwise reproduced graphically for informational purposes.
References herein to “LIBOR”, “LIBO Rate”, “L” or other LIBOR abbreviations means the London interbank offered rate as administered by ICE Benchmark Administration (or any other person that takes over the administration of such
rate).
90 RBC Capital MarketsDisclaimer
RBC Capital Markets is the business name used by certain branches and subsidiaries of the Royal Bank of Canada, including RBC Dominion Securities Inc., RBC Capital Markets, LLC, RBC Europe Limited,
RBC Capital Markets (Europe) GmbH, Royal Bank of Canada, Hong Kong Branch and Royal Bank of Canada, Sydney Branch. The information contained in this report has been compiled by RBC Capital
Markets from sources believed to be reliable, but no representation or warranty, express or implied, is made by Royal Bank of Canada, RBC Capital Markets, its affiliates or any other person as to its accuracy,
completeness or correctness. All opinions and estimates contained in this report constitute RBC Capital Markets' judgement as of the date of this report, are subject to change without notice and are provided in
good faith but without legal responsibility. Nothing in this report constitutes legal, accounting or tax advice or individually tailored investment advice. This material is prepared for general circulation to clients and
has been prepared without regard to the individual financial circumstances and objectives of persons who receive it. The investments or services contained in this report may not be suitable for you and it is
recommended that you consult an independent investment advisor if you are in doubt about the suitability of such investments or services. This report is not an offer to sell or a solicitation of an offer to buy any
securities. Past performance is not a guide to future performance, future returns are not guaranteed, and a loss of original capital may occur. RBC Capital Markets research analyst compensation is based in part
on the overall profitability of RBC Capital Markets, which includes profits attributable to investment banking revenues. Every province in Canada, state in the U.S., and most countries throughout the world have
their own laws regulating the types of securities and other investment products which may be offered to their residents, as well as the process for doing so. As a result, the securities discussed in this report may
not be eligible for sale in some jurisdictions. RBC Capital Markets may be restricted from publishing research reports, from time to time, due to regulatory restrictions and/ or internal compliance policies. If this is
the case, the latest published research reports available to clients may not reflect recent material changes in the applicable industry and/or applicable subject companies. RBC Capital Markets research reports
are current only as of the date set forth on the research reports. This report is not, and under no circumstances should be construed as, a solicitation to act as securities broker or dealer in any jurisdiction by any
person or company that is not legally permitted to carry on the business of a securities broker or dealer in that jurisdiction. To the full extent permitted by law neither RBC Capital Markets nor any of its affiliates,
nor any other person, accepts any liability whatsoever for any direct, indirect or consequential loss arising from, or in connection with, any use of this report or the information contained herein. No matter
contained in this document may be reproduced or copied by any means without the prior written consent of RBC Capital Markets in each instance.
Additional information is available on request.
To U.S. Residents: This publication has been approved by RBC Capital Markets, LLC (member FINRA, NYSE, SIPC), which is a U.S. registered broker-dealer and which accepts responsibility for this report
and its dissemination in the United States. Any U.S. recipient of this report that is not a registered broker-dealer or a bank acting in a broker or dealer capacity and that wishes further information regarding, or to
effect any transaction in, any of the securities discussed in this report, should contact and place orders with RBC Capital Markets, LLC.
To Canadian Residents: This publication has been approved by RBC Dominion Securities Inc. (member IIROC). Any Canadian recipient of this report that is not a Designated Institution in Ontario, an
Accredited Investor in British Columbia or Alberta or a Sophisticated Purchaser in Quebec (or similar permitted purchaser in any other province) and that wishes further information regarding, or to effect any
transaction in, any of the securities discussed in this report should contact and place orders with RBC Dominion Securities Inc., which, without in any way limiting the foregoing, accepts responsibility for this
report and its dissemination in Canada.
To U.K. Residents: This publication has been approved by RBC Europe Limited ('RBCEL') which is authorized by the Prudential Regulation Authority and regulated by the Financial Conduct Authority ('FCA')
and the Prudential Regulation Authority, in connection with its distribution in the United Kingdom. This material is not for general distribution in the United Kingdom to retail clients, as defined under the rules of
the FCA. RBCEL accepts responsibility for this report and its dissemination in the United Kingdom.
To EEA Residents: This material is distributed in the EU by either RBCEL on an authorised cross-border basis, or by RBC Capital Markets (Europe) GmbH (RBC EG) which is authorised and regulated in
Germany by the Bundesanstalt für Finanzdienstleistungsaufsicht (German Federal Financial Supervisory Authority) (BaFin).
To Persons Receiving This Advice in Australia: This material has been distributed in Australia by Royal Bank of Canada, Sydney Branch (ABN 86 076 940 880, AFSL No. 246521). This material has been
prepared for general circulation and does not take into account the objectives, financial situation or needs of any recipient. Accordingly, any recipient should, before acting on this material, consider the
appropriateness of this material having regard to their objectives, financial situation and needs. If this material relates to the acquisition or possible acquisition of a particular financial product, a recipient in
Australia should obtain any relevant disclosure document prepared in respect of that product and consider that document before making any decision about whether to acquire the product. This research report
is not for retail investors as defined in section 761G of the Corporations Act.
To Hong Kong Residents: To Hong Kong Residents: This publication is distributed in Hong Kong by Royal Bank of Canada, Hong Kong Branch, which is regulated by the Hong Kong Monetary Authority and
the Securities and Futures Commission (SFC) in Hong Kong, RBC Investment Services (Asia) Limited and RBC Global Asset Management (Asia) Limited, both entities are regulated by the SFC. This material is
not for general distribution in Hong Kong to persons who are not professional investors (as defined in the Securities and Futures Ordinance of Hong Kong (Cap. 571) and any rules made thereunder.
To Singapore Residents: This publication is distributed in Singapore by the Royal Bank of Canada, Singapore Branch, a registered entity licensed by the Monetary Authority of Singapore. This material has
been prepared for general circulation and does not take into account the objectives, financial situation, or needs of any recipient. You are advised to seek independent advice from a financial adviser before
purchasing any product. If you do not obtain independent advice, you should consider whether the product is suitable for you. Past performance is not indicative of future performance. If you have any questions
related to this publication, please contact the Royal Bank of Canada, Singapore Branch. Royal Bank of Canada, Singapore Branch accepts responsibility for this report and its dissemination in Singapore.
To Japanese Residents: Unless otherwise exempted by Japanese law, this publication is distributed in Japan by or through RBC Capital Markets (Japan) Ltd. which is a Financial Instruments Firm registered
with the Kanto Local Financial Bureau (Registered number 203) and a member of the Japan Securities Dealers Association (“JSDA”) and the Financial Futures Association of Japan (“FFAJ”).
® Registered trademark of Royal Bank of Canada. RBC Capital Markets is a trademark of Royal Bank of Canada. Used under license.
Copyright © RBC Capital Markets, LLC 2021 - Member SIPC
Copyright © RBC Dominion Securities Inc. 2021 - Member Canadian Investor Protection Fund
Copyright © RBC Europe Limited 2021
Copyright © Royal Bank of Canada 2021
All rights reserved
91 RBC Capital MarketsSECTION 3
Crossmark Perspectives
© 2021 Information Resources Inc. (IRI). Confidential and Proprietary. 92INTERSECTION OF RETAILERS, DISTRIBUTORS AND CLIENTS
932021 – A REPEAT OF 2020?
Current Trends
In-Store Updates
• Delays in Schematics, Resets
• Focus on the Core Business – Staying In-Stock
• Focus on PPE
• Ensuring Employee/Customer Safety
942021 – A REPEAT OF 2020?
Current Trends
Compliance with Federal and Local Mandates
Social Distancing = Fewer Displays In-Store
Limits on Foodservice Offering = Lower Volume
Cleanliness and Sanitation = Increased In-Store Labor
Store Closures and/or Reduced Store Hours
952021 – A REPEAT OF 2020?
Current Trends
Slower than Normal Business Process
• Annual Business Agreements
• Innovation Acceptance
• Program Activation
• Reduced Resources/Admin Support
• Product Mix/Profitability
• Unpredictable Cash Flow
• Steady Supply Chain
962021 REASONS TO BELIEVE
Resiliency of the Convenience Channel
Weather, Social Disruption, Natural Disasters, The Economy, Regulations and Energy
Retail Chains
- Innovation
• E-Comm – Expanding App Capabilities
• Self Check-out
• Contactless Commerce
• Delivery
• Curb-side Pick-up
972021 REASONS TO BELIEVE
Resiliency of the Convenience Channel
Weather, Social Disruption, Natural Disasters, The Economy, Regulations and Energy
Distributors
- Virtual Trade Shows
Independents
- 100,406 Single or Multi-Unit Owners
- Working to serve their local communities
98QUESTIONS
&ANSWERS
© 2021 Information Resources Inc. (IRI). Confidential and Proprietary. 99Contact Us
Krishnakumar (KK) Davey Nik Modi Jeff Neihart Kennith Fries
President, Managing Director, Beverages, Vice President & GM, Vice President,
Strategic Analytics Tobacco & Household Personal Care Client Development C-Stores
IRI RBC Capital Markets Crossmark Crossmark
Krishnakumar.Davey@iriworldwide.com nik.modi@rbccm.com Jeff.Neihart@crossmark.com Kennith.Fries@crossmark.com
(732) 713-3446 (212) 905-5993 (469) 814-1232 (469) 331-4461
© 2021 Information Resources Inc. (IRI). Confidential and Proprietary. 100You can also read