Deleveraging Europe 2019: Focus on France - October 2019 - PATRIMOINE24
←
→
Page content transcription
If your browser does not render page correctly, please read the page content below

Deleveraging Europe 2019:
Focus on France
October 2019

Deleveraging Europe 2019: Focus on France

Executive summary
The European loan portfolio market marked a record year with more than €200bn traded
in 2018. The contribution of the French market was underwhelming. But why? Healthy
economic indicators, a significant market size, regulatory pressure and a robust legal
environment along with a scaling loan servicing landscape and progress in data quality
make France an attractive market for investing in distressed assets.

Readiness                                   Readiness                                  Readiness

Macroeconomic                               Market landscape                           Legal and regulatory
environment                                 With the second largest pool of non-       environment
Despite a recent tempering in economic      performing loans (NPL) in Europe,          The legal and regulatory framework
outlook, the French market has seen         and despite an NPL ratio below             in France supports effective NPL
sustained growth in recent years            the European average, pressure             resolution. The implementation of
with confidence returning. While less       is mounting on French banks to             macro prudential regulation and
impacted than other countries following     deleverage. Growing loan activity          supervisory guidance across the
the global financial crisis, France still   fueled by low interest rates combined      banking system, a balanced and
maintains a high public and private debt    with restrained loan sales positions       efficient legal system and the current
level. The macroeconomic outlook is         France to overtake more saturated          political stability favour the French NPL
conducive to attracting investors to the    markets, justifying the challenges faced   market.
distressed assets space.                    by investors entering a new market.

Readiness                                   Readiness

Quality of information                      Servicing capacity
Collection and reporting of key NPL         Despite historically low NPL sales,
information is a challenging area in        the debt servicing infrastructure is
France, but it is gradually improving.      relatively developed with the presence
While the banking system provides           of six of the top 10 European credit
for consistent loan classification and      management players. Until now,
NPL identification, key measures on         most NPL trades have gone to local
information quality have not been           debt purchasers who service their
systemically implemented. As NPL sales      own assets. Still, a few international
increase, the quality and volume of         distressed asset funds are venturing
information made available to potential     into the market and larger foreign
investors has improved.                     investors are waiting on the sidelines
                                            for the first signs of market growth.
02
Brochure / report title goes here |
                                                                    Section title goes here

Contents

Macroeconomic environment   04
Market landscape            08
Legal and regulatory        16
Quality of information      29
Servicing capacity          32
What’s next?                39
Contacts                    40

                                                                                         03
Deleveraging Europe 2019: Focus on France

        Macroeconomic
        environment
            Notwithstanding a slump in           implemented a countercyclical
            the economic forecast, France        capital buffer (CCyB) to mitigate
            is posting GDP growth aligned        the risk of recession, the number
            with the European average            of individual and corporate
            and an unemployment rate             bankruptcies decreased.
            that declined for the fourth         Macroeconomic policies, alongside
            consecutive year. Lending to         limited NPL resolution, have
            households and corporates            produced a significant quantity of
            continued to increase at a 6%        distressed assets to spur market
            rate in 2018, and while the French   development.
            banking supervisory authorities
04
Deleveraging Europe: Focus on France | Non-performing loan market in France
Deleveraging Europe 2019: Focus on France
Deleveraging Europe: Focus on France | Non-performing loan market in France
French economic
French economic indicators
indicators
French economic indicators
Following real GPD growth of 2.3% Nominal GDP growth
Nominal GDP growth
inFollowing
2017, the real GDP growth of 2.3% in
highest level in the six
2017, the years,
previous highest French
level in the six previous
economic 3%
years, French
growth was more economicsubduedgrowthinwas 2018 at
Following real GPD growth of 2.3% Nominal GDP growth
1.7%. Social unrest
more subdued in 2018that at 1.7%.started
Social at
in
the 2017,
endthat
unrest the
of 2018 highest
starteddisrupted level in
at the end economic the
of 2018 six
previous
activities years,protests
French continuing
economic (1%)
disruptedwith economic activities with 3%
growth
into 2019,wasresulting
more subdued in a in 2018 at
decreased
protests continuing into 2019, resulting
1.7%.
GDP Socialforecast
growth unrest that of 1.3%started forofat
in aend
the decreased GDP growth forecast
2019. Anofeconomic
2018 disrupted
slowdown economic
is (5%)
1.3% for 2019.
activities with An economic
protests slowdown is
continuing (1%)
widespread among European 2006
2007
2008
2009
2010
2011
2012
2013
2014
2015
2016
2017
2018
widespread
into
GDP
2019,
growth
the GDP of the
p.5
among European
resulting
countries as the GDP of the Euro
forecast
Euro area
in a countries as
decreased
ofincreased
1.3% forby 1.9%
area increased by 1.9% in 2018, (1)
2019.
in 2018, Ancompared
economic toin slowdown
2.4% in 2017.is France Euro area
compared to 2.4% 2017. (5%)
widespread among European
2006
2007
2008
2009
2010
2011
2012
2013
2014
2015
2016
2017
2018
Note:
Note: (1) (1 ) Euro area includes 19 countries
Euro area includes 19 countries
countries as the GDP of the Euro Source: Eurostat
Source: Eurostat
area increased by 1.9% in 2018, (1)
France Euro area
compared to 2.4% in 2017.
Note: (1 ) Euro arearate
Unemployment
Unemployment
includes 19 countries rate
A Adecreasing
decreasing trend trend in in
thetheunemployment
Source: Eurostat
unemployment
rate was observed rate
acrosswasmost observed
European
12%
across
countries most withEuropean
unemployment countriesdecreasing 12%
with
fromunemployment
12% in 2013 to 8.2% decreasing
in 2018 in the Unemployment rate
A decreasing
from 12% trend
in 2013 in the
toKingdom
8.2% in 2018
Euro area.
unemployment The United
rate is driving
in the Euro area. Thewas Unitedobserved
the improvement
across most with levels
European significantly
countries
Kingdom is driving the 8%
12%
below
with that of
unemployment other European
decreasing countries. 8%
improvement with levels
from 12% in
The French
significantly 2013 to
unemployment
below that 8.2%ofrate in
other 2018
declined
in the Euro area. The
European countries. The French at
for the fourth consecutive United
year, but,
Kingdom
9.1%, remains
unemployment is driving
above the
ratethe Euro area
declined foraverage
the 4%
8%
2006 2006
2007 2007
2008 2008
2009 2009
2010 2010
2011
2012
2013
2014
2015
2016
2017
2018
improvement
fourth consecutive
and represents with levels
year,highest
the fourth but atrate in
significantly
9.1% remains below
above that theofEurootherarea 4%
Europe behind Greece, Spain and Italy.
European countries. The French
2011
2012
2013
2014
2015
2016
2017
2018
average and represents the fourth France Euro area (1)
unemployment rate declined for the 4%
highest rate in Europe, behind
2006
2007
2008
2009
2010
2011
2012
2013
2014
2015
2016
2017
2018
Note: (1 ) Euro area includes 19 countries
fourth
Greece,consecutive
Spain and Italy. year, but at Source: Eurostat (1 )
9.1% remains above the Euro area France Euro area
average and represents the fourth France Euro area (1)
Note:
Note:
(1)
Euro (1)area includes 19 countries
Euro area includes 19 countries
highest rate in Europe, behind Note:
Source:(1 ) Euro area includes 19 countries
Eurostat
Source: Eurostat
Greece, Spain and Italy. Source: Eurostat Gross public debt level (% GDP)
Gross public debt in France reached
€2.3 trillion at the end of 2018 100%
Gross public debt in France reached €2.3 Gross public debt level (% GDP)
representing 98% of GDP. This
trillion at the end of 2018, representing Gross public debt level (% GDP)
upward trend since the 2008 financial
Gross
98% of public
GDP. This debt in France
upward trend reached
since 80%
crisis results in France having thethe 100%
€2.3
2008trillion
sixth financial
highest atgross
the results
crisis end
public ofin2018
Franceinhaving
debt
representing
the sixthIn
Europe. highest 98% gross
contrast, of levels
GDP. debt
public This in
decreased 60%
upward
inEurope.
the Unitedtrend sincelevels
In contrast,
Kingdom thebetween
2008 financial
decreased in the
2016 80%
crisis
and
United
results
2018 by in
Kingdom 0.6%Franceandhaving
between in the
2016 and
the
rest
2018 of
sixth
the highest gross public debt in 40%
by Euro
0.6% and area by rest
in the 2.3%. of the Euro area by
2006
2007
2008
2009
2010
2011
2012
2013
2014
2015
2016
2017
2018
Europe. In contrast, levels decreased 60%
2.3%. © 2019 Deloitte SAS. Document Confidentiel Masq
in the United Kingdom between 2016
and 2018 by 0.6% and in the rest of (1)
France Euro area
the Euro area by 2.3%. 40%
2006
2007
2008
2009
2010
2011
2012
2013
2014
2015
2016
2017
2018
Note: (1 ) Euro area includes 19 countries
Source: Eurostat
(1) 5
France Euro area
Note:
Note: (1)
EuroEuro
(1 )
areaarea includes
includes 19 countries
19 countries
Source: Eurostat
Source: Eurostat 5
05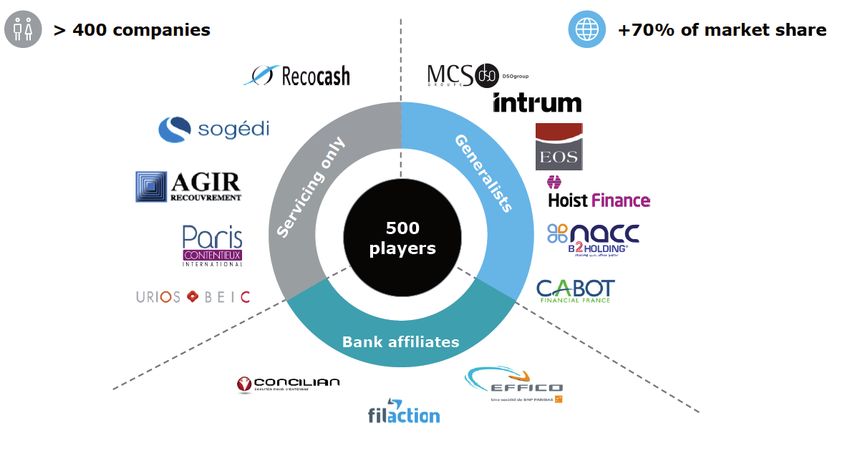
Deleveraging Europe 2019: Focus on France

            Dynamic credit conditions
                                   p.6 and the countercyclical buffer

            Lending to households and non-financial               Consumer/ Corporate lending and ECB refinancing rate (YoY growth)
            companies continued to increase in 2018,
            with an annual growth rate of 6% between               16%
            Dec-17 and Dec-18, propelled by the low
            interest rate environment.                             12%

            The French supervisory authorities first
                                                                     8%
            employed a countercyclical capital buffer
            in Jun-18 when they raised the buffer from
                                                                     4%
            zero to 0.25% of Risk Weighted Assets
            (RWA). As a result of the high credit to GDP
                                                                         -
            gap, the CCyB will be increased to 0.5%
            from Apr-20.                                          ( 4%)
                                                                       2008            2009        2010     2011   2012   2013   2014    2015     2016   2017    2018
            Other euro area countries introduced
            similar buffers with Germany announcing                                           Consumer financing                  Corporate financing

            a 0.25% buffer, applicable as of Jul-20
                                                              p.6(2)
                                                                Source: Banque de France and ECB
                                                                  Source: Banque de France and ECB
            in an effort to hedge against recession
            uncertainty.
            Despite the safeguarding actions,
            continued growth in consumer and
            corporate lending in France may slow as               Evolution of CCyB notified to ESRB (Jul-19)
                                                           © 2019 Deloitte SAS. Document Confidentiel                                                                   Masque Deloitte 4:3 p

            an economic downturn could lead to a
            renewed credit crunch.

                                                                                                                                         IS
                                                                                                                                         1.75%
                                                                                                                      CZ
                                                                                                                      1.5%
                                                                              SK
                                                                              1.25%
                                                                                                        GB                               LT               IE
                                                                                                        1.0%                             1.0%             1.0%

                                                                                                                                                                FR
                                                                                                                                                                0.25%

                                                                          T3 2018                       T4 2018      T1 2019            T2 2019          T3 2019
                                                                                                                   Date of last update

                                                                  Note: Upward/stable arrow represents increase/stability of the CCyB at the date of last
                                                                  update
                                                                  Source: European Systemic Risk Board (ESRB)

                                                              © 2019 Deloitte SAS. Document Confidentiel                                                                         Masque De

06
Deleveraging Europe 2019: Focus on France
p.7 bankruptcies
Consumer and corporate
The number of corporate bankruptcies in Corporate bankruptcies by company size (000)
France remained largely stable between
2017 and 2018 at 54,000. Bankruptcies 70 63 63 62 63
60 60 61
are triggered by micro-enterprises and 56 58
60 54 54
very small enterprises (VSE), representing
50
on average 98% of total corporate
bankruptcies. Small and medium 40
entreprises (SME) and large corporates 30
made up the remainder with 1,149 and 20
39 bankruptcies, respectively, in 2018.
10
Outstanding loans of companies filing for
0
bankruptcy in 2018 represented 0.3% of 2008 2009 2010 2011 2012 2013 2014 2015 2016 2017 2018
total outstanding loans in France. VSE SME Large corporate
Despite a downward trend since 2015, the p.7 (2)
number of bankruptcies is expected to Note: Company size is defined according to legal units
marginally increase in 2019 as the global Source: Banque de France
economy is facing difficulties.
© 2019 Deloitte SAS. Document Confidentiel Masque Deloitte 4:3 p
The number of households applying to the Household overindebtedness (000)
Banque de France (BDF) overindebtedness
plan continued to decrease in 2018 to 218
232
221 223 231
240 216 217
163,000, of which 91% were considered 194
200 188 181
eligible for assistance from the household 163
debt commission. This level, which has not 160
been observed since 2003, represents 120
€35 billion of overindebtedness
80
outstanding. The sharp decrease in the
last four years is attributable in part to the 40
low interest rate environment and public -
2008 2009 2010 2011 2012 2013 2014 2015 2016 2017 2018
policies that better protect households
Source: Banque de France
against abusive lending practices.
Source: Banque de France
© 2019 Deloitte SAS. Document Confidentiel Masque Deloitte 4:3
07Deleveraging Europe 2019: Focus on France
Market
landscape
With the second largest NPL Coupled with regulatory
pool in Europe and emerging pressure, profitability underpins
deleveraging activity, France is on banks’ reinforced focus on NPL
course to have the highest NPL resolution strategies. Meanwhile,
stock in Europe. While the large run-off banks are continuing
French banking groups that share the wind-down of their assets,
85% of the market are decreasing and smaller players, such as
NPL volumes outside of France, consumer captives and Fintechs
the stock of French distressed with growing distressed assets,
assets has been stagnant over the will bring small and mid-sized
past five years. portfolios to market.
08Deleveraging Europe 2019: Focus on France
p.9
France in the context of European NPLs
France has consistently maintained an €636bn stock of NPLs held by European banks (Jun-19)
NPL ratio below the European average,
140 45%
decreasing further since Mar-15 to 40%
120
reach 2.6% as at Jun-19. In contrast, the 35%
100
corresponding NPL outstanding held by 30%
French banks remains the second largest 80 25%
20%
stock in Europe after Italy. While French 60
15%
banks decreased their NPL exposure to 40
3.0% 10%
€124 billion as at Jun-19 from €140bn as at 20 European
a ve ra ge 5%
Jun-17, this was driven by large NPL sales in 0 0%
other European jurisdictions and, notably,
IT FR ES GR GB NL DE PT BE AT DK IE FI CY PL SE NO HU HR LU
in Italy.
NPLs (€bn) NPL ratio
Note: The graph presents only the top 20 European countries in terms of gross NPL
stock, whereas the European average includes data for all European countries
Source: European Banking Authority Risk Dashboard 2Q 2019
p.9 (2)
Contrary to the €124 billion NPLs held by NPLs and provisioning ratio in France (€bn)
French banks, the stock of non-performing
loans owned in France totaled €70 billion as
at Dec-18, a level that has remained stable 80 60%
over the last five years. Banks’ provisioning
ratio, intended to cover prospective losses © 201960Deloitte SAS. Document Confidentiel 50%
on NPLs, increased to 51% in 2018, a 2%
40 40%
year-over-year (YoY) variance. Recent EU-
wide regulatory guidelines will undoubtedly
20 30%
have an impact on the provisioning ratio as
banks are directed to provision unsecured
- 20%
NPLs at 100% three years after default. 2008 2009 2010 2011 2012 2013 2014 2015 2016 2017 2018
With NPL resolution strategies targeting a Gross NPL Provisioning Ratio
rapid clean-up of banks’ balance sheets, Source: Banque de France
Source: Banque de France
an acceleration of NPL disposals is forecast
despite the overall low NPL ratio in France.
© 2019 Deloitte SAS. Document Confidentiel Masque Deloitte 4:3 pour
09Deleveraging Europe 2019: Focus on France
The French banking landscape
The French banking market consists of centralised, banking groups, which account for over 85% of market
mutual and cooperative banking groups, consumer share. The level of centralisation is a key factor in NPL
finance companies, foreign and independent banks, disposal maturity, while regional banks are frequent
Fintech companies and consumer captives. The seemingly sellers of small portfolios via limited auction processes
fragmented market is in fact dominated by the top six or bilateral transactions.
+85% of the French banking market
Centralised Mutual & Consumer Foreign/
New players/ Consumer
Category banking cooperative finance independent
Fintechs captives
groups banking groups companies banks
Examples
Mortgage Mortgage Mortgage Mortgage Mortgage Mortgage
Credit Consumer Consumer Consumer Consumer Consumer Consumer
offering SME SME SME SME SME SME
Corporate Corporate Corporate Corporate Corporate Corporate
- + - + - + - + - + - +
Size
Centralised - + - + - + - + - + - +
NPL sale - + - + - + - + - + - +
activity
Source: Deloitte analysis
10Deleveraging Europe 2019: Focus on France
The six largest French banks dominate the French As retail banking represented 63% of aggregated NBI in
banking market: BNP Paribas (BNPP), Société Générale 2018, NPL monitoring and delinquency resolution are
(SG), BPCE Group (BPCE), Crédit Agricole Group (CAG), key components of profitability. A significant NPL stock
Crédit Mutuel Alliance Fédérale Group (CMG) and La also affects operating performance as both human
Banque Postale (LBP). Despite disparities between capital and financial resources are engaged in credit
banks, the aggregated Net Banking Income (NBI) management procedures, thus curtailing new lending
of the top six increased by 0.9% between 2017 and activities.
2018 to reach €148bn in 2018. Overall, corporate and
investment banking revenue decreased by 6%, while
asset management and insurance and retail banking
activities increased by 6% and 1%, respectively.
p.11
Breakdown of the top six French banks NBI (2018)
• BNP Paribas • Société Générale • BPCE
14% 7%
20%
2018 32% 2018 2018
25%
€43bn
€43bn €25bn
€25bn 13% €24bn
€24bn
61% 61%
67%
• Crédit Agricole SA • Crédit Mutuel • La Banque Postale
16% 7%
20%
2018 6% 2018 2018
17% €33bn
€33bn €18bn
€18bn €6bn
€6bn
67%
74%
93%
Retail banking CIB Other activities
Source: Bank annual reports
© 2019 Deloitte SAS. Document Confidentiel Masque Deloitte 4:3 pour projection 9
11Deleveraging Europe 2019: Focus on France
p.12
p.12
Are French banks less profitable than their EU counterparts?
1.Cost
1. Costof
ofrisk
riskto
tototal
totalassets
assets(2018)
(2018)
Combined cost of risk (CoR) of the top six Cost of risk to total assets (2018)
French banks decreased by 6.4% between
2017 and 2018, as reductions in levels of 0.13%
0.13% 0.12%
0.12%
non-performing loans led to lower NPL ratios. 0.10%
0.10%
0.09%
0.09%
However, three banks still have a CoR to total 0.08%
0.08% 0.09%
0.09%
balance sheet ratio that is above the 2018
0.05%
0.05%
European median of 0.09%.
BNPP
BNPP SG
SG CAG
CAG BPCE
BPCE CMG
CMG LBP
LBP
Costofofrisk
Cost risktotoaverage
averagetotal
totalassets
assets Europeanmedian
European median
Source:
Source:
Source: Autorité
Autorité deContrôle
Contrôle
de contrôle
Autorité de Prudentiel
prudentiel etde
deRésolution
Résolution
et de résolution
Prudentiel et (ACPR) (ACPR)
(ACPR)
2.Cost
2. Costtotoincome
incomeratio
ratio(2018)
(2018)
The cost to income ratio remains a leading Cost to income ratio (2018)
concern as it has continued to increase
79%
79%
since 2015. Operating expenses of French 71%
71% 70%
70%
73%
73%
banks, mainly under pressure from costly 65%
65% 65%
65%
restructuring plans, increased faster than their 64%
64%
net income in 2018. This resulted in a 0.8%
increase in the average cost to income ratio
of French banks to 70.2% in 2018, a level that
is on average 6% higher than the European
median.
BNPP
BNPP SG
SG CAG
CAG BPCE
BPCE CMG
CMG LBP
LBP
Costto
Cost toincome
incomeratio
ratio Europeanmedian
European median
Source:ACPR
Source:
Source: ACPR
ACPR
©©2019
2019Deloitte
DeloitteSAS.
SAS.Document
DocumentConfidentiel
Confidentiel
f risk to total assets (2018) 3. Return on equity (2018)
The profitability of the top French banks, Return on equity (2018)
measured by their Return on Equity (RoE),
increased to 6.7% in 2018 from 6.3% in 7.6% 7.1% 7.7%
6.8% 6.7% 7.5%
2017; however, French banks on the whole
3% remain less profitable than their European
0.12% 5.3%
counterparts. Similarly, the average Return
0.10%
0.09%
on Assets (RoA) of the same French sample
0.08% 0.09%
reached 0.38% in 2018, below the European
median of 0.51%. 0.05%
PP SG CAG BPCE CMG LBP
BNPP SG CAG BPCE CMG LBP
of risk to average total assets European median
Return on equity European median
e: Autorité de Contrôle Prudentiel et de Résolution (ACPR)
Source:
Source: ACPR
ACPR
o income ratio (2018)
12
79%
70% 73%
65% 65%Deleveraging Europe 2019: Focus on France
Gross NPL exposure held by top French banks
p.13
The cumulative NPLs of the six largest French 1. Gross
Gross NPL NPL
NPLs and and ratio
NPL (1)
ratio
(€bn,(€bn, Dec-18)
Dec-18)
banks totaled €112 billion as at Dec-18 with a
corresponding average NPL ratio of 3%, varying
p.13
among the French groups from 1.5% to 4.3%.
40 4.3% 5%
BNPP was the most exposed to credit risk with 3.6%
3.2% 3.0% 4%
1. Gross NPL and NPL ratio
€34 billion of NPL outstanding in 2018, and La(€bn, 30
Dec-18)
Banque Postale had the lowest level with NPLs
2.6%
3%
of just €1 billion.
40 4.3% 20 5%
The overall level of NPLs decreased further 34 1.5% 2%
for French banks as at Jun-19,3.6%
which should 4%23
30 3.2%10 3.0% 21
be reflected in the individual bank's exposure 18 1%
2.6% 14
once the results of the 2019 EU-wide 3% 1
20 exercise are published.
transparency - 0%
34 BNPP 1.5%
SG CAG
2% BPCE CMG LBP
10 23 21 Gross NPL NPL ratio
18 1%
14
Note: Gross NPLs of French banks held in France and abroad
(1)
1
Source: Company annual reports and financial statements
- 0% Hou
BNPP SG CAG BPCE CMG LBP 2%
5% Hou
Gross NPL NPL ratio 17%
Non-performing exposures are composed NPLs by loan type(1) (Jun-18) SME
26%
of residential mortgages and consumer
Household -Total NPL
Mortgage SME
loans, and SME and corporate loans in equal 2. NPL by loan type (June-18)
2% €86bn 17%
proportions. The only comparable measure 5% Household - Other SME
of this breakdown for the top five French 17%
banks is based on the Internal Rating-Based SME - Corporate Corp
26% 17% 11%
(IRB) reporting published by the EBA annually. 5% Corp
Total NPL SME - Mortgage
2. NPL
Defaulted by loan
exposures type
using (June-18)
this approach
€86bn 17%
totaled €86 billion as at Jun-18 and were SME - Other Publ
distributed evenly between household loans
(34%), SME loans (33%) and corporate loans Corporate - Large
17% 11%
(32%). 5% Corporate - Specialised lending
© 2019 Deloitte SAS. Document Confidentiel
Public sector
Note: (1) NPLs of BNPP, CAG, BPCE, SG and CMG owned in France and
abroad, based on the IRB approach i.e. banks’ own calculation model
© 2019 Deloitte SAS. Document Confidentiel Source: 2018 EU-wide transparency exercises - EBA Masque Deloitte 4:3 pour
13Deleveraging Europe 2019: Focus on France
A closer look at NPL stock beyond the top banking groups
p.14 (1)
A recoller, sans
logos
1.Selected
Selectedconsumer
consumercaptives
captives– Gross outstanding
- Gross outstandinginin
France (€bn, 2018)
France
€19bn €12bn €2bn €2bn €34bn
35 0.1 0.8
0.3 1.5
0.2 1.6
30
Non-performing
25 11.6 Performing
33.6
20
0.2
18.9
p.14 (2) 15
RCI Banque PSA Banque Carrefour Banque Banque Edel Total
A recoller, sans
logos
2. Banks in run-off - Gross outstanding in France
Banks in run-off – Gross outstanding in France (€bn, 2018)
€100bn €105bn(1 ) €13bn €218bn
220 1.3 4.7
11.6
180
104.7
Non-performing
140 212.8 Performing
3.3
100
96.4
60
p.14 (3)
Crédit Foncier Dexia Crédit Immobilier Total
de France
© 2019 Deloitte SAS. Document Confidentiel Masque Deloitte 4:3 pour projection 12
A recoller, sans
logos
Selected Fintechs
3. Selected – Gross
fintechs outstanding
- Gross in France
outstanding (€m, 2018)
in France
€203m €38m €32m €12m €285m
300 0.2
11.8 12.0
2.4
250 0.8 29.7
37.6
200 8.6
Non-performing
150
273.3 Performing
100 194.2
50
-
© 2019 Deloitte SAS. Document Confidentiel Masque Deloitte 4:3 pour projection 13
October LookandFin Credit.fr Bolden Total
Note: (1) The credit risk exposure of Dexia is displayed as gross loans, and NPL data were not available
Source: 2018 annual reports and company websites
14Deleveraging Europe 2019: Focus on France
Private debt in the French market and the breakdown of NPLs
by asset type
Outstanding retail and corporate loans (including Nearly half of this amount belongs to corporates
SME) in France totaled €2.2 trillion as at Dec-18 and (including SME) resulting in an NPL ratio of 3% for
are mainly comprised of retail mortgages (45%), whose this asset class. Consumer loans, which are generally
growth is stimulated by historically low interest rates. unsecured, make up 33% of bad debt and have the
The large corporate segment showed an increase highest NPL ratio at 11% (compared to 1.3% for retail
in corporate loans over the last five years, while mortgages).
consumer loans have remained stable in light of more The share of NPL stock has slightly decreased since
stringent regulation. 2014 and is driven almost entirely by consumer loans,
Retail and corporate NPL outstanding in France, a as the quality of debtors has improved and NPL sales
different measure than the total NPLs held by French have been focused on this asset class.
banks across Europe, totaled €68bn as at Dec-18.
Retail and corporate loans outstanding (€bn)
2 244
2 400 2 125
2 018
1 947
2 000 1 838 1 880 2 605
244
2 400 1 752 2 572
125
2 529
018
1 600 456 471 1 500
947
2 000 463 1 838 1 880
1 752 393 415
605
374 383 572
1 200 361 368 500 529
1 600 356 456 471 207 215
463 207 209 207 207
149 393 415
800 374 383
1 200 361 368
356
207
866 207
899 207
954 1 215
010
400 784 815
207 833
209
800 149
- 954 1 010
400 784
2012 815
2013 833
2014 866
2015 899
2016 2017 2018
- Mortgage Consumer SME Large corporate
2012 2013 2014 2015 2016 2017 2018
Note: Consumer
Note: Consumerincludes
includesnon-real
non-real estate loansto
estate loans toindividuals;
individuals; Large
Large corporate
corporate includes
includes
onlyonly
non-financial companies
Mortgage
non-financial companies Consumer SME Large corporate
Source: Banque de France
Note:Source: Banque
Consumer de France
includes non-real estate loans to individuals; Large corporate includes
only non-financial companies
Source: Banque de France72 74 73 72
80 and70
Retail corporate NPL outstanding (€bn) 70 68
80
60 72 74 73 72
70 33 70 68
32 33 34 34 33 32
60
40
32 33 33 34 34 33 32
27 27 28 26 24 22 23
40
20
12
27 11
27 28
13 13
26 14
24 14
22 13
23
20-
2012 2013 2014 2015 2016 2017 2018
12 11 13 13 14 14 13
- Mortgage Consumer Corporate
2012 2013 2014 2015 2016 2017 2018
Note: Consumer includes non-real estate loans to individuals; Corporate includes SME
and large corporate exposure
Mortgage Consumer Corporate
Source: Banque de France
Note: Consumer
Note: includes
Consumer includesnon-real estateloans
non-real estate loans
toto individuals;
individuals; Corporate
Corporate includes
includes SME
SME and
and large
largecorporate
corporate exposure
exposure
Source: Banque de France
Source: Banque de France
e SAS. Document Confidentiel Masque Deloitte 4:3 pour projection 15
15
SAS. Document Confidentiel Masque Deloitte 4:3 pour projection 15Deleveraging Europe 2019: Focus on France
Legal and
regulatory
New guidelines issued by the EBA legal framework enables loan
in June 2019 require EU banks activity as well as debt recovery
to define an NPL strategy to and asset resolution. The
sustainably reduce NPL levels. mortgage financial guarantee
French banks’ adherence to system, insolvency regimes
these guidelines, as well as the (including the overindebtedness
new Pillar 1 and Pillar 2 guidance scheme), collateral enforcement
backing full NPL provisioning, and amicable or judicial
should incentivise deleveraging. procedures facilitate effective,
At the broadest level, the French albeit lengthy, NPL resolution.
16Deleveraging Europe 2019: Focus on France
Impact of the EBA’s new NPL guidance
The EBA's new guidelines on the management of non- Compliance with these new requirements will prompt
performing and forborne loans came into effect on significant additional costs, further reducing banks'
June 30, 2019 and impacted more than 6,000 banks operational and execution capacity. This is expected
in the European Union. The guidance introduces new to lead to an increase in banks’ refinancing costs, a
requirements for banks to define an NPL strategy and reduction of their profitability and will ultimately weigh
to implement operational structures to sustainably on their regulatory capital needs. The potential impacts
reduce NPLs. In line with these guidelines, European of the EBA’s guidelines are outlined below.
banks will have to design new projects to adapt IT
systems, adjust risk models, review business models,
improve credit management practices and adapt NPL
procedures and tools.
Internal
Data and IT System
organisation
device monitoring
and process
• Based on internal and external operating
environment analyses
NPL strategy
• Defines time-bound reduction targets
• Studies all strategic options to reduce NPLs - + - + - +
• Decision making
NPL governance • NPL operating model
and operations • Internal control framework
- + - + - +
• NPL monitoring and early warning processes
• Prevents borrower delinquency due to
Forbearance deterioration of economic situation
• Extends exposure terms and postpones payments - + - + - +
• Updated EBA NPL definition
• Classification according to forbearance status
NPL recognition
• Implementation of mechanism for days past due
determination - + - + - +
• Defines clear internal guidelines for:
NPL impairment - Irrecoverable loans and write-offs
and write-offs - Adequate valuation of loan portfolios impairments
- Robust risk provisioning methods - + - + - +
• Independent, up-to-date and coherent value
Collateral assessments of collateral associated with NPLs
valuation • Regular back-testing
• Sale of foreclosed assets - + - + - +
17Deleveraging Europe 2019: Focus on France
New supervisory directives on NPL provisioning
The EBA’s new definition of default will come into application by
New definition of default
January 2021 with adjusted criteria that should significantly affect
(Jan-17)
the NPL stock and their expected behaviour
The ECB guidance defines supervisory expectations for NPL
ECB NPL guidance
management. It requires banks with large NPL stocks to develop
(Mar-17)
appropriate strategies to reduce their level.
Pillar 2
Addendum to the The addendum clarifies the ECB’s supervisory expectations for
ECB NPL Guidance prudential provisioning of new NPLs (i.e. loans classified as NPL
(Mar-18) on or after April 1, 2018).
This press release established further steps in the supervisory
ECB press release
approach to reducing NPLs and provides coverage expectations for
(Jul-18)
banks’ NPL stock (i.e. loans classified as NPL before April 1, 2018).
The European Parliament and the Council of 17 April 2019
Official Journal of the EU amends the CRR minimum loss coverage for NPLs and sets out
(Apr-19) the prudential treatment under Pillar 1 for NPLs arising from loans
Pillar 1
originated on or after April 26, 2019.
The most recent communication clarifies previous NPL guidance
ECB communication and provides some adjustments to the ECB’s supervisory
(Aug-19) expectations for new NPLs (under the Pillar 2 Addendum) to allow a
consistent and simple approach to reducing NPLs.
Communication from the ECB on coverage • Pillar 2 as per the ECB press release still applies to
expectations, published in Aug-19, attempted to clarify NPL stock, i.e. loans classified as NPL before April 1,
and simplify previously published NPL guidance. 2018; and
The text (i) addresses the overlap in scope between • Pillar 1 and Pillar 2 Addenda have been harmonised
the addenda of Pillars 1 and 2, (ii) specifies the relevant so that coverage expectations are consistent for loans
coverage expectations for NPLs based on the date of classified as NPLs on or after April 1, 2018.
loan origination and the date of the NPL status and (iii)
provides some adjustments to the Pillar 2 Addendum:
Loans classified as NPL Pillar 2 –
before April 1, 2018 ECB press release
Loans originated Pillar 2
before Addendum – Adjusted
Loans classified April 26, 2019 calibration
as NPL after
April 1, 2018 Loans originated
Pillar 1 –
on or after
Backstop
April 26, 2019
18Deleveraging Europe 2019: Focus on France
Pillar 2, as described in the ECB press release of Jul-18, French banks are generally viewed as having low
applies to loans classified as NPL before April 1, 2018 NPL ratios as they are, overall, below 5%. The initial
p.19
(the NPL stock). It provides three different paths to full
coverage –or 100% provisioning rate– based on the
provisioning rate, to be applied in Dec-20 for banks
with net NPL ratios below 5%, is 60% for secured
specific characteristics of each bank: loans classified as NPL for more than seven years and
• banks with net NPL ratios 5% and 12.5%. provisioning rate is expected every year.
Provision for banks according to NPL ratio
Dec-20 Dec-21 Dec-22 Dec-23 Dec-24 Dec-25 Dec-26
Net NPL ratio 5% and 12.5%
Unsecured NPL 50% 60% 70% 80% 90% 100% 100%
Secured NPL 40% 50% 60% 70% 80% 90% 100%
Source: ECB press release (Jul-18)
© 2019 Deloitte SAS. Document Confidentiel
19Deleveraging Europe 2019: Focus on France
Both the Pillar 1 and Pillar 2 Addenda are applicable to to Pillar 1. Additionally, the coverage expectations
new NPLs: for new NPLs are consistent under both Pillar 1 and
• Pillar 1 applies to NPLs from loans originated on or Pillar 2 Addendum: a 100% provisioning rate for new
after April 26, 2019; and NPLs should be reached by the 3rd, 7th, or 9th years
depending on attached guarantees.
• The Pillar 2 Addendum applies to NPLs from loans
originated on or after April 1, 2018. Simultaneously, the EBA’s new definition of default
p.20
should create “new compartments” of NPLs that
This overlap initially resulted in two different
might enhance both NPL stocks and expectations for
approaches being used for new NPLs classified from
innovative financial solutions.
April 26, 2019 onwards, and has been addressed
in the Aug-19 communication of the ECB. The The impact of these directives could be significant and
communication provides some adjustments so that should create opportunities for NPL disposals.
the Pillar 2 Addendum only applies to NPLs not subject
Provisions on new NPLs by year after default(1)
100% 100% 100% 100% 100% 100% 100%
85%
80% 80%
70%
55%
35% 35…
25%
0%
1+ 2+ 3+ 4+ 5+ 6+ 7+ 8+ 9+
Secured - Real estate collateral Secured - Others Unsecured
Note: (1)On or after April 2018
Source: ECB communication (Aug-19)
© 2019 Deloitte SAS. Document Confidentiel Masque D
20Deleveraging Europe 2019: Focus on France
Potential impact on NPL disposals
Portfolio type Definition Potential impact on NPL transactions
• Unsecured: three years post NPL status • Portfolios are too expensive to maintain
Fully • Secured: nine years post NPL status if on balance sheet despite relatively high
provisioned guaranteed by a real estate collateral, quality of underlying assets (especially
- +
or seven years otherwise for secured loans)
Pillar 1 – Backstop
• Minimum one-year probation period • A default provision rate is applied to
Restructured • Required conditions for reclassification: loans that may no longer be delinquent
(probation - Min. 12 months of regular payments; - + (if sufficient new payments have been
period) - No past due credit obligations; and collected), making them costly to hold
- No signs of unlikeliness to pay
EBA new definition of default
• Default status applies at the customer-level • Borrower level default provision rate
Defaulted (borrower's total exposure) regardless of the applied to loans that may not be
by contagion actual status of each individual loan - + delinquent individually and may still have
good recovery chances
EBA new definition of default
• BDF can require banks to restructure loans • Upon completion of the probation
Overindebted
of overindebted customers period, these loans are reclassified as
customers
• Loans are reclassified as restructured “performing overindebted” and can only
(BDF) - +
and subject to the 12-month probation be acquired by regulated entities
EBA new definition of default
• Minimum 3-month probation period • A default provision rate is applied to
Non-restructured
• Clear assessment of unlikeliness to pay loans that may no longer be delinquent
(probation
triggers must be made before reclassification - + (if new payments have been collected),
period)
to performing making them costly to hold
EBA new definition of default
Recent updates to accounting and regulatory that five years after NPL classification, secured loans
frameworks issued by European regulators have must already be provisioned up to 70%. In France,
created significant opportunities for the French NPL where the judicial process for debt recovery is lengthy,
disposal market. These regulations result in increased applying a high provisioning rate is incompatible with
incentives for NPL holders to deleverage their balance optimistic recovery chances. The increased cost is a
sheets as NPL stocks are becoming more expensive to clear incentive for portfolio disposals.
retain. In particular, the Pillar 1– backstop implies
21Deleveraging Europe 2019: Focus on France
Banque de France overindebtedness plans, a French market
specificity
The Banque de France established a plan for Among the total number of applicants in 2018, there
households that cannot reimburse their loans and were 92,000 were first-time applicants, a 4% decrease
cannot reimburse their loans while paying their current YoY and a level comparable to 1990. Of eligible
expenses. It offers a remediation plan to restructure or applicants, 45% were oriented toward a recovery plan
partially write-off debt. In 2018, 163,000 applications without judicial liquidation, which represents a total
were submitted to BDF under this scheme, of which debt of €1.3 billion. BDF plans can extend expected
91% were considered eligible, either directly by the recovery time significantly as the instruction period
commission or following a district court appeal. The takes up to two years and plans can last up to seven
number of applications submitted decreased by 10% years.
YoY and by 27% compared to 2013.
BDF plan activity by stage (2018)
• Individuals initiate process by submitting a BDF plan
163 000 applications submitted application. Upon application, the individual is registered
to the national payment incident database (FICP)
• BDF examines the application to assess the eligibility of
148 000 eligible applications
a plan
• BDF defines a solution tailored to the applicant's
66 000 standard procedures economic situation (new repayment schedule,
moratorium and/or partial write-off)
• For highly deteriorated financial situations, BDF can
12 000 personal recovery procedures implement a total write-off (FICP registration continues
for five to seven years)
p.22
14 000 procedures terminated • BDF plan is closed (full repayment or total write-off)
Source: Banque de France
The total debt of eligible applicants totaled €6.6 billion Total debt of eligible applicants (Dec-18)
as at Dec-18, of which €3.5 billion relates to eligible
first time applicants. The debt of eligible applicants
Financial debt
is composed mainly of financial debt, of which 42%
is related to mortgage loans with the remainder
divided between personal and revolving loans. Arrears 43%
represented 12% of the total debt and the debt write- 13%
off rate in 2018 was 30%, up 3% from 2017. 75%
23%
12%
25%
9%
Source: Banque de France
22Deleveraging Europe 2019: Focus on France
Simplified BDF plan application cycle
Application submission by debtor
Eligibility assessment of application
by the Commission
Application not eligible Eligible application
Possible recourse to the Assessment by the Commission of the
court of execution most appropriate procedures
Standard procedure No financial solution
(Plan conventionnel ou moratoire) (Procédure de rétablissement personnel “PRP”)
PRP with PRP without
compulsory compulsory
Failure Success
liquidation liquidation
Post-amicable phase Recovery plan
Debtor’s approval Debt write-off
recommended by
Actions imposed: the Commission
• Debt collection
• Debt suspension
• Moratorium
No Yes
Actions recommended:
• Partial write-off Compulsory liquidation Standard
• Balance reduction by court: foreclosure procedure
• Debtor’s obligations and closing of PRP
Source: Banque de France
23Deleveraging Europe 2019: Focus on France
French mortgage market guarantees
Financial guarantees in the mortgage loan market are hypothèques. Most financial guarantee providers,
an alternative to registered mortgages (hypotheque). including Crédit Logement, manage the recovery
In practice, when an individual requests a mortgage process. In the event of default, resolution procedures
loan in France, the lender submits an application for are initiated by the guarantee providers. These could
a financial guarantee from its affiliated subsidiary. If include loan restructuring or loan consolidation. In
the individual is not eligible, the bank will then register case of failure, they proceed to the sale of the assets.
a first ranking mortgage with the Conservateur des
p.24
Of the €203 billion new individual mortgage loans in Mortgage loans by guarantee (2018)
p.24
2018, 51% were secured using financial guarantees.
Crédit Logement is the leading French specialist
8%
in mortgage loan guarantees with €346 billion of
9%
total loans outstanding guaranteed as at Dec-2018, 8%
more than half of outstanding secured by financial 9% Financial guarantee
€203bn
guarantees. In 2018, it guaranteed more than 575,000 51% Mortgage
Financial guarantee
new loans
loans. €203bn Other guarantees
Mortgage
32% new loans 51%
Banks also have their own mortgage loan guarantee
No guarantee
Other guarantees
subsidiaries such as CEGC, part of the BPCE group, 32%
which has 15% market share, and SOCAMI, also a BPCE No guarantee
entity, distributing through Banque Populaire branches
only. Note:
Note:AsAs
a%a of
%loan production
of loan production
Source:
Source: Crédit
Crédit Logement
Logement Observatoire
Observatoire
Other non-banking players are also present in this Note: As a % of loan production
sector, include CNP Caution, a subsidiary of CNP Source: Crédit Logement Observatoire
Assurances, and MNH and MGEN, which are mutual
insurance companies. Their market share is less than Outstanding by financial guarantee (2018)
20% combined.
3%5% Crédit Logement
4%
3%5% CEGC
Crédit Logement
9%4%
SOCAMI
CEGC
9% €656bn
10% outstanding 54% CAMCA
SOCAMI
€656bn
loans
10% outstanding 54% CMH
CAMCA
loans
15% CNP
CMH
15% Others
CNP
Others
Note: As a % of loan outstanding
Source: Xerfi
Note:
Note: AsAs
a%a of
%loan outstanding
of loan outstanding
Source:
Source: Xerfi
Xerfi
© 2019 Deloitte SAS. Document Confidentiel Masqu
© 2019 Deloitte SAS. Document Confidentiel Masqu
24Deleveraging Europe:
Deleveraging Europe 2019: Focus on France
Legal
p.25
This guarantee system allows a credit Crédit Log
risk pooling between banks and financial
guarantee providers. Crédit Logement is
a joint subsidiary of the main French
This guarantee system allows a credit Crédit Logement – shareholding structure
banking groups. (Dec-18)
To benefit from the
risk pooling between banks and financial guarantee scheme, banks have to be 6%
guarantee providers. Crédit Logement is a 3% shareholders of Crédit
BNP Logement and
Paribas
must be committed to increasing the 9%
joint subsidiary of the main French banking 6% CréditFund,
Agricole Group risk
17%Mutual Guarantee a credit
groups. To benefit from the guarantee 9% sharing mechanism.
Société Shareholders
Générale Sha
7% e
scheme, banks have to be shareholders of contribute to the fund (Fonds Mutuel de
BPCE Group
Crédit Logement and must be committed 7% €1.3bn Garantie), a risk pooling tool used by
shareholder Crédit Logement in case
Crédit of unrecoverable
Foncier 9%
to increasing the Mutual Guarantee equity
9% loans. Crédit Mutuel Group
Fund, a credit risk sharing mechanism.
Crédit
32% Logement has a low NPL ratio over
SF2 - La Banque Postale
Shareholders contribute to the fund total exposure of 0.22% in 2018 related
(Fonds Mutuel de Garantie), a risk pooling 17% to the grantedHSBC France (off balance
guarantees
tool used by Crédit Logement in case of sheet). The NPL outstanding on its
Others Source: Com
unrecoverable loans. balance sheet totals €1.4 billion.
Individuals
Crédit Logement has a low NPL ratio over p.25 (2) annual report
Source: Company
Source: Company annual report
total exposure of 0.22% in 2018 related to
the granted guarantees (off balance sheet).
The NPL outstanding on its balance sheet Créd
totals €1.4 billion.
Crédit Logement exposure (1) (€bn)
1
1 1.0
Commitments
Non-performing
300
1 345
Commitments
© 2019 Deloitte SAS. Document Confidentiel 325 Performing
2016
300
Créd
Créd
2016 2017 2018
OnBalance
On Balance
€1.2bn €1.3bn €1.4bn €1.2b
SheetNPLs
Sheet NPLs
Note: (1) Off balance sheet guarantees related to loans guaranteed by Credit Logement Note: (1) Off ba
Credit Logement
Source: Company annual report
Source: Compan
© 2019 Deloitte SAS. Document Confidentiel
25Deleveraging Europe 2019: Focus on France
Standard recovery process for mortgage NPLs
Standard mortgage recovery procedure
Command of seizure
Forfeiture of term
Collateral auction
Summons to oral
Sales proceeds
Formal notice
hearings
received
process
Days past
due 90 180 210 270 350 720
1 2 3 4 5
A B C
Note: Time estimates outline a standard recovery procedure of a mortgage without a financial guarantee
Source: Deloitte estimates
For mortgages, default is usually declared after 90 The recovery process varies for the lender when
days past due, and the recovery procedure is relatively financial guarantees have been granted for residential
straightforward and lender friendly: loans.
When the debtor is not able to meet the payment Once the debt is forfeited by the bank, the
1 A
due date, the term is forfeited (déchéance du financial guarantee (e.g. Crédit Logement) can be
terme). This enables the bank to ask for the activated to cover the unpaid amounts.
immediate full reimbursement of the loan.
If the request is deemed compliant, the financial
B
Following the forfeiture of the term, through the guarantor repays the lender and receives a
2 command of seizure (assignation des débiteurs), subrogation notice (quittance subrogative) that is
debt holders can put in force the requirement for used to take legal action against the debtor.
debtors to pay the amounts due.
The provider of the financial guarantee exercises
Debtors and guarantors are then summoned to a
C its subrogation action (recours subrogatoire)
3 court hearing (convocations pour audience). against the debtor by command of seizure.
The Court usually decides to sell the collateral
4 through an auction process (ordre de mise en
vente).
Proceeds from the sale of the asset pledged are
5 distributed to debt holders (distribution des fonds).
26Deleveraging Europe 2019: Focus on France
Real and non-real estate guarantees that back SME loans
Type of Financial guarantee Company’s
Real estate pledge Personal guarantee
guarantee (BPI, SIAGI etc.) undertaking pledge
What it is? • Real property pledged • Unsecured written • Counter-guarantee • Pledge of the business
to loan by debtor promise from an provided by French (and its assets) to the
• Considered as a real individual, owner Public Investment benefit of the creditor
security (linked directly or management Bank, which offers to protect it against the
to loan) guaranteeing payment funding and guarantees risk of payment default
of loan in the event of to SMEs, Micro- by the debtor
payment default enterprises and self-
• Not tied to a specific employed individuals
asset • Guarantees range from
40% to 70% of loan
amount
How can it be • Property must be • Guarantor must sign • Intended as guarantee • Contract should be
triggered? registered (for a given a written document, for financial institutions signed between debtor
value and duration) for which lender holds as to cover part of the and lender
benefit of the lender security debt in the event of • Eight days after a
• Once default has been • Can be revoked in borrower default unsolved order to pay,
declared, the lender several cases (physical • Will only settle the lender can request
launches property loss of the guarantee, lender’s final loss after to the commercial
foreclosure procedures mandatory information all other securities have court to order the
missing, disproportion been activated public auction of the
between the guarantor company’s assets. This
patrimony and his gives priority to pledge
commitment, etc.) holder in proceeds
disbursement
Requisite • Mortgage registration • Signed promise with • BPI’s signed approval • Registered deed
document complete information deposited at the clerk
(greffe)
Valuation - + - + - + - +
strength and
transparency
• One of the most solid • Value assessment • After collections from • Difficult to assess
types of guarantees more complex as other securities, BPI will recoverability amount
• Property can be valued value impacted by reimburse a portion as value of assets
according to market solvency and holding (40% to 70%) of lender will depend on the
index of guarantor (property, final loss liquidation of company
liquid assets, etc.) holdings
Source: Deloitte analysis
27Deleveraging Europe 2019: Focus on France
Overview of restructuring and insolvency proceedings
for French companies
Simplified restructuring and judicial procedures
In case of financial difficulties, a French company can use amicable out-of-court proceedings or judicial proceedings.
A company can enter into amicable negotiations with creditors prior to insolvency(1):
Ad hoc proceedings (Mandat ad hoc): An out-of-court and confidential proceeding,
1 a solvent debtor facing financial difficulties can request the appointment of an ad hoc
agent, whose role is to facilitate negotiations with creditors.
Amicable
Conciliation: An out-of-court and generally confidential proceeding, available to
proceedings 2 all private entities and individuals acting as merchants, artisans or independent
professionals in commercial or artisanal activities (except farming) facing legal or
financial difficulties and insolvent for less than 45 days. The court appoints a conciliator
to facilitate negotiations with creditors and reach a workout agreement.
Failure of out-of-court proceedings or direct recourse to judicial proceedings
Available to solvent companies, safeguard proceedings can only be petitioned by the debtor
and allow a restructuring under court supervision.
1 Safeguard proceedings (sauvegarde)
• Safeguard
Safeguard plan
• Accelerated financial safeguard
• Accelerated safeguard
Judicial In the case of insolvency (cessation de paiements), two judicial proceedings exist to rehabilitate
proceedings the company or liquidate its assets.
2 Receivership (redressement judiciaire) Receivership plan
• Aim to protect a company’s activity
Disposal of assets
and employment
3 Compulsory liquidation (liquidation judiciaire)
• Liquidation of a company when rehabilitation Liquidation of company assets
is not possible
Note: (1) A French company is insolvent if it is not able to meet its payment obligations with its available assets when payments are due
Source: Deloitte analysis
Average length of legal procedures
Years 2 4 6 8 10 12 14
Safeguard and
Observation period Plans up to 10 years (and up 15 years for farmers)
receivership
Compulsory When business and assets are sold. On average, 4 years
liquidation without assets or 8 years with assets
28Brochure / report title goes here |
Section title goes here
Quality of
information
As the French NPL market These guidelines support an
develops, a key driver for investor effective NPL secondary market
confidence is the quality of through the introduction of
information of NPLs and their enriched reporting, standardised
underlying assets. data templates and centralised
The European Commission's credit registers. The French
(EC) 2017 Action Plan to tackle market has been lagging in
high levels of NPLs provides implementing these measures
a framework for information as notably demonstrated by the
obligations aimed at lenders, debt opacity of NPL transactions.
purchasers and public authorities.
29Deleveraging Europe 2019: Focus on France
An Action Plan aimed at improving information quality across
Europe
The European Commission introduced an Action The most impactful action for enhancing data quality
Plan to tackle NPLs in Europe in Jul-17. It addressed would be the use of a loan reporting template that
various aspects of the NPL market and presented would improve the consistency and comparability of
a comprehensive set of measures to improve the NPL portfolios, increasing potential investors’ trust in
quality of information. Key actions and progress the provided information. The lack of transparency of
on implementation are outlined in the EC’s fourth traded portfolios also puts France at a disadvantage
progress report on the reduction of NPLs in the as it underestimates the depth of the market and
Banking Union. While positive on average, tangible decelerates NPL resolution.
progress in France is not readily apparent.
Key measures from the Action Plan related to information quality
Measures Progress
Create an NPL reporting template to improve loan information provided by banks and facilitate
NPL disposals
Enhance disclosure requirements on asset quality and NPLs
Strengthen NPL data infrastructure, including implementation of potential transaction
platforms and the development of credit registers
Develop an NPL secondary market to support NPL reduction efforts
Issue new guidelines on bank loan origination, monitoring and internal governance
Completed In progress
Note: Progress includes the implementation of the Action Plan in Europe
Source: European Commission (Jun-19)
30Deleveraging Europe 2019: Focus on France
Availability and quality of information on value drivers
Compared to more mature NPL markets, France is it is possible to estimate recoverability potential
still considered a new market. This is noticeable in and forecast possible scenarios. The preparation
terms of availability and homogeneity of information, of NPL reporting using EBA templates would help
whether obtained from lending institutions, public reduce information asymmetries between sellers
or private sources creating high barriers to entry. and acquirers and increase access and quality of
Still, the French market is rich with information on loan information. Improvements in key areas of data
macroeconomic indicators, accurate financial and legal management could further enhance NPL information
information on debtors and credit scoring. Combined quality in France.
with comprehensive data provided by NPL sellers,
Real estate valuation
Credit bureaus
Limited public information on properties and
The absence of credit
valuations. Availability of cadastral information via
bureaus makes it difficult
restricted sources and a multitude of traditional and
to access consumer credit
Fintech firms offering property valuations, including
information. Specialised
automated, desktop and drive-by assessments.
companies provide credit
scoring for individuals
and companies. Extensive
Regulatory action
customer information is
available via private sources,
Supervisory guidance
including solvency reports
providing for comparable
and legal proceedings.
and standardised NPL
Civil investigation
information to meet
companies can find missing NPL investor needs increases
debtors and data on the information awareness of data quality
solvency of a company or quality limitations and and drives
individual.
a remediation exercise
to improve quantity and
quality of information
available.
Benchmarks
Debt servicers have valuable
collections and pricing Digitalisation
information. Limited public
benchmarks, but prior data French banks are investing in digitalisation,
can also be sourced through but availability of electronic credit files varies
business information greatly between lenders. Debt servicers are
companies and consulting also investing in innovation, notably IT and
firms. digital tools, to improve servicing capacity.
31You can also read